8 minute read
Volume tables for E. deglupta

from PNGAF MAG ISSUE # 9B - 5B4D3 Dr John Davidson Accompaniment "RAINBOW EUCALYPT MAN" Part 3 of 8 parts
by rbmccarthy

The mixtures of sound wood with 10% stained wood, 5% soft dark rot and 3% soft light rot respectively had little effect on crude yield or wood consumption whereas 30% of mixed decay types did. This indicated that the typical amount of decay present in a large part of the pulpwood supply would have only a minor effect on the economics of production, at least for the Keravat plantations represented by these sample trees.42The 32 plus trees of the density sub line selected for the propagation population were free of decay.
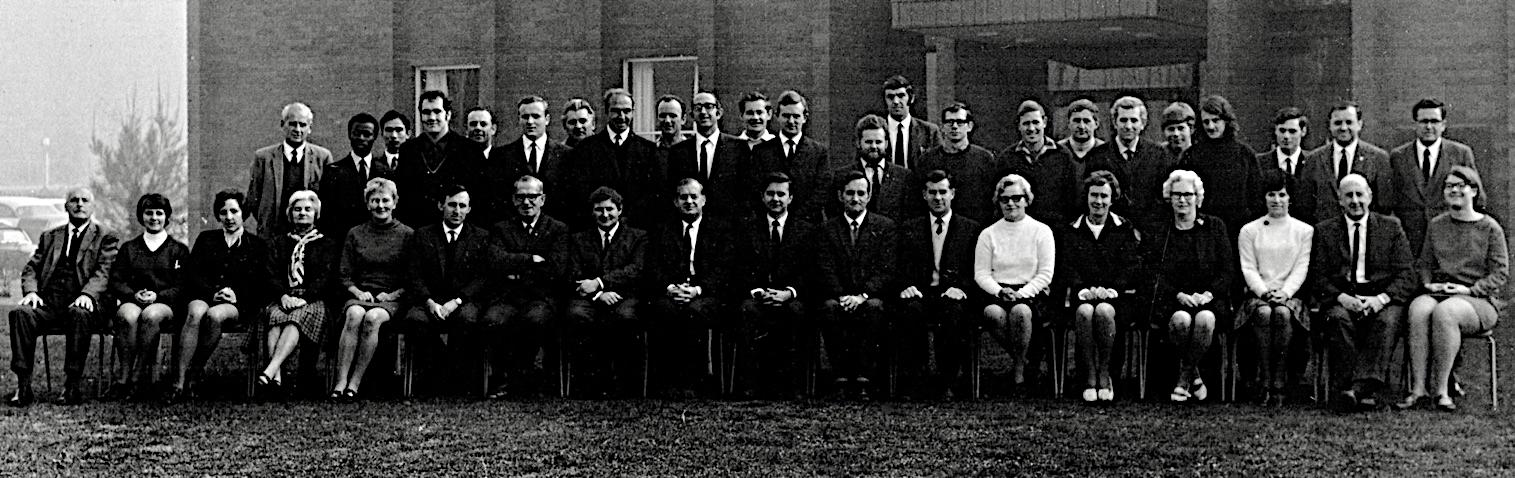
Staff and postgraduate students Department of Forestry ANU in 1970-71. Standing on the far left is Dr Bill Heather my PhD supervisor, I am standing 11th from the left and still working with Mike Slee, standing 8th from the left, as a demonstrator in the fourth year Wood Science and Technology weekly practical class. Standing 9
Advertisement
th from the left is Dave Lamb who later took up a post in research in PNG from 1972 to1977.
Volume tables for E. deglupta
In the letter from the Department of Forests dated 9 September 1968 over the signature of K J White, Chief Division of Silviculture, supporting my application for the PhD Scholarship, it was pointed out that “it is essential that work continues on the volume tables and productivity investigations.” Therefore I had monitored that work from Canberra from 1969 to 1971 and at Keravat during my field visit in late 1970.
In deriving tree volume tables there are two approaches. One is to derive a single general volume table for a species for application to all situations of stand origin, age and size, site factors, and silvicultural and management regimes, while accepting any deviation that may occur from the true volume in any particular situation. A second method is to derive separate volume tables to be applied to the specific situations of site, stand origin and so on, in order to obtain volume regressions of “better fit”. Priority
42 See additional results InDavidson J 1973 Decayed wood in living trees of Eucalyptus deglupta Blume. Presented at a meeting of IUFRO Division 5, Working Party S5.01.9, Cape Town, South Africa 24 – 28 September 1973. (Pages 208 – 224 in the Proceedings.) This paper was also referred to later by Dun D and Fenton R T 1974 Some Aspects of Reforestation in Papua New Guinea – Report on Project Results, Conclusions and Recommendations. UNDP/FAO Project Report FO:PAP/73/007 April 1974, FAO, Rome.
was given to the first approach that was to derive a general volume table for E. deglupta to be applied to stands of trees rather than to individuals.
By this time 200 trees had been felled across several age classes at Keravat. The total height, and overbark and under-bark diameters at 10 cm and 50 cm height above ground, breast height (1.3 m), 2 m above ground then at one-metre intervals along the stem to the tip. Heights from 10 cm above ground (stump height) to each of 5, 10 and 15 cm diameter small end under-bark were also measured. Alan Williams working in the office at Keravat derived the total volume and volumes to each of the small end diameters of all the trees by a graphical method on large sheets of millimeter graph paper using the metric system.
The computing services of the ANU were used on the data. While I was at ANU, data were also sent to Dr Howard Wright, Commonwealth Forestry Institute (CFI), Oxford, UK who provided without charge computer computation, interpretation and compilation of one of the sets of volume tables. Complicating this project was that the ANU worked with the metric system, while the data coming in from PNG were in imperial units from the growth plots and metric from the research section at Keravat. The imperial data had to be converted to metric in Canberra for use at the ANU. However as the CFI was working in imperial units Dr Wright was sent both original imperial data where it already existed plus data from Keravat that were converted from metric to imperial units before dispatch.43As well as the primary variables of volume (V) in cubic feet, diameter at breast height (D) in inches and height (H) in feet, various functions and ratios of these variables such as D2, 1/D, 1/D2, Log (V), DH, D2H, V/D2H, 1/DH, 1/D2H, H/D2, H/D and Log (H) were derived to provide additional variables for testing in form factor and volume regression analyses.
The metric data set was transformed at the ANU using a Fortran program to also create an equivalent imperial data set, which was sent to Oxford. A preliminary volume table for E. deglupta in imperial units was received in Canberra from Oxford in late 1971. This comprised nine sets of tables giving total volume (V) under bark (UB) and merchantable volume UB to 3 inch, 4 inch, 8 inch and 12 inch diameter44 upper limits for diameter at breast height (D) and total height (H) as variables, and the same for diameter and “predominant height” (Hdom).45
43 On 12 June 1970, the Australian Metric Conversion Act passed by the Australian Parliament was given assent. This Act created the Metric Conversion Board to facilitate the conversion of measurements from imperial to metric. PNG followed the same timeline as Australia over the protracted period of introduction of the metric system across various industries. However,the forest and timber industries took several years to be fully metricated. 44 Metric equivalents were 7.6 cm, 10.2 cm, 20.3 cm and 30.5 cm respectively. 45 Predominant height was defined in PNG at the time as the mean height of the tallest 20 trees per acre. A typical half-acre plot was divided into ten parts and the tallest tree in each part was measured. (This was judged equivalent to 50 trees/ha or 10 trees on a 0.2 ha plot.) 136
In Oxford, for total height (H), 15 regression models were tried for best fit to the data using different variables where V, D and H are as described above, a is the regression constant and b, c and d are regression coefficients. The logarithmic functions are to the base e (natural logarithms - ln). 1. V = a + bD 2. V = a + bD + cD2 3. V = a + bD2 4. V = a + bD2H 5. V = a + bD2 + cH + bD2H 6. V = a + bD2 + cDH + bD2H 7. (lnV) = a + b(lnD) 8. (lnV) = a + b(lnD) + c(lnH) 9. V/D2 = a + b/D2 + c/D 10. V/D2 = a + b/D 11. V/D2H = a + b/D2H 12. V/D2H = a + b/D2 + cH/D2 + dH 13. V/D2H = a + b/D2H + cH + d/D2 14. V/D2 = b/D2 + cH/D + dH 15. V/D2H = a + b/D2H + c/H + d/D The regression model of best fit was chosen by reference to various parameters describing the regression including the lowest Furnivall index and highest multiple correlation coefficient. Regression model number 8 from the list above was best. The resulting equation, based on diameter at breast height over bark (D in inches) and total height (H in feet), was: ln V = -6.298 + 1.6458(lnD) + 1.2368(lnH)
For predominant height (Hdom) the best model was the so-called Shield equation weighted by D2Hdom. V = -6.194 + 0.16Hdom + 0.002823D2Hdom – 0.001151Hdom 2 – 0.00000334D2Hdom This equation produces negative volumes for some of the extreme values of D and Hdom because of the very quadratic nature of this regression. However these extreme values were well outside of the range of actual data used and would also be well outside the range of D and Hdom to which the equation would be applied in practice.
The 3-, 4- and 8-inch merchantable volume conversion factors (F) to be applied to reduce total volume to merchantable volume under bark were derived from an exponential function of breast height diameter (D) of the type:
F3,4 or 8 = a + bcD
The values of the regression constant a and regression coefficients b and c to be substituted in the above equation to arrive at each conversion factor were as follows for each of the three smaller merchantable diameter limits:
Merchantable top diameter Constant a 3 inches (7.6 cm) 0.9944
4 inches (10.2 cm) 8 inches (20.3 cm) 0.9923 0.9850 Coefficient b -5.0949 -4.2986 -7.5477 Coefficient c -0.6476 -0.5039 -0.2871
The 12-inch (30.5 cm) diameter factor was derived from a quadratic regression: F12 = -2.1036 + 0.2514D – 0.00529D2 for values of D up to 23.0 inches [58.4 cm]. For diameters greater than 23 inches a constant 0.883 could be used as the conversion factor.
Fortran computer programs were written to generate tables of volumes and conversion factors across a range of D, H and Hdom. A stand table was prepared to show the range of data used and it was pointed out that caution should be observed if extrapolating outside that range. Within the range of D from 4 to 24 inches (10.2 cm to 61 cm) and H or Hdom from 40 feet (12.2 m) to 180 feet (55 m) the percentage errors in the mean predicted volume were likely to be small as indicated in the following table.
D (inches) 4 H (feet) 40 Total Height 1.9% Predominant Height
8 60 - 2.2%
8 80 0.8% -
8 12 12 12 16 100 100 120 140 140 0.8% 1.3% 1.2%
1.3% 1.2%
16 20 20 20 24 170 140 160 180 180 1.3%
1.5% 2.1% 1.4%
2.6% 2.7%
Using the stand volume tables and error estimates given here to determine the volume of individual trees is not appropriate. Values of D, H and Hdom entered in the formulae should be stand mean values derived from measuring a prescribed number of trees in plots to return a stand mean volume result.


