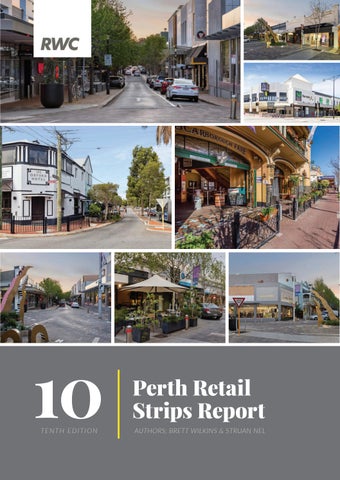
10 TENTH EDITION
Perth Retail Strips Report AUTHORS: BRETT WILKINS & STRUAN NEL
Ten Years Of The Strip
Brett Wilkins Director of Capital Markets 0478 611 168 brett.wilkins@raywhite.com
Struan Nel Capital Transactions Analyst struan.nel@raywhite.com
From a covid-era peak of 12.10% to 3.26%
RAY WHITE
COMMERCIAL WA
WHERE WE SURVEY
Eight strips across Perth Eight strips across Perth WHERE WE SURVEY
N O R A N DA
Perth metro
NOLLAMARA
2026 survey · 8 strips ST I R L I N G
Street section surveyed
DOUBLEVIEW
Vacancy by area, 31 August 2026
%
05 N
2 km
MORLEY
DIANELLA
YO K I N E
Perth CBD
0
I N N A LO O
04
E M B L E TO N
Mount Hawthorn 3.70%
Scarborough Beach Road · p11
BEDFORD
Mount Lawley–Highgate Beaufort Street · p12 2.58%
06
Leederville
0.00%
Oxford Street · p10 L E E D E RV I L L E
M AY L A N D S AS C OT
03
Subiaco
4.99%
Rokeby Road · p9
JOLIMONT
NORTHBRIDGE
DAG L I S H
PERTH CBD
KingsPark
01
B U R S WO O D R I V E RVA L E
Claremont 3.43%
L AT H L A I N
Bay View Terrace · p7 C R AW L E Y
CA R L I S L E
NEDLANDS
SOUTHPERTH K E N S I N GTO N
02
Cottesloe
DA L K E I T H
0.00%
Napoleon Street · p8
07 S wa n R i ve r
Victoria Park–East Victoria Park Albany Highway · p13 3.43% MANNING
APPLECROSS
WAT E R F O R D
INDIANOCEAN
M O S M A N PA R K
WILSON B I C TO N
SA LT E R P O I N T
AT TA DA L E
ARDROSS F E R N DA L E
SHELLEY NORTHFREMANTLE
A L F R E D C OV E
R I V E R TO N
E AST F R E M A N T L E B O O R AG O O N
M E LV I L L E
M YA R E E
PA L M Y R A
R O S S M OY N E
B R E N T WO O D PA R K WO O D
W I L L AG E E
WINTHROP
W I L L E T TO N B AT E M A N
W H I T E G U M VA L L E YO ' C O N N O R K A R D I N YA
08
Fremantle
7.38%
B E AC O N S F I E L D
H I LTO N
MURDOCH
SA M S O N
LEEMING
South Terrace · p14 COOLBELLUP
NORTHLAKE
CA N N I N G VA L E
H A M I LTO N H I L L
NORTHCOOGEE BIBRALAKE JA N DA KOT
S P E A R WO O D SOUTHLAKE
Map data © OpenStreetMap contributors
Numbers match the strip pages. Bold lines follow the street section surveyed, set from the first and last street numbers on each 2026 survey sheet; the Albany Highway strip covers two blocks. Vacancy is by floor area as at 31 August 2026. Map data © OpenStreetMap contributors.
Perth Retail Strips Report · 10th Edition · 2026
04
RAY WHITE
COMMERCIAL WA
HEADLINE FINDINGS
HEADLINE FINDINGS
Four highlights from 2026 survey Four highlights from thethe 2026 survey
3.26%
01
7 of 8
Lowest vacancy in ten years
Most strips improved
Across the eight strips 3,181 sqm of 97,694 sqm was
Seven of the eight strips recorded lower vacancy
vacant on survey day. That is the lowest result in the
than in 2025. Only Mount Hawthorn rose, from
ten-year series and less than a third of the 12.10% recorded at the Covid-era peak in 2020. The original
0.83% to 3.70%. Across the eight strips vacancy fell from 5.76% to 3.26%. Cottesloe and Leederville had
five strips, on their own, are at 2.77%, also their
no vacant shops.
02
lowest.
7.38%
03
30.4%
Fremantle is still the highest
Food leads the mix
South Terrace’s vacancy fell from 20.10% to 7.38%, but it is still about 2.3 times the eight-strip result. It
Cafés and restaurants are the largest use, at 30.4% of all surveyed floor area, ahead of services
holds 10.8% of all vacant floor space (345 sqm) on
(22.5%). The survey marked 99 tenancies as new
4.8% of surveyed NLA. A further 885 sqm across
traders and 7 vacancies as filled.
04
two tenancies is being developed and is not counted as vacant.
All figures by floor area unless stated. The 2025 comparison covers the same eight strips: 695 shops and 95,336 sqm, using the 2025 survey sheet for seven strips and the 2025 raw-data workbook for Albany Highway (both blocks). In Fremantle, 885 sqm being developed in 2026 is not counted as vacant. By shop count, 34 of 715 shops were vacant (4.76%).
Perth Retail Strips Report · 10th Edition · 2026
05
RAY WHITE
COMMERCIAL WA
OVERVIEW AND SCORECARD
Ranked by vacancy, lowest first THE EIGHT STRIPS · OVERVIEW AND SCORECARD
Ranked by vacancy, lowest first RANK
STRIP
1=
Cottesloe
1=
Leederville
3
Mount Lawley–Highgate
4=
Claremont
4=
Victoria Park–East Victoria Park
6
Mount Hawthorn
7
Subiaco
8
Fremantle
Napoleon Street
Oxford Street
Beaufort Street
Bay View Terrace
Albany Highway
Scarborough Beach Road
Rokeby Road
South Terrace
All eight strips
VACANT
VACANCY
SHOPS
NLA (SQM)
40
5,261
0
0.00%
1.90%
−1.90 pts
45
7,766
0
0.00%
5.95%
−5.95 pts
128
20,019
517
2.58%
3.75%
−1.17 pts
46
9,276
318
3.43%
3.73%
−0.30 pts
230
25,537
875
3.43%
6.51%
−3.08 pts
75
10,076
373
3.70%
0.83%
+2.87 pts
112
15,087
753
4.99%
8.78%
−3.79 pts
39
4,672
345
7.38%
20.10%
−12.72 pts
715
97,694
3,181
3.26%
5.76%
−2.50 pts
(SQM)
RETAIL MIX, ALL EIGHT STRIPS, SHARE OF NLA
VACANCY 2026
CHANGE
2025
AT A GLANCE
Cafés & restaurants
30.4%
Services
22.5%
715
97,694
Clothing & soft goods
9.6%
SHOPS SURVEYED
SQM OF NLA
Pubs, taverns & bars
9.3%
Other personal & household
9.3%
Specialised food
5.6%
3,181
34
Recreational goods
3.5%
SQM VACANT
VACANT SHOPS
Vacant
3.3%
Furniture & housewares
2.5%
99
7
Land / being developed
2.0%
MARKED AS NEW TRADERS
VACANCIES FILLED
Supermarket & grocery
1.8%
Not classified
0.3%
By shop count, 4.76% of shops were vacant. Cafés and restaurants are the largest use on three of the eight strips.
Perth Retail Strips Report · 10th Edition · 2026
06
RAY WHITE
COMMERCIAL WA
STRIP PROFILES
CLAREMONT Claremont 01 Bayview Bay View TerraceTerrace
3.43% 0%
46
9,276
318
SHOPS
NLA (SQM)
VACANT (SQM)
4 of 46
3.73%
−0.30 pts
VACANT SHOPS
VACANCY 2025
CHANGE
30% of floor area vacant, 31 August 2026
RETAIL MIX 2026, SHARE OF NLA
VACANCY BY AREA SINCE 2017
Clothing & soft goods
33.4%
Services
27.8%
Pubs, taverns & bars
18.5%
Cafés & restaurants
6.4%
Other personal & household
4.9%
Recreational goods
3.6%
Vacant
3.4%
Furniture & housewares
1.0%
Specialised food
1.0%
20%
15%
10%
5%
3.43%
0% ’17
’18
’19
’20
’21
’22
’23
’24
’25
’26
2017 and 2018 from the figures published in those years; 2019 onwards from the survey sheets.
Vacancy eased to 3.43% of floor area (318 sqm across four shops), from 3.73% in 2025.
SURVEY CHANGES 2026
Clothing and soft goods is still the largest use at 33.4% of floor area, followed by services (27.8%) and pubs, taverns and bars (18.5%).
4
Four new traders were recorded, including Youth Lab and Mauricio Fashion. All four vacant shops are changes since the 2025 survey.
0
Perth Retail Strips Report · 10th Edition · 2026
tenancies marked as new traders vacancies filled
07
RAY WHITE
COMMERCIAL WA
STRIP PROFILES
COTTESLOE Cottesloe Napoleon Street Napoleon Street
02
0.00% 0%
40
5,261
0
SHOPS
NLA (SQM)
VACANT (SQM)
0 of 40
1.90%
−1.90 pts
VACANT SHOPS
VACANCY 2025
CHANGE
30% of floor area vacant, 31 August 2026
RETAIL MIX 2026, SHARE OF NLA
VACANCY BY AREA SINCE 2017
Clothing & soft goods
35.0%
Cafés & restaurants
23.4%
Other personal & household
19.4%
Services
11.9%
Furniture & housewares
6.3%
Recreational goods
4.1%
20%
15%
10%
5%
0.00% 0.00% 0% ’17
’18
’19
’20
’21
’22
’23
’24
’25
’26
2017 and 2018 from the figures published in those years; 2019 onwards from the survey sheets.
No vacant shops were recorded on survey day. In 2025 one shop of 100 sqm was empty (1.90%).
SURVEY CHANGES 2026
The strip has 40 shops and 5,261 sqm of NLA.
4
Clothing and soft goods leads the mix at 35.0% of floor area, ahead of cafés and restaurants (23.4%) and other personal and household goods (19.4%). Four new traders were recorded, including Collins Books and Moore Contemporary.
0 0
Perth Retail Strips Report · 10th Edition · 2026
tenancies marked as new traders vacant shops marked as changed since last survey vacancies filled
08
RAY WHITE
COMMERCIAL WA
STRIP PROFILES
SUBIACO Subiaco 03 Rokeby Rokeby Road Road
4.99% 0%
112
15,087
753
SHOPS
NLA (SQM)
VACANT (SQM)
9 of 112
8.78%
−3.79 pts
VACANT SHOPS
VACANCY 2025
CHANGE
30% of floor area vacant, 31 August 2026
RETAIL MIX 2026, SHARE OF NLA
VACANCY BY AREA SINCE 2017
Other personal & household
22.8%
Cafés & restaurants
20.0%
Services
17.1%
Clothing & soft goods
14.4%
Specialised food
6.3%
Furniture & housewares
6.2%
Pubs, taverns & bars
5.2%
Vacant
5.0%
Recreational goods
2.5%
Supermarket & grocery
0.5%
20%
15%
10%
5%
4.99% 0% ’17
’18
’19
’20
’21
’22
’23
’24
’25
’26
2017 and 2018 from the figures published in those years; 2019 onwards from the survey sheets.
Vacancy fell to 4.99% from 8.78% in 2025. SURVEY CHANGES 2026
Nine shops were vacant, the same number as 2025, but the empty floor area fell from 1,291 sqm to 753 sqm. The largest vacancy is 160 sqm. Other personal and household goods is the largest use (22.8%), followed by cafés and restaurants (20.0%) and services (17.1%). Twelve tenancies were marked as new traders, including Keep on Running, Dimario Shoes and K’s Dumpling House. One vacancy was filled (Cavannia Gifts).
Perth Retail Strips Report · 10th Edition · 2026
12 9 1
tenancies marked as new traders vacant shops marked as changed since last survey vacancies filled
09
COMMERCIAL WA
RAY WHITE
STRIP PROFILES
LEEDERVILLE Leederville Oxford Street Street Oxford
04
0.00% 0%
45
7,766
0
SHOPS
NLA (SQM)
VACANT (SQM)
0 of 45
5.95%
−5.95 pts
VACANT SHOPS
VACANCY 2025
CHANGE
30% of floor area vacant, 31 August 2026
RETAIL MIX 2026, SHARE OF NLA
VACANCY BY AREA SINCE 2017
Cafés & restaurants
46.6%
Specialised food
16.1%
Services
8.4%
Other personal & household
7.0%
Pubs, taverns & bars
5.9%
Clothing & soft goods
5.2%
Land / development site
3.9%
Furniture & housewares
3.5%
Recreational goods
2.6%
Supermarket & grocery
1.0%
20%
15%
10%
5%
0.00% 0.00% 0% ’17
’18
’19
’20
’21
’22
’23
’24
’25
’26
2017 and 2018 from the figures published in those years; 2019 onwards from the survey sheets.
No vacant shops were recorded on survey day. In 2025 three shops (443 sqm, 5.95%) were empty.
SURVEY CHANGES 2026
The survey recorded 45 shops and 7,766 sqm of NLA, including a 300 sqm land parcel.
11
Oxford Street is the most food-led of the original strips: cafés and restaurants take 46.6% of floor area and specialised food a further 16.1%.
0
Eleven new traders were recorded, including Trek Bicycles, Phat Lon, Dear Cecil and Subway.
Perth Retail Strips Report · 10th Edition · 2026
0
tenancies marked as new traders vacant shops marked as changed since last survey vacancies filled
10
COMMERCIAL WA
RAY WHITE
STRIP PROFILES
Mount Hawthorn MOUNT HAWTHORN Scarborough Beach Road Beach Road Scarborough
05
3.70 % 0%
75
10,076
373
SHOPS
NLA (SQM)
VACANT (SQM)
3 of 75
0.83%
+2.87 pts
VACANT SHOPS
VACANCY 2025
CHANGE
30% of floor area vacant, 31 August 2026
RETAIL MIX 2026, SHARE OF NLA
VACANCY BY AREA SINCE 2017
Services
33.0%
Cafés & restaurants
24.0%
Pubs, taverns & bars
10.9%
Clothing & soft goods
8.5%
Other personal & household
7.4%
Recreational goods
5.6%
Vacant
3.7%
Land / development site
3.0%
Supermarket & grocery
2.3%
Furniture & housewares
1.0%
Specialised food
0.7%
20%
15%
10%
3.70%
5%
0% ’17
’18
’19
’20
’21
’22
’23
’24
’25
Strip added to the survey in 2023.
Vacancy rose to 3.70% (373 sqm across three shops) from 0.83% (one shop, 83 sqm) in 2025. That is above the eight-strip result of 3.26%.
SURVEY CHANGES 2026
The strip has 75 shops, unchanged, and 10,076 sqm of NLA. A 300 sqm vacant land parcel is shown as land, not as a vacant shop.
13
Services is the largest use at 33.0% of floor area, followed by cafés and restaurants (24.0%) and pubs, taverns and bars (10.9%).
3
Thirteen new traders were recorded, including The Cabin, Gin Gin and Snap Fitness. One vacancy was filled.
Perth Retail Strips Report · 10th Edition · 2026
’26
1
tenancies marked as new traders vacant shops marked as changed since last survey vacancies filled
11
RAY WHITE
COMMERCIAL WA
STRIP PROFILES
Mount MOUNTLawley–Highgate LAWLEY
06
Beaufort Street Beaufort Street
2.58% 0%
128
20,019
517
SHOPS
NLA (SQM)
VACANT (SQM)
3 of 128
3.75%
−1.17 pts
VACANT SHOPS
VACANCY 2025
CHANGE
30% of floor area vacant, 31 August 2026
RETAIL MIX 2026, SHARE OF NLA
VACANCY BY AREA SINCE 2017
Cafés & restaurants
29.2%
Services
22.0%
Pubs, taverns & bars
14.7%
Specialised food
7.2%
Other personal & household
6.1%
Supermarket & grocery
5.1%
Clothing & soft goods
4.4%
Recreational goods
4.2%
Vacant
2.6%
Land / development site
2.4%
20%
15%
10%
5%
2.58%
0% ’17
’18
’19
’20
’21
’22
’23
’24
’25
Furniture & housewares
1.1%
2017 and 2018 from the figures published in those years; 2019 onwards
Not classified
0.9%
from the survey sheets.
Vacancy eased to 2.58% (517 sqm across three shops) from 3.75% (747 sqm, five shops) in 2025.
SURVEY CHANGES 2026
Beaufort Street has 128 shops and 20,019 sqm of NLA, the second-largest strip after Albany Highway.
26
Cafés and restaurants lead the mix at 29.2% of floor area, followed by services (22.0%) and pubs, taverns and bars (14.7%).
0
26 tenancies were marked as new traders, the most of any strip, including Ischia on Beaufort, Meninas Grill and Beaufort Street Books. Two vacancies were filled.
Perth Retail Strips Report · 10th Edition · 2026
2
’26
tenancies marked as new traders vacant shops marked as changed since last survey vacancies filled
12
RAY WHITE
COMMERCIAL WA
STRIP PROFILES
Victoria Park–East Victoria Park EAST/VICTORIA PARK Albany Highway Albany Highway
07
Victoria Park
East Victoria Park
3.43% 0%
230
25,537
875
SHOPS
NLA (SQM)
VACANT (SQM)
9 of 230
6.51%
−3.08 pts
VACANT SHOPS
VACANCY 2025
CHANGE
30% of floor area vacant, 31 August 2026
RETAIL MIX 2026, SHARE OF NLA
VACANCY BY AREA SINCE 2017
Cafés & restaurants
47.7%
Services
26.8%
Specialised food
5.3%
Pubs, taverns & bars
5.1%
Other personal & household
4.8%
Vacant
3.4%
Recreational goods
2.9%
Furniture & housewares
1.9%
Supermarket & grocery
1.1%
Clothing & soft goods
0.6%
Not classified
0.3%
20%
15%
10%
5%
3.43%
0% ’17
’18
’19
’20
’21
’22
’23
’24
’25
’26
Strip added in 2023. 2023–2024 from the combined Albany Highway sheet; 2025 from the 2025 raw-data workbook. All years cover both blocks.
Vacancy fell to 3.43% (875 sqm across nine shops) from 6.51% (1,593 sqm, eight shops) in 2025. Albany Highway is the largest strip in the survey, with 230 shops and 25,537 sqm of NLA. It covers two blocks: Victoria Park (108 shops, 11,772 sqm, 2.97% vacant) and East Victoria Park (122 shops, 13,765 sqm, 3.81% vacant). Cafés and restaurants take 47.7% of floor area, the largest share of any strip, followed by services (26.8%). 23 tenancies were marked as new traders, including Gemini Café, Mais Little Deli, Molly’s Irish Pub and Iron Age Korean. Two vacancies were filled (Over The Moon Desserts and Dora Lashes).
Perth Retail Strips Report · 10th Edition · 2026
SURVEY CHANGES 2026
23 6 2
tenancies marked as new traders vacant shops marked as changed since last survey vacancies filled
13
RAY WHITE
COMMERCIAL WA
STRIP PROFILES
Fremantle FREMANTLE South TerraceTerrace South
08
7.38% 0%
39
4,672
345
SHOPS
NLA (SQM)
VACANT (SQM)
6 of 39
20.10%
−12.72 pts
VACANT SHOPS
VACANCY 2025
CHANGE
30% of floor area vacant, 31 August 2026
RETAIL MIX 2026, SHARE OF NLA
VACANCY BY AREA SINCE 2017
Services
20.4%
Being developed / land
18.9%
Cafés & restaurants
18.2%
Pubs, taverns & bars
17.1%
Other personal & household
9.1%
Vacant
7.4%
Specialised food
5.9%
Recreational goods
2.1%
Supermarket & grocery
0.7%
30%
20%
10%
7.38% 0% ’17
’18
’19
’20
’21
’22
’23
’24
’25
’26
Strip added in 2023. In 2026 two tenancies (885 sqm) are being developed; they stay in NLA and are not counted as vacant.
Vacancy fell to 7.38% (345 sqm across six shops) from 20.10% (900 sqm, seven shops) in 2025.
SURVEY CHANGES 2026
Two tenancies totalling 885 sqm are being developed and are not counted as vacant. The largest vacant shop is now 112 sqm.
6
The survey recorded 39 shops, up from 35, with NLA of 4,672 sqm. Services is the largest use (20.4%), followed by cafés and restaurants (18.2%) and pubs, taverns and bars (17.1%). South Terrace still has the highest vacancy of the eight strips. Six new traders were recorded, including Black Swan Tattoo Studio and Slo Method Pilates. One vacancy was filled (Mons O’Shea).
Perth Retail Strips Report · 10th Edition · 2026
4 1
tenancies marked as new traders vacant shops marked as changed since last survey vacancies filled
14
RAY WHITE
COMMERCIAL WA
ABOUT THIS REPORT
ABOUT THIS REPORT
Methodology and Important Notice Survey basis
Data collection
Manual, street-level survey of eight retail strips across Perth metro by Ray White Commercial WA as at 31 August 2026; each strip inspected on foot to verify trading status,
All data hand collected and compiled by RWC WA; not independently audited or verified against title, lease or council records.
identify new traders, record new vacancies and note tenancies re-let since the previous survey.
Net lettable area
Vacancy measure
NLA figures indicative only, not warranted as accurate; measured area used where available, otherwise tenancy
By area, NLA of vacant tenancies as % of total surveyed NLA; earlier editions restated on this basis; Albany
areas estimated; variances should be expected.
Highway reported as one strip, covering Victoria Park and East Victoria Park; tenancies under development are recorded as being developed / land, stay in NLA and are not counted as vacant.
Limitations
Important notice
A tenancy is vacant if unoccupied and not trading at inspection; conditions may have changed since the survey date; sample of strips/tenancies may differ from earlier editions.
General information only; not advice, a price estimate or recommendation; not to be relied on for any investment, leasing or financial decision; readers should make own enquiries and obtain independent advice; to the maximum extent permitted by law RWC WA, its officers and employees accept no liability for loss from use of or reliance on this report.
© Ray White Commercial WA 2026.
Perth Retail Strips Report · 10th Edition · 2026
15
RWC WA Level 7, 30 The Esplanade, Perth, WA 6000 08 6253 5222 raywhitecommercialwa.com