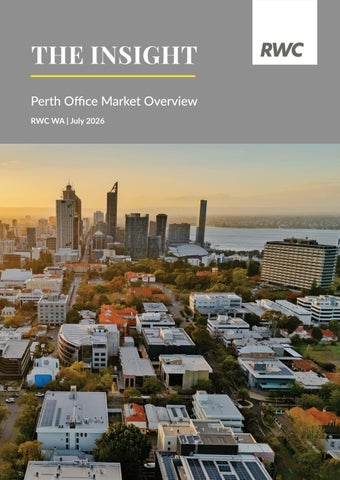
THE INSIGHT Perth Office Market Overview RWC WA | July 2026
Introduction The Perth office market has continued to improve through the six months to July 2026, with leasing demand strengthening across both the CBD and West Perth. Perth CBD recorded 27,528sqm of net absorption, ranking second nationally behind Brisbane CBD (38,785sqm) and ahead of both Melbourne CBD (26,779sqm) and Sydney CBD (18,715sqm). West Perth added a further 5,238sqm, the strongest result of any non-CBD market in the country, lifting combined Perth demand to 32,766sqm. Perth CBD total vacancy sits at 15.4%, with affordability playing a larger role in tenant decision making than in previous cycles. B-grade vacancy has fallen to 19.2%, its lowest level since January 2015, while D-grade sits at just 3.9%. Premium vacancy has eased to 10.2% and A-grade to 16.3%, as new space delivered in recent years continues to be leased. West Perth vacancy remains well below the non-CBD average of 18.5%, with all four grades now sitting within one percentage point of each other. CBD face rents have increased for eight consecutive six-monthly periods, with prime averaging $665/sqm and secondary $565/sqm. Growth has slowed to less than 1% over the past year, however, with incentives ranging up to 45% in the CBD and 50% in West Perth. Secondary rents have outpaced prime since 2021, rising 16.0% compared with 14.1%. Investment activity has lifted from historically low levels, with sales reaching $182.1 million to September 2026, already above the full-year totals for 2024 ($179.4 million) and 2025 ($66.0 million). West Perth has accounted for almost half of this year’s volume. Despite the improvement, transactions remain 81% below the 2019 peak of $975 million. Prime CBD yields average 7.45%, still well above the 6.25% low of 2021. Total returns for Perth CBD have lifted to 4.9%, behind Brisbane, Sydney and Melbourne as the east coast rebounds off a lower base. However, Perth delivered the most stable returns of the major CBDs through the downturn, falling no lower than -0.8%.
Perth CBD Office Market VACANCY Premium
10.2%
Net supply = 0sqm
A
Grade
16.3%
Net absorption = 27,528sqm
B
Grade
19.2%
Future supply completions (mooted)
C
Grade
15.0%
D
Grade
3.9%
Total vacancy
15.1%
Refurbishment 30,000sqm New Stock 78,000sqm
Average incentives range up to 45%
Sub-lease 0.6%
NET FACE RENTS
INVESTMENT YIELD
Prime
$665/m2
Prime
7.45%
Secondary
$565/m2
Secondary
8.10%
Source: Property Council of Australia, Ray White Commercial. All this data is six months to July 2026
Australian CBD office markets Where has the office demand been? Six monthly, net absorption (sqm)
Source: Ray White * Property Council of Australia OMR July 2026
Perth CBD recorded 27,528sqm of net absorption over the six months to July 2026, ranking second nationally behind Brisbane CBD (38,785sqm) and ahead of both Melbourne CBD (26,779sqm) and Sydney CBD (18,715sqm). West Perth added a further 5,238sqm, the strongest result of any non-CBD market, lifting combined Perth demand to 32,766sqm. The national picture has shifted since our last review: •
Brisbane CBD and Melbourne CBD have both moved firmly into positive territory, after recording -12,646sqm and -44,962sqm respectively.
•
Sydney CBD remains positive, although well below the 46,234sqm previously reported.
•
Adelaide CBD has reversed, falling from 22,606sqm to -9,224sqm.
•
Canberra posted the weakest result nationally at -72,602sqm, while Macquarie Park (-19,185sqm) and Southbank (-18,445sqm) also recorded significant tenant losses.
Only half of the 18 markets tracked returned positive absorption, with suburban and fringe locations accounting for most of the losses. Perth’s ability to hold its position while the larger CBDs recover highlights the consistency of local tenant demand across both the CBD and West Perth. Perth CBD and West Perth together absorbed 32,766sqm, with West Perth the strongest non-CBD market in the country.
Perth CBD shows greatest stability in returns Total office returns
Chart: Ray White • Source: MSCI
Total returns Perth CBD has delivered the most stable total returns of the major CBD markets through the latest cycle. During the downturn, Perth’s annual returns bottomed at just -0.8% in September 2023 and turned positive again by December 2023. This compares with troughs of -11.3% in Melbourne CBD, -10.1% in Sydney CBD and -2.8% in Brisbane CBD.
East coast catches up The recovery has since broadened, with the larger markets rebounding sharply off a much lower base. As at June 2026, annual total returns were: • • • •
Brisbane CBD: 10.8% Sydney CBD: 8.0% Melbourne CBD: 5.9% Perth CBD: 4.9%
While Perth now sits behind the east coast, its momentum is building. Returns have lifted from 0.6% in June 2025 to 4.9% in June 2026, and the 1.6 percentage point gain over the June quarter was the strongest of the four markets. Brisbane, by comparison, eased slightly over the quarter after peaking at 11.3% in March 2026. Perth CBD’s total returns fell no lower than -0.8% during the downturn, compared with -11.3% in Melbourne CBD and -10.1% in Sydney CBD.
Affordability factored into accommodation decision making Total vacany by quality grade (%)
Chart: Ray White • Source: Property Council of Australia - January 2025 OMR
Affordability is playing a greater role in tenant decision making, with secondary stock absorbing more demand than in previous cycles. The long-running flight to quality has eased, and the gap between premium and B-grade vacancy has narrowed to 9.0 percentage points, down from 15.2 points in July 2023 and well below the 24.8 point gap recorded in January 2018.
Prime grades Premium vacancy has risen to 10.2%, up from 6.3% three years ago, although this has eased from a peak of 12.5% in July 2024 as new space has been progressively leased. A-grade vacancy has also improved, falling from 18.9% to 16.3% over the past six months.
Secondary grades B-grade vacancy, while still the highest of any grade, has fallen to 19.2%, its lowest level since January 2015. C-grade has held steady at around 15%, down from 17.0% in July 2023. D-grade vacancy sits at just 3.9%, a sharp contrast to the 57.6% recorded in mid-2014, as this smaller pool of low-cost space continues to attract budget-conscious occupiers. B-grade vacancy has fallen to 19.2%, the lowest level since January 2015.
Perth CBD Office Take up in postitive territory across Perth CBD Six monthly net absorption (sqm)
Chart: Ray White •Source: Property Council of Australia - January 2025 OMR
Perth CBD recorded 27,528sqm of net absorption over the six months to July 2026, the strongest result since January 2022 and the second consecutive positive period following 11,028sqm in January 2026. Over the past 12 months, take-up totalled 38,556sqm, the highest annual result since July 2022. This marks a clear turnaround from the 2023/24 period, when the market lost 46,468sqm across two consecutive negative readings. Looking at the past two years, absorption has been positive in three of the four six-monthly periods: • • • •
January 2025: 25,186sqm July 2025: -4,599sqm January 2026: 11,028sqm July 2026: 27,528sqm
Combined, this adds up to 59,143sqm of net absorption, more than recovering the space handed back during 2023/24. While well short of the record 121,202sqm recorded in July 2012 during the resources boom, the current results are more consistent with the steady demand seen through 2017 to 2020. As shown in the previous section, much of this activity has been spread across the grades, with secondary stock playing a larger role than in past recoveries. Perth CBD absorbed 59,143sqm over the past two years, more than recovering the 46,468sqm lost in 2023/24.
Perth CBD Office Face rents continue to move upwards inprovements in improving effective rates $/sqm net
Source: Ray White Commercial
Perth CBD face rents have now increased for eight consecutive six-monthly periods. As at June 2026, prime net face rents averaged $665/sqm and secondary $565/sqm, up 14.1% and 16.0% respectively from their December 2020 to December 2021 low. Secondary rents have outpaced prime over this period, consistent with the stronger demand for lower cost space shown in the vacancy data. The gap between the two has held steady at $100/sqm since mid-2023, after peaking at $107/sqm in December 2022. The pace of growth has slowed considerably. Over the 12 months to June 2026, prime rents rose 0.8% and secondary 0.9%, compared with annual gains of 3.3% and 4.0% in the year to June 2024. With vacancy in the prime grades still elevated, owners have been more inclined to hold face rents and adjust incentives to secure tenants. Rents also remain well below their previous highs. Prime sits 18.4% under the June 2012 peak of $815/sqm, while secondary is 24.9% below its peak of $752/sqm, highlighting the relative affordability of Perth CBD accommodation compared with the last major cycle. Secondary face rents have risen 16.0% since 2021, outpacing prime growth of 14.1%.
Limited office transactions as owners hold Annual turnoever by location
Source: Real Capital Analytics, Ray White
Office transactions across Perth remain limited, although 2026 is shaping up as an improvement on recent years. To 30 September, sales totalled $182.1 million, already above the full-year results for both 2024 ($179.4 million) and 2025 ($66.0 million). The 2025 figure was the lowest annual volume recorded since at least 2014. Perth CBD sales reached $97.4 million, around four times the 2025 total, while West Perth recorded $84.6 million, its highest level since 2022. West Perth has accounted for almost half of all office sales this year, reflecting the smaller lot sizes and greater depth of private buyers in this market. Despite the lift, volumes remain 81% below the 2019 peak of $975 million, with many owners continuing to hold rather than sell.
A counter-cyclical window The gap between leasing and investment markets continues to widen. Net absorption has reached 38,556sqm over the past 12 months, face rents are rising and annual total returns have improved to 4.9%. With transaction activity still well below historical levels, this presents an opportunity for counter-cyclical investors to secure assets ahead of a broader recovery in sales volumes. Perth office sales reached $182.1 million to September 2026, already exceeding the full-year totals for 2024 and 2025.
Is Perth office moving out of trough phase? Average yields by quality grade/location (%)
With limited sales evidence, yields have been difficult to benchmark, although the results that have been recorded point to modest firming over the past two years. Perth CBD prime yields have moved from a peak of 7.57% in mid-2024 to an average of 7.25% as at June 2026, a 32 basis point firming. Secondary and West Perth yields have shown less movement: • • •
Perth CBD secondary: 8.00%, down from 8.20% West Perth prime: 8.10%, down from 8.25% West Perth secondary: 9.00%, down from 9.05%
All grades remain well above the lows of 2019 to 2021, when Perth CBD prime yields averaged 6.25% and secondary 7.25%.
Rates likely to slow further firming The four interest rate increases delivered this year are likely to limit any further compression in the near term. Higher borrowing costs narrow the spread between office yields and the cost of debt, which may keep some buyers on the sidelines and see owners hold pricing rather than test the market. However, with yields already sitting 75 to 100 basis points above previous lows, the Perth market is entering this period from a more realistic pricing base than in past cycles. Perth CBD prime yields have firmed 32 basis points since mid-2024 but remain 100 basis points above their 2021 low.
West Perth office market
WEST PERTH VACANCY
A
Grade
11.0%
B
Grade
12.8%
C
Grade
11.9%
D
Grade
11.9%
Total vacancy
12.1%
Sub-lease vacancy 0.4%
Net absorption 5,238m² | Net supply 0m² “Annual take best in the country for non-CBD markets”
NET FACE RENTS Prime
$350/m2
Secondary
$260/m2
Source: Property Council of Australia, Ray White Commercial. Six months to July 2026
Average Incentives range up to 50%
West Perth Office West Perth one of the better non - CBD markets Total vacancy
Source: Property Council of Australia
West Perth recorded a total vacancy rate of 11.7% as at July 2026, largely unchanged from 11.8% in January 2025 and well below the Australian non-CBD average of 18.5%. This places West Perth sixth lowest of the 16 non-CBD markets tracked by the Property Council. The markets recording lower vacancy are predominantly smaller fringe and coastal locations, led by the Sunshine Coast (3.4%) and Gold Coast (6.9%), followed by Adelaide Fringe (8.9%), East Melbourne (10.0%) and Brisbane Fringe (11.0%). West Perth sits ahead of the regional NSW markets of Wollongong (13.2%) and Newcastle (14.2%) and is well clear of Sydney’s major non-CBD markets, where vacancy ranges from 19.4% in Chatswood to 27.7% in Crows Nest/St Leonards. St Kilda Road has the highest vacancy nationally at 31.8%. While vacancy across non-CBD markets has risen from 17.2% to 18.5% since January 2025, West Perth has held steady, supported by 5,238sqm of net absorption over the past six months, the strongest result of any non-CBD market. Its proximity to the CBD, parking availability and lower rents continue to appeal to occupiers seeking a more affordable alternative. West Perth vacancy sits at 11.7%, 6.8 percentage points below the non-CBD average of 18.5%.
Mixed results across West Perth Total vacancy by quality grade (%)
Chart: Ray White • Source: Property Council of Australia - July 2026 OMR
West Perth vacancy fell to 12.1% in July 2026, down from 13.4% six months earlier, with improvement recorded across the A, B and C grades. Total vacancy has now held within a narrow band of 11.5% to 13.4% over the past two and a half years. The most notable feature of the latest data is how closely the grades have converged. All four now sit between 11.9% and 12.8%, a spread of just 0.9 percentage points and the narrowest since the series began in 2009. This compares with a gap of more than 10 percentage points between A and B grade in January 2024. A-grade has seen the greatest movement over the cycle. Vacancy rose from a low of 5.0% in January 2024 to 14.1% in January 2026 as tenants relocated and new space was added, before easing to 12.8% in the latest period. B-grade has also improved to 12.8%, while C-grade fell to 11.9% and D-grade held steady at 11.9%. These results remain well below the peak of 22.1% recorded through 2020 and 2021, when A-grade vacancy reached 24.2%. All four West Perth grades now sit within 0.9 percentage points of each other, the narrowest spread since 2009.
Positive results for West Perth Six monthly results (sqm)
Chart: Ray White • Source: Property Council of Australia - July 2026 OMR
West Perth recorded 5,238sqm of net absorption over the six months to July 2026, the strongest result since July 2023 and a clear turnaround from the two previous periods. The market lost a combined 8,971sqm across July 2025 and January 2026, with tenant departures partly offset by the withdrawal of 2,632sqm of stock. Limited new supply: No new space has been added to West Perth over the past 18 months, with stock levels instead reduced through withdrawals. This continues a long-running pattern of minimal development, with net supply additions since mid-2021 totalling just 3,220sqm. The largest of these was 4,402sqm in January 2024. Demand well ahead of supply: Over the same five-year period, West Perth has absorbed 42,018sqm of space, more than 13 times the volume of net supply added. The strongest results came through 2021 to 2023, including 11,499sqm in July 2022 and 10,239sqm in January 2023. With little in the development pipeline, West Perth remains largely a refurbishment market, where upgrades to existing buildings and periodic withdrawals have helped keep vacancy contained compared with other nonCBD locations. Since mid-2021, West Perth has absorbed 42,018sqm of office space against just 3,220sqm of net new supply.
Outlook Perth enters the second half of 2026 with steady tenant demand and improving leasing conditions across both the CBD and West Perth. Positive absorption of 38,556sqm over the past 12 months in the CBD, the strongest annual result since July 2022, has more than recovered the space lost during 2023/24, while West Perth has returned to positive territory after two weaker periods. The key change in this cycle has been the role of affordability. Rather than the strong flight to quality seen in previous years, tenants are weighing cost alongside quality, supporting demand for B, C and D-grade space. This has narrowed the gap between premium and B-grade vacancy to 9.0 percentage points, down from 24.8 points in 2018. We expect this pattern to continue while businesses remain cautious about occupancy costs. Supply will be the main factor to watch. Around 78,000sqm of new stock and 30,000sqm of refurbished space has been mooted for Perth CBD. With no new supply added over the past six months, these completions are likely to place upward pressure on prime vacancy, and secondary owners may face renewed competition as incentives on new space are used to secure pre-commitments. In West Perth, the limited development pipeline should continue to keep vacancy contained, with the market relying on refurbishment of existing buildings. Face rents are expected to remain steady in the near term, with owners more likely to adjust incentives than headline rents while vacancy remains elevated. With prime rents still 18.4% below their 2012 peak, there is scope for further growth once new supply is absorbed. The four interest rate increases delivered this year are likely to limit any further yield compression and keep some buyers on the sidelines. However, the gap between leasing performance and investment activity continues to widen. With absorption positive, rents rising, total returns improving and transaction volumes still well below historical levels, Perth continues to offer opportunities for counter-cyclical investors willing to move ahead of a broader recovery in sales activity.
Contact our specialists
Luke Pavlos Director | Commercial Services 0408 823 823 luke.pavlos@raywhite.com
Stephen Harrison Joint Managing Director 0421 622 777 stephen.harrison@raywhite.com
Brett Wilkins Director of Capital Markets 0478 611 168 brett.wilkins@raywhite.com
Andrew Woodley-Page Capital Markets 0438 939 869 andrew.woodley-page@raywhite.com
RWC WA Level 7, 30 The Esplanade, Perth WA 6000 raywhitecommercialwa.com