FINANCE REVIEW THE NETWORK



Welcome to the second edition of The Network Finance Review. A report collated by our specialist team of finance professionals, who for more than a decade have operated within the engine room of Ray White businesses. Through analysing the numbers, challenging assumptions, and partnering with leaders, they ensure the best financial decisions are being made for their business to convert ambition into peak performance.
This report brings together financial benchmarks for the period up to December 2025 and realworld case studies to provide insight on where value is being created. The data is unequivocal: across every office, state, and market cycle, one truth remains constant ‘Profit is built, not found’. The most successful businesses in our network are consistently building profit by doing things fundamentally differently.
Here are five insights we will explore through real numbers, real stories and real change.
1. Profitability in sales continues to grow despite commission rates coming under pressure
Rising prices and increased volumes across Australia and New Zealand have masked
commission compression over the past few years, but that doesn't mean it isn't costing you.
2. BDMs are becoming a necessity for churn rather than just a lever for growth
The data shows record high losses in property management at 20% turnover each year. To replenish these losses business owners are recognising the increased importance of investing in BDM roles.
Despite the turnover, rent rolls continue to grow. Organic growth rather than acquisitions are the biggest driver, again highlighting the critical role BDMs play in creating long term capital value.
3. Compliance changes - are you prepared?
Anti-money laundering (AML) reforms and Payday Super, both effective from 1 July 2026 will mean changes to current business processes. Use the checklists provided in the articles on pages (30 and 33) to ensure you are well prepared and not caught out.
4. Desk costs don’t kill profit — a lack of scale does
A decade of data shows a simple pattern: when revenue grows, desk cost percentage falls. Every time. The businesses with the strongest margins aren’t spending less, they’re spending better and building the revenue to support it.
5. Succession is now a profit strategy, not a retirement plan
The data and the case studies are clear: businesses with planned succession outperform those without it. Mature leadership structure, clear pathways and internal successors drive stability, protect culture, and preserve margin, long before an exit.
With the ongoing Middle East conflict, interest rate rises and other cost of living pressures, market conditions are no longer doing the heavy lifting. This will present strategic challenges moving forward. Businesses relying on market tailwinds will find profitability harder to sustain whilst those which actively manage productivity, cost discipline and business structure will continue to outperform.
When considering how profitable your business is, you need to ask yourself what are the main profit drivers? Being able to control these levers dictates how profitable your business will be.
Over the past three years we have seen strong performances in sales throughout each of our market places in terms of volume, price and ultimately profit. Whilst this is the overall general trend, fluctuations in underlying market variables have occurred from region to region as well as between residential and commercial sales. Some markets have experienced fluctuations in volume between financial half year periods whilst others have been buoyed by consistent growth. Price growth has been experienced across Australian residential and commercial markets, whilst in New Zealand average prices have remained stagnant. One consistent variable across all markets however is declining average commission rates. This must be addressed if profit margins are to be maintained in a softening market.

AVERAGE SELLING PRICE ($'000)
When reviewing the Australian data by state, Victoria I Tasmania has led the way with respect to transaction volume growth, with a massive 43% increase between the first half of the ‘26 FY compared to the same in ‘23. The growth has been consistent and sustained, with volumes up 13% in 2025 compared to 2024 and up 17% in the first half of ‘26 FY compared with the second half of ‘25 FY. Price growth meanwhile has been weaker in comparison to other markets, recording just 5% growth in the last three years, all of which has come in the last 12 months.
The New South Wales I Australian Capital Territory markets have followed a similar trend buoyed by strong volume growth, up 35% in the first half of ‘26 FY versus ‘23, the second highest growth by state behind Victoria I Tasmania. Price growth has been more modest, recording a 12% increase over a three year period when comparing results from the recent half of this ‘26 FY. Most of this growth was front ended with prices stabilising over the most recent 12 month period.
South Australia I Northern Territory has seen strong growth in both prices and volumes. Average prices have grown 38% and volumes are up 33% when comparing performance in the first half of '26 FY versus ‘23 FY. Average prices surpassed the $800k mark for the first time in the first half of ‘26 FY, up 14% on same period last year and a reflection of the ongoing demand from population growth in the region. However, momentum appears to have stalled in volume growth, up a modest 3% on the same period last year.
Of all states, price growth has been strongest in Western Australia where prices rose 49% over the past three years. This has fuelled significant growth in the market, with average GCI up 77%. Tight supply continues to produce above average price increases, up 7% in the recent half of this ‘26 FY compared to the previous 6 month period, but volume growth has halted across the same period.
The next best state in terms of price growth over the three year period is Queensland, where average prices have risen 39%. The market is currently experiencing a longer and stronger tail compared to other states with price growth of 15% in the last 12 months, albeit volumes have remained stubbornly flat.
In contrast to Australian markets, New Zealand average property prices have remained flat over the past three years and whilst commission rates have started to decline marginally, they remain above 2.5%, the highest across all residential markets. Total GCI is up 33% when comparing the first half of the ‘26 FY compared to the same in ‘23, largely owing to 29% volume growth over the same period.
Looking at the Commercial landscape, RWC has experienced tremendous growth over the last three years with GCI up 80% in the first half of '26 FY versus '23 FY. This is a culmination of a 21% increase in transactions and a 12% increase in prices. The price growth bodes well for investors but the question is, can this momentum continue? Based on data for the first half of the 26’ FY compared to the second half of ‘25 FY, the transaction volume
is still there, as is price growth but there is early indication of sentiment changing in light of recent global events.
Average commission rates on property sales have declined to varying degrees across Australian, New Zealand and Commercial markets, with increased competition for listings, the rise of discounting models and more price-sensitive vendors contributing to the downward pressure.
While rates have declined, price growth has largely nullified any impact, with average GCI per transaction continuing to increase in most markets. New Zealand offers a forward signal, where flat pricing has exposed this pressure, with commission per sale now stabilising rather than growing. The implication is clear, fee compression is not confined to weaker markets. It's a structural shift which is simply masked in periods of price growth and revealed when conditions normalise.
Maintaining fee integrity will be critical. Offices who can consistently justify and hold their commission rates are better positioned to protect profitability as market conditions change.

ZAC SNELLING GROUP HEAD OF PROPERTY MANAGEMENT, RAY WHITE GROUP
Across the network, the 2025 benchmarking brings into focus a number of trends that many businesses will recognise, but not always see clearly in their own numbers. Management fee pressure continues to show up across all markets, with a clear spread between states. In New South Wales | Australian Capital Territory and Victoria | Tasmania, average fees are sitting around 5.6%, compared to closer to 7.9% in Western Australia and 8.4% in New Zealand. That gap reflects local market expectations, but also highlights the impact fee settings have on the overall performance of a business. As fees tighten, growth alone becomes less meaningful if income per management isn't keeping pace with the cost to deliver our service.
The data also highlights the reality of attrition in property management, with around 20% of portfolios turning over each year across both Australia and New Zealand. A meaningful portion of time and effort is spent simply maintaining position, and without a deliberate focus on growth, portfolios will naturally drift backwards over time. That raises a simple but important question for every business owner: who in your business is responsible for growth, and how are they being supported and held accountable?
There is also a visible signal for our network around operating efficiency when we look at the relatively static average PUM per PM numbers over the past four years. Despite the continued evolution of technology and systems available to support property management, portfolio sizes per team member have remained relatively stable. This suggests a clear opportunity for many businesses to better translate these tools into day-to-day efficiency, helping to drive profitability in the right direction while maintaining the level of service our customers expect.
These trends highlight challenges, but more importantly, they point to very real areas of focus across the network. Across 2026, several initiatives are being rolled out to strengthen growth and performance and help businesses capture more of what is available in their market. Your property management team is here to work alongside offices to unpack their numbers and turn these insights into clear, practical plans for the year ahead.

*Number of rent rolls included in each portfolio size range is based on business count.
Property Management businesses across Australia continued to grow in 2025, with rent roll sizes up 7% on average to 561 properties under management, despite organic losses now running at 20%. In effect, this means the average PM business needs to bring on 9 new managements per month to simply maintain their position, a growing trend that principals are recognising with almost two thirds of offices now employing a BDM.
The combined impact of national rental shortages driving rents higher, and increased scale have supported margin expansion which now averages 23%, the highest it's been in the past decade. The influence of these factors has outweighed the persistent squeeze on management fees being experienced in the market, which currently
Over in New Zealand, property management businesses have largely been treading water this year, with organic gains at levels only sufficient enough to offset portfolio losses, limiting overall growth. Keeping in line with historical norms, approximately one in five properties were lost from rent rolls during the year.
Properties being sold off the rent roll continue to represent a significant opportunity to better leverage the synergies between our property management and sales teams.
Despite constrained growth, rent rolls continue to deliver consistently strong margins averaging 24%, while capital asset values continue to rise. Together, these factors reinforce the importance and long-term value of a rent roll within a business.
Despite market and other related challenges, the Western Australian network recorded the highest average organic growth rate of 19%. The majority of this was driven in the metro markets with a number of offices having a clear direction and executing on their plan for growth. Strong collection of ancillary fees, which on average runs at 17% of management fees, has seen strong revenue per property received.
In Victoria I Tasmania, which has the highest average number of properties under management at 755 and the second highest average PUM per PM staff with 96, the high loss rate (23%) from several market challenges saw negligible organic growth (+1.4%) in
PUM. High people and VPA costs (averaging 64%) sees profit margins at 16%, running between 8-10% below the other states.
Even with the lowest average management fees of 4.7%, rent rolls in metro NSW | ACT still managed to produce strong profit margins at 26% through effective cost management and efficiency, with the largest portfolio size per PM staff of all regions at 101 PUM per PM team member. Rent rolls across the state saw marginal organic growth of 3.6%, adding an additional 20 properties which sees the average rent roll sit at 584 properties.
Healthy organic growth was seen in rent rolls across South Australia | Northern Territory, averaging 8.7%. A number of metro businesses were in aggressive growth mode and saw high average organic growth rates of 15%. This scale combined with efficiencies resulted in very strong average profit margins of 32%, the highest average across any market or state.
Queensland rent rolls saw the highest average profit margins at 26%, with metro and regional areas performing equally well. Rent rolls in the state also grew by 10% on average, through a combination of organic growth and higher buyer activity than any other state. Regional offices in particular were active in acquiring competitor rent
rolls, capitalising on strong performances in sales and property management over the past few years to scale their PM businesses, grow their asset base and build recurring cashflow.
Commercial businesses on average saw organic net gains in their portfolios of 7% with the healthy growth resulting in an additional net 25 assets, taking the average portfolio size to 367. Good profit margins of 21% were maintained from a revenue per asset of $2,736.
The foundation of sustained success in the competitive real estate industry, particularly within property management, often lies less in short term tactics and more in the long term cultivation of a robust and positive internal culture. At Ray White North Lakes Property Management, this principle is not just a saying, it is the core operational philosophy that drives exceptional service, high staff retention and crucially, significant portfolio growth.
Brittany Krebs brings years of comprehensive experience in Property Management. Her journey with Ray White North Lakes began in March 2021, joining the business as a Portfolio Property Manager under the mentorship of Darren Suhle, after starting her career at a different brand.
Within a year, Britt was promoted to Head of PM, managing 1,000 properties. In November 2022 following an acquisition, she successfully led the integration of a major competitor's rent roll.
Following this growth, Britt transitioned to a Corporate role as the Queensland PM Network Specialist, gaining insight into other businesses, leveraging her expertise in rent roll transactions due diligence and solidifying her belief in culture as a core driver for growth.
Now, Britt's career has come full circle as she has rejoined Darren Suhle at Ray White North Lakes. With a portfolio well exceeding 2,000 PUMs, the business boasts one of the largest rent rolls in the Ray White Network and is positioned for its next phase of expansion.
Britt recently shared her insights on the most effective growth strategies for Property Management leaders, the influence Ailo has had on the North Lakes business and some tips when undergoing due diligence on acquisitions.
Top tips for growing your rent roll and driving profitability:
1. Build culture.
A strong culture is not an abstract concept. It directly impacts the bottom line and is the single greatest catalyst for business growth. When employees feel valued, they stay longer.
a. Lead from the front as principal and develop a deep understanding of your staff;
b. Empower your team with a growth mindset;
c. Consider changes to your office layout to ensure collaboration between sales and PM departments;
d. Develop training programmes and clear pathways to progression;
e. Consistency is key- hold regular staff meetings and provide continuous education, including inviting guest speakers (e.g. a trades person) to increase knowledge and upskill;
f. Set up project teams to support staff buy in when implementing new systems or processes
2. Property retention is key.
The principal and Head of PM should hold client relationships, not PMs. Ensure every owner has your contact details and communicate any changes in your management team to them directly yourself. This will help ensure that when an owner has an issue that isn’t being resolved to their satisfaction by the team, they escalate to you instead of thinking of another agency.
The reality is that business owners can sometimes be more focused on the sales side of their business, or allow for individual team members to have the strongest relationship with their own portfolio of investors. Time and time again, we see the impact of this kind of culture, where a staff member may leave, only to then see a significant number of investors follow them where they go next, or where investor dissatisfaction increases with each new change of property manager.
3. Enhanced client and tenant relationships translates to tangible growth. Conduct regular customer value calls yourself and build KPIs around it.
4. Continually audit your rent roll to ensure compliance and documentation is up to date.
The influence of Ailo in running a systematic and efficient PM department?
1. Ailo delivers efficiencies with embedded workflows and automates processes that used to be manual tasks e.g. rent arrears. This enables our PM teams to manage larger portfolios if necessary but more importantly, enables them to engage with landlords more frequently and enhance our service offering.
2. From a landlord's perspective, Ailo provides more transparency and quicker access to funds. They can change bank account details and control where and when funds are dispersed. Previously, owners had to email or phone their PM and ask for funds to be dispersed, now they can manage their own wallet.
3. Invoicing - owners receive notification when a new invoice has been uploaded into the system. They can go in and choose whether to pay from rental funds, bank account or credit card if they want to earn points. Previously owners had to request invoices be sent to their email if wanting to pay from any source outside of rental funds. All payments are automatically reconciled to their EOFY statements.
4. EOFY statements are automatically issued.
Top tips when undergoing due diligence:
1. When acquiring a rent roll complete due diligence on site where possible, and ensure the existing staff attached to it are the right fit for your business, both culturally and operationally. If there are indications of sub-standard practice i.e. incorrect Form 6s, missing entry condition reports, lease agreements not executed correctly, don’t be afraid to recruit externally. It is easier to bring on new staff than change habits ingrained in employees who would be likely to leave anyway further down the track because of poor performance.
2. When selling a rent roll, consider incentivising the individual or team managing the transition process with landlords over to the new owners. Retention periods typically last for 90 days, and each lost management during retention typically costs your business $5,000$7,500. Why not mitigate this risk by offering a bonus linked to minimising value loss?
Each of the Ray White Property Management specialists that sit in each state are ready and willing to assist in your journey through growth and profitability.

While growing a property management portfolio is often a priority for businesses, increased size doesn't always lead to greater profitability. To address this, an initiative has been launched in Victoria to evaluate and enhance the financial health of rent rolls. This involves introducing a standardised financial metric called the "water level" to measure and improve profitability.
This initiative was undertaken collaboratively between Network Finance and the Victoria | Tasmania Head of Property Management, with the objective of addressing several critical questions:
• How can profitability be accurately measured at a per-property level?
• How can underperforming assets be identified and addressed?
• What strategies can be implemented to improve property management profitability?
The “water level” represents the break-even cost required to manage a property. It’s calculated by comparing the revenue generated by each property under management (PUM) against the cost of managing that property. The resulting figure serves as a baseline threshold as properties generating revenue below this level are considered loss-making.
Ray White Werribee, a Chairman’s Elite Top 2 business in Victoria, manages approximately 1,600 properties. Despite its scale, profitability concerns within the property management department prompted a detailed review using the water level framework.
The review identified approximately 600 properties (36 per cent of the portfolio) as sitting below the water level. In practical terms, these properties were operating at a loss, meaning the office was effectively losing money by retaining them. The total financial impact was estimated at approximately $658,000 in annual lost management fee revenue.
Several strategies were proposed to address this underperformance including:
• Increasing management fees to better align with the true cost of service delivery. This is the most critical lever, as it also has a direct impact on the valuation of the rent roll
• Ensuring all relevant costs are recovered from landlords, including administration and technology related expenses
• Reviewing portfolio composition, including the potential divestment of unprofitable properties and assessing the property management team structure for operational inefficiencies
The property management industry is currently facing widespread pressure on management fees, with Victoria being the most affected state in Australia. This trend risks creating a "market for lemons," where investors, often uneducated about the true cost of service, wrongly expect unsustainable, and frequently loss making rates.
Without clear insight into daily portfolio metrics, many franchisees are effectively paying to retain business. Although the asset value persists, not realised until sale, these low fee expectation investors often introduce broader problems for the business, including compliance issues and challenges with staff retention and recruitment.
The systematic review allowed Ray White Werribee to pinpoint properties needing immediate management fee adjustments, a task previously challenging due to the rent roll's sheer size and intricacy. The office has begun contacting landlords, as some fees had remained static for five to ten years. This strategic move is expected to enhance both property and portfolio profitability, leading to an uplift in cash flow and, consequently, an improvement in the capital value of the rent roll, though the full financial benefits will take time to fully materialise.
Given the success of this initiative, the review has since been rolled out more broadly across the network, commencing with the top 10 Victorian offices. The objective is to standardise profitability analysis and ensure that every property under management contributes positively to overall business performance.

The Australian Federal Budget, announced Tuesday 12 May 2026, has confirmed a major shift in housing tax policy across the nation.
Negative gearing is to be limited to new builds from 1 July 2027, and changes to the Capital Gains Tax (CGT) discount were announced, both designed to reduce the tax advantage of investing in established property.
The intent: reduce investor competition for existing homes, and redirect capital into new housing.
Set out below is an explanation of the key budget changes, when they will take effect and a summary of their implications for investors, owner-occupiers and renters alike.
To bring context to the proposed changes and to understand the scale of their reach, according to ATO data across Australia:
2.9M Households are renters (31% of all households)
83% Rent from private landlords
48% are negatively geared
Reforming negative gearing for residential properties
Negative gearing occurs when your investment property costs more to own than it makes in rent meaning you incur a loss. Under the current rules, a taxpayer can claim the loss as a deduction on their yearly tax bill, reducing their tax taxable income. While making a loss might seem counterintuitive, investors are willing to accept short-term losses in the expectation that the property’s value will increase over time, as well as decreasing their tax liability. If the negative gearing deduction takes them to a lower tax bracket, that could completely offset any loss.
What will change?
• Properties purchased before 7:30PM AEST on 12 May 2026 are fully grandfathered - negative gearing continues unchanged for as long as you continue to hold the property
• Properties purchased after 7:30PM AEST on 12 May 2026 are subject to the new rules, but normal negative gearing applies until 30 June 2027
• From 1 July 2027, losses on established properties can no longer be deducted against salary or other income - they can only be offset against rental income. Where multiple properties are owned the losses can be offset against other rental income or future capital gains from residential property. Any excess losses can be carried forward to future years
Investors who currently own negatively geared residential properties may be less inclined to sell their residential properties given they will continue to enjoy the tax benefits.
What changes apply to new builds?
Eligible ‘new build’ residential properties remain exempt from these changes. For these properties both negative gearing and the capital gains discount of 50 per cent will still be available.
The reforms will introduce a layer of complexity for property investors by creating a dual system with rules varying depending on the property type and purchase date.
What qualifies as a new build?
New builds are residential properties which genuinely add to supply. This will include:
- Dwellings constructed on vacant land; or - Where existing properties are demolished and replaced with a greater number of dwellings.
Knock-down rebuilds or substantial renovations, which do not increase supply, will not be considered ‘new builds’ and aren’t eligible.
Importantly, a new build cannot have been previously sold, unless first owned by the builder and not occupied for more than 12 months. Subsequent purchasers of the dwelling will not be able to access the 50 per cent CGT discount or negative gearing concessions on that property.
The government announced it will replace the current 50% capital gains tax discount (CGT) with an inflationadjusted indexation for properties held for more than 12 months, effective from 1 July 2027. Indexation will be calculated using Consumer Price Index (CPI) in a similar manner to arrangements previously in place between 1985-1999. This means only the real gain above inflation is taxed.
The change will apply to most CGT assets (including property) held by individuals, trusts and partnerships, including pre-1985 CGT assets. Further, a minimum 30% tax rate will apply to net capital gains under the revised indexation method.
Owner-occupiers will continue to be fully exempt from paying CGT provided they meet the requirements for the property to qualify for the Principal Place of Residence (PPR) exemption.
For those already in the market**...
50% discount retained on gains arising before 1 July 2027. Inflation indexation on gains arising after. People can choose for that amount to be calculated based on either a valuation of the asset as at July 1, 2027, or using a formula that apportions tax owed by the time held under each tax scheme.
Can choose either the 50% discount or indexation at time of sale, whichever produces the lower tax bill.
Inflation-indexed, with a 30% minimum tax on net capital gains.
Implications
Incentives to hold: Selling means losing grandfathered negative gearing.
New builds are only "new" once.
Investors will face a narrower resale market, which softens prices they're willing to pay.
**Being in the market includes individuals with properties contract for sale but not settled before 7:30pm 12 May 26
The budget’s reforms have been framed as a housing measure but lost amongst these are the implications for commercial property investors which are significant.
Negative gearing changes are residential property specific and therefore investors can still fully deduct losses on commercial assets against other income.
The CGT changes on the other-hand apply to all CGT assets and as a result commercial properties are caught up in these reforms. No ‘new build’ carve out has been proposed for commercial property. Another budget measure likely to impact commercial property investors
is the introduction from 1 July 2027 of a 30% minimum tax on discretionary trusts which is a common holding structure for investment in commercial properties.
The changes are significant for renters given some 31 per cent of all households are renting and 48 per cent of landlords are negatively geared.
Rental supply of established properties is likely to contract over time as these changes deter fresh investor demand for established properties. On average, rents for new properties are higher than established properties. Coupling this is the risk stock won't be available in areas
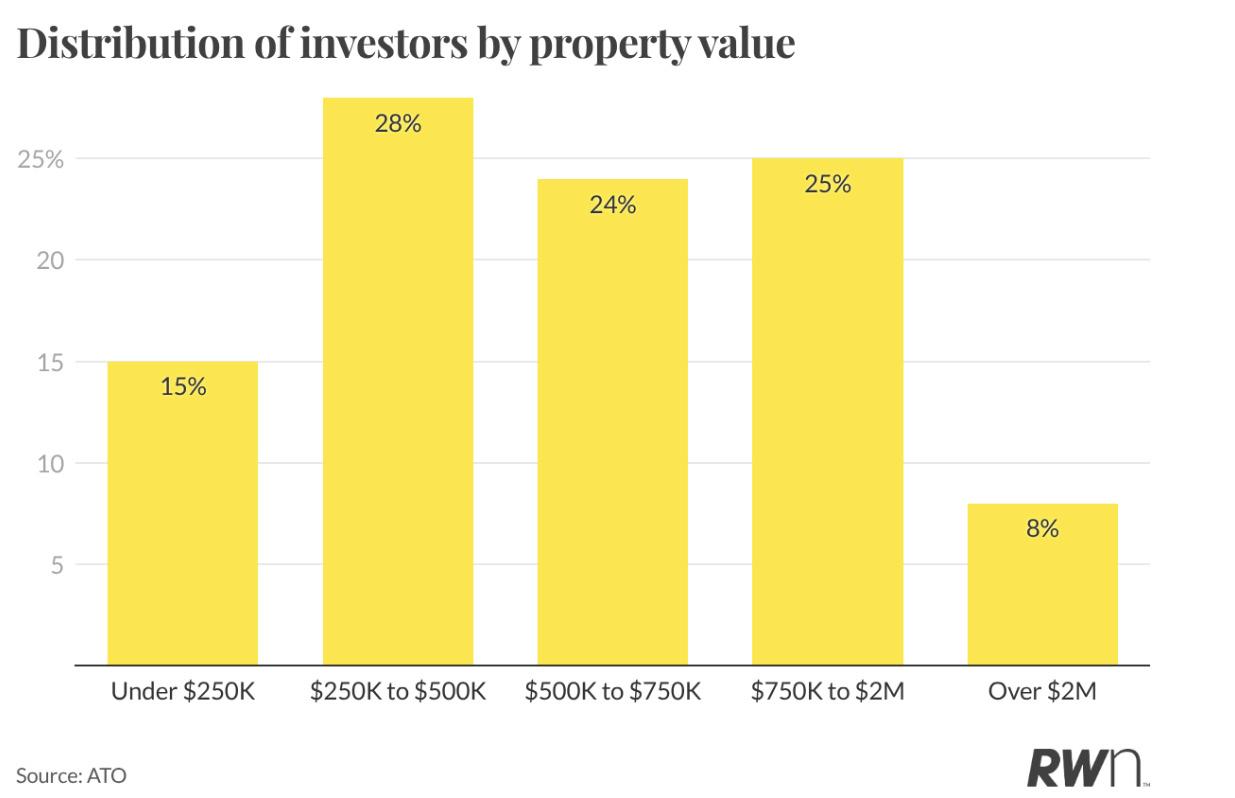
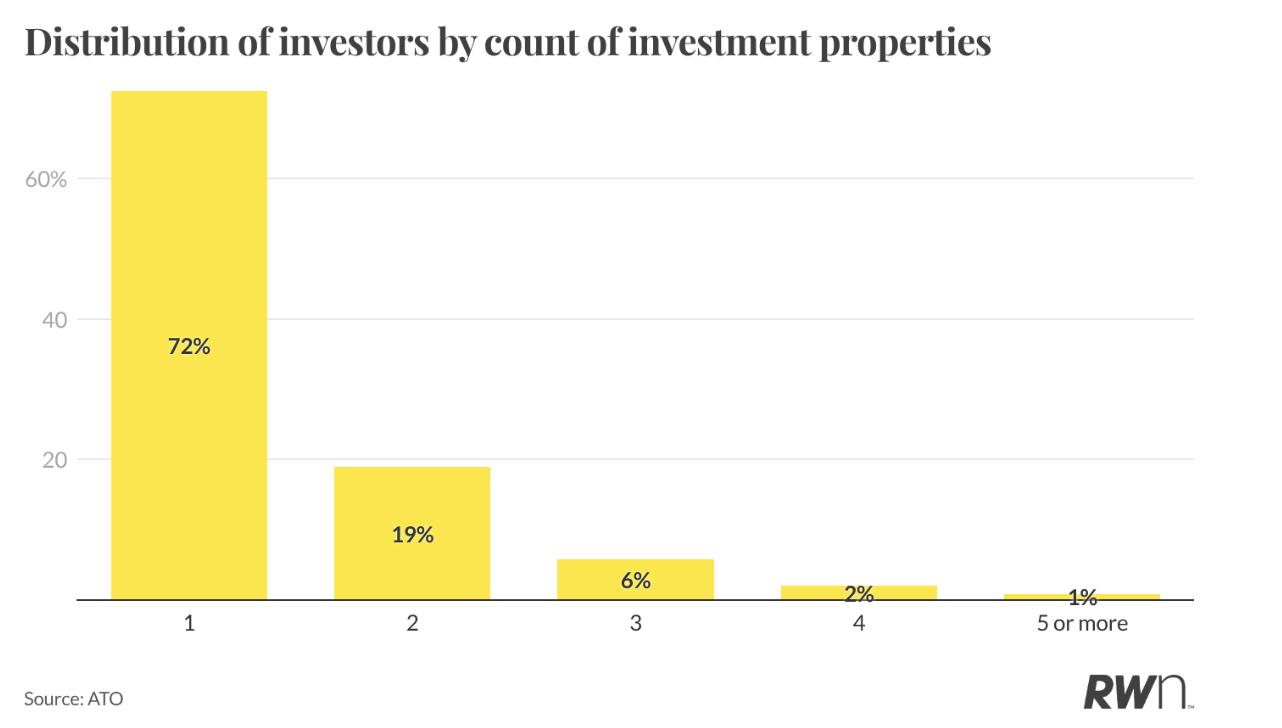
Investor pool narrows - Those investors unable to buy if they don't have access NG now wont participate in this market.
Rentvesting becomes largely unviable for younger buyers
where renters need or want to live. New investor stock will concentrate in outer growth corridors which are not necessarily where renters need to live (close proximity to transport hubs, schools, major employment centres etc).
Together, the changes outlined above are designed to reduce the tax advantage of buying established investment properties and push more investor demand toward new supply. Whether this helps housing affordability across Australia or merely shifts housing pressure from property prices into rents remains to be seen. However, what is clear is that residential and commercial investors, as well as renters, will be impacted.

Why a cash flow forecast is the most critical document in our business.
True control isn’t found in historical results but in disciplined foresight. The shift from reacting to your profit and loss statement to proactively charting your future is the strategic imperative that Craig Hadfield of Ray White Shoalhaven Central champions. This methodology is centered on the principle of 'working backwards.'
It starts with:
• defining the ultimate financial destination
• your desired profit, and
• calculating:
- the exact revenue
- staff costs
- overheads needed to reach it
This approach requires three non-negotiable pillars of financial oversight:
1. Break even
2. Ray White Pulse suite 3. Cash flow forecast
1. Break-even: your non-negotiable baseline
Understanding the business’ overall break-even point is the foundational first step, but the necessary insight comes from breaking it down by department: sales, property management, and administration. This exercise establishes the minimum performance required just to cover costs, transforming an abstract number into an actionable target for your team.
The property management portfolio provides a fixed income component. Therefore, the sales department must be viewed as the primary lever determining ultimate profitability. By knowing the precise number of sales settlements required to cover the shortfall (e.g., 10 sales per month for the Shoalhaven Central Group), you define the line between operational cost and pure profit. Operating without this granular knowledge means you’re "flying blind".
2. Pulse: the daily exchange check
Once your break-even number is set, daily tracking is paramount. For Craig Hadfield, this means being in Pulse every day to monitor sales exchanges. The focus is not on individual agent performance, but on the total number of exchanges against the monthly break-even target.
This constant check provides the immediate driver for team signaling: if sales exchanges are trending below the monthly minimum, the following month’s minimum target must be raised to make up the deficit. This proactive behavior prevents a small shortfall from compounding into a significant financial gap that takes months to recover.
3. The Cash Flow Forecast: your financial GPS
If the P&L is a historical report, the cash flow forecast is the crucial predictive tool, providing a live picture of what’s about to happen in the business over the next eight to twelve weeks. Craig only started using a cashflow forecast at the beginning of COVID and has never looked back.
“I genuinely think that it's the most important document if you took everything else away...”
By updating the forecast weekly, factoring in historical costs and future sales settlements, you gain three indispensable benefits:
• Peace of mind: it determines the accurate money in the bank after fixed payments, cutting through subjective "feelings" about cash flow to provide the clear truth. It removes the guessing
• Accurate tax planning: the report projects tax liabilities (like BAS, income tax, and super) four months in advance. This prevents the biggest killer of new businesses: the unexpected tax bill following a busy period. It removes the temptation to spend money prematurely that should be retained for future tax obligations
• Partner transparency: it facilitates transparent, data-driven conversations about safe dividend payments, ensuring the business is funded before owners take an income. This accuracy eliminates the need for cumbersome separate accounts for GST or Super
The danger of not embracing this discipline is clear: high sales months can "mask problems inside the business", lulling principals into thinking they can afford an expense when a massive tax liability is looming.
Ultimately, the 'working backwards' philosophy culminates in a golden rule for all principals: you must prioritise the business before you pay yourself. You must be proactive and quick to address financial issues, using your break-even as an early warning system to hold back loan payments or owner dividends months in advance if sales falter.
Craig says:
“The truth is, you work for the first two-thirds of the year for everyone else, including the tax man... the first third is your costs, second is tax and the last third is yours and it all happens in that order. So you know you get paid last.”
To ensure your business remains bulletproof through market fluctuations, adopt these essential disciplines:
• Maintain a three-month buffer: have a minimum of three months of cash access to fund operations without requiring owner income
• Pay bills weekly or fortnightly: ensure your bank balance is always accurate and reflects cleared costs and franchise fees
• Review P&Ls monthly: actively monitor your profitability and compare it year-to-year to ensure your financial reality aligns with your "feeling"
• Embracing the predictive power of the cash flow forecast is the only way to achieve financial control and secure the profitability that is rightfully yours.
When Jenny and John acquired the Parnell business in February 2023, it ranked as the fifth-largest office by gross commission income (GCI) in the New Zealand network, generating approximately $9m in revenue. However, despite its scale, the business was not operating sustainably, recording a significant net loss in its final year before the acquisition.
While the underlying potential was clear, the challenge lay in implementing the necessary level of change required without destabilising the team or losing key salespeople.
The core issue was a structurally high cost base, particularly in relation to people costs. In the 2023 financial year, total wages, including salesperson commission splits and administration/support staff costs, accounted for 90 per cent of revenue. Addressing this imbalance became the central focus of Jenny and John’s turnaround strategy, supported by financial insight and benchmarking from the Network Finance team.
Their approach was measured and deliberate. Existing salesperson commission structures were honoured to maintain stability, but underperforming salespeople were no longer supported with personal assistants, and the back-office function was restructured and streamlined. A key component of this was outsourcing the accounting function to Ray White Accounting Solutions (RWAS), which not only delivered meaningful cost savings but also improved the timeliness and accuracy of financial information.
The first year of ownership was challenging. Some key salespeople departed, and revenue declined by 43 per cent. However, Jenny and John had clear, consistent visibility over their financial performance and cost drivers. This enabled informed, confident decisionmaking throughout the transition. Importantly, they significantly reduced payroll costs, enabling the business to return to break-even.
With the majority of fixed cost inefficiencies addressed, attention turned to commission structures. Jenny and John focused on recruiting their way to a more sustainable model. All new salespeople were recruited on tiered commission structures, moving away from the high flat-rate splits inherited with the business. As a result, average commission rates reduced from 74 per cent to 64 per cent in the second year, driving a return to profitability.
In this current year, their disciplined approach is delivering strong results. Through consistent recruitment on sustainable structures, underpinned by clear financial insight from RWAS and Network Finance, the business has gone from strength to strength. It now ranks within the top five out of 44 Auckland offices in terms of profitability. Notably, this has been achieved despite the business still operating at a smaller scale than at the time of acquisition.
This case study highlights the impact of combining strong operational leadership with clear financial data. With accurate reporting and clear visibility, better decisions were made at each stage, resulting in a more streamlined, sustainable, and highly profitable business.


“Profit is a payment for leadership.“
BRIAN WHITE, CHAIRMAN, RAY WHITE GROUP

Another 8% uplift in residential property prices in the first half of FY26 helped propel sales businesses to record profitability in dollar terms, whilst profit margins have returned to levels not seen in the past decade, excluding the outlier COVID affected years of 2021 & 2022. In Property Management, profitability has also continued to grow, but margins have plateaued amidst a competitive labour market and retention challenges.
• Queensland Sales teams have shown extremely strong profitability growth over the past few years, with the 12-month rolling quarter average profit almost doubling from $304k in June '23 to $551k as at December '25;
• This highlights the strong upward momentum across the network on the back of favourable market conditions. Pleasingly, this growth has been achieved in tandem with growing average profit margins which are now at 15%, up 29% since the December 2023 rolling quarter;
• This uplift in margin has been achieved through a commitment from business owners to disciplined cost base management, which will be key to protecting margin as market tailwinds begin to subside.
• Queensland rent rolls continue to perform well and have the highest profit margins across Australia & NZ, running consistently in the mid-high 20%'s for the last two years;
• Strong rental price growth has helped the 12-month rolling quarter average profit climb 44% since December'23 to $395k as of December'25, however profit margins have plateaued over the same period;
• Have profit margins peaked? Or has a favourable market environment created complacency and inefficiencies as indicated
71 (page 9), well below the

Sales team margins have remained consistent but a drop in sales volume could leave some businesses vulnerable. Therefore preparation is key for a shifting tide.
Property management may have reached a profit margin peak of 26% with a small drop to 25%. Is this due to a higher investment in maintaining organic net growth as retention challenges persist?
• NSW | ACT teams have shown exceptional profitability growth, with the 12-month rolling quarter average profit more than doubling from $138k in June '23 to $322k as of December '25, highlighting the strong upward momentum across the group.
• Crucially, this robust growth has been achieved whilst maintaining average profit margins at 16% since December '23 rolling quarter.
• This is a testament to a well managed cost base which has grown in line with revenue. Margin protection should be front of mind in 2026 with a drop in unconditional sales of 4.1% in the March 2026 quarter compared to the March 2025 quarter. Is it time to audit your expenses to protect profit margins? PROPERTY MANAGEMENT PROFITABILITY
• Property management profit margin peaked in FY25 at 26% of revenue but has seen a slight drop since then sitting at 25% in the 2025 calendar year.
• Retention of properties has been a challenge due to an increase in the number of investors leaving the market. The average office is now losing 16.4% of their properties under management. Positively, two thirds of offices were still able cover those losses and grow their rent roll with over half of the total net gains across NSW I ACT the result of acquisitions.
• The biggest focus ahead is to maintain net organic growth - are businesses geared for chasing organic growth?

Sales performance has strengthened, with profit increasing, primarily driven by a 22% uplift in market volumes in H1 FY26 compared to H1 FY25. This favourable environment has enabled sales businesses to capitalise on growth, further supported by a 6% price increase over the same period, contributing to overall performance gains.
Property Management performance has remained relatively stable in H1 FY26. Market conditions in Victoria continue to present challenges, largely due to more stringent legislative requirements. Despite this, profit trends are moving in a positive direction as businesses adapt to effectively manage these changes.
• Property Management in Victoria I Tasmania has historically faced challenging macroeconomic conditions and a high cost base. Businesses have made significant strides in overcoming these pressures, with profit increasing from $79k in Jun-23 to $179k in Dec-25, representing a strong 56% uplift and signalling a clear trajectory of improvement.
• Properties Under Management (PUM) across Victoria I Tasmania are in a net growth position, despite portfolio churn, reflecting the strength and resilience of PM businesses. Encouragingly, profit margins have increased from 9.3% in Jun-23 to 15.2% in Dec-25.
• Ongoing and upcoming legislative changes are creating a more complex operating environment, placing increased pressure on landlords and contributing to broader market uncertainty. However, recent performance trends provide confidence that growth will continue as businesses adapt
• Victoria I Tasmania sales teams have delivered strong and sustained growth over recent years, with 12-month rolling profit increasing almost threefold from $185k in Jun-23 to $505k in Dec-25. Profit margins have also strengthened significantly, rising from 13% to 24%, indicating that sales teams have become better at optimising their cost-base in the post-COVID environment.
• Strong market conditions in Victoria I Tasmania have underpinned sales performance enabling greater productivity within teams without having to increase headcount. Businesses have become better at managing the cost of their teams between the same period with revenue growth effectively absorbing rising desk costs across Victoria I Tasmania.
• While favourable market conditions have driven substantial growth, it remains critical for businesses to maintain cost discipline and operational efficiency to sustain performance through potential market changes.

Western Australian businesses have delivered steady profit growth over the past three years, contributing to higher earnings on a rolling 12-month basis. Margins across both divisions have remained largely flat, with cost pressures and commission structures limiting margin gains. As the market moves beyond its peak growth, performance will depend on
• The sales market has delivered exceptional revenue conditions since 2023, underpinned by tight supply and strong demand. This has seen average sales revenue growth of 38% over the two years to December '25. We have seen the growth rate decline of recent, with average revenue up 4.2% year on year.
• Profit margins have remained controlled throughout the period, averaging between 14-17%. Slightly higher People and VPA costs (2-3%) have brought about the decline in profit margins, whilst desk costs margins have dropped very slightly (1%).
• As the market continues its transition into the next phase, business qualityagent productivity, desk cost management and pay structures - will determine who protects profitability .
• Property management divisions have been seen to maintain their profit margins, which have hovered between 24-27% since September '24 and continue to be slightly higher than the national average of 22%. Rising people and service costs have seen an erosion of average profit margins from earlier years, which were as high as 28-30%.
• Market conditions and a portfolio churn averaging 18% has seen properties under management remain relatively stable over the past 12 months, with the average portfolio across the group growing by 10% (22 properties).
• Business owners who refine their

South Australian and Northern Territory businesses have capitalised on one of the strongest and consistent markets in the country, driving growth in sales and property management profits since 2023.
However, while revenues and profits have continued to climb on a rolling basis, profit margin growth began to plateau and soften in 2025 as rising costs and operating pressures dilute the benefit of favourable conditions.
• The highly favourable market conditions over the past 12 months to December '25 have seen average dollar value profit on sales teams up by a massive 43%. With average profit of $263k, which is up from $183k for the 12 months to December '24.
• The market over this same period has been fuelled by an increase in both the price and volume, with average price growth of 14.9% and volume growth of 8.8%.
• The growth in the market over the past couple of years has also seen an increase in profit margins (efficiency gains), through higher productivity. With the average office now maintaining an 18-20% margin, well up from the 12-13% averages experienced throughout 2023.
• A continual awareness of the sales cost base is required to ensure these good margins are maintained, particularly when market conditions soften.
• Strong rental conditions and rising rents continue to support PM revenues producing consistent profit growth on a rolling basis since 2023. With average revenue climbing by 26% over the past two years to December 2025, and 12% over the past 12 months.
• Are we seeing signs that margins have peaked in 2024 and are now normalising, reflecting the impact of rising costs and increasing compliance obligations?
• We have seen a reduction in the average PUM per PM staff over the past four years, which now sits at 81 properties, down from 86 in 2021. Further evidencing a change in the operating environment for PM businesses.
• Businesses which actively manage their portfolio,

New Zealand property prices have remained relatively flat over the past two years. However, transaction volumes have been gradually increasing, which has been the driver of growth.
Transactions in the first half of the current financial year were 7% higher than the same period last year. Despite this, there has been a slight decline in overall GCI percentage, a key metric we must maintain to preserve value.
• While revenue growth has appeared to plateau over the past six months, the broader threeyear trend remains positive, contributing to increased scale across our businesses;
• Desk cost creep is an area to watch as it is outpacing revenue growth, however, this has been offset by stable people costs;
• Overall, rent rolls are performing well, maintaining a consistent margin of over 20%.
• For the most part, our offices have successfully recalibrated, with an improved balance between revenue and costs delivering a solid level of scale;
• Profitability has recovered following the post-COVID downturn, however, margin growth has plateaued over the past nine months at approximately 13%, in line with long-term averages;
• While profit in dollar terms has flattened, it continues to sit above historical averages, reflecting the larger scale of our businesses compared to five to ten years ago.

When Sales commission drops, businesses struggle to adjust on cost levers to maintain a profit margin above 15%.
Property management profit margin is now holding consistently above 20% of revenue
• The Commercial network has the highest average revenue per employee (productivity) at $228k per head. However, this does not result on a higher average profit margin.
• Higher staff costs, averaging 59% in the 12 month period to December 2025 impact the bottom line by three percent comparatively to the Ray White Network people costs averaging 56%.
• The increased productivity demonstrates improved efficiencies but that comes at a price with more experienced and expensive employees. That higher cost appears to be eating at margins. Does productivity need to be higher to combat this? Offices should work towards a $250k productivity level target per employee in PM.
• Average GCI has increased by 48% since June 2023 but overall sales team revenue has remained below $2.1m.
• This is the result of a reduction in sales team size with average agent numbers dropping from five to four.
• Retention, training and recruitment of sales people is the key factor to increasing overall divisional revenue and maintaining consistent profit margin.

Understanding a business’s financial health as a business leader is more critical than ever in today’s competitive landscape. Our custom built application equips business leaders with tools to identify areas of improvement, optimise costs, and ultimately drive growth in the business. Whether a small team or larger enterprise, Profit Pulse will provide the insights necessary to stay ahead.
Profit Pulse offers a comprehensive suite of features designed to simplify financial analysis enabling leaders to identify trends to understand the key drivers of their profitability and sharpen business decision making. Leveraging end-to-end integration eliminating the need for hours of spreadsheet creation and analysis.
• Easy to read and understand the profit and loss to stay well informed, improve performance management and ultimately make smarter financial decisions.
• Intuitive and flexible budget management to help you better plan ahead and gain insight into actual budgeted performance.
• Real-time benchmarking to evaluate your performance against peers to ensure your as profitable as possible
• Visualise insights and analysis trends to help identify gaps or opportunities for growth.
Profit pulse is a powerful tool to really assist and propel you forward when it comes to working on the business.
Andrew Garland of Ray White Caloundra understands that with great past success and understanding of his surrounding market, that the leadership bar constantly needs to be rising.
As an early adopter of the Nova Project, and his work with the finance team, it was apparent that bringing on a partner like Natascha Drexel-Munro would help facilitate his ambition for growth.
The Nova Project, a blueprint for creating effective succession planning, often reveals an opportunity to restructure businesses so that new hires can share the benefits of success with the business’ leaders. Andrew knew that his role is to create further leaders within his own marketplace.
For over 20 years, Ray White Caloundra has been a pillar of trust, results, and community connection across the southern Sunshine Coast.
Under Andrew Garland's visionary leadership, the business has become one of the most respected and high-performing agencies in the Ray White network. His experience with the Nova Project encouraged him to be proactive in continuing and maintaining that legacy long after he retires.
To that end, Mr Garland announced a significant leadership evolution with the appointment of Natascha Drexel-Munro as co-Principal and Business Owner, joining long-standing Principal Andrew Garland in a dynamic partnership poised to lead the agency into its next chapter.
The new leadership partnership will focus on strengthening the group's footprint across Caloundra, Golden Beach, and the southern coastal corridor, with continued emphasis on client experience, team development, and community engagement.
"Natascha has been an integral part of our business for many years," Mr Garland said.
"Her leadership, professionalism, and deep care for both our people and our clients make her the perfect partner to help drive our continued growth and innovation."
Ms Drexel-Munro is a role model for our industry when we look at successful succession planning, especially with her high-level experience and understanding in both property management and an elite level of sales. She brings extensive experience and a proven track record of excellence to the co-principal role.
This ensures the future is bright as the Nova Project focuses on wisdom and energy to keep growth as a focus.
"I'm incredibly proud to be taking this next step with Andrew and our talented team," Ms Drexel-Munro said.
"Ray White Caloundra has always been about excellence and genuine relationships, and our vision moving forward is to build on that legacy, embracing new technologies, nurturing our people, and continuing to deliver exceptional results for our clients."
"Our future plans are all about growth with purpose," Ms Drexel-Munro said.

That means investing in our people, our systems, and our community, ensuring Ray White Caloundra remains the agency of choice for years to come.

Ray White Rockhampton is entering an important new chapter, with an evolved leadership structure designed to support the business’s continued growth across Central Queensland while preserving its long-standing market leadership.
After seven years of partnership in Rockhampton with Riley Neaton, David Bell has sold his 50 per cent stake to concentrate on the Yeppoon business. Riley will take up an extra 20 per cent in equity with the three new business partners, Cassie Sparks, Charlie McCarron and Melinda Kirby, taking up 10 per cent each.
The leadership evolution reflects a deliberate commitment to developing leaders from within the Rockhampton business. Each of the new equity partners have progressed through the organisation and bring strong local knowledge, operational experience and a deep understanding of the business culture.
Cassie oversees business operations and property management, having begun her career at Ray White Rockhampton more than 15 years ago as a property manager before progressing into senior operational leadership. Melinda brings eight years of experience with the business and is recognised for her consistent results, strong
client relationships and market leadership. Charlie joined the business five years ago after transitioning from a trade background and has since established himself as a high-performing agent within the Rockhampton market. Together, the leadership team brings a complementary mix of operational expertise, sales performance, and local market knowledge, providing a strong foundation for the continued growth of the Rockhampton business.
“These people have the potential to take the business further,” Riley Neaton said.
“We needed fresh ideas and new energy, and there is no better way to achieve that than by promoting leaders who understand our culture because they’ve grown up in it.”
All three also participated and graduated the first year of the Nova Leaders program in Queensland in 2025. Nova Leaders is a new initiative rolled out by Ray White to prepare the next generation of leaders to take the next step into business ownership. In 2025, Queensland had 34 graduates completing the first year of the program with another 12 added for 2026.
Melinda is an advocate for the Nova Leaders program for anyone looking to advance into leadership and business ownership, stating it effectively "fast tracks their understanding of what’s involved” in the process.
Reflecting on experience in the program, Melinda explained the value of getting a "look behind the curtain" of the business, focusing on real numbers, market share and what actually drives success - not the 'glossy version' of business ownership."
The real world focus within the program was integral: "conversations around leadership, financial responsibility, decision-making, and accountability. It gave me a deeper appreciation for the weight of ownership and what it truly means to lead my team."
Charlie's key takeaway from the program was "brutal self-honesty."
"The program necessitates an inward focus, forcing self-examination, emphasising existing strengths but crucially, your gaps. It involves confronting areas of knowledge that may have been previously overlooked or misunderstood. I found the need for deep-self awareness and reflection the most powerful element."
“While the program covers essential, practical business components including financials (like market share and financial structure), recruitment and leadership, the true personal and professional growth stems from being honest about areas needing improvement and then committing to action. Business ownership is a serious commitment and the program helps you fully grasp that weight.”
Cassie's learnings involved the necessity of preparedness over guesswork, providing clarity and confidence before the weight of ownership fully lands.
The program shifted Cassie's perspective from leading within a business to thinking and acting like an owner.
"It forces you to think commercially and understand how every decision impacts profit, cashflow, and long-term sustainability. What stood out most was the accountability. You are challenged to truly understand your numbers, your structure and confront your blind spots. There is nowhere to hide."
Rockhampton and Yeppoon moving forward Together, David and Riley will continue to lead Ray White Yeppoon, with the Rockhampton and Yeppoon businesses remaining closely aligned through shared values, collaboration and a long-standing working relationship between the two principals.
“David and I have worked incredibly closely for a long time, and this change is about setting both businesses up for the next stage of growth,” Riley said. “While our day-to-day focus is now clearly defined, our vision and approach remain strongly aligned.”
Riley’s own career path reflects the opportunity he’s experienced at Ray White. He entered the real estate industry at the age of 21 as an associate under David Bell. He’s spent nearly nine years in the business - seven of those as a business owner.
“I wouldn’t be where I am today without that mentorship,” he said.
“Seeing others now step into leadership roles is incredibly rewarding and reinforces the importance of building people for the long term.”
Ray White Rockhampton and Ray White Yeppoon continue to deliver standout results across the region. Together, the businesses hold a combined 45 per cent market share and have maintained their position as the dominant agencies in their respective markets for the past nine years. They have also been recognised as the number one international business within the Ray White Group for number of sales.
Starting as a team across both offices of just 15 staff, the businesses have grown to more than 90 team members across both offices. In the past year alone, Ray White Rockhampton recorded 725 sales, reflecting strong performance across residential, rural and commercial property.
“Our success comes down to our people and our culture,” Riley said. “We have a diverse, multi-generational team, from young people entering the industry to experienced professionals who have been part of the business for decades. That mix has helped us build trust and a strong reputation across the Rockhampton community.”
Looking ahead, the focus remains firmly on growth, leadership development and continued market leadership across both businesses.
“I want to see both Rockhampton and Yeppoon continue to power forward,” Riley said. “That means developing leaders, supporting our people, and continuing to deliver strong outcomes for our clients and our communities.”
Jason Andrew, CEO of Ray White Queensland, said the leadership evolution reflects the strength of the Rockhampton business and its commitment to developing people from within.
“Ray White Rockhampton is best in market, not just because of its market share, but because of the depth of talent it has built over many years,” Jason said.
“Riley and David have created a culture that genuinely develops people, and seeing leaders like Cassie, Charlie and Melinda step into expanded roles is a natural progression.”
“This structure positions Ray White Rockhampton for continued success and reinforces why it remains one of the strongest businesses in our network. The best years are clearly still ahead.”

Australia's property sector is poised to undergo its biggest compliance changes in decades, with sweeping anti-money laundering (AML) reforms commencing from 1 July 2026. The regulatory overhaul is designed to ensure that real estate transactions are not exploited to "hide, move, or launder illegal money”.
According to Shaun Doyle, Ray White’s Agency Compliance Manager, understanding the fundamentals is the first step. These reforms are serious, as they are regulated by AUSTRAC (Australian Transaction Reports and Analysis Centre), so agents and business owners need to pay attention.
How well prepared are you for July?
Businesses are advised to use the remaining time before the deadline to implement several key measures.
Understand your AML/CTF obligations
You need to take some time to familiarise yourself with the AML/CTF rules that apply to our industry. This includes understanding customer due diligence, reporting requirements, and risk-based compliance obligations.
a Compliance Officer
Your business needs someone to oversee AML/CTF compliance; that person is your compliance officer. This person manages risk, ensures procedures are followed, and acts as the main point of contact for regulators. The AML Compliance Officer must be a suitably qualified employee/engaged by the business at the management level. Have you appointed your compliance officer?
Implement approved AML technology
You must use one of the three Ray White approved AML providers displayed on the right. The technology solution will streamline compliance by automating customer verification, transaction monitoring, and suspicious activity reporting, reducing manual workload.
AUSTRAC enrolment
You need to register your business with AUSTRAC by 30 June 2026 to legally operate under the AML/CTF
framework. This ensures regulators are aware of your business and your commitment to preventing financial crime.
Develop and begin implementing an AML/CTF Program
As a reporting entity, you must develop, maintain, and comply with an AML/CTF Program. You must have a program in place from 1 July 2026, and this needs to be documented in writing, approved by a senior manager and finalised before you provide any designated services.
Prepare your team - training and resources Your team is on the front line of compliance. Regular training, clear guidelines, and accessible resources help staff understand their responsibilities and act confidently in line with your AML/CTF program.
Following a number of presentations by Shaun on the upcoming changes, a common question and significant concern among principals is whether the reforms will complicate agents' interactions with buyers and sellers and/or prolong deal timelines.
Shaun advises that, based on his discussions with the regulators, most legitimate transactions will, in the main, be straightforward, and timeframes will not be affected. Also, the reforms do not require agents to interrogate buyers or be overly suspicious of each client.
Rather requiring agents to undertake their normal processes with their clients with a greater sense of awareness and observation throughout their interactions. Noticing who is providing instructions, picking up on unusual changes in behaviour or third-party involvement, and merely escalating these internally to the compliance officer.





The table below summarises your key compliance requirements
Initial customer due diligence
Ongoing and enhanced customer due diligence
Reporting
Record- keeping and corporate governance oversight
Before providing sale services, verify ID for all vendors and buyers, check PEP and sanctions lists, assess risk, follow verification rules, and know when simplified or deferred checks are allowed
Monitor vendors (and buyers if CDD is not deferred) until settlement. Update risk assessments or ID if circumstances change. For high-risk cases or suspicious matters, verify the source of funds/wealth and decide if the deal proceeds
Submit ‘Suspicious Matter Reports’ to AUSTRAC within three business days for ML or 24 hours for terrorism financing. Lodge the Annual Compliance Report by 31 March.
Keep all CDD, monitoring, and Program records for at least seven years from the date of settlement or any program changes. Store securely. Senior management must oversee compliance, approve the Program, authorise high-risk decisions, get monthly updates, and complete AML training.
AML compliance is non-negotiable and shouldn't be viewed as a legal tickbox but rather a core part of running a real estate business, similar to trust accounting. Significant penalties can result from non-compliance, including multi-million-dollar fines, criminal charges, and enforcement action by AUSTRAC.
Establishing a robust, compliance-focused business should be the goal of all business owners, as such businesses often outperform the rest, according to Shaun, based on the insights he has seen.
For more information, please search AML on whiteboard.raywhite.com or use the QR code below.


KATE TINTA HEAD OF OPERATIONS & GROWTH RAY WHITE ACCOUNTING SOLUTIONS
With the end of the financial year fast approaching, now is the time to ensure a smooth close-off and set yourself up for a strong start to the year ahead. A well prepared EOFY process helps avoid last minute stress, ensures compliance obligations are met and allows you to start the new financial year with clear goals and financial insights. As 30 June approaches, and into July, there are several important tasks that all businesses should begin working through.
Here is your high level checklist to work through to ensure you are prepared for the new financial year:
Financial Records
• Review and reconcile all bank accounts and credit cards up to 30 June 2026
• Ensure all bills relating to 2026 financial year have been entered into your accounting software
• Review VaultRE to ensure all properties have been settled
Payroll
• Process pre-30 June superannuation before the cut-off date (consult your tax accountant prior, if needed)
• Complete STP finalisation through your accounting software by 14th July
• Review all staff salaries to ensure they align with updated award rates for the 2027 financial year. These rates are typically released shortly before 30 June.
• Finalise and process June quarter superannuation by the due date
• Prepare for upcoming payday super requirements
Trust Accounting
• Review trust account reconciliations
• Ensure all outstanding transactions have been processed
Reporting and Compliance
• Lodge and pay June month or quarter BAS by the due date
• Lodge and pay annual payroll tax return (due date varies by state)
Looking ahead: 2027 Financial Year Planning
EOFY isn’t just about closing off - it’s an opportunity to reset and plan ahead.
• Review expenses to identify opportunities for cost efficiencies
• Set GCI targets for sales agents and review property management growth plans
• Develop a budget or forecast to guide performance and accountability throughout the year
If you’re a Ray White Accounting Solutions client, consider this taken care of. If you’re not and would like help with this and a range of other tasks, scan the QR code and enter your details - we’d love to show you how we can help.

JAMES WATSON GENERAL MANAGER
RAY WHITE ACCOUNTING SOLUTIONS
Effective
The Federal Government has announced significant changes to how superannuation must be paid by employers.
From 1 July 2026, businesses will be required to pay superannuation at the same time as employee wages and/or commissions, replacing the current monthly or quarterly payment cycle.
This change, known as Payday Super, is designed to ensure employees receive their super contributions more regularly and reduce unpaid super.
What is Payday Super?
Under the new rules, employers will need to process super contributions each time payroll is run.
Super contributions must reach the employee’s nominated fund within seven days of payday.
This change will apply to all Australian employers, regardless of business size.
The move to Payday Super will require adjustments to payroll processes and cash flow management.
1. Super will be paid more frequently
Instead of accruing super liabilities and paying them monthly or quarterly, contributions will be processed with each pay cycle.
2. Payroll approvals will become more time-sensitive
With tighter timeframes, prompt payroll approval will be essential to ensure super is processed and paid within the required window.
3. Cash flow planning may need adjustment
With super being paid at the same time as wages, businesses will need to ensure sufficient funds are available for both wages and superannuation each pay cycle.
4. Changes to contribution caps
Currently, the Maximum Contribution Base is monitored quarterly. From 1 July 2026, this will move to annual tracking. Once an employee reaches the annual employer contribution cap, which is $30,000, super contributions will stop for the remainder of the financial year.
5. Payroll system readiness
It’s important to ensure your payroll system is ready for Payday Super. Not all platforms will be compliant by 1 July 2026. Xero is currently building functionality to support these changes.
If you’re not currently using Xero, we recommend transitioning ahead of EOFY to ensure you’re prepared. Please reach out to discuss making the move.
We recommend beginning to prepare for Payday super now by reviewing:
• Payroll approval processes
• Cash flow planning around payroll cycles
• Internal responsibilities to ensure payroll can be approved on time, every pay cycle

When a large real estate business initially partnered with Ray White Accounting Solutions (RWAS), it generated over $6 million in revenue but barely broke even. The owners had no visibility into their financial numbers. However, within two and a half years, the business transformed this situation into a $1.8 million profit by gaining clear financial insights.
The Core Problem
In October 2022, a financially-focused director exited the business. The remaining sales-oriented owners soon realised they were spending $800,000 annually on accounting functions, yet the business was losing money and lacking financial transparency.
The core issue was structure, not revenue. The business operated across three locations using a four-pod structure, but lacked financial coding to track the profitability of specific locations or pods. Due to there being no financial oversight, the owners were completely blind to performance issues and severe overstaffing.
The RWAS Strategy
To correct the course, the business let go of two internal accountants and engaged RWAS to rebuild their financial systems. The RWAS Accountant focused on overhauling coding and standardising reporting to build trust in the numbers, setting July 1 as a fresh start for reliable data.
Once the data was clean, a major red flag emerged: people costs consumed 80% of revenue, well above the 65% benchmark. The pod structure operated like
independent businesses, which masked individual agent underperformance and drained profits.
The Turning Point
Initially, the owners pushed back against these findings. However, the RWAS Accountant persistently presented factual reporting and benchmarking data to demonstrate the overstaffing.
Armed with accurate pod-level performance data, the General Manager of the business shifted from basic cost-cutting to focusing on operational efficiency. A key behavioral change followed: departing employees were no longer automatically replaced. The business transitioned to a proactive model, able to assess how staffing and desk cost decisions would impact profitability before making them.
This newfound financial discipline yielded significant, consistent growth:
• FY 2024: The business went from breaking even to a $728,000 profit, reducing people costs to 77%.
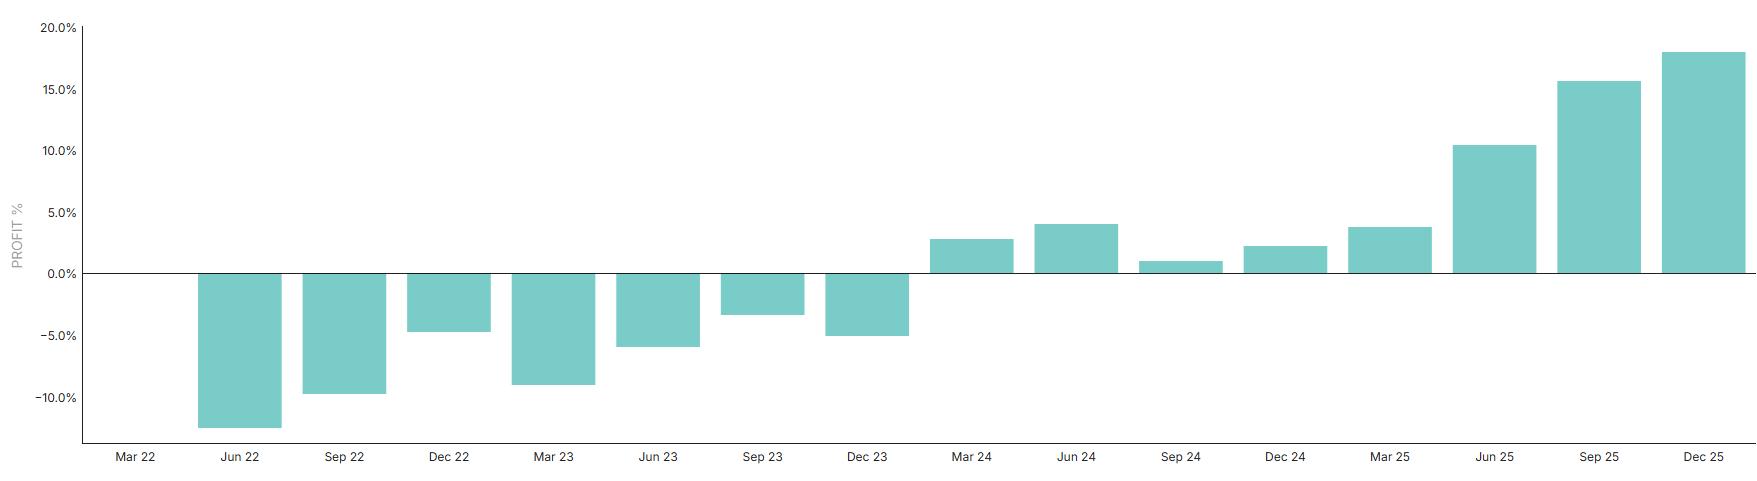
• FY 2025: Profit leaped to $1.8 million (an 18% profit margin), with people costs dropping further to 72%.
• Although the business briefly considered taking accounting back in-house, they recognised the value in the advisory partnership and insights provided by RWAS. Ultimately, the turnaround succeeded because the owners committed to bold changes, supported by accurate data and persistent, clear guidance from RWAS.