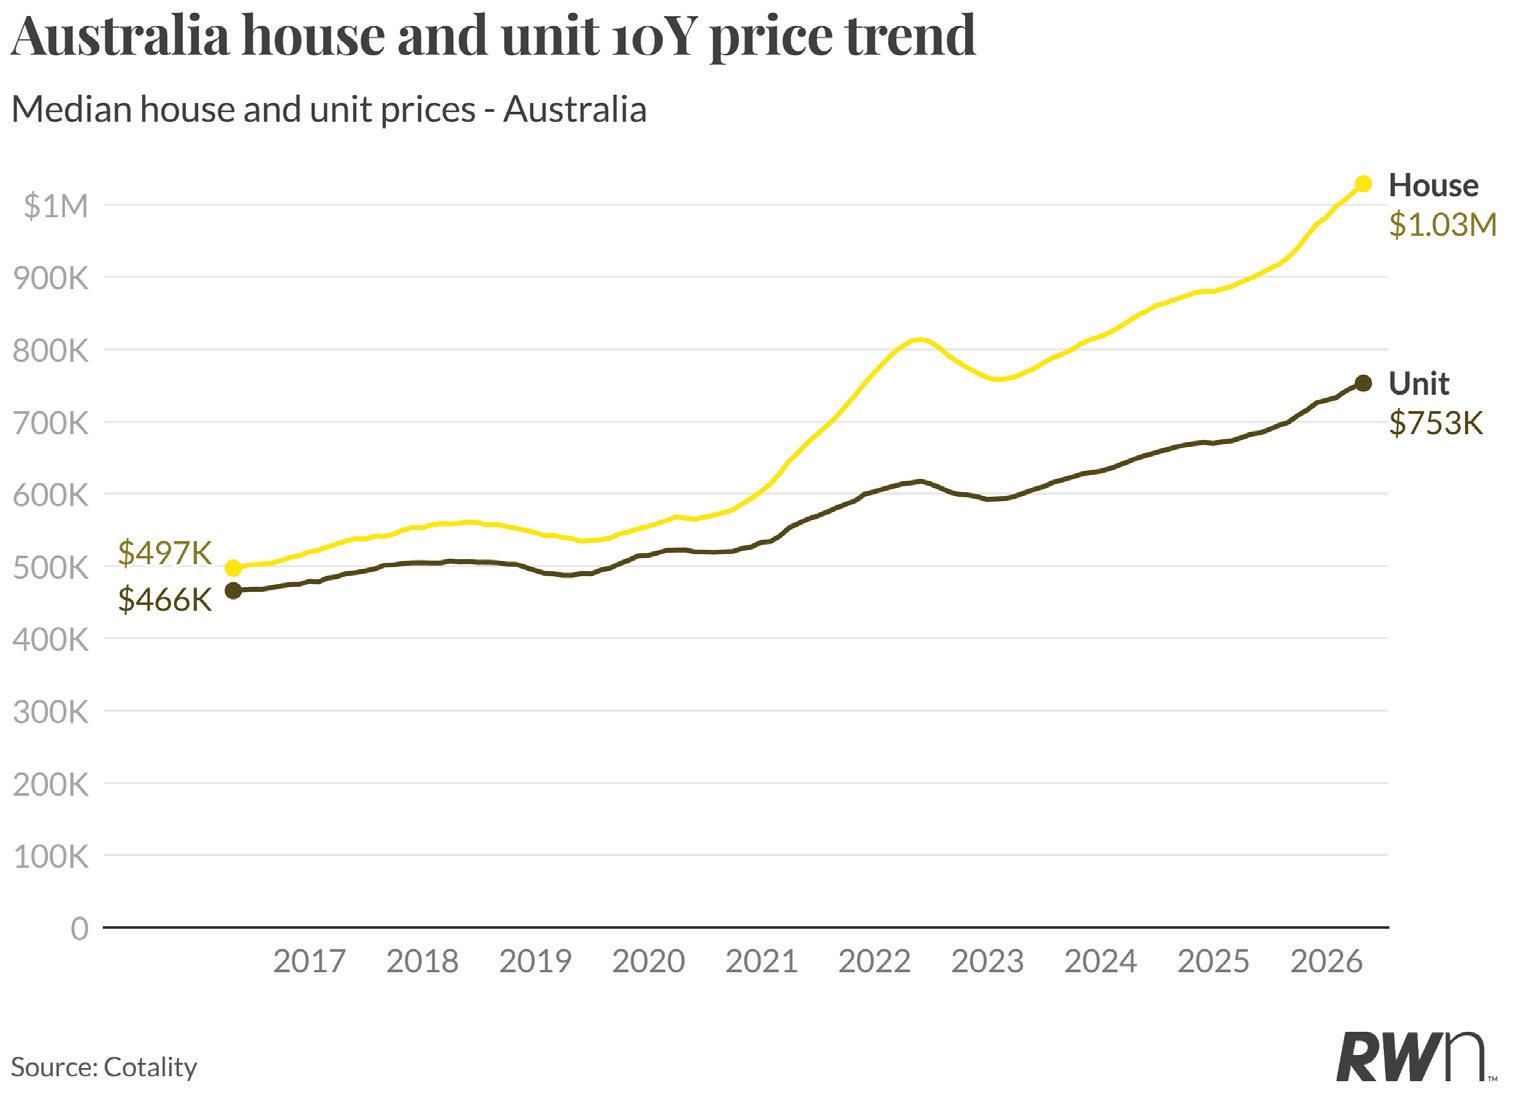
The national median house price reached $1.03 million at the end of April, with units at $753,000, both continuing the broad upward trajectory that has defined the past decade. From starting points of $497,000 for houses and $466,000 for units a decade ago, prices have more than doubled, driven by persistent supply shortfalls, strong population growth and extended periods of low borrowing costs. The pace of growth clearly accelerated from 2020 onwards, and while a correction emerged through 2022/2023 as rates rose sharply, prices recovered and have since pushed to new highs.
What is notable in the current data is that both houses and units continue to grind higher despite a more difficult rate environment. The RBA’s decision this month to lift the cash rate by 25 basis points, responding to inflation that reached 4.6 per cent over the year to March adds fresh uncertainty to the outlook. Three consecutive increases will result in higher borrowing costs that will reduce purchasing capacity for some buyers, and there are signs of emerging softness in a number of city markets already. However, with construction activity still well below what is needed to meet population growth, and supply of new homes constrained further by rising costs, any moderation in demand is unlikely to translate into broad price falls.
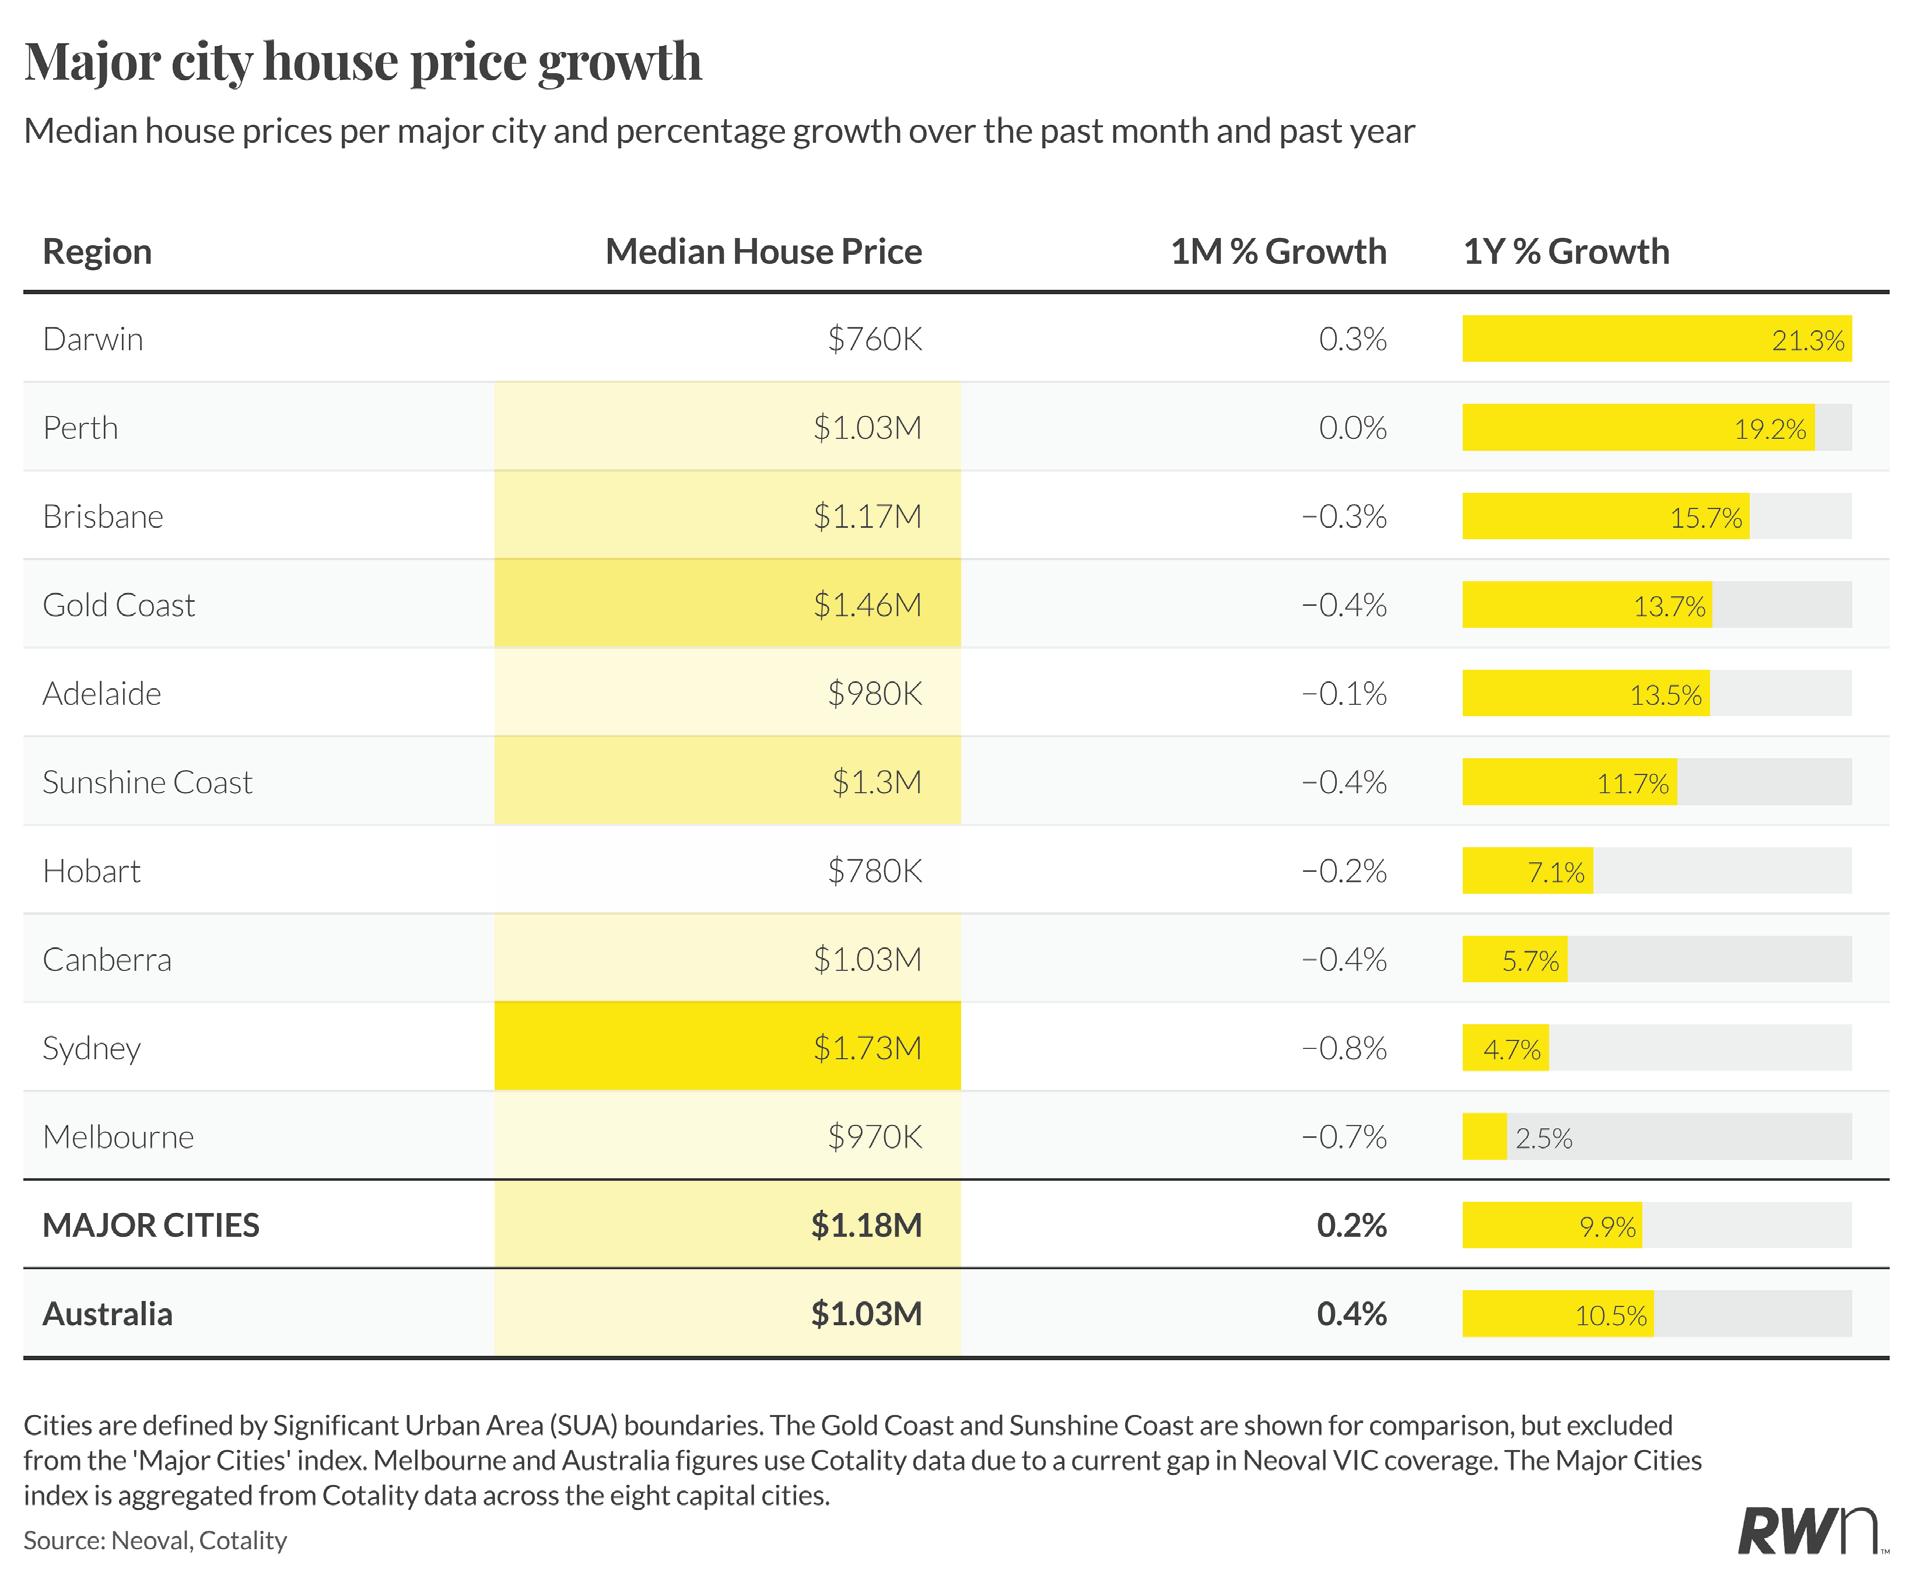
The major city housing market is showing increasing divergence, and April’s data makes that split clearer. Darwin leads all capital cities with 21.3 per cent annual house price growth, now at a median of $760,000, while Perth recorded 19.2 per cent annual growth to reach $1.03 million despite a flat month. Brisbane follows with 15.7 per cent annually, though its median dipped 0.3 per cent for the month to $1.17 million. The combined major cities index sits at $1.18 million, up 0.2 per cent for the month and 9.9 per cent for the year.
The softer monthly results across a broader range of markets are worth noting. Sydney fell 0.8 per cent for the month to $1.73 million, Melbourne dropped 0.7 per cent to $970,000, and Canberra, Gold Coast and Sunshine Coast each declined 0.4 per cent. With the RBA having just lifted rates and global uncertainty elevated, particularly through higher fuel prices flowing from Middle East conflict, buyer hesitation in more ratesensitive and expensive markets is a logical response. Annual growth remains positive across every capital, but the monthly softness in the larger, higher-priced markets signals that conditions are becoming more selective.
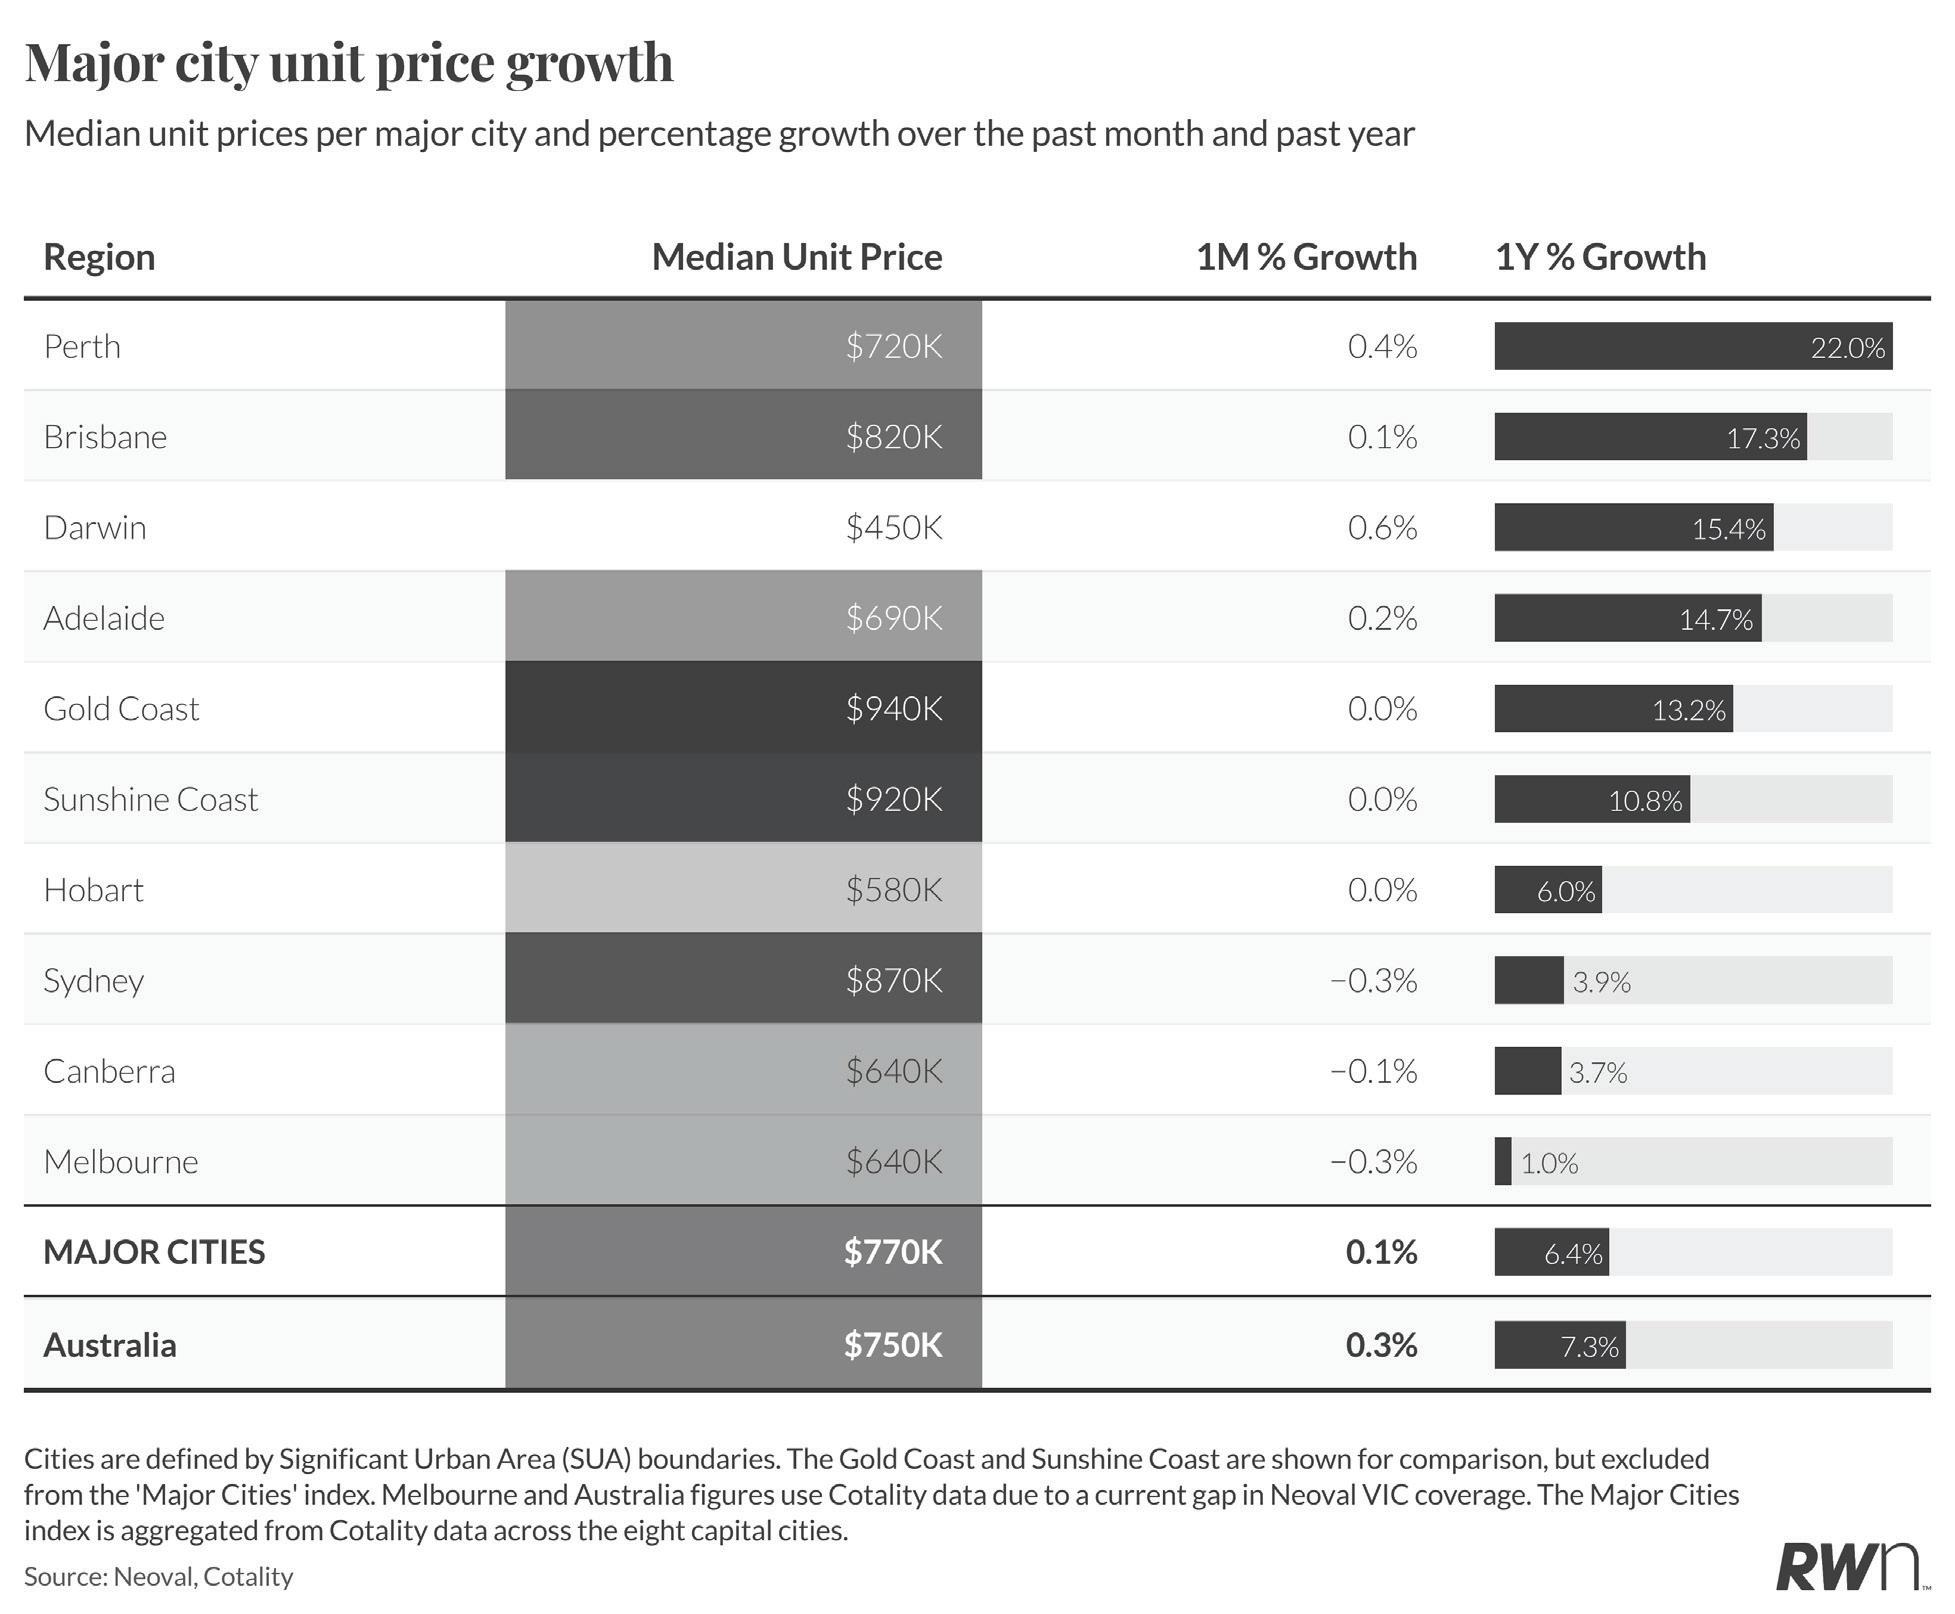
Perth continues to lead the major city unit market with 22.0 per cent annual growth, reaching a median of $720,000, though its monthly gain of 0.4 per cent reflects a slowing from the stronger pace seen earlier in this cycle. Brisbane units are up 17.3 per cent over the year to $820,000, with Darwin showing solid 15.4 per cent annual growth and the most positive monthly movement at 0.6 per cent. Adelaide recorded 14.7 per cent annual growth, consistent with its performance over recent months.
The eastern seaboard tells a more cautious story. Sydney units fell 0.3 per cent for the month to $870,000, Melbourne eased 0.3 per cent to $640,000, and Canberra slipped 0.1 per cent. Annual growth across these three markets ranges from just 1.0 per cent in Melbourne to 3.9 per cent in Sydney, considerably below the major cities average of 6.4 per cent. The Gold Coast and Sunshine Coast, both carrying premium medians of $940,000 and $920,000 respectively, recorded no movement for the month. The unit market is not immune to the rate environment, and the monthly results across the southern capitals suggest buyers are recalibrating in the face of a renewed tightening cycle.
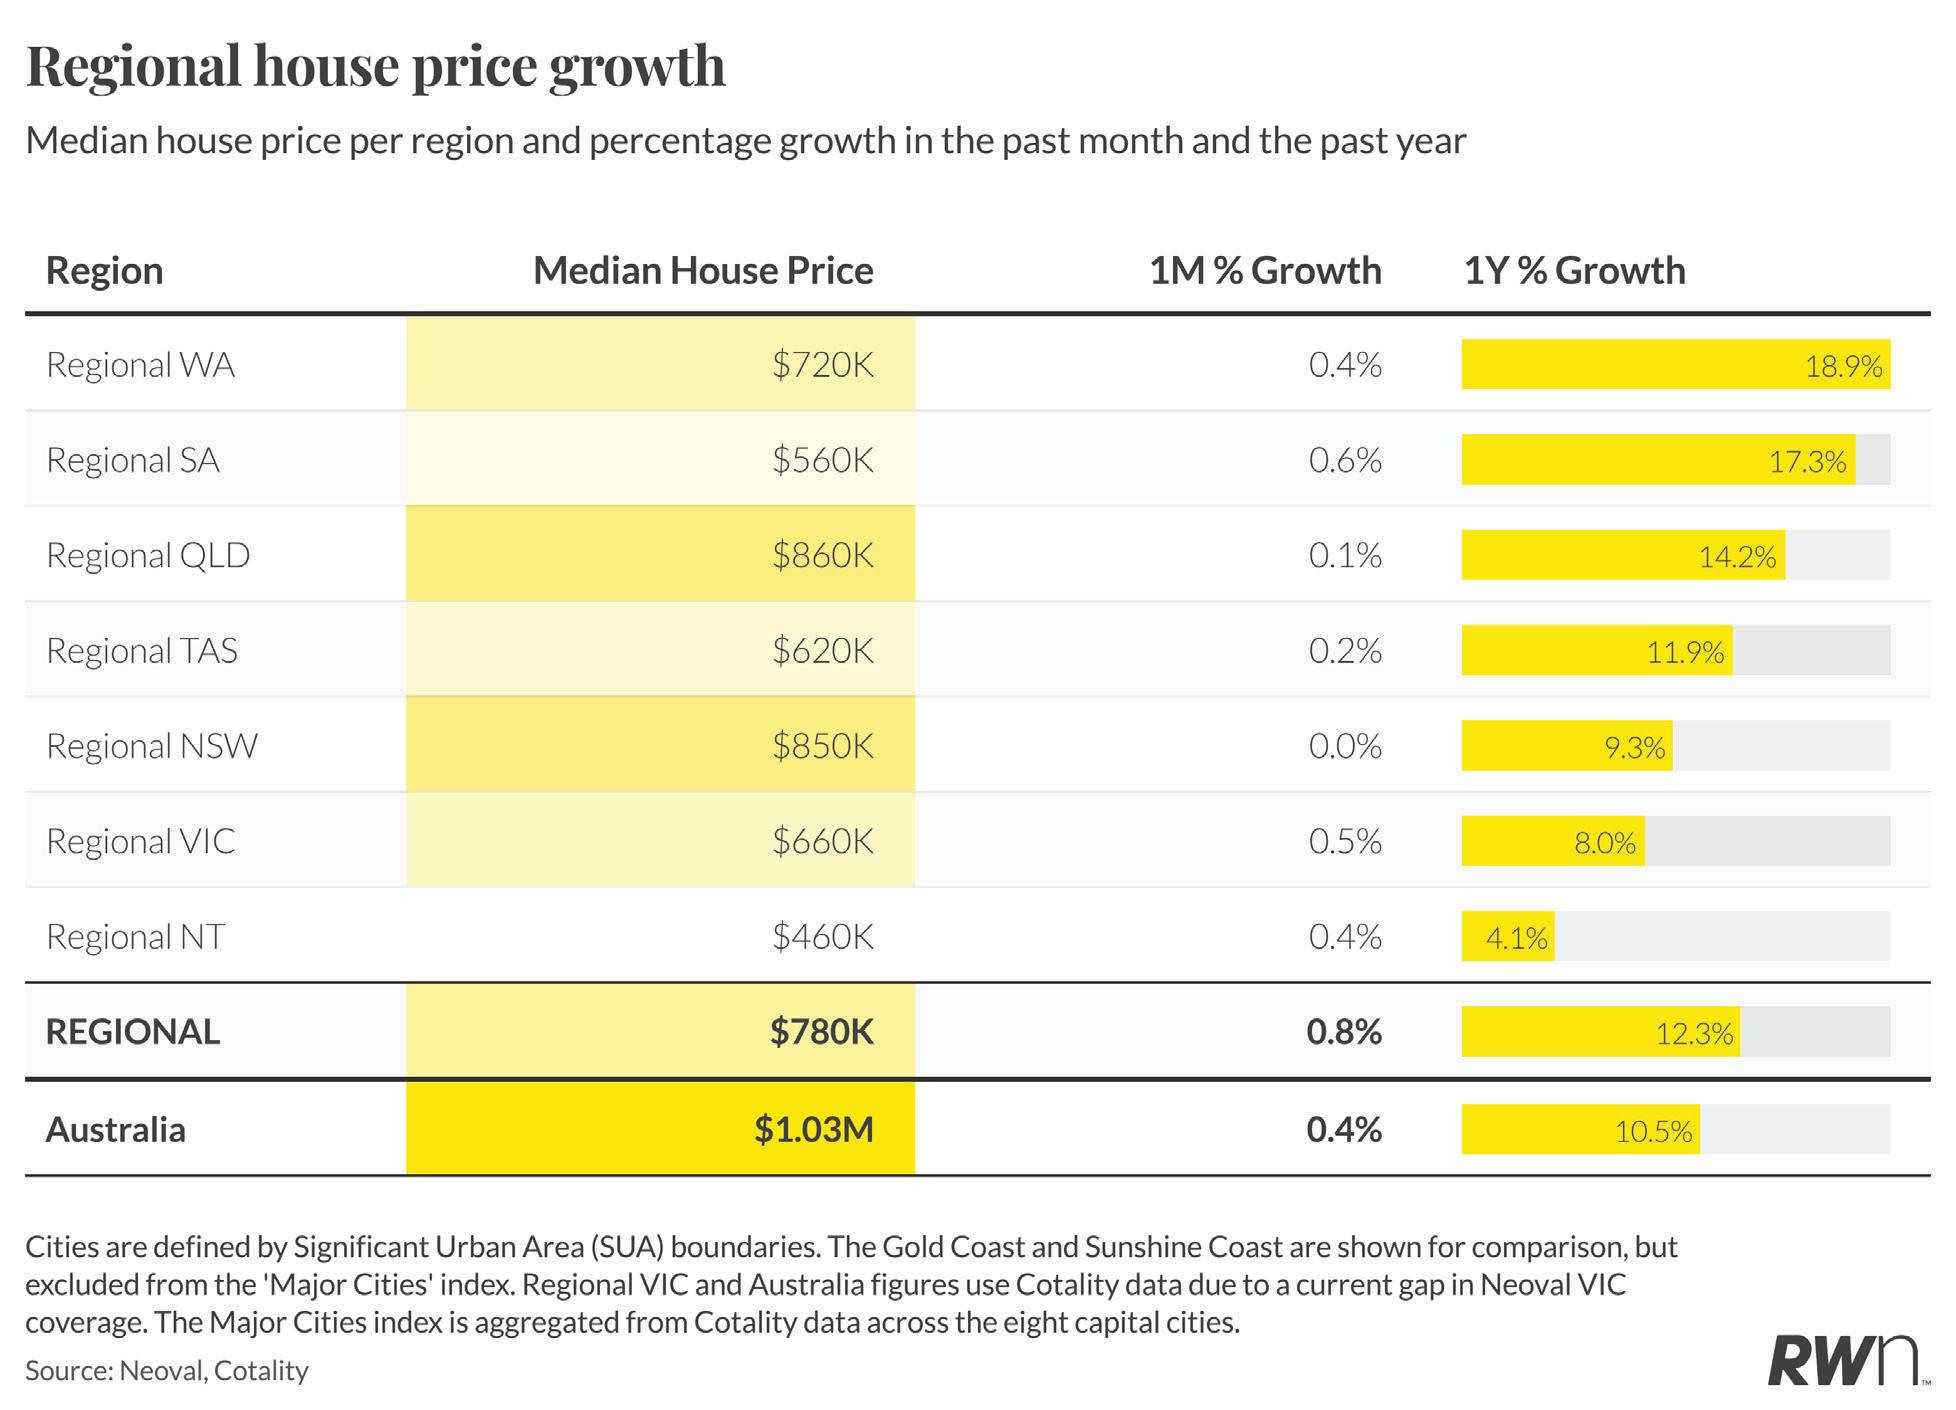
Regional house prices rose 0.8 per cent in April to a national median of $780,000, with annual growth of 12.3 per cent, outpacing the major cities index and consistent with a trend that has persisted through this cycle. Regional Western Australia leads with 18.9 per cent annual growth, now at $720,000, and regional South Australia follows at 17.3 per cent with a $560,000 median. Regional Queensland continues to perform strongly at 14.2 per cent annually, with a median of $860,000 that reflects the premium placed on Queensland’s coastal lifestyle markets.
Regional Tasmania, New South Wales and Victoria all sit in positive annual growth territory, 11.9, 9.3 and 8.0 per cent respectively, though monthly movement across these markets has been more subdued, particularly in regional New South Wales which was flat for April. Regional Northern Territory, while carrying the lowest median at $460,000, posted 4.1 per cent annual growth. The relative resilience of regional markets reflects structural factors, tight stock, ongoing demand from lifestyle and affordability-driven migration, that provide some insulation from the interest rate cycle. That said, a prolonged period of elevated rates combined with broader economic uncertainty is likely to slow the pace of growth from here.
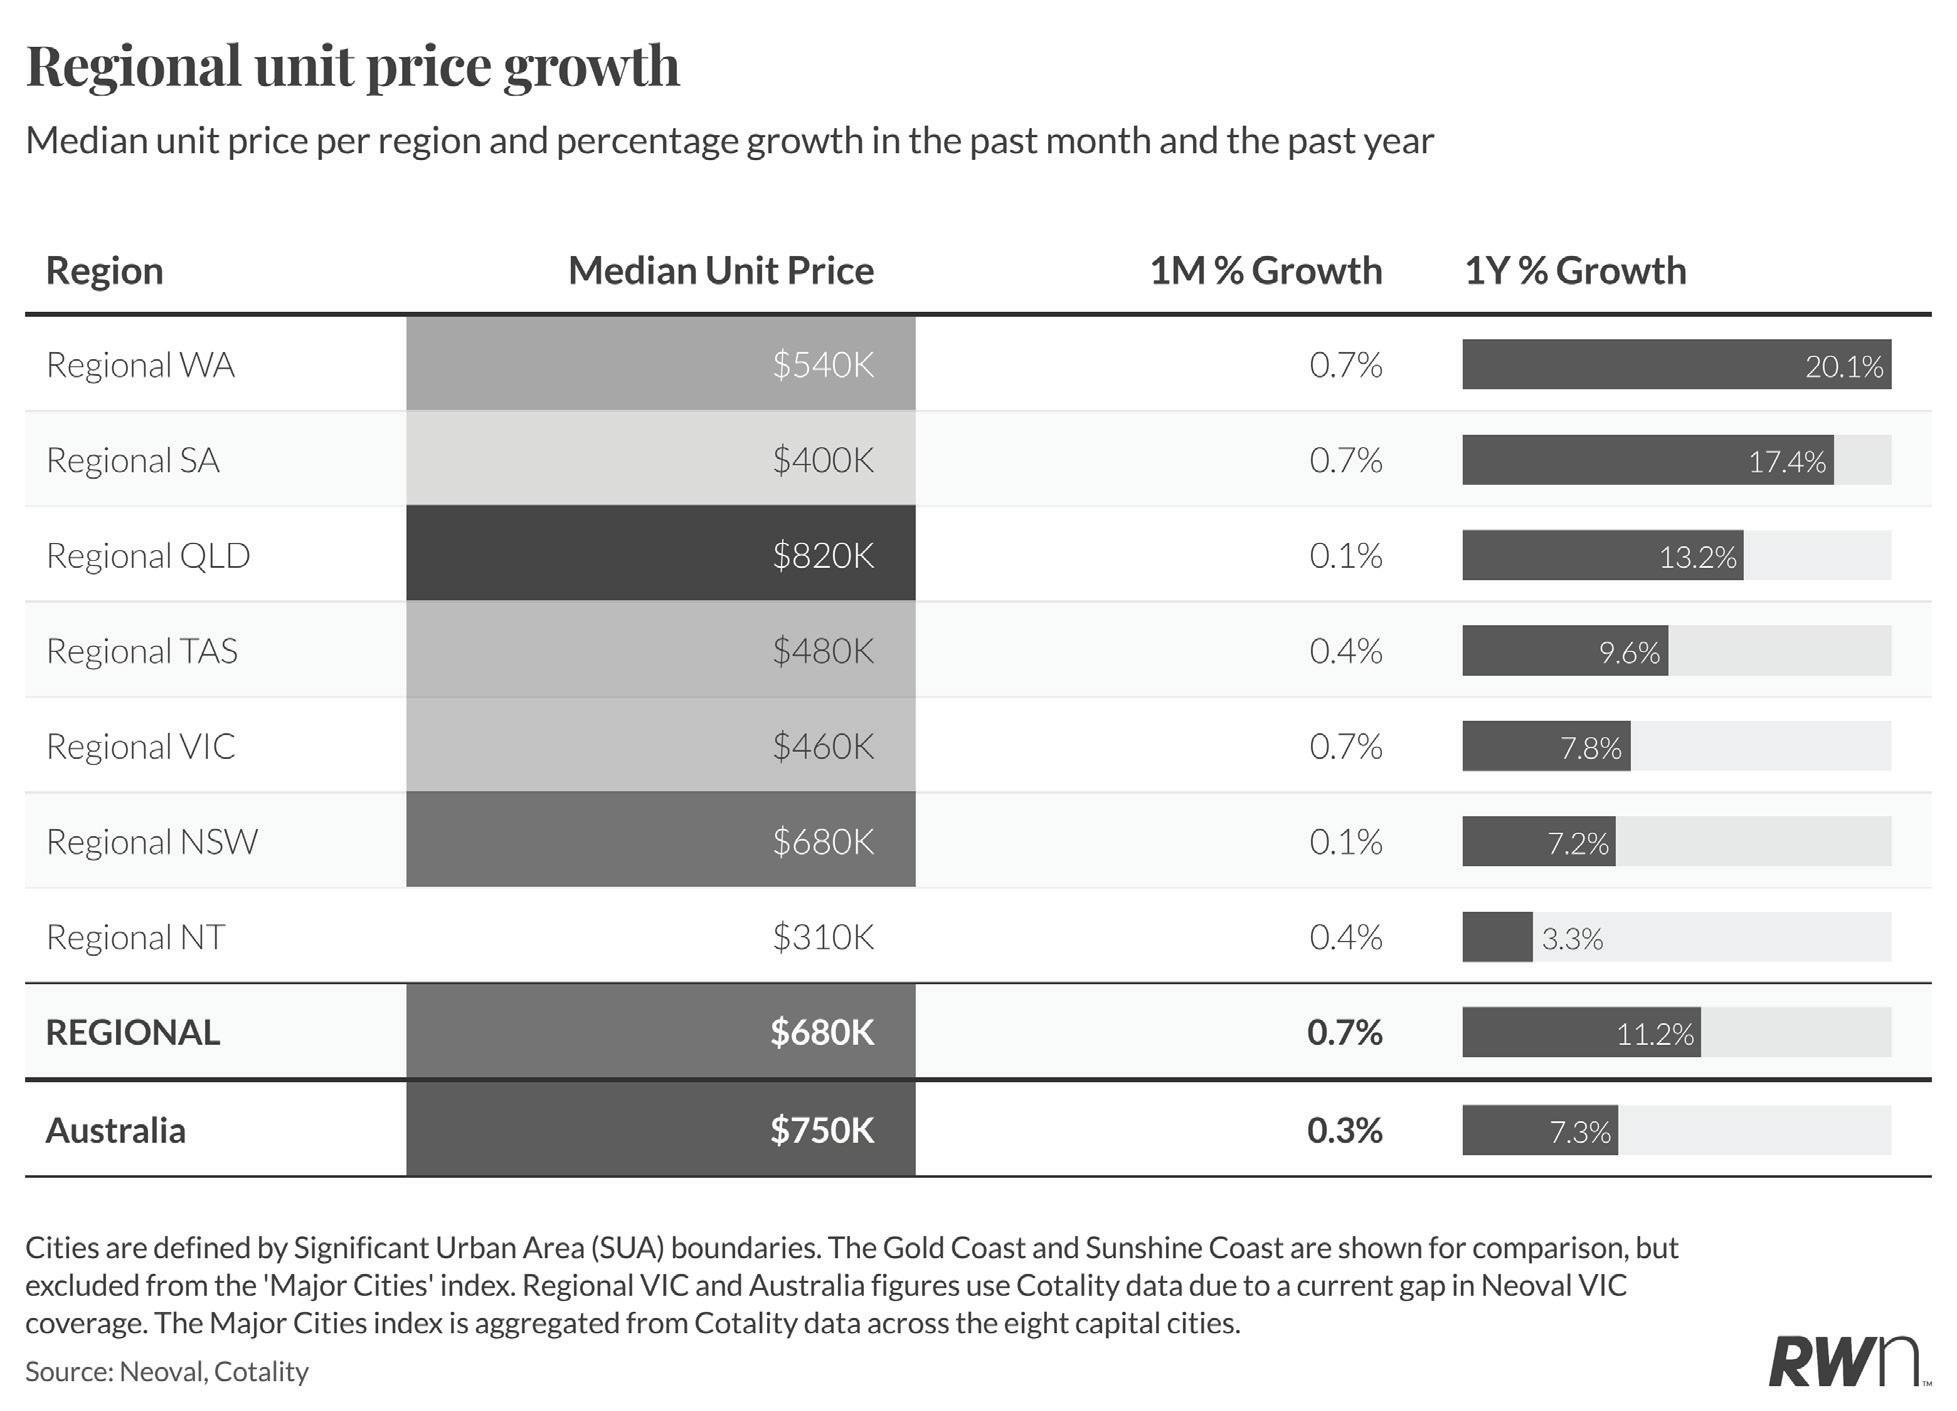
Regional unit prices rose 0.7 per cent over the month to a national median of $680,000, with annual growth of 11.2 per cent, again outperforming the major cities equivalent of 6.4 per cent. Regional Western Australia leads with 20.1 per cent annual growth to a $540,000 median, and regional South Australia recorded 17.4 per cent annually at $400,000. Regional Queensland carries the highest regional unit median at $820,000 with 13.2 per cent annual growth, though its monthly gain was a more modest 0.1 per cent.
Regional Tasmania and Victoria each recorded 0.7 per cent monthly gains, with annual growth of 9.6 and 7.8 per cent respectively. Regional New South Wales was essentially flat for the month at 0.1 per cent, with 7.2 per cent annual growth and a $680,000 median. The regional unit market continues to offer comparative value against city equivalents in many locations, and that affordability advantage, combined with limited new supply in most regional centres, is supporting continued price appreciation. Whether that momentum holds through the second half of 2026 will depend considerably on how buyer sentiment responds to a rate environment that has now turned restrictive again.
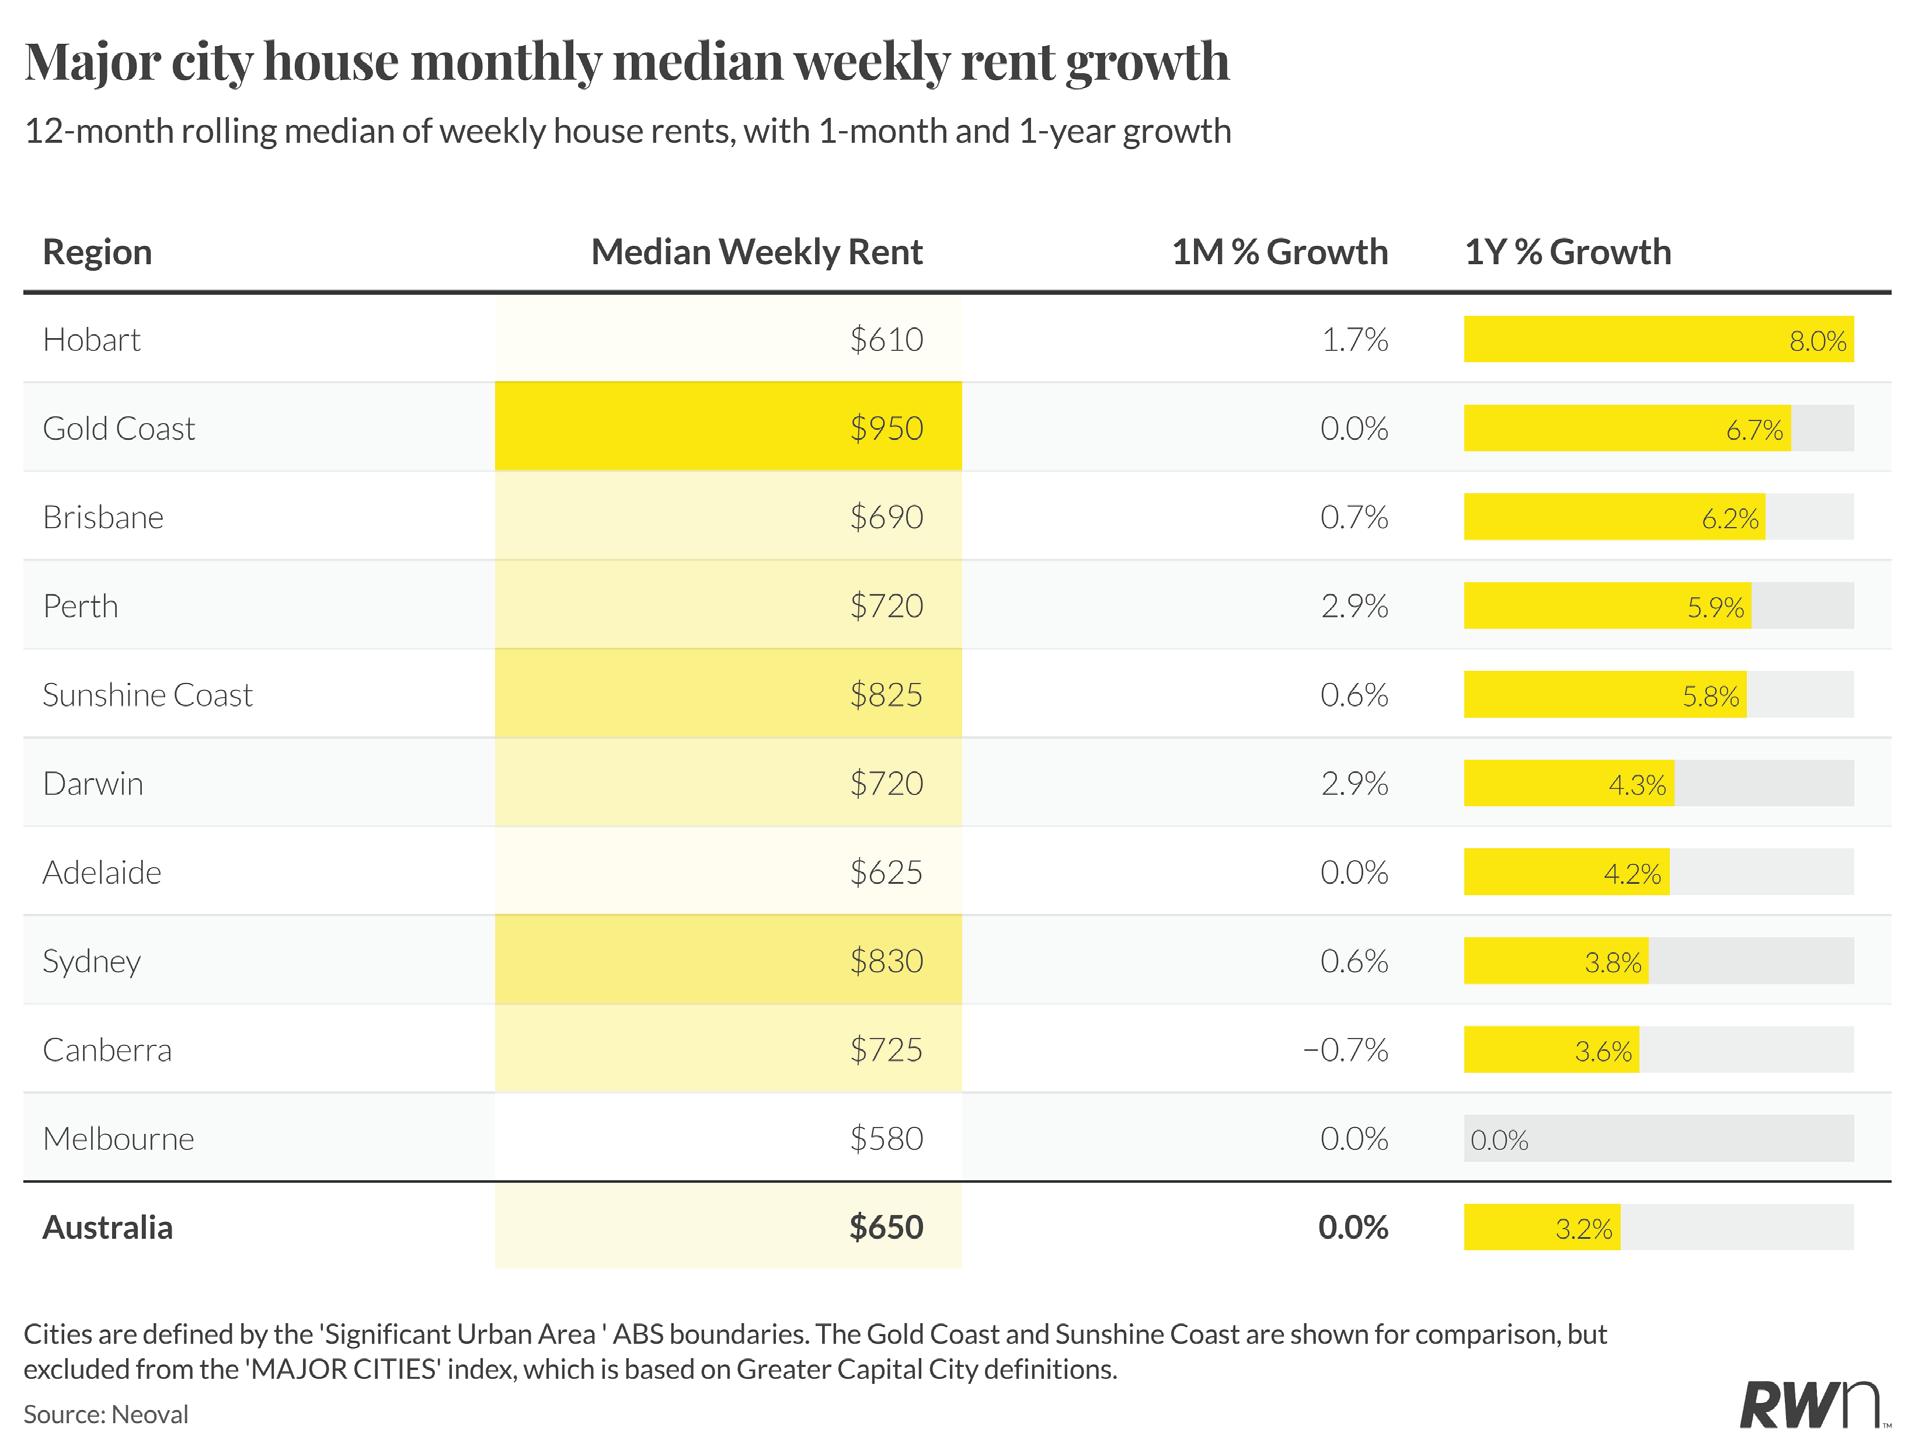
The national median weekly house rent held at $650 in April, unchanged over the month but 3.2 per cent above a year ago. While the headline figure looks stable, the city-level detail shows a market that is still moving in most locations. Hobart recorded the strongest annual growth at 8.0 per cent, reaching $610 per week, with a 1.7 per cent monthly increase that stands out across the capital cities. Perth and Darwin each posted 2.9 per cent monthly gains to reach $720 per week, reflecting ongoing demand pressure in markets where vacancy remains extremely tight. Brisbane rose 0.7 per cent for the month to $690, with 6.2 per cent annual growth, and Sydney edged up 0.6 per cent to $830.
Canberra was the only city to record a monthly decline, slipping 0.7 per cent to $725, while Melbourne and Gold Coast were flat for the month. Melbourne continues to stand apart as the only capital with zero annual house rent growth, a reflection of its comparatively higher vacancy rate relative to peers. The Gold Coast at $950 per week remains the most expensive house rental market among the cities shown, with 6.7 per cent annual growth. With the RBA having just lifted rates again and construction of new rental stock remaining constrained by both financing costs and materials pressures, any meaningful improvement in rental affordability looks unlikely over the near term.

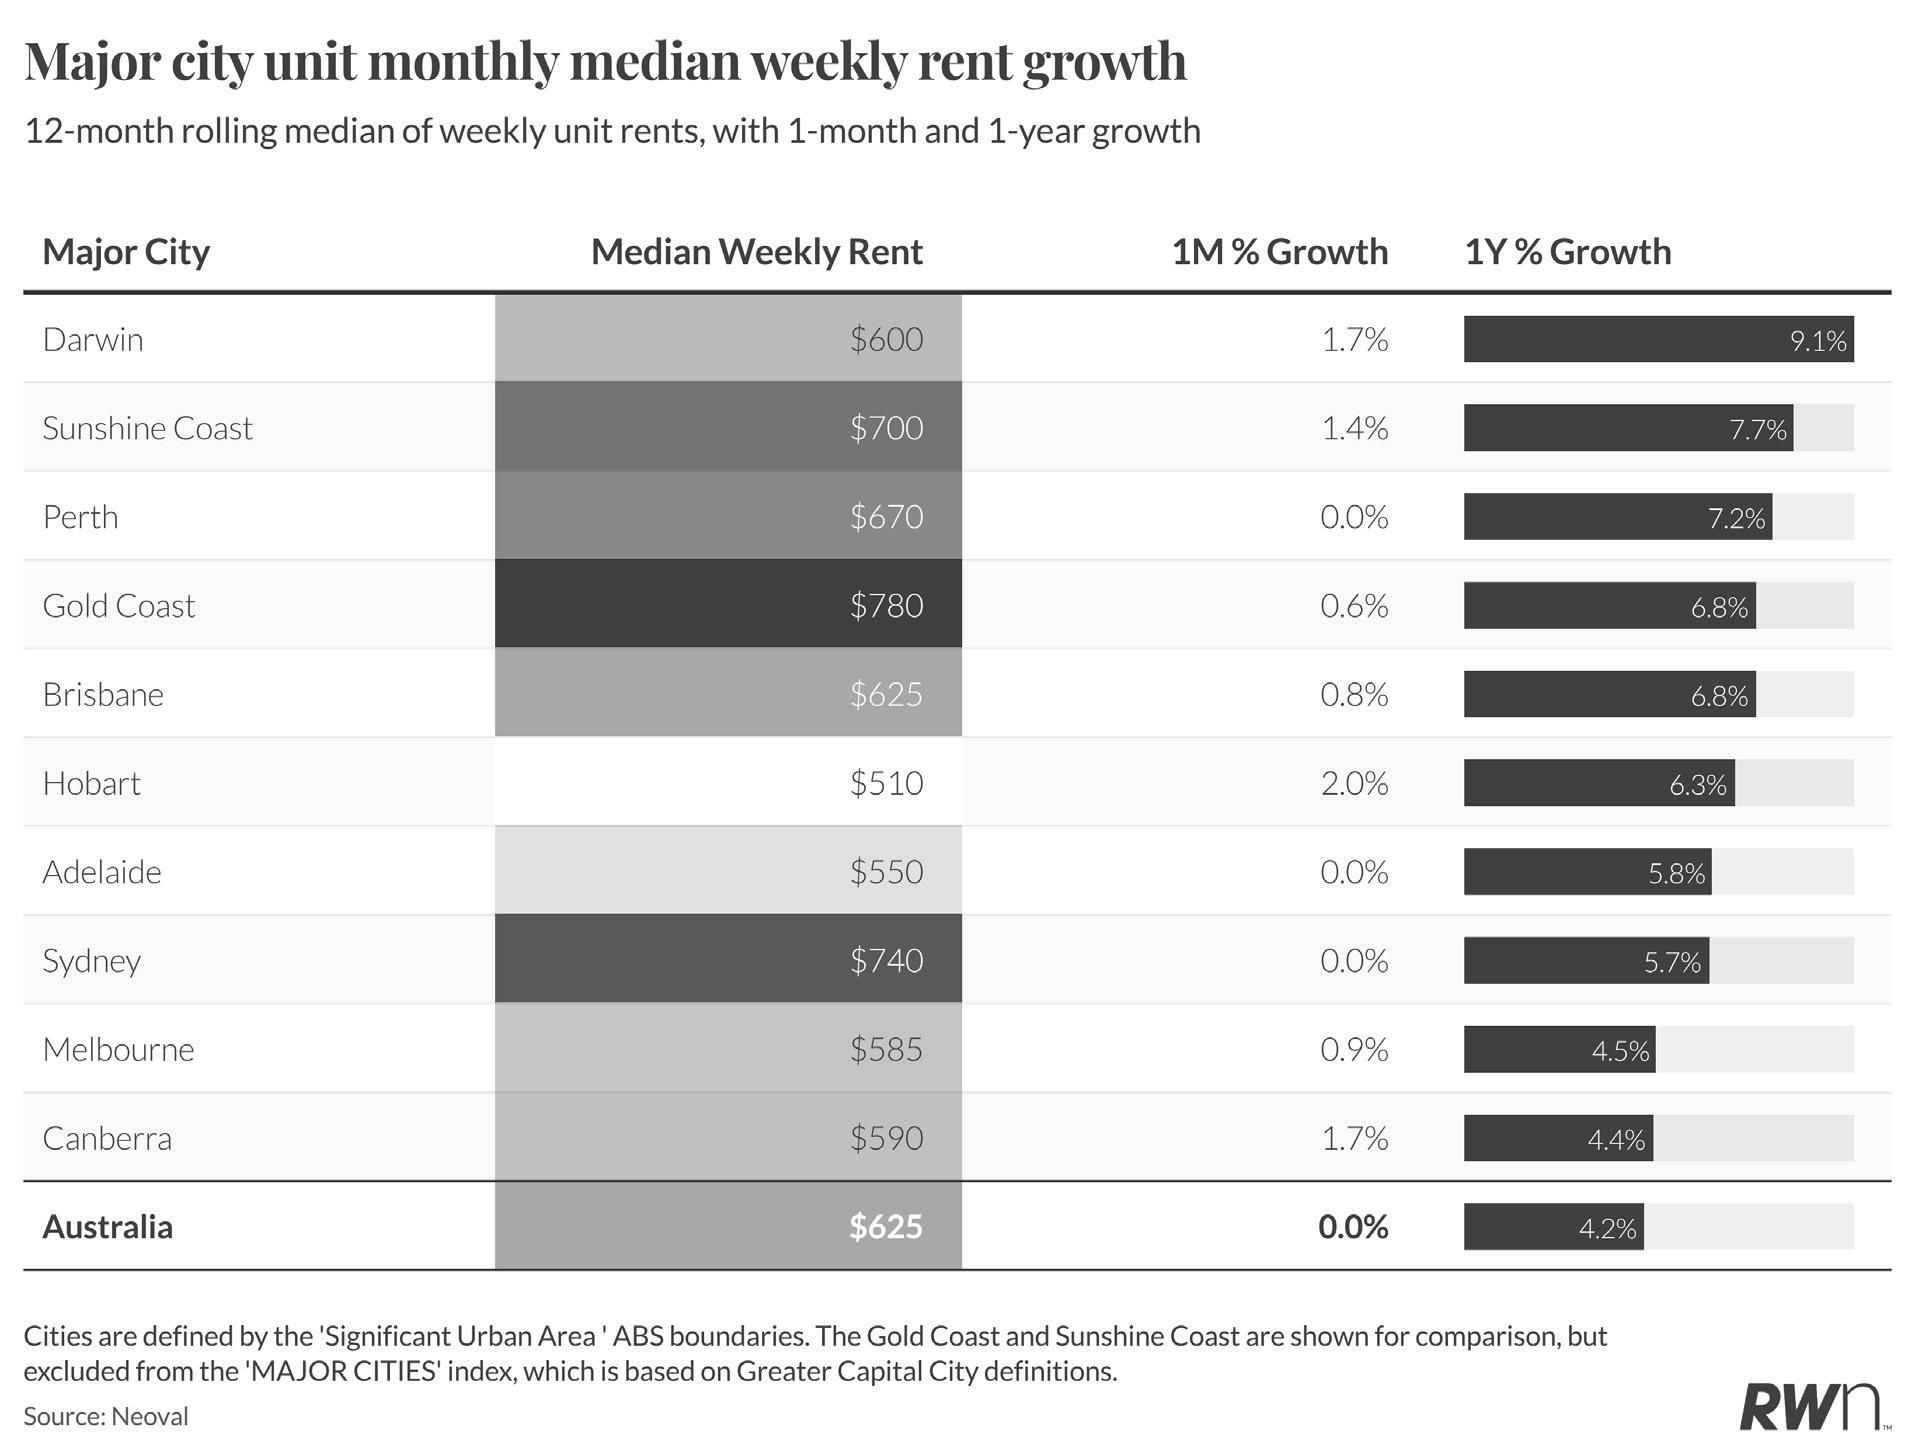
The national median weekly unit rent was unchanged over the month at $625, with annual growth of 4.2 per cent, a modest step-down from the 4.2 per cent recorded in March and consistent with a gradual easing in the pace of unit rent growth from the sharp rises seen in 2022 and 2023. Darwin recorded the strongest annual growth at 9.1 per cent, with rents reaching $600 per week and a solid 1.7 per cent monthly gain. The Sunshine Coast and Canberra also posted notable monthly increases of 1.4 per cent and 1.7 per cent respectively, though Canberra’s annual growth of 4.4 per cent remains relatively modest in that context.

Gold Coast unit rents reached $780 per week with 6.8 per cent annual growth, matching Brisbane’s annual rate exactly despite a considerably higher absolute rent level. Melbourne registered 0.9 per cent monthly growth to $585, though its annual gain of 4.5 per cent remains below most other capitals. Sydney at $740 per week was flat for the month with 5.7 per cent annual growth, still high in absolute terms but showing a clear deceleration in the pace of increases. Perth was also flat at $670, though its 7.2 per cent annual growth remains well above the national average, consistent with the ongoing supply tightness in that market. With vacancy rates across the capital cities remaining near historic lows, the conditions underpinning rental pressure have not changed materially, despite the slower monthly readings.
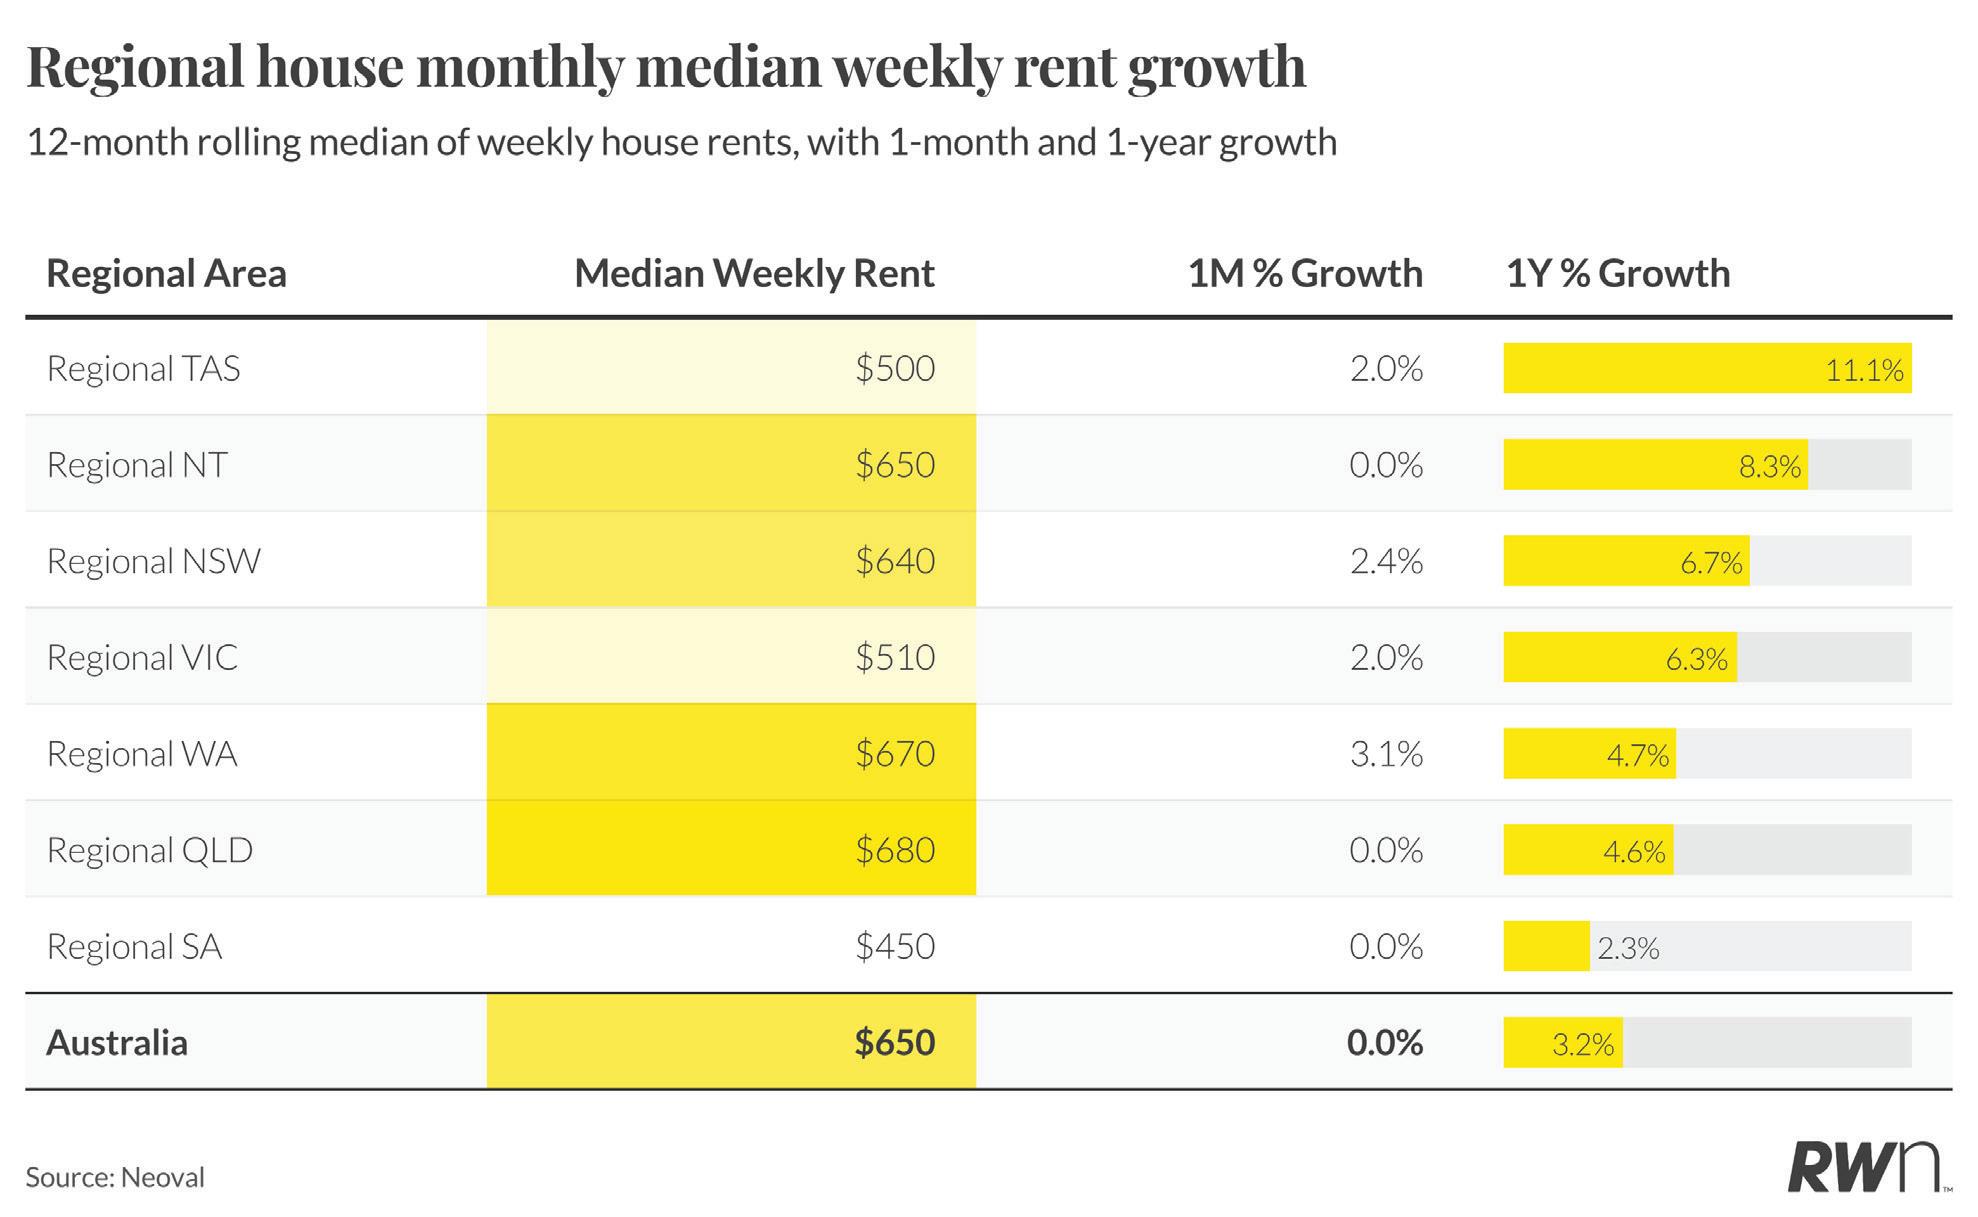
Regional house rents held flat nationally at $650 per week in April, with annual growth of 3.2 per cent. The monthly picture varies considerably across regions, with regional New South Wales and Victoria both recording 2.4 per cent and 2.0 per cent monthly gains respectively, among the stronger readings in recent months for those markets. Regional Tasmania also moved up 2.0 per cent over the month to $500 per week, with 11.1 per cent annual growth that places it well above every other regional market on a year-onyear basis. Regional Western Australia posted the largest monthly gain at 3.1 per cent, reaching $670 per week, though its annual growth of 4.7 per cent has moderated from the very strong readings seen earlier in this cycle.
Regional Queensland and regional Northern Territory were both flat for the month at $680 and $650 respectively, and regional South Australia held at $450 with just 2.3 per cent annual growth, the most subdued result across all regional markets. Regional Queensland’s 4.6 per cent annual growth and regional Northern Territory’s 8.3 per cent annual growth reflect continued demand in those areas from both lifestyle migration and resource sector employment. The key structural issue facing regional rental markets mirrors that of the capitals: new supply is not keeping pace with demand. With higher interest rates making new development less viable and construction costs remaining elevated, the outlook for meaningful supply addition in regional areas is limited, keeping upward pressure on rents even as the pace of monthly increases moderates.
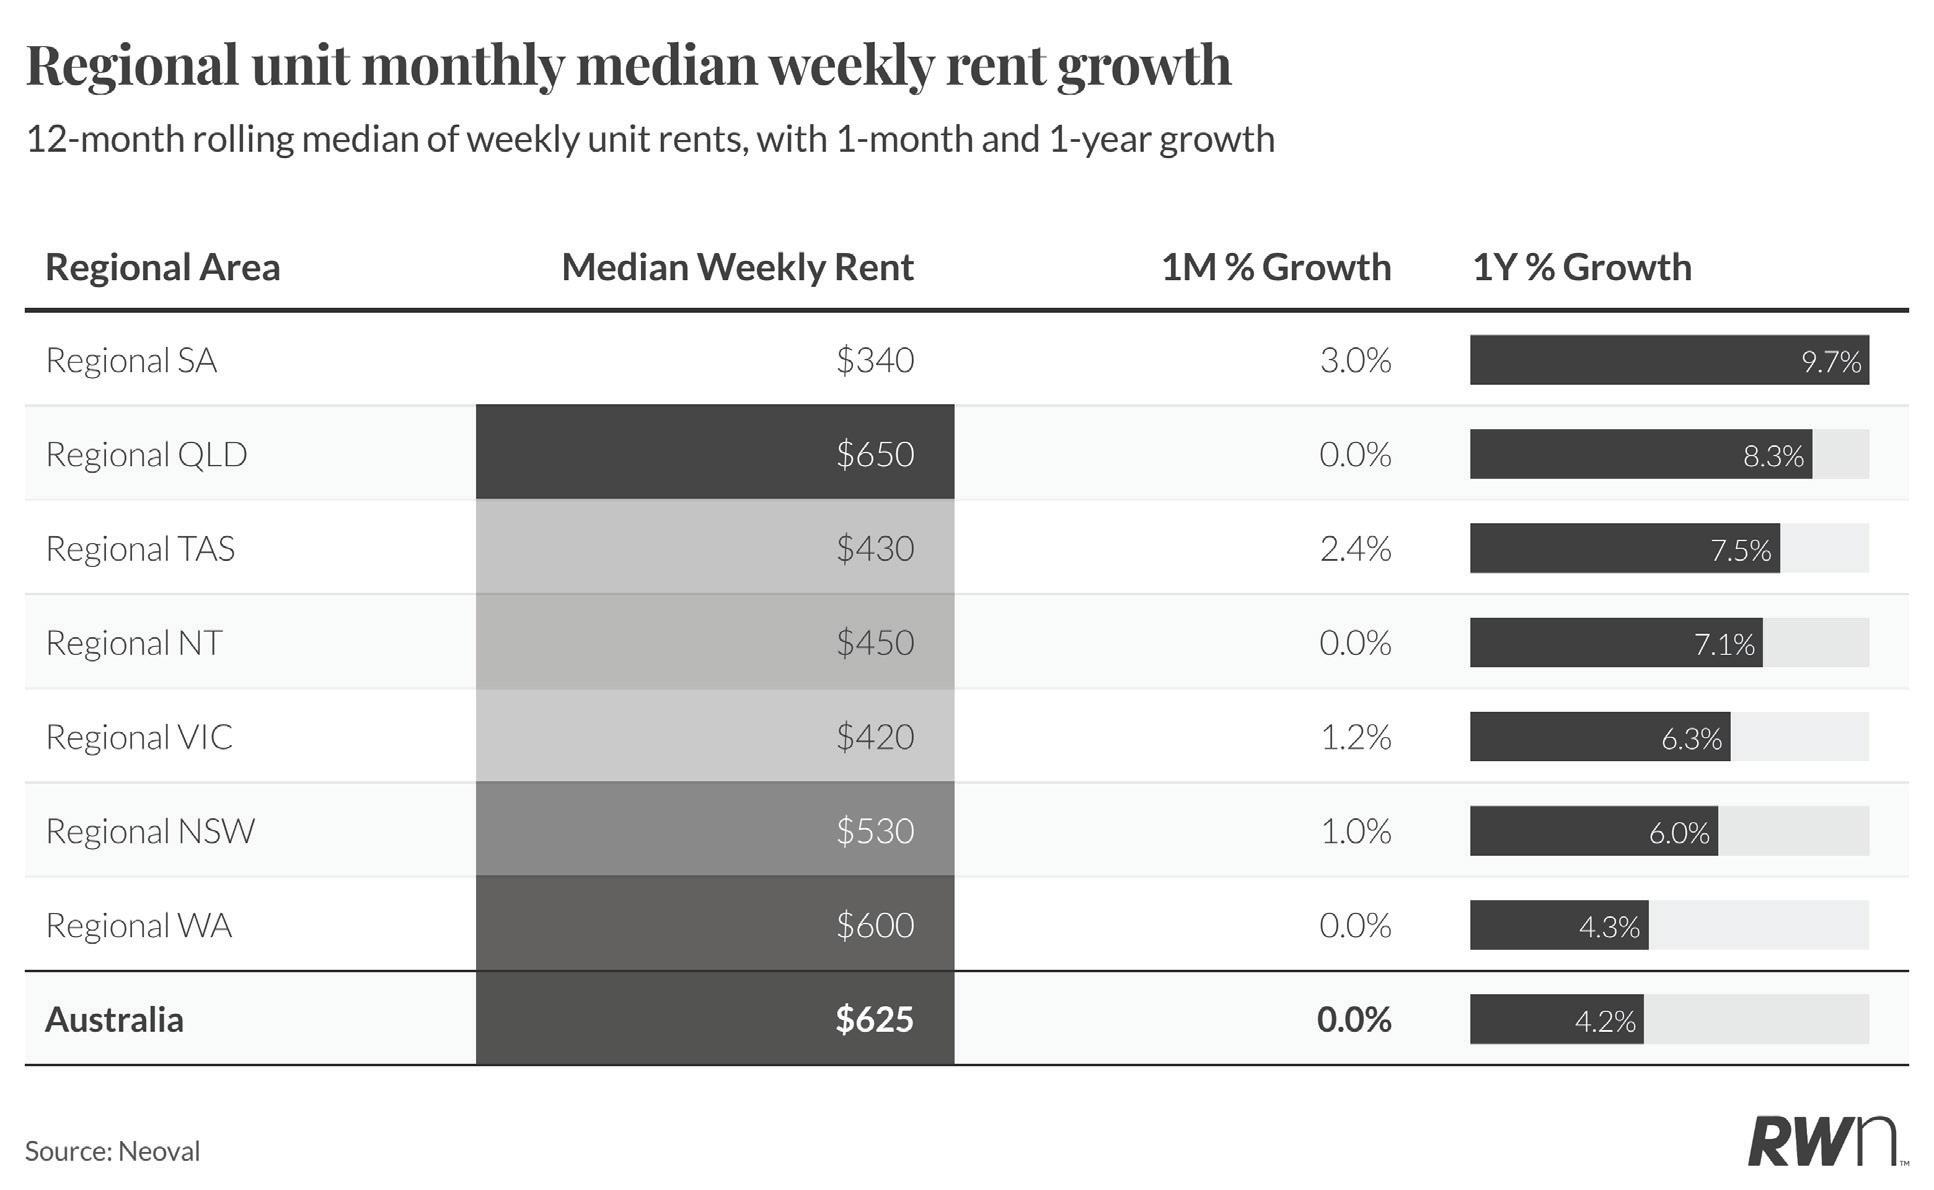
Regional unit rents were flat at the national level in April, with the Australian median holding at $625 per week and annual growth of 4.2 per cent. Regional South Australia led monthly growth at 3.0 per cent to reach $340 per week, and regional Tasmania followed with a 2.4 per cent monthly increase to $430. Regional Victoria and New South Wales also recorded positive monthly movement of 1.2 and 1.0 per cent respectively, showing that momentum in regional unit rents has not entirely stalled despite the softer national headline.
Regional Queensland carries the highest median weekly unit rent among the regions shown at $650, with 8.3 per cent annual growth, though it was flat for the month. Regional Northern Territory sits just below at $450 per week with 7.1 per cent annual growth, consistent with the resource-sector driven demand that has supported rents in that area. Regional Western Australia, despite its significant house price and rent growth over recent years, recorded no monthly movement in unit rents and the lowest annual growth across all regions at 4.3 per cent, a sign that this segment may be finding a natural ceiling in some areas as renters exhaust affordability limits. Overall, regional unit rent growth remains positive but is clearly moderating, and the addition of new supply will be necessary to prevent rents from re-accelerating as population pressures continue.
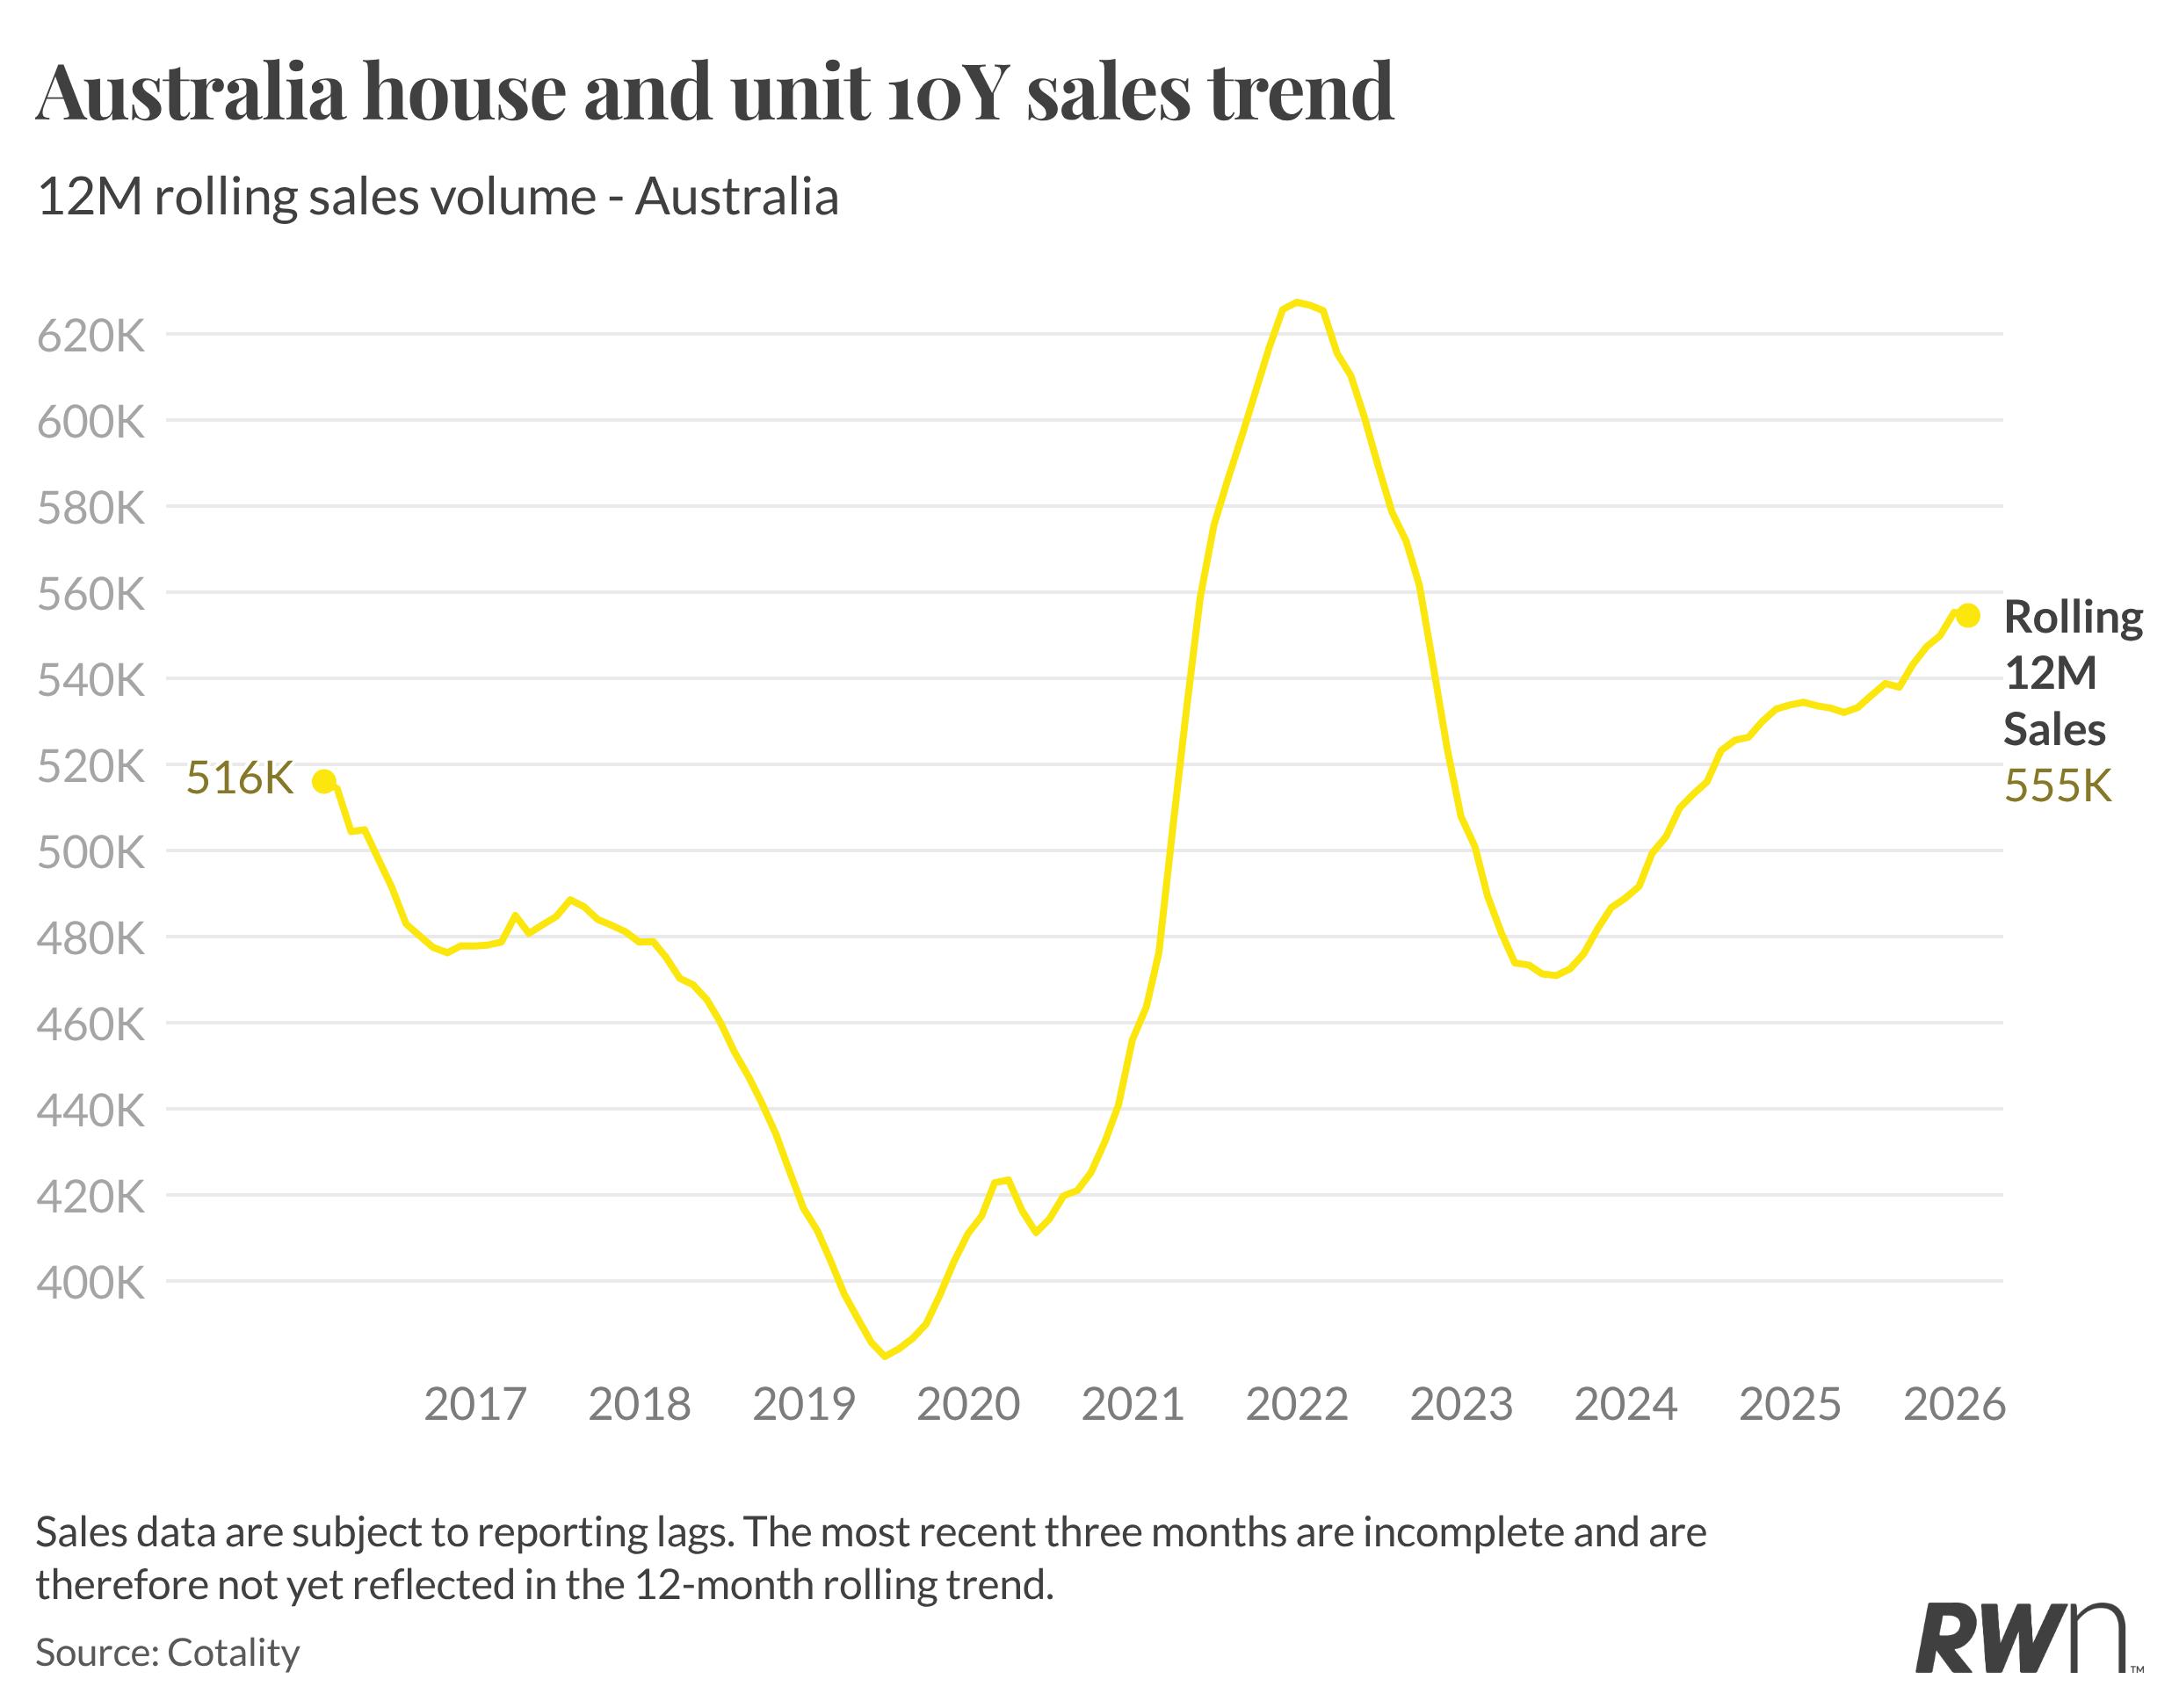
The 12-month rolling national sales volume reached 555,000 in April, continuing the steady recovery from the trough of approximately 472,000 recorded in early 2024. The longer-term chart places this in useful perspective: the current level sits meaningfully above the decade-opening figure of 516,000, and well above the lows of 2019 and the pandemic disruption period of 2020, though it remains a considerable distance from the extraordinary peak of around 630,000 transactions recorded through 2022 when record low interest rates drove a surge in activity.
The trajectory since mid-2024 has been consistently upward, supported by improving buyer confidence through the rate cut cycle that began in early 2025. However, the current environment introduces a genuine test for that momentum. The RBA’s May 2026 rate rise, the third tightening move since rates peaked
in late 2023, raises the prospect that transaction volumes could plateau or soften from here. When borrowing costs rise, some buyers defer decisions, and potential vendors who had been considering listing may hold back, reducing the pool of available stock even further. Given that the most recent three months of sales data remain subject to reporting lags, the current 555,000 read likely does not yet fully capture any change in behaviour following the February and March rate decisions. What the trend does confirm is that transaction activity has rebuilt to levels that broadly reflect a functioning market, but sustaining that recovery will depend on how households respond to a renewed tightening cycle against a backdrop of elevated inflation, high fuel costs, global uncertainty and softening consumer confidence.
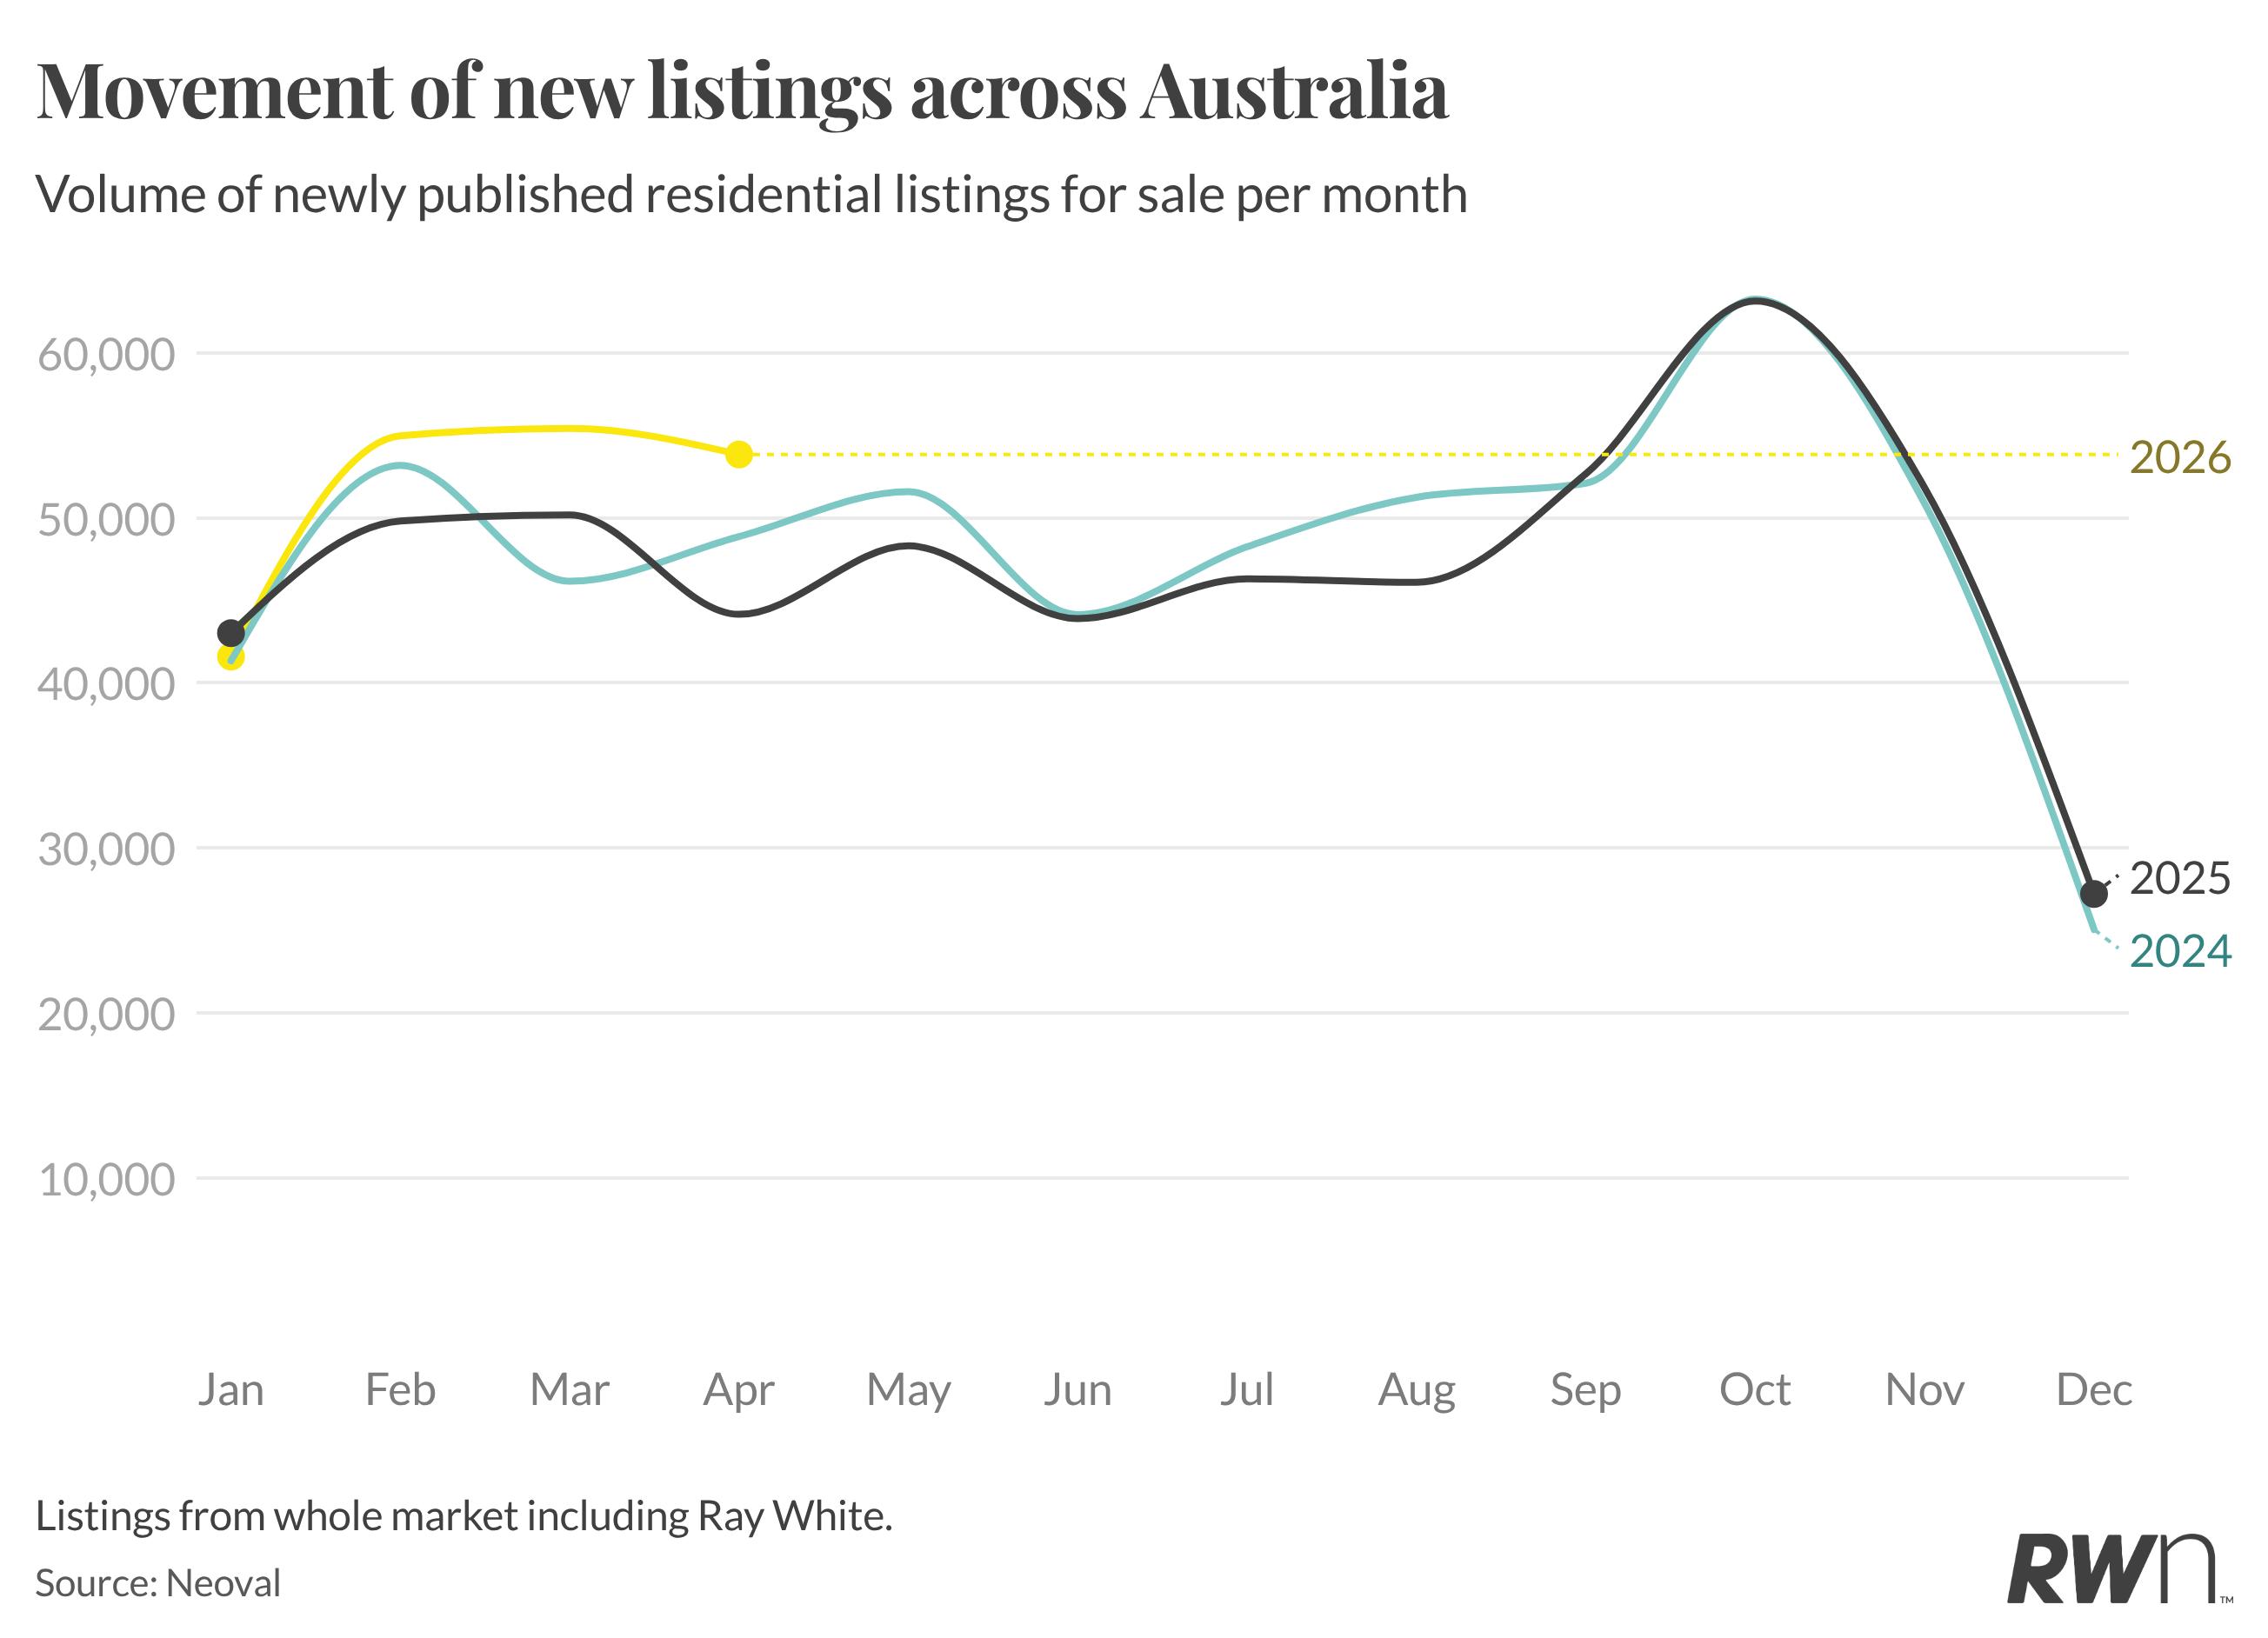
New listings totalled 53,835 in April 2026, a pullback from March’s 55,414 but still the second strongest April reading in the threeyear comparison, comfortably ahead of April 2024’s 48,859 and April 2025’s 44,145. The 2026 pattern through the first four months of the year has consistently outpaced both prior years: January came in at 41,587 versus 41,325 in 2024 and 43,008 in 2025, February reached 54,969 against 53,178 and 49,801 respectively, and March’s 55,414 similarly exceeded both benchmarks. This is a notable reversal from the supply shortfall that defined much of 2025, when listings ran persistently below 2024 levels through the peak spring and autumn periods.

The stronger listing environment through early 2026 reflects possible uncertainty surrounding upcoming budget announcements pertaining to capital gains tax and negative gearing. However, the April result, while solid in absolute terms and does represent a month-on-month easing, and the listing authorities data for April suggests the forward pipeline may moderate further in coming months. With the RBA having now raised rates three times in 2026 and consumer confidence sitting at very weak levels, some vendors who had planned to list through the winter and into spring may reassess their timing. Buyers currently have more choice than at any point in the past two years, but the durability of that improved supply will depend on how vendor sentiment holds as the economic outlook becomes increasingly uncertain.
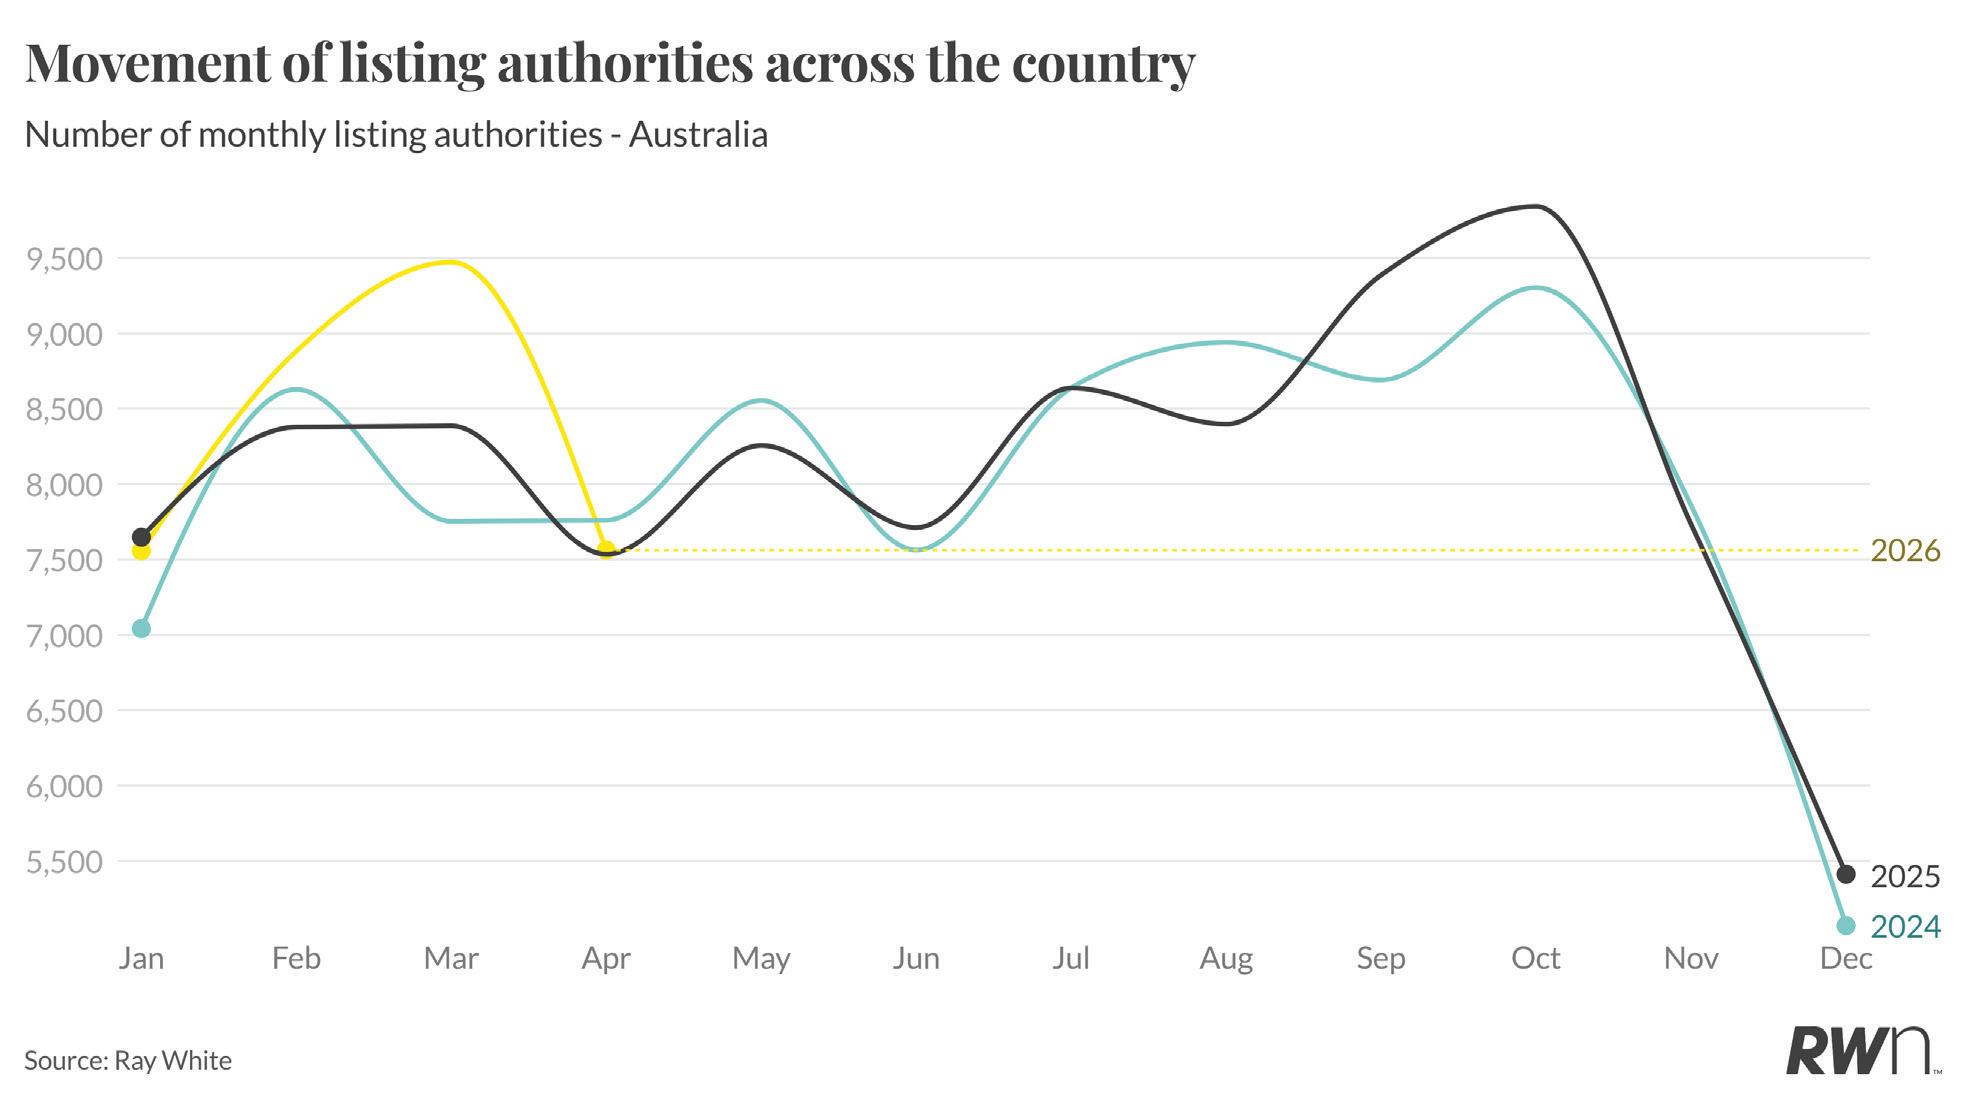
Ray White listing authorities reached 7,561 in April 2026, a step back from March’s 9,473, which was the strongest month so far this year and well above the equivalent months in both 2024 (7,760) and 2025 (7,533). The March result had been a notable high point, suggesting a brief surge in vendor confidence through the autumn period. April’s pullback to 7,561 sits broadly in line with April 2024’s 7,760, though it represents a meaningful easing from where March had positioned the pipeline. The February result of 8,882 was also strong by historical comparison, tracking above both February 2024 (8,628) and February 2025 (8,378), suggesting the early part of 2026 carried genuine vendor momentum before April’s moderation.
The timing of April’s softer reading is notable. The RBA’s May rate decision, delivering a further 25 basis point increase, had been flagged in financial markets for some weeks prior, and the shift in sentiment around borrowing costs may have been sufficient to give some potential vendors cause to pause. Listing authorities are a forward-looking indicator of supply coming to market, and with 2026 now running a three-rate-rise environment, the conditions that drove strong vendor activity through much of 2025 have changed. The seasonal pattern typically sees authorities build toward winter before the spring surge, and how vendors respond to the current macro environment over May and June will be an important signal for the supply outlook heading into the second half of 2026.
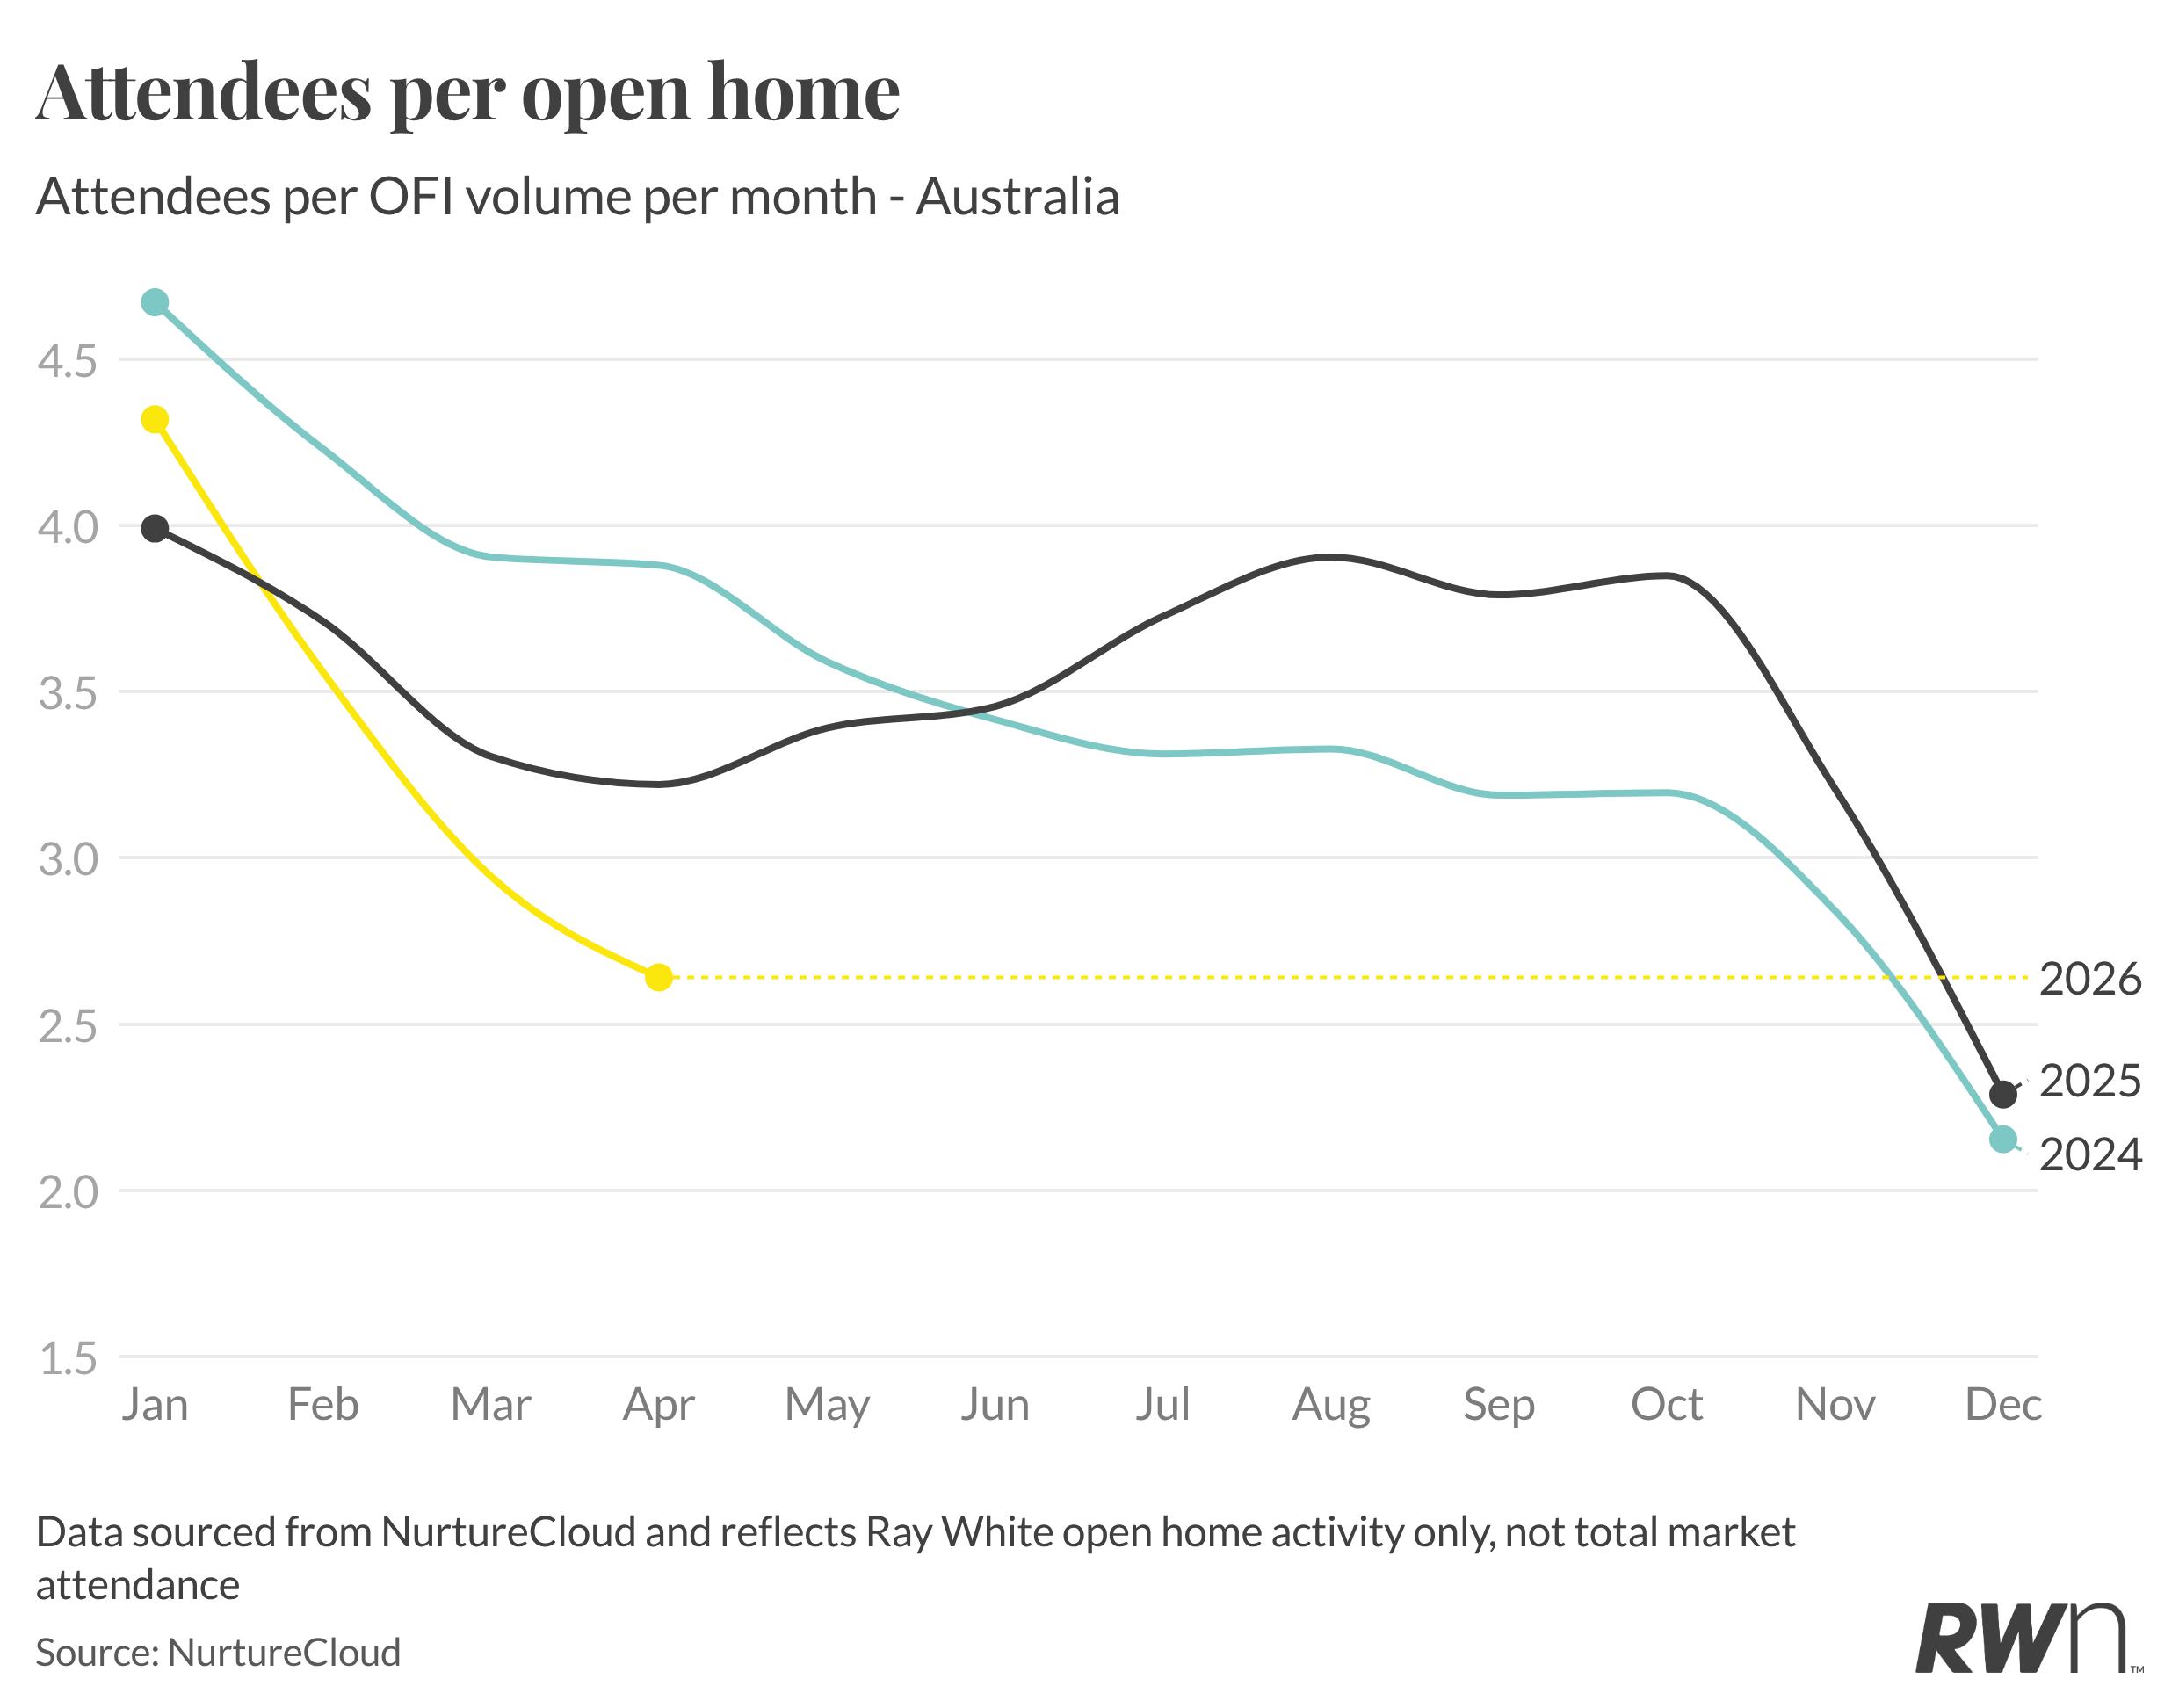
Open home attendance averaged 2.64 people per inspection in April, continuing the steady decline that has played out across the first four months of 2026. January started the year at 4.32, well above both January 2025 (3.99) and January 2024 (4.67), suggesting genuine buyer momentum coming into the year. That early strength has unwound quickly, February came in at 3.56, March at 2.94, and April’s 2.64 now sits below both equivalent months in 2025 (3.22) and 2024 (3.88). The trajectory is a clear signal that buyer enthusiasm has softened materially through the autumn period.
The timing of this deterioration aligns with the accumulation of headwinds facing households. The RBA’s February and March rate rises were the first tightening move in some time, and its impact on buyer confidence appears to have compounded through subsequent months, with the May rate decision likely adding further pressure. Elevated fuel prices, weaker consumer sentiment and broader global uncertainty have all weighed on the willingness of buyers to actively engage with the market. The April result, while the lowest reading for that month across the three years shown, does not yet necessarily indicate buyers have exited, attendance can recover quickly when conditions shift. But with more listings available than a year ago and fewer people through each open home, the balance of negotiating power between vendors and buyers is shifting in a way that has not been seen for some time.
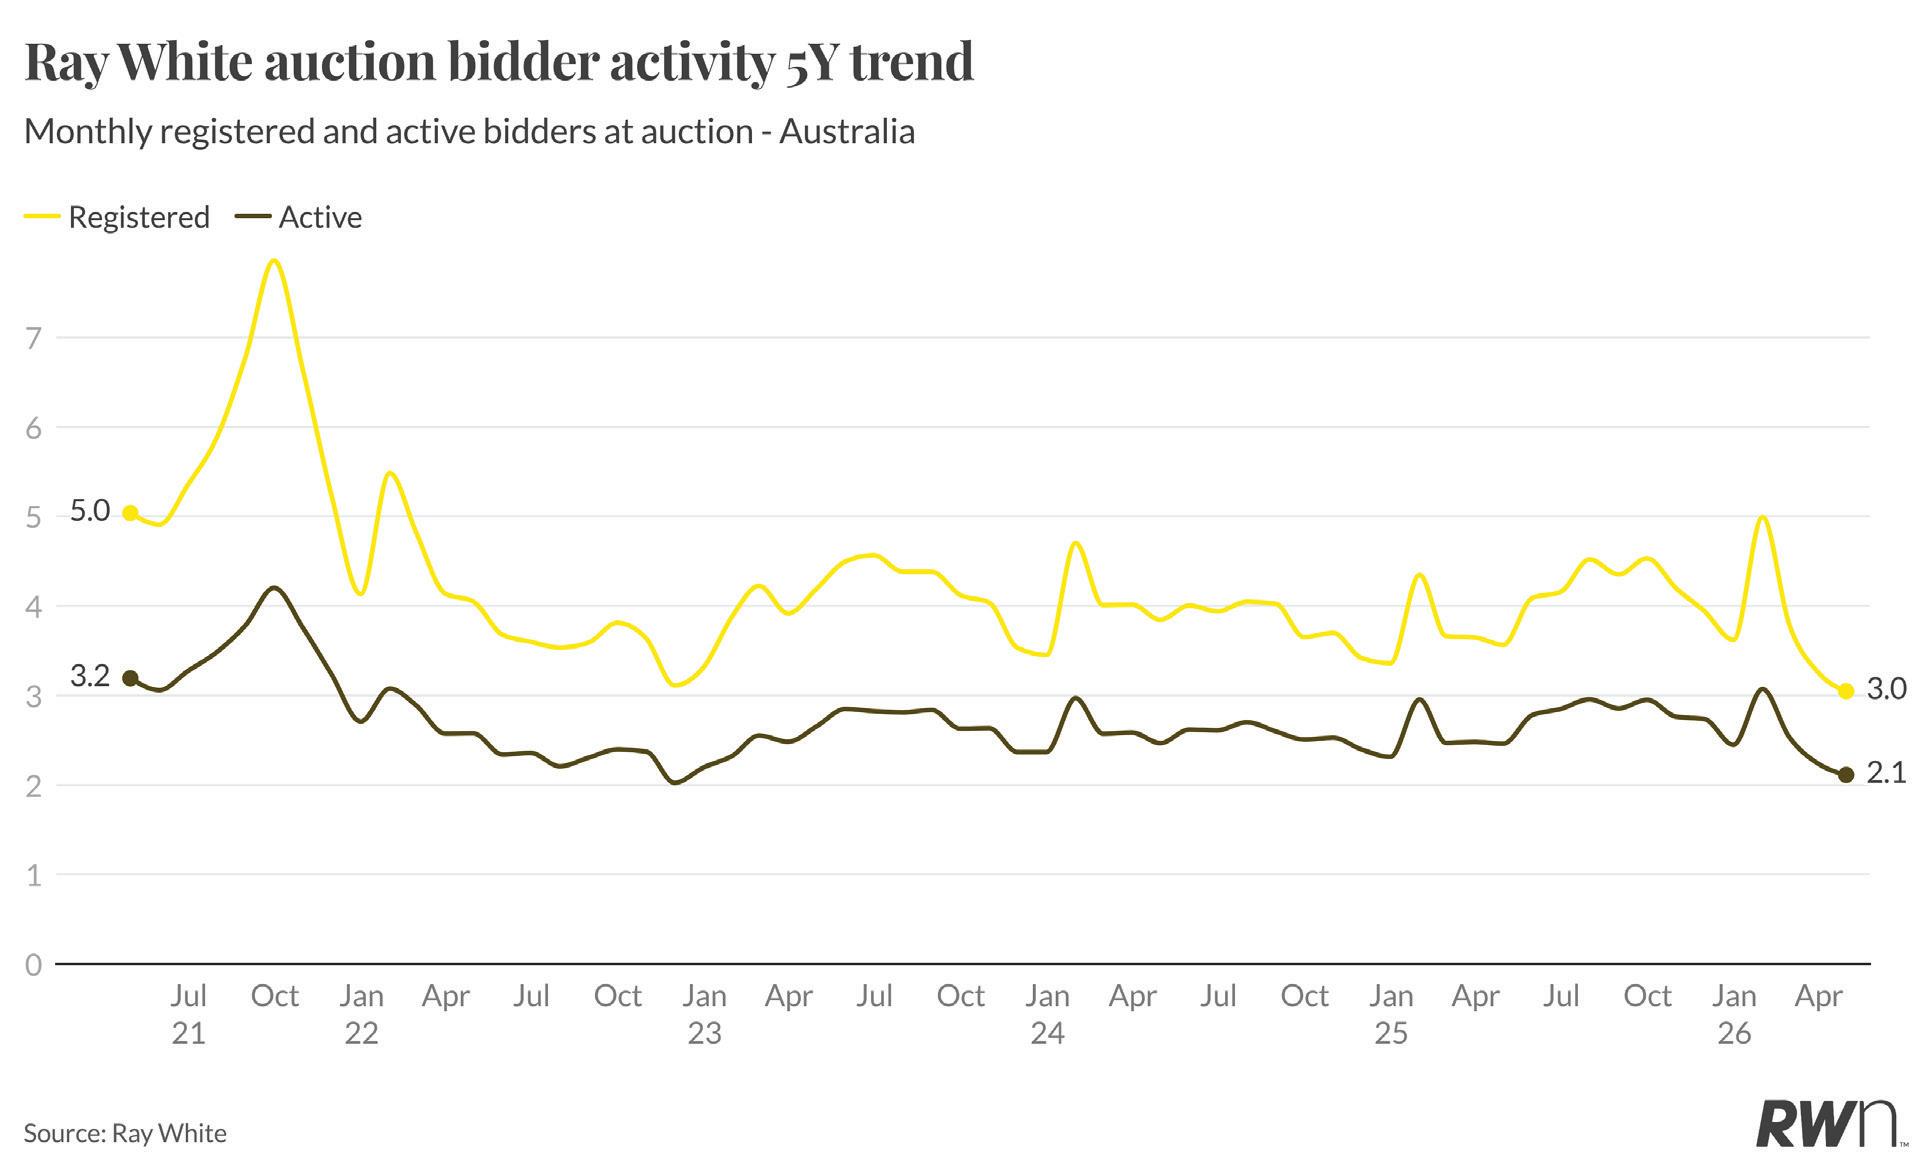
Registered bidders averaged 3.0 per auction in April, with active bidders at 2.1, both sitting at or near the lower end of the range that has prevailed since the market normalised after the pandemic-era peak. The five-year chart contextualises where the market currently sits: the extraordinary spike in registered bidders through late 2021 and early 2022, when the combination of record low rates and pandemic demand drove numbers well above 7.0, has long since unwound. Since mid-2022, both metrics have tracked within a relatively narrow band, with registered bidders generally ranging between 3.5 and 5.0 and active bidders between 2.3 and 3.2.
April’s readings fall below the lower end of those recent ranges, consistent with the weaker open home attendance and declining clearance rate seen this month. The gap between registered and active bidders, 3.0 versus 2.1, reflects that while some buyers are still attending auctions and registering to bid, fewer are choosing to actively compete. That hesitancy is a natural response to a renewed tightening cycle. Whether bidder numbers recover through May and June will depend considerably on how the market digests the backto-back rate rises, and whether confidence begins to stabilise as buyers adjust their expectations to the new rate reality.
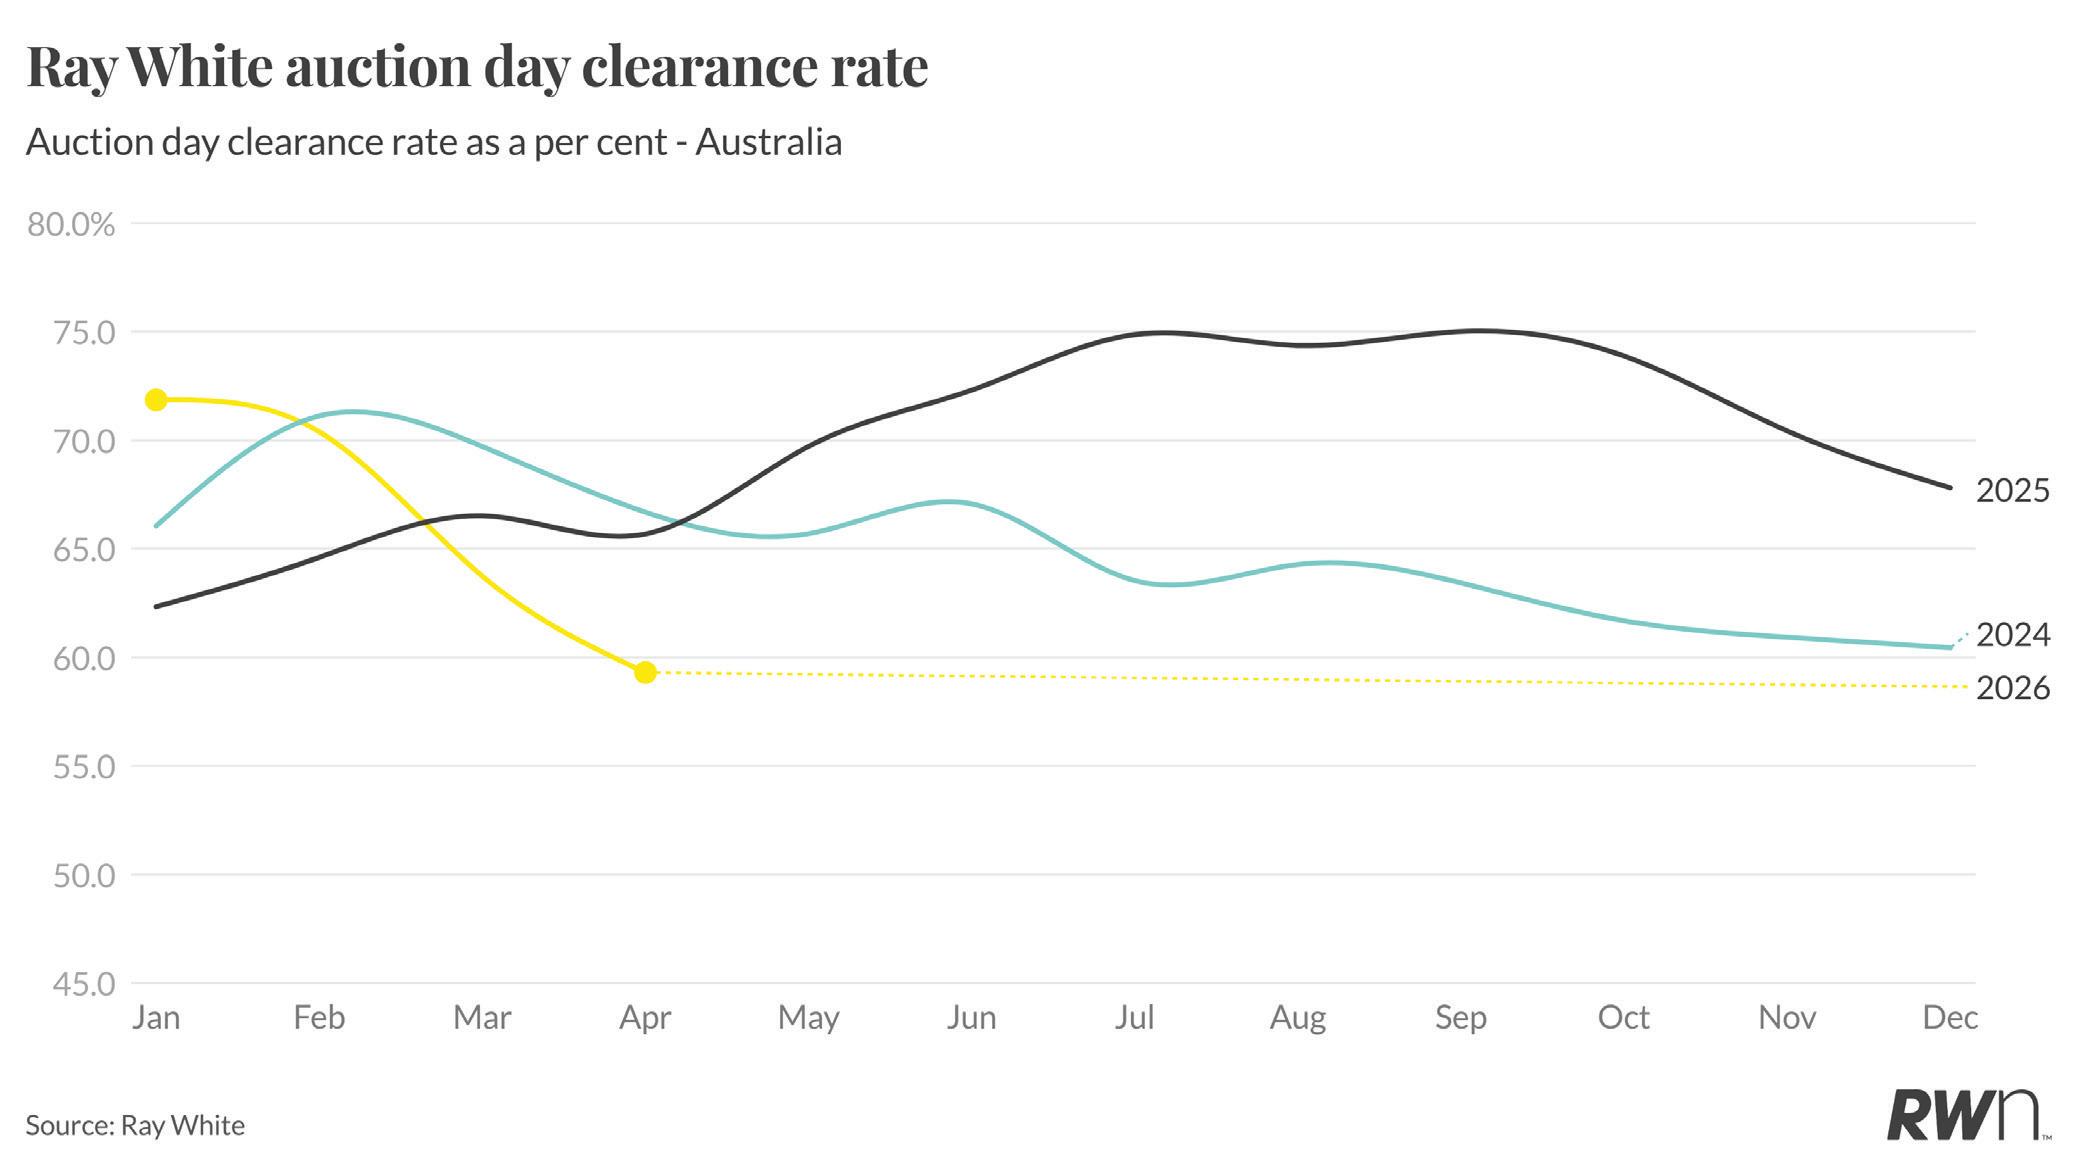
Ray White’s national auction day clearance rate came in at 59.3 per cent in April, a meaningful decline from March’s 63.7 per cent and February’s 70.4 per cent, and the lowest monthly reading recorded in 2026 to date. The comparison with prior years is stark: April 2025 achieved 65.7 per cent and April 2024 reached 66.7 per cent, placing the current result approximately six to seven percentage points below both equivalents.

January and February 2026 had opened the year strongly, January’s 71.9 per cent was well above both prior years, but the subsequent fall through March and April has been pronounced and consistent.
The step down in clearance rates mirrors what is visible in open home attendance and bidder activity: buyer participation is easing as affordability pressures compound. A clearance rate of 59.3 per cent indicates that a meaningful share of properties taken to auction in April did not sell on the day, giving vendors an important signal that pricing expectations may need to be recalibrated in some markets. The recent rate rises has already introduced caution; with the May increase now also delivered, the clearance rate environment heading into winter is likely to remain under pressure. Markets that have been most sensitive to rate settings, Sydney, Melbourne and Canberra in particular, are likely to account for much of the weakness, while stronger fundamentals in supply-constrained markets may provide some floor.
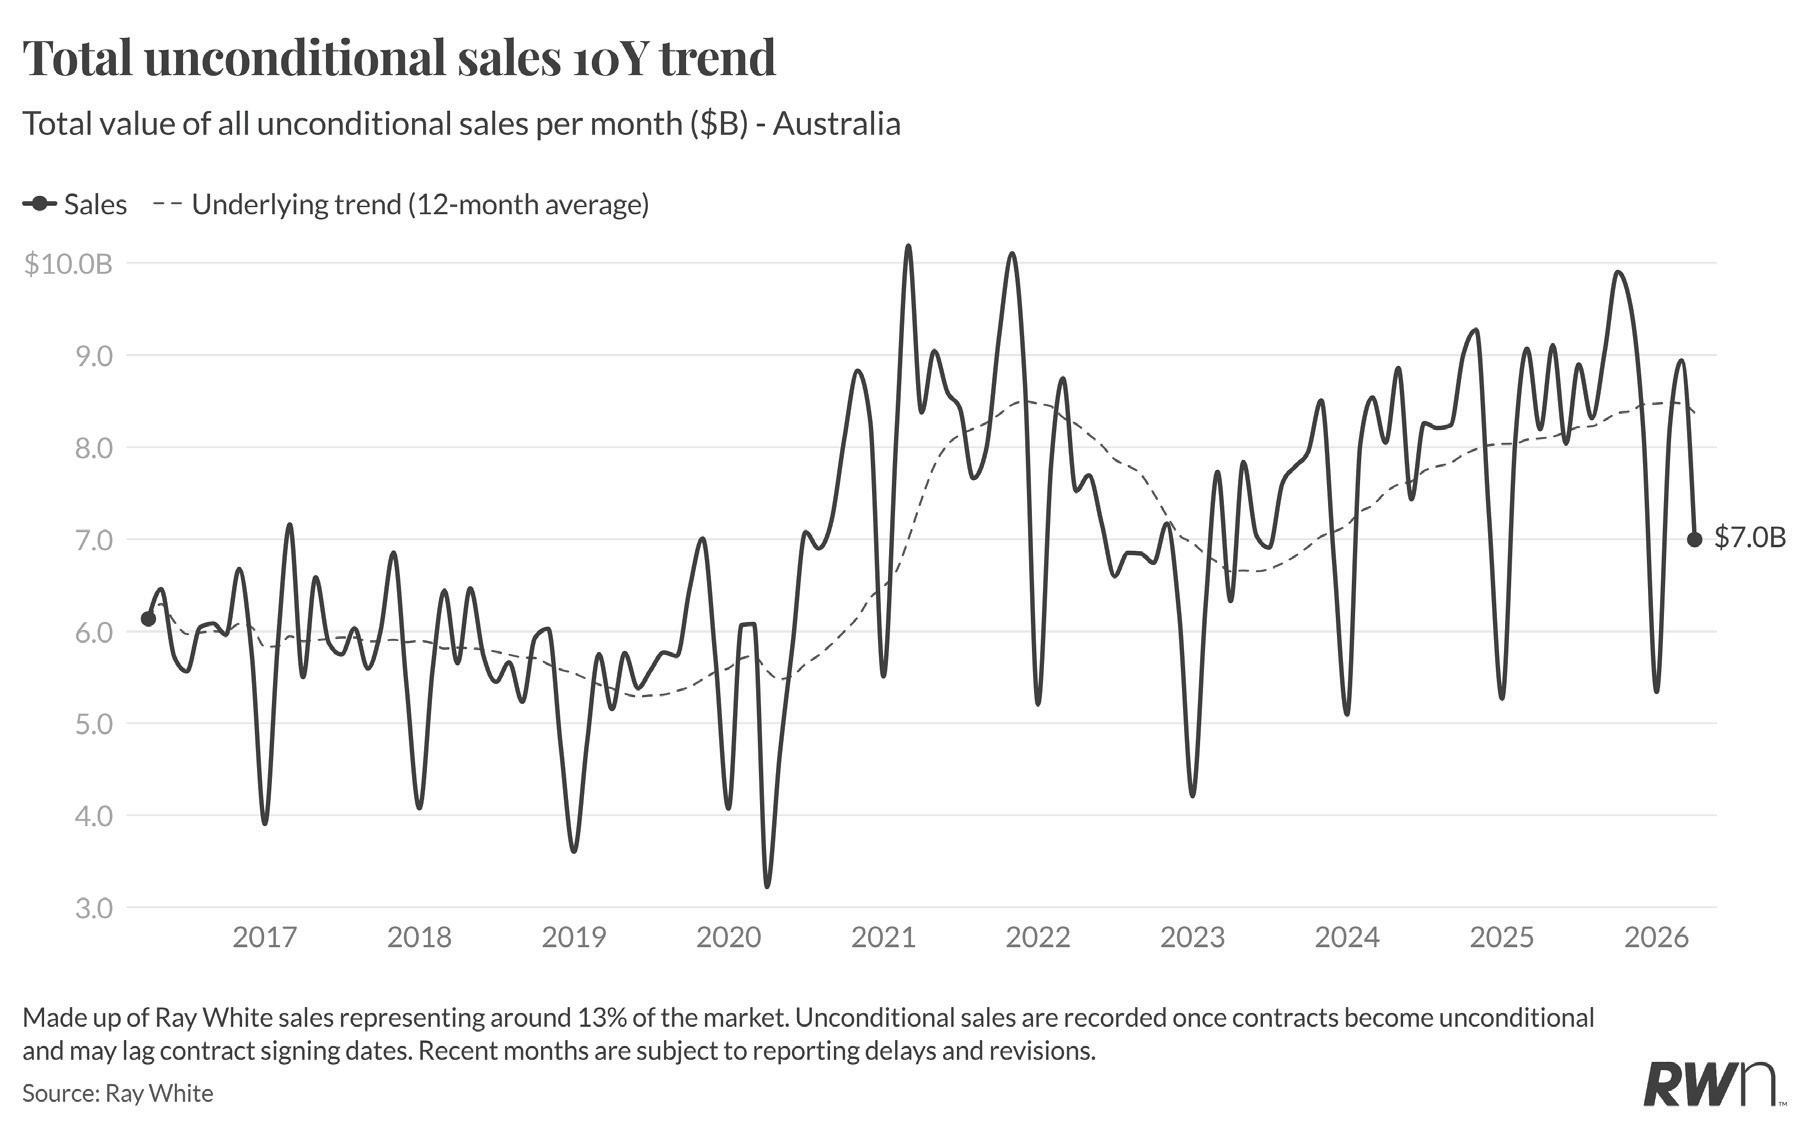
Ray White unconditional sales reached $7.0 billion in April, a pullback from the $9.0 billion recorded in March and consistent with the seasonal easing that typically follows the peak autumn weeks. The 12-month underlying trend line, which irons out the considerable month-to-month volatility in this series, sits at approximately $8.5 billion, well above the pre-pandemic average of around $6 billion and the highest sustained level in the 10-year history of this data. That context matters: even at $7.0 billion, April’s result is not out of character for this point in the year, and the underlying trend remains structurally elevated relative to any prior period.
What the chart does reflect, read alongside the softer open home, bidder and clearance rate data this month, is a market where the pace of activity is easing from
its recent highs. The near-$10 billion peak recorded in late 2025 and early 2026 was built on strong buyer confidence during a rate-cutting environment, conditions that have since reversed. With three rate rises now delivered in 2026, escalating fuel costs flowing from Middle East conflict, and consumer confidence at historically weak levels, buyers and vendors are understandably more cautious. The underlying trend will be the key number to watch over the next several months. If it begins to drift lower, it would signal a genuine step-down in market activity rather than a temporary seasonal pause.