
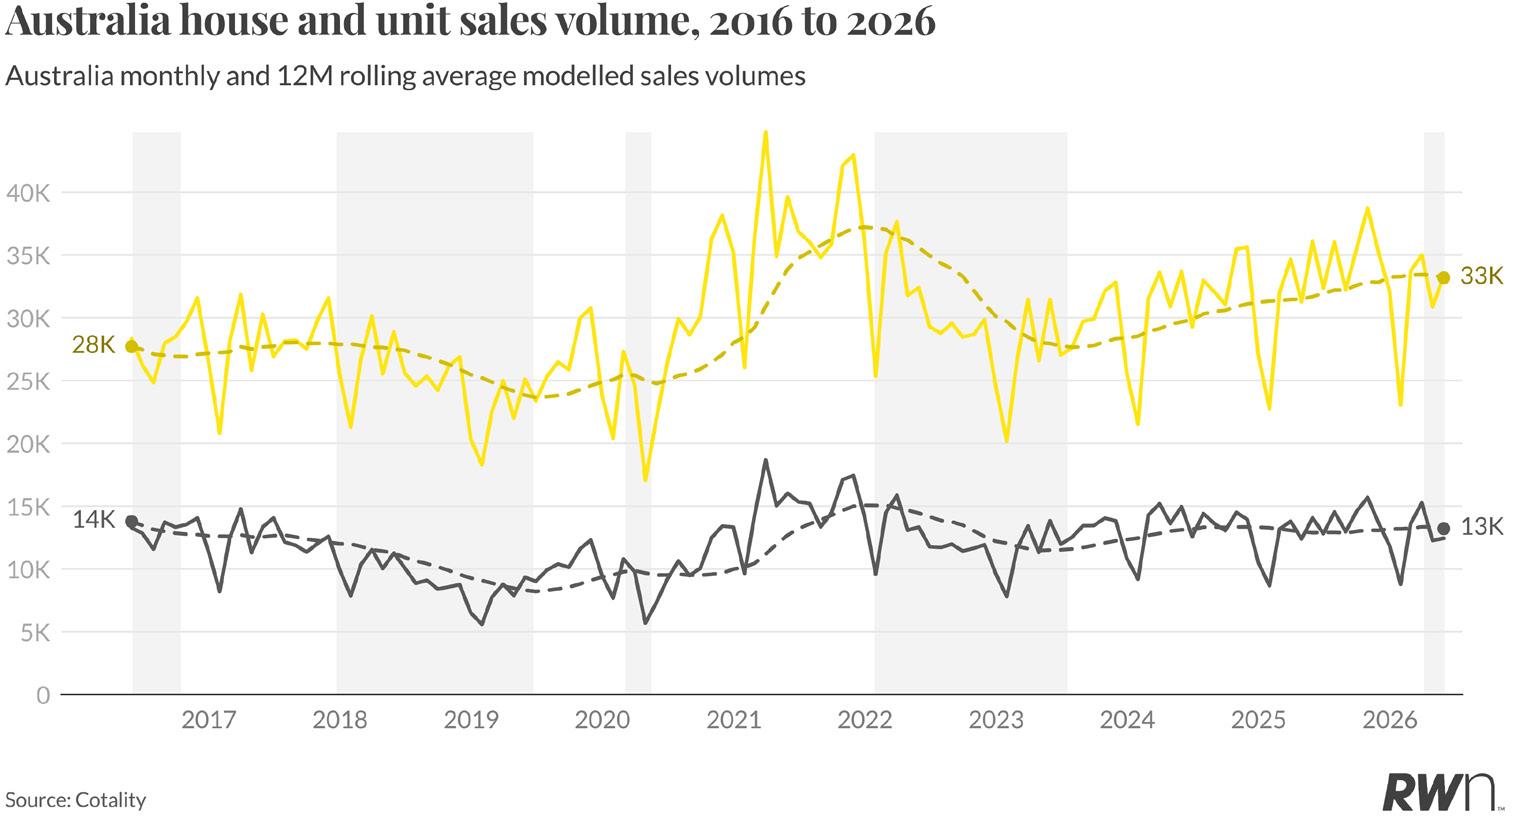
Australia’s national house sales volumes reached 33,368 in May 2026, with unit sales at 12,446 for the month. The 12-month rolling average for houses sits at 33,186 and for units at 13,209, both series holding at levels broadly consistent with the past two years. The house rolling average has continued its gradual upward drift since the 2023 trough, a reminder that the market’s structural underpinnings of strong population growth, limited supply and high construction costs have not changed materially. However, the month-on-month picture is less straightforward. May’s house volume is up from April’s 30,860 but notably below the 34,998 recorded in March, and the combination of three consecutive RBA rate increases this year, the Federal Budget’s confirmation of changes to negative gearing and capital gains tax (CGT), and weak consumer confidence has introduced a clear layer of caution.
Unit volumes at 12,446 remain stable within the recent range but have lost the upward momentum seen through the second half of 2025, when monthly figures were consistently tracking above 13,000. April’s unit result of 12,261 was the softest monthly reading since January’s post-holiday trough of 8,783, suggesting some hesitation is creeping into that segment. Some of the monthly softening reflects the post-budget pause in investor decision-making, with many buyers and sellers sitting tight while the implications of the new tax settings become clearer.
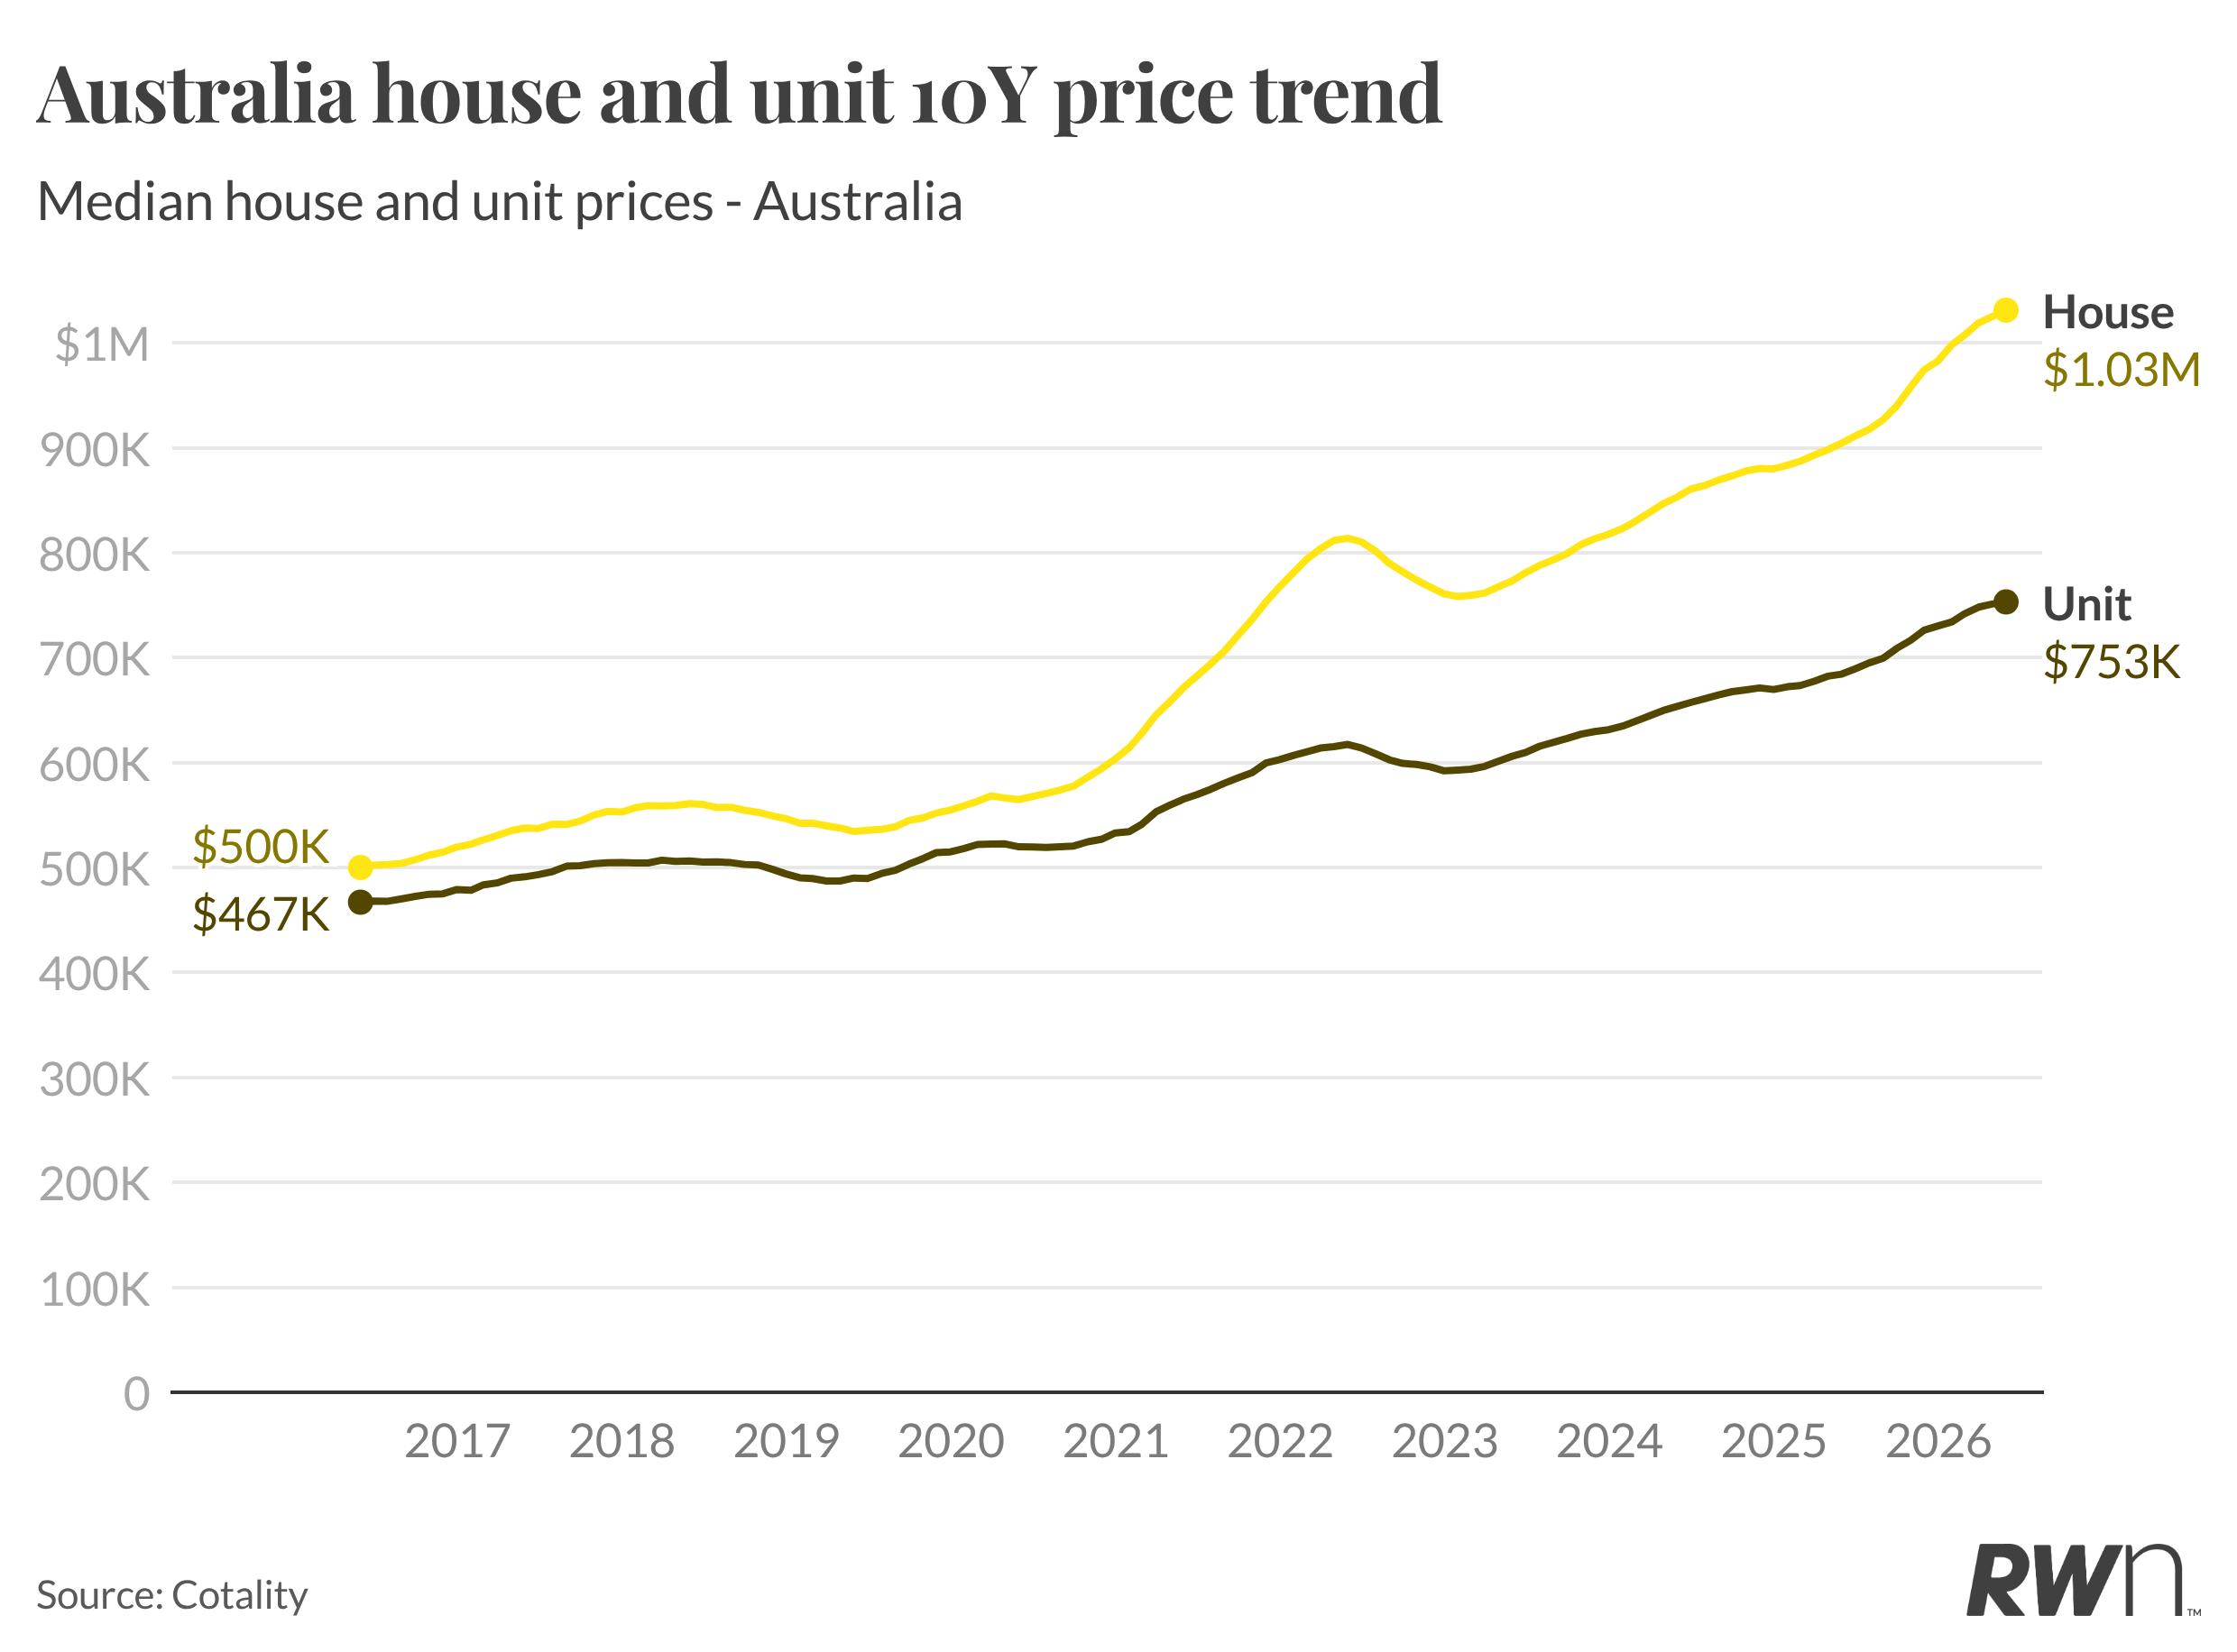
The national median house price has reached $1.03 million, holding at the milestone first crossed in late 2025 and recording no growth over the month. Units sit at $753,000, up 0.3 per cent for the month and 7.3 per cent over the year. The ten-year chart tells the story of both series having more than doubled since 2016, but the pace of growth is now visibly reduced compared to the sharp acceleration of 2020 to 2022.
The monthly stable result for houses is not surprising in the current environment. Three rate rises have progressively reduced borrowing capacity, and the Federal Budget’s announcement on negative gearing and CGT has added a degree of policy uncertainty that is weighing on both buyer and investor sentiment. Prices are not falling at the national level, but the momentum that defined 2025’s second half has materially eased. Units are holding up slightly better on annual terms, partly driven by affordability constraints pushing buyers toward the lower-priced segment.
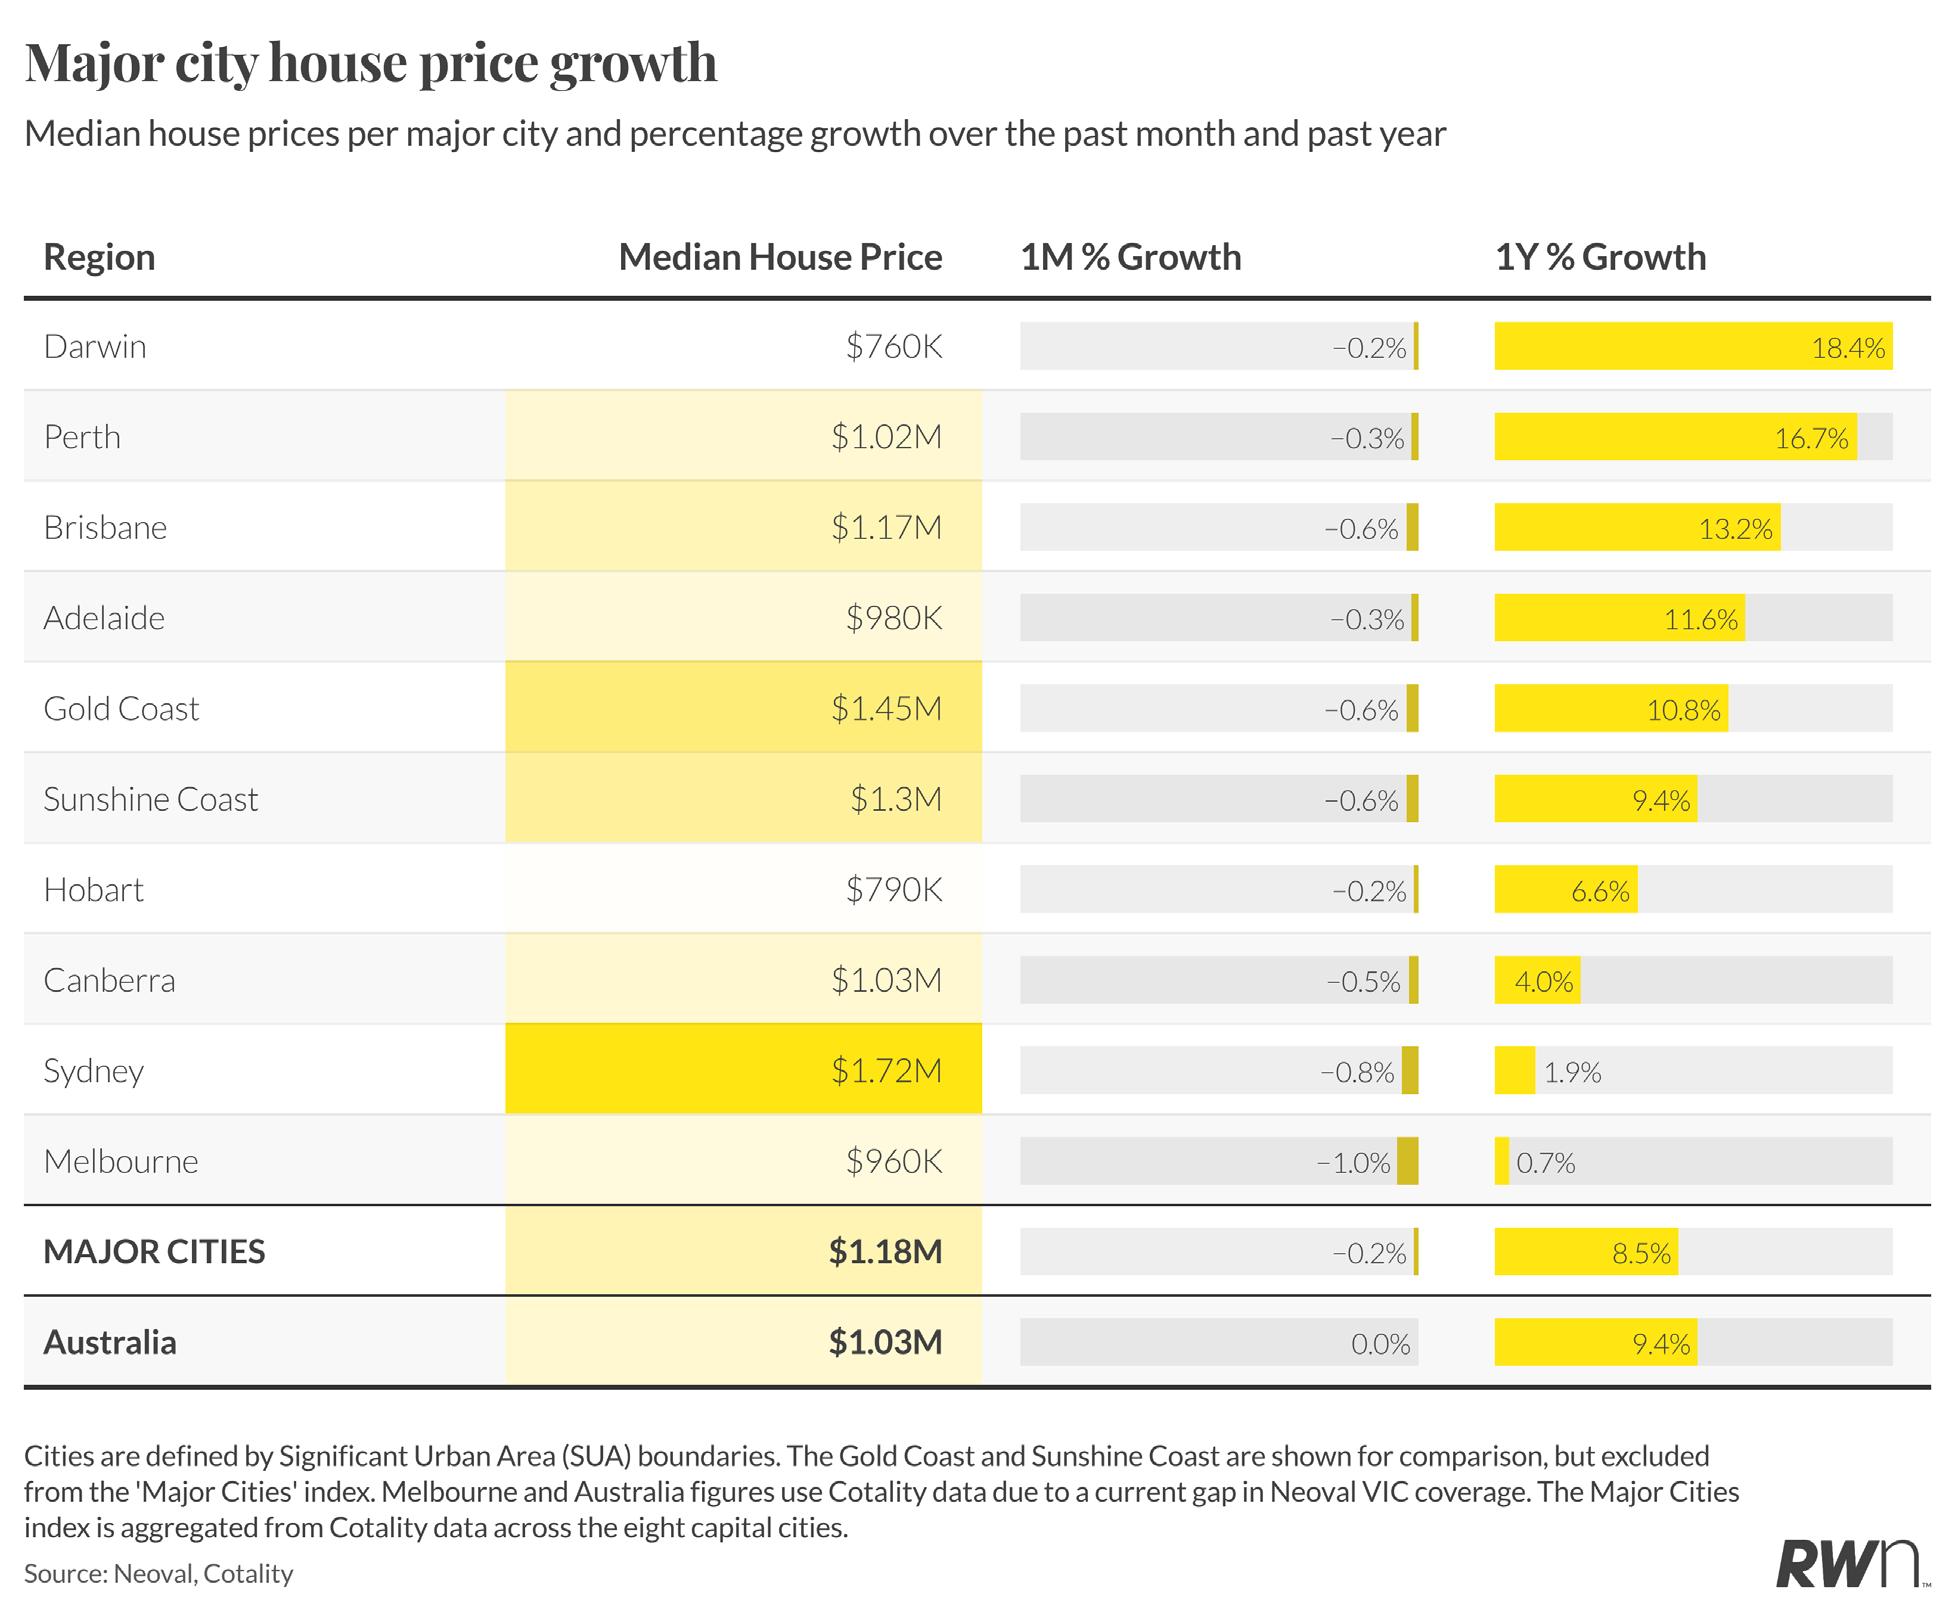
The major city composite median now sits at $1.18 million, down 0.2 per cent for the month but 8.5 per cent higher than a year ago. The annual figures still reflect the strong run-up through 2025, but the monthly results read differently with every city recording a decline in May, with Melbourne falling 1.0 per cent to $960,000 and Sydney dropping 0.8 per cent to $1.72 million.
Darwin led on an annual basis at 18.4 per cent, followed by Perth at 16.7 per cent, both reflecting the ongoing strength of resource-linked demand.
Brisbane recorded a monthly fall of 0.6 per cent and Adelaide 0.3 per cent, notable given both cities led national growth for most of the past two years. Any sustained softening would signal a broader shift in momentum. The markets most sensitive to interest rates, Sydney and Melbourne, are now clearly feeling the weight of three consecutive rate rises. Canberra’s monthly fall of 0.5 per cent is also notable given the policy uncertainty now surrounding the public sector, which is a key driver of that market.
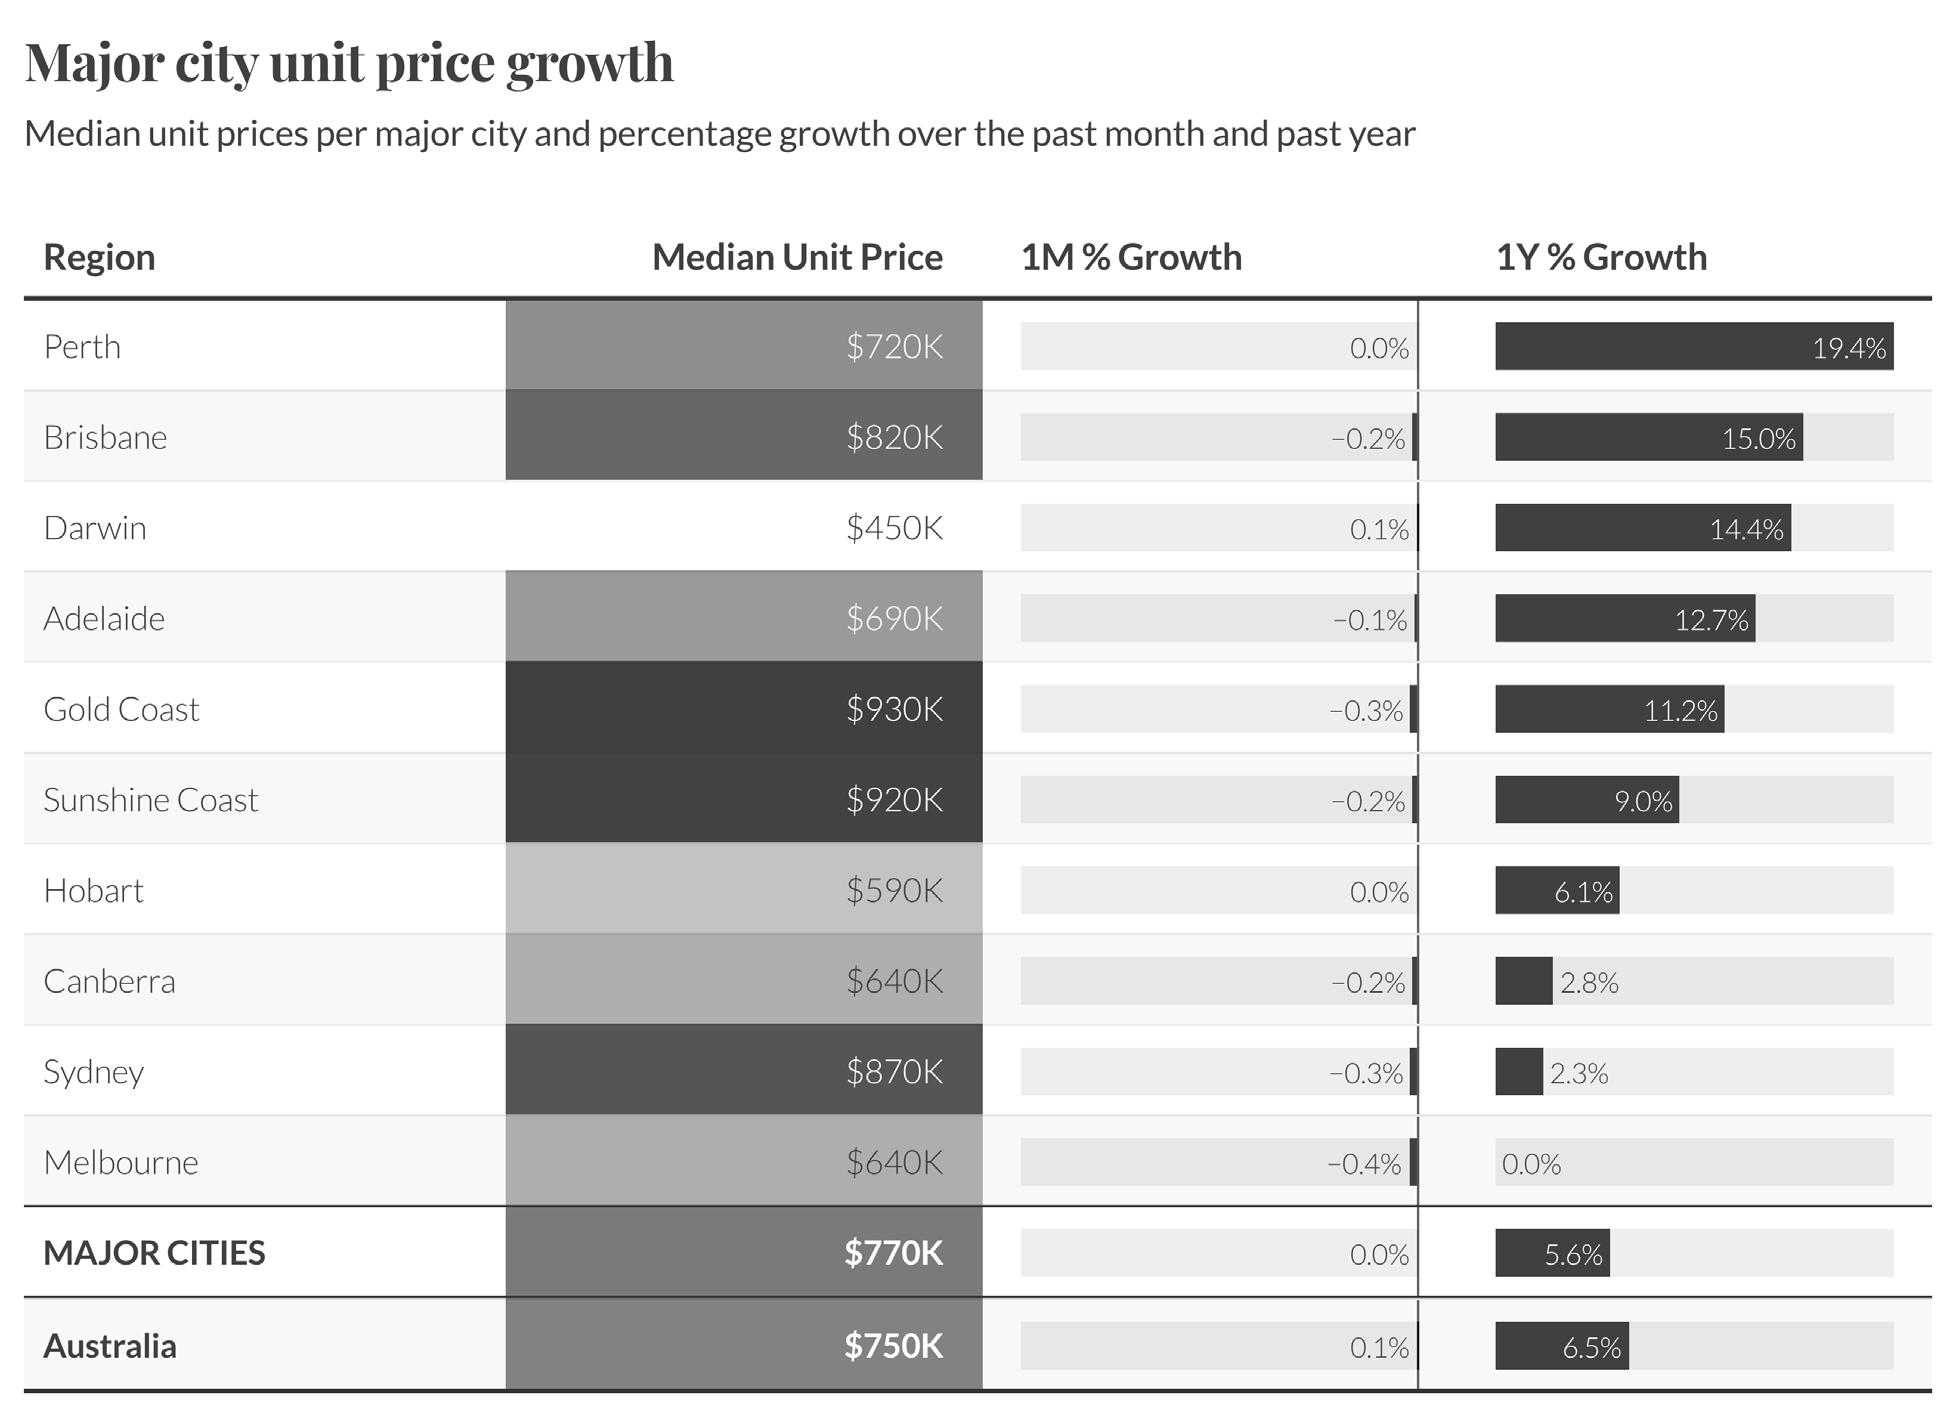
The major cities unit median is flat at $770,000 for the month, and up 5.6 per cent year-on-year. Perth remains the standout with 19.4 per cent annual growth and a flat monthly result, while Brisbane added 15.0 per cent over the year despite a small 0.2 per cent monthly dip. At the other end, Melbourne units are flat on an annual basis at $640,000 after a 0.4 per cent monthly fall, and Sydney is up only 2.3 per cent over the year at $870,000.
The divergence between Perth and Brisbane, and Sydney and Melbourne is becoming more pronounced. The southern capitals are facing the dual headwinds of high rates and investor uncertainty following the budget’s changes to negative gearing, which disproportionately affects established apartment markets where investor activity has historically been concentrated. Units in Sydney and Melbourne had been showing signs of recovery through early 2025, but that momentum has now stalled.
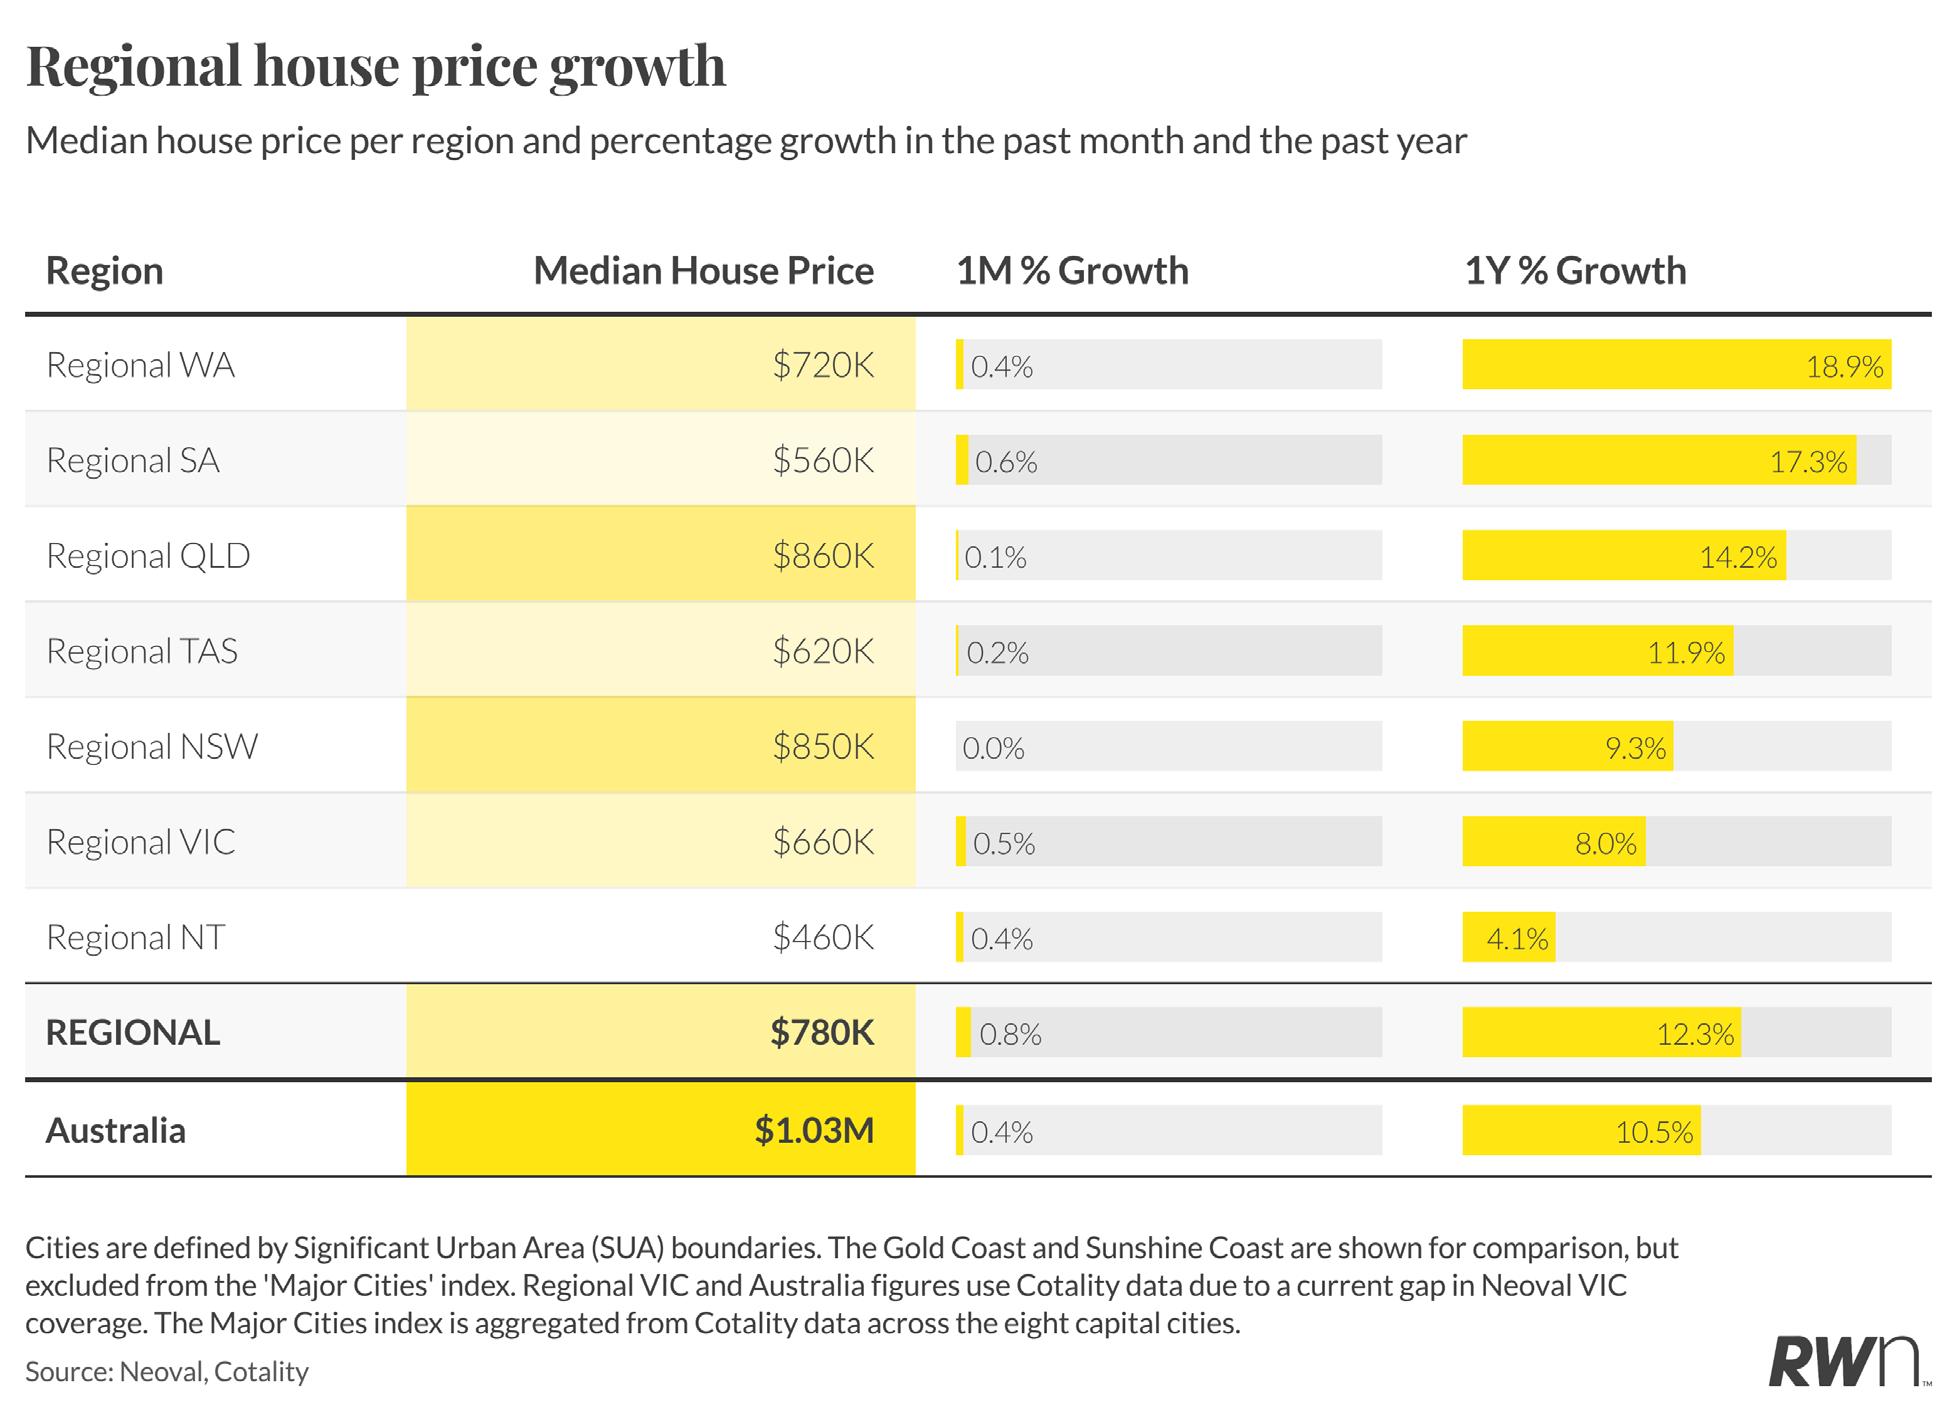
Regional markets are proving more resilient than the major cities, with the regional composite median reaching $780,000, up 0.8 per cent for the month and 12.3 per cent over the year. Regional Western Australia leads with 18.9 per cent annual growth and a $720,000 median, followed by regional South Australia at 17.3 per cent. Regional Queensland at $860,000 with 14.2 per cent annual growth remains one of the stronger markets nationally. Regional Victoria and regional Northern Territory are the softer performers at 8.0 per cent and 4.1 per cent respectively, though both remain in positive territory.
The monthly figure of 0.8 per cent suggests regional markets have not yet absorbed the full impact of the rate cycle to the same degree as the capital cities. Many regional markets are driven by local employment conditions and relative affordability rather than investor activity, which insulates them somewhat from the budget policy changes. Regional New South Wales’ flat monthly result alongside 9.3 per cent annual growth indicates that the coastal and lifestyle markets which drove the pandemic-era surge are now consolidating rather than retreating.
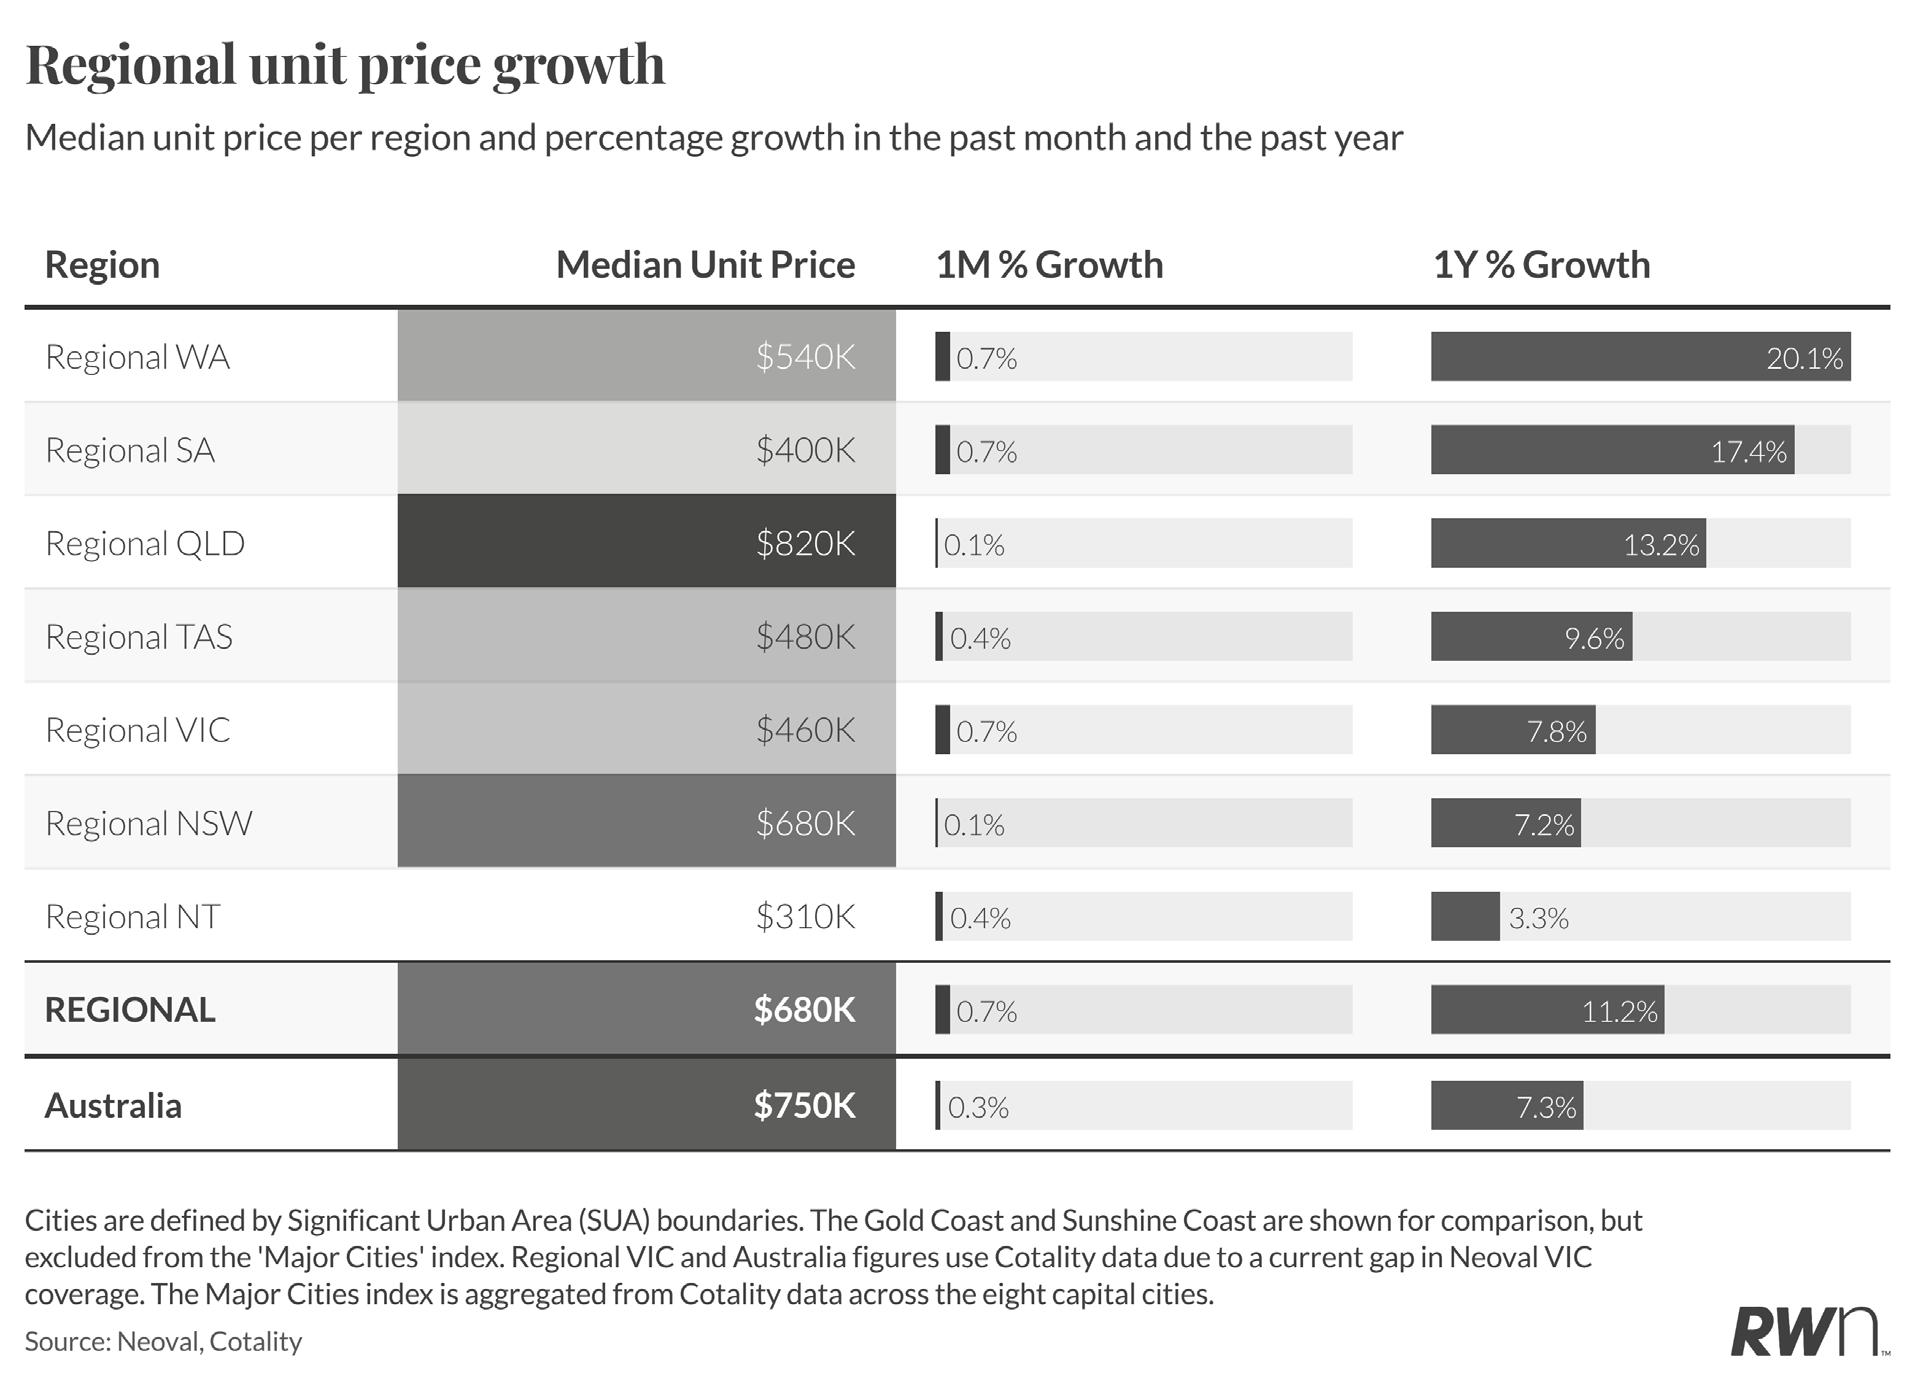
Regional units recorded a 0.7 per cent monthly gain and 11.2 per cent annual growth, reaching a composite median of $680,000. Regional Western Australia leads with 20.1 per cent annual growth at $540,000, with regional South Australia close behind at 17.4 per cent. Regional Queensland at $820,000 posted only 0.1 per cent monthly growth, suggesting some price consolidation in the high-growth Queensland coastal and hinterland markets that have attracted significant buyer interest over the past two years.
The regional unit segment continues to benefit from affordability-driven demand, particularly from buyers priced out of capital city markets. At $680,000, the regional unit median sits well below the $750,000 national unit median and $1.03 million house median, which continues to attract interest from both owneroccupiers and investors, the latter group now reassessing their strategies in light of the budget changes. Whether this demand holds through the second half of 2026 will depend significantly on how the rate environment evolves and how quickly investors adapt to the new negative gearing and CGT framework.
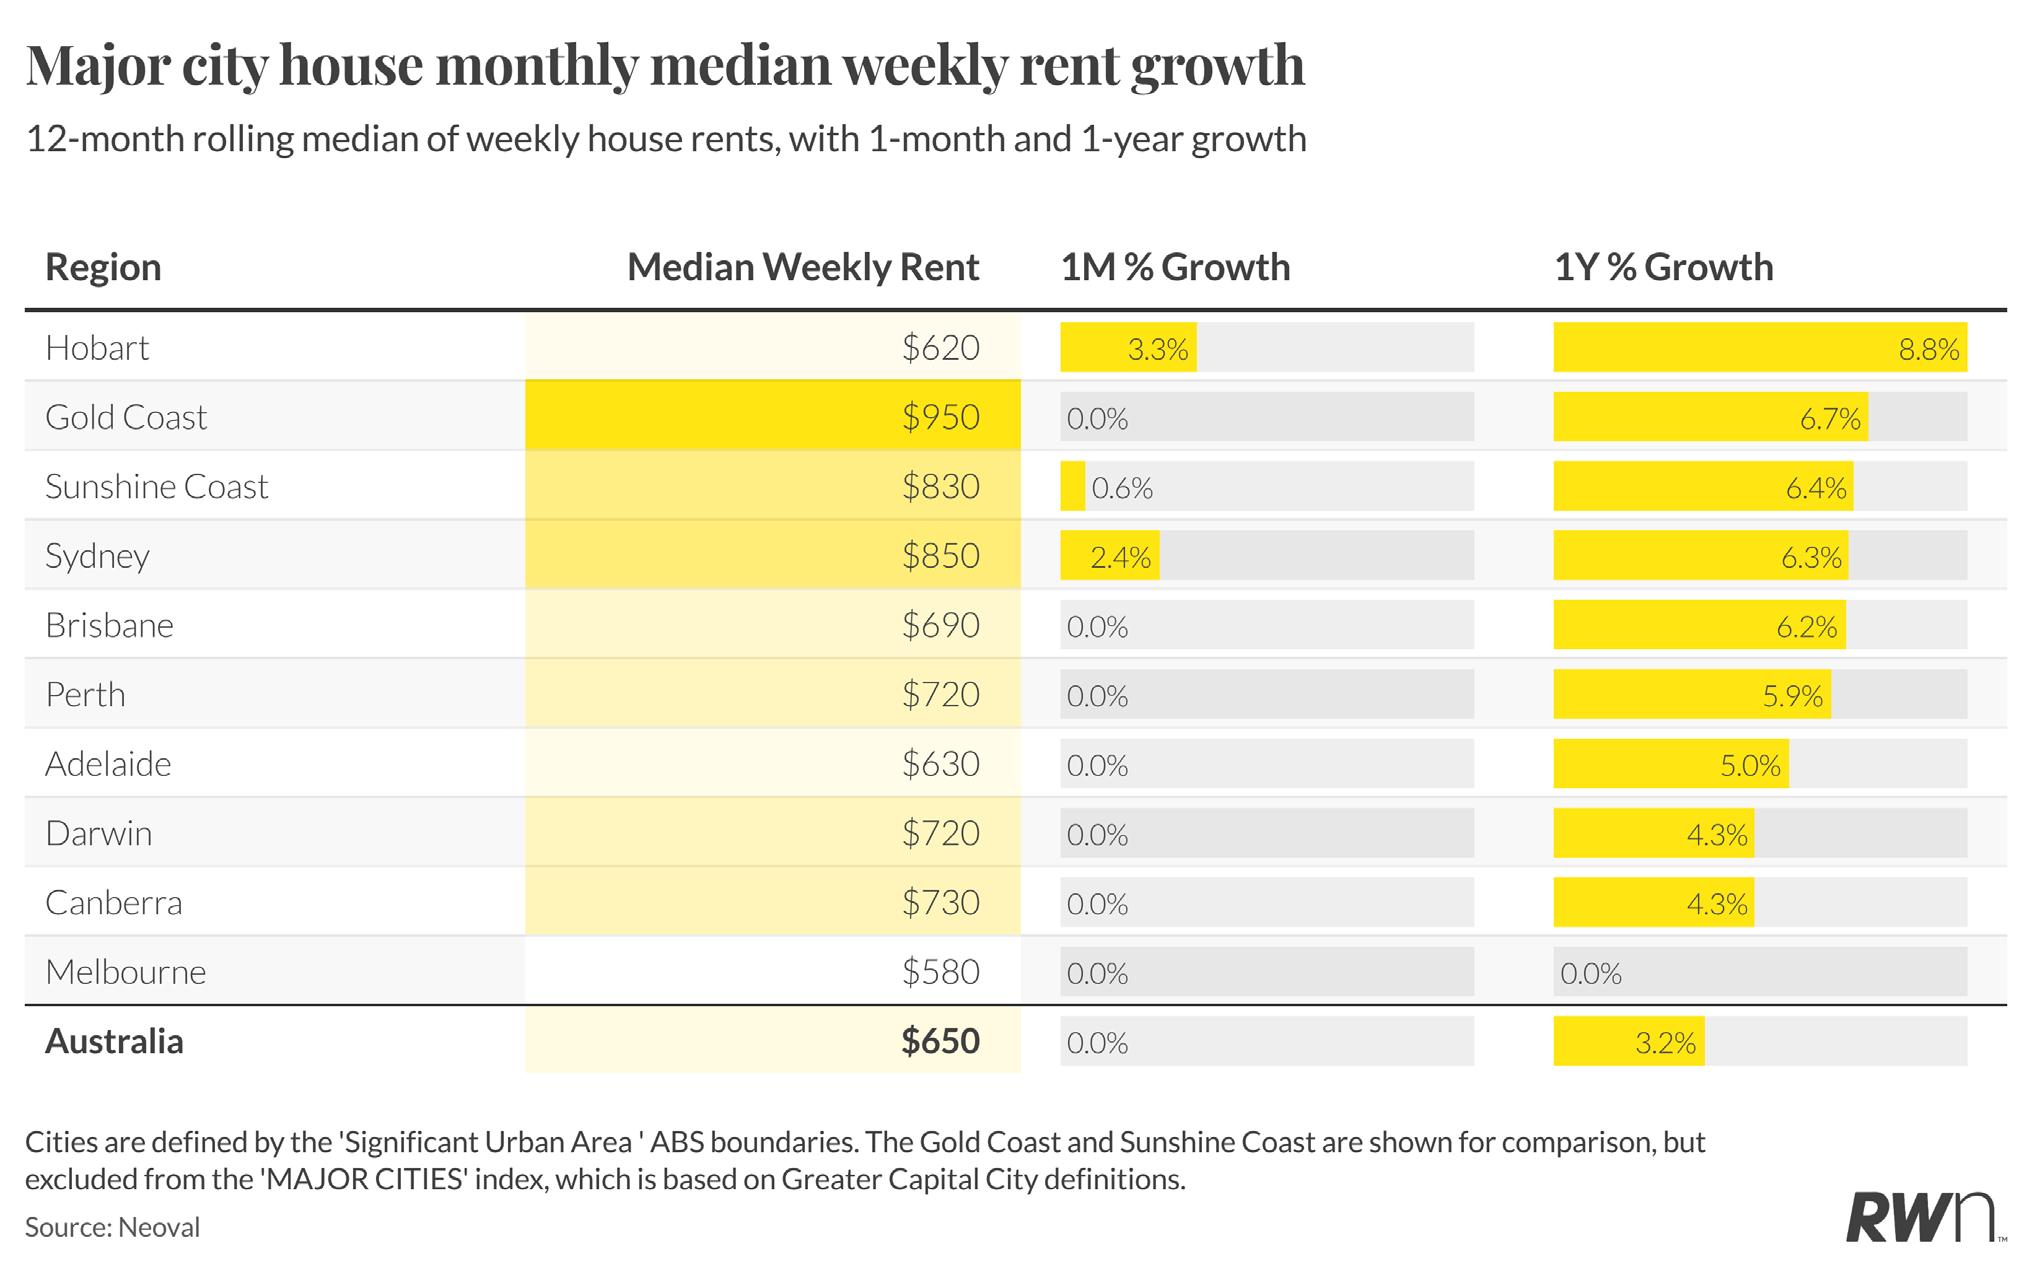
The national median weekly house rent sits at $650, unchanged over the month but 3.2 per cent higher than a year ago. The monthly picture is largely flat across most capital cities, with the notable exception of Sydney, which recorded a 2.4 per cent monthly gain to reach $850 per week, and Hobart, up 3.3 per cent to $620. Melbourne remains the weakest performer, recording zero growth for both the month and the year at $580 per week.
The modest annual growth rate of 3.2 per cent nationally is in part a consequence of the significant rent increases already embedded over the past four years, which have left some tenants at the ceiling of their affordability. However, with the Federal Budget’s changes to negative gearing set to reduce investor activity in the established market from mid-2027, the medium-term outlook for rental supply is concerning. Fewer investors purchasing established homes means a smaller pool of rental properties available over time, and that structural pressure is unlikely to be offset quickly by new supply given ongoing construction cost challenges.
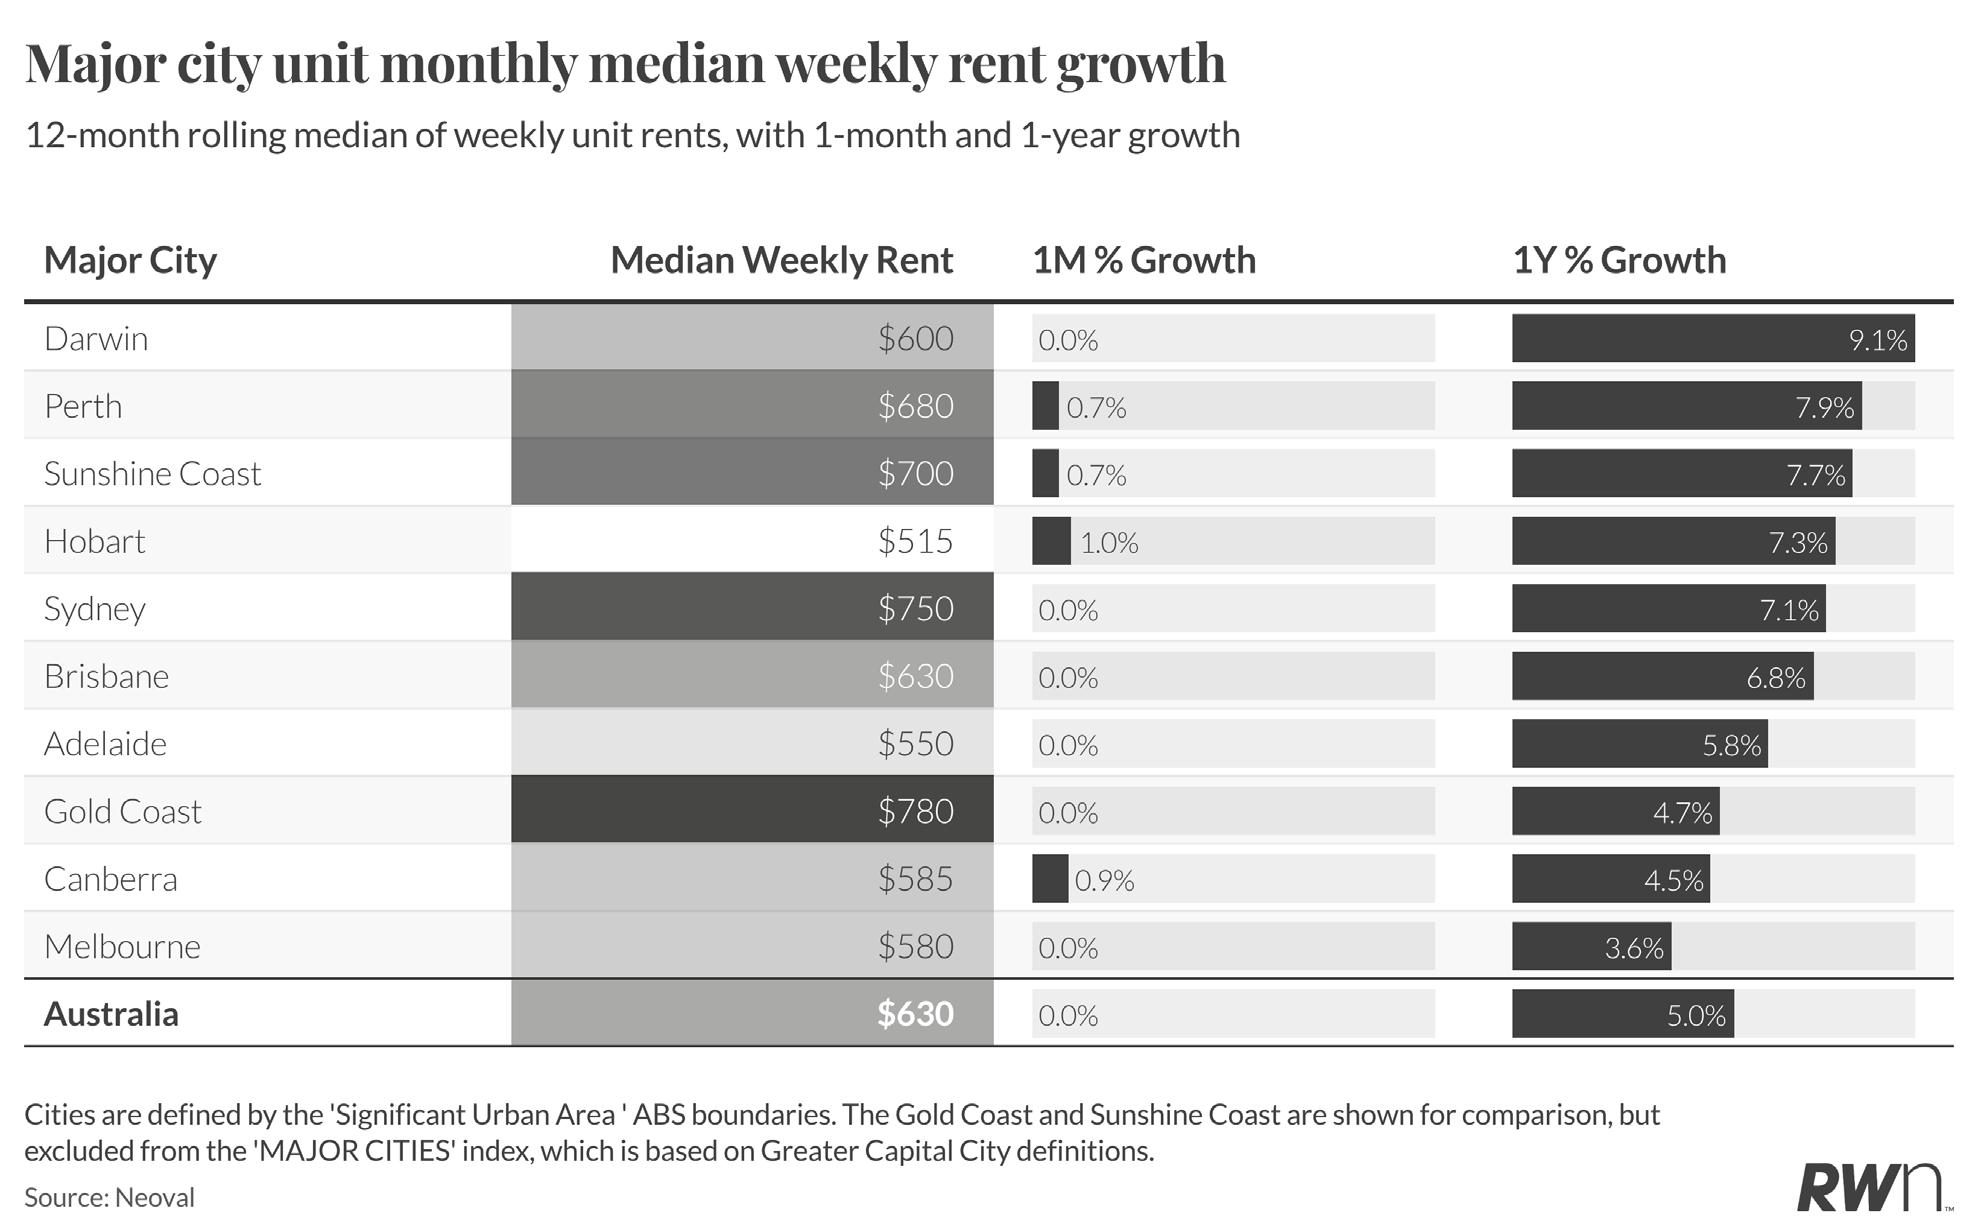
Capital city unit rents are flat nationally at $630 per week for the month, up 5.0 per cent over the year. Darwin leads annual growth at 9.1 per cent with a $600 median, while Perth added 7.9 per cent to reach $680 per week. Sydney units at $750 per week recorded zero monthly movement but remain 7.1 per cent above year-ago levels. Melbourne, at $580, posted the softest annual growth in the group at 3.6 per cent, though even this figure represents meaningful additional cost pressure on renters in a city where affordability was already severely stretched.
The broad flatness in monthly readings across most cities may reflect some seasonal easing, but it should not be interpreted as relief for tenants. The annual figures confirm rents are running well above wage growth in most markets. As budget-driven uncertainty discourages some investors from purchasing established units, historically a key source of rental stock in innercity and middle-ring suburbs, vacancy rates are likely to remain tight. Any reduction in investor participation in the established apartment market will place further upward pressure on rents in the locations where renters most need affordable options.
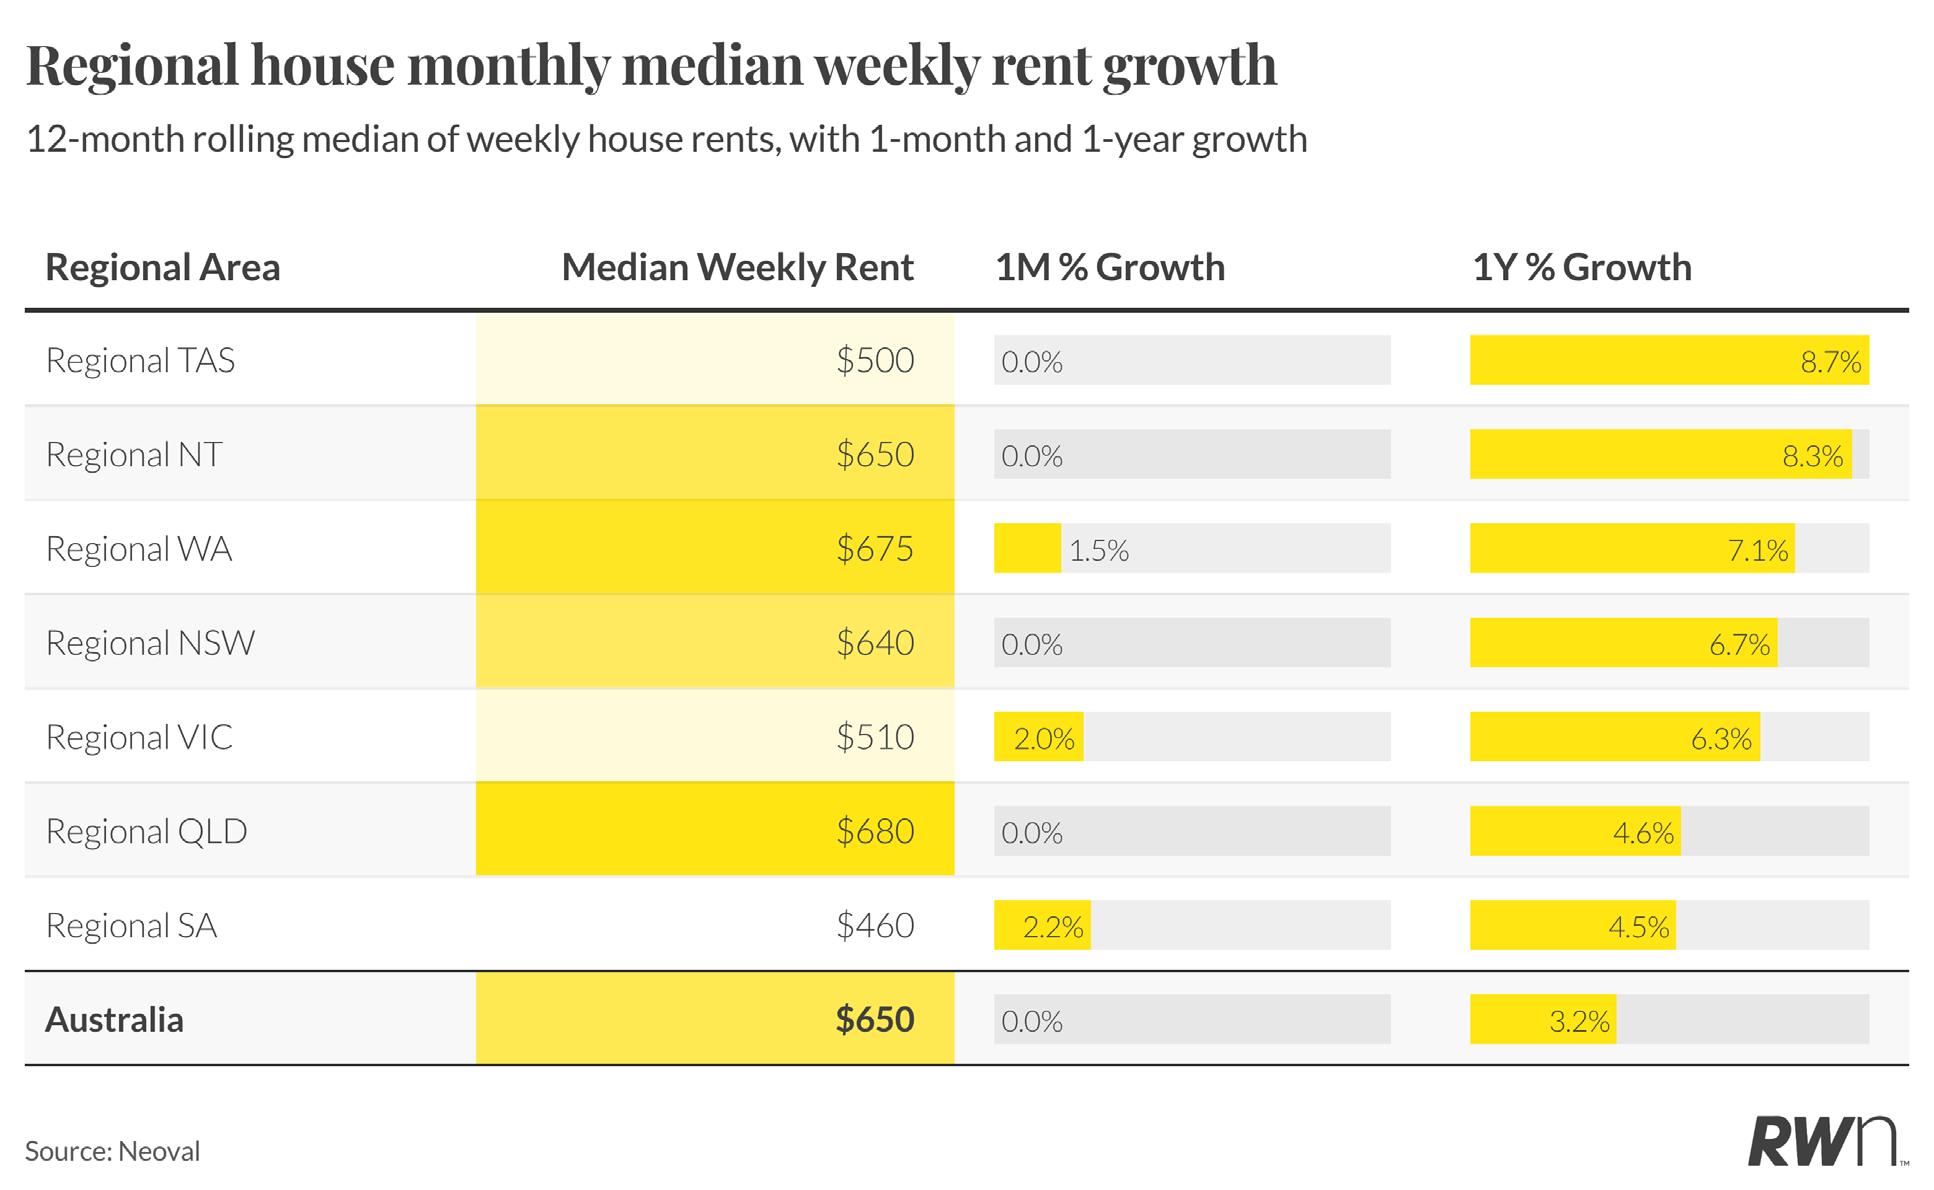
Regional house rents nationally are flat at $650 per week for the month and up 3.2 per cent year-on-year. Regional Tasmania leads annual growth at 8.7 per cent to a $500 median, followed by regional Northern Territory at 8.3 per cent and $650 per week. Regional Western Australia recorded the only notable monthly gain of 1.5 per cent to reach $675, while regional Victoria posted a 2.0 per cent monthly rise to $510 and regional South Australia added 2.2 per cent to $460. Regional Queensland and New South Wales were flat for the month at $680 and $640 respectively, though both remain solidly positive on an annual basis.
Regional rental markets have been absorbing the overhang of the pandemic-era population shift, and while growth rates have moderated from the extremes of 2022 and 2023, they remain elevated. With investors in regional markets also reassessing their strategies following the budget announcement and construction pipelines in many regional areas too thin to deliver meaningful new supply, the rental outlook across these markets remains tight. Regional areas that lack a strong development pipeline are particularly exposed to any reduction in established investor activity.
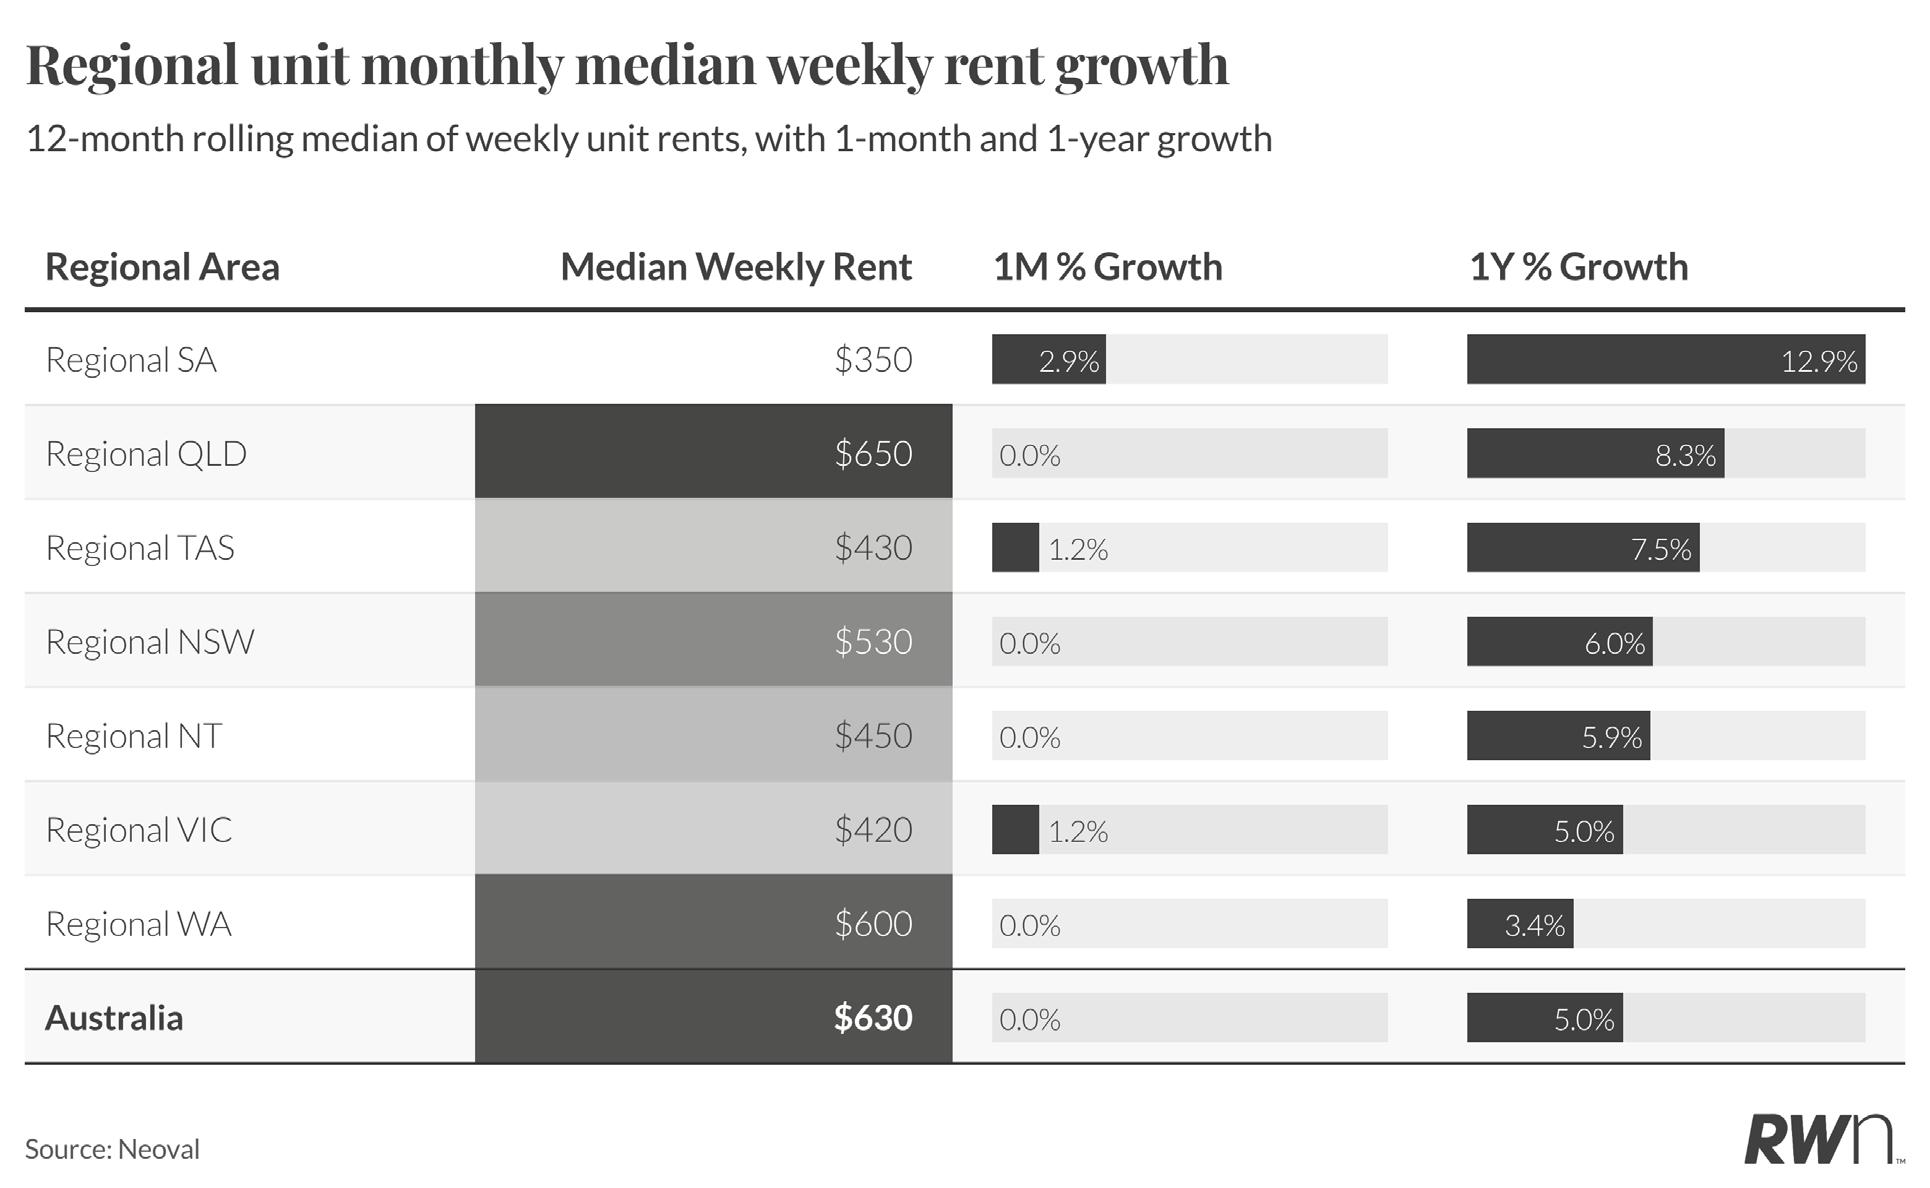
Regional unit rents are flat at $630 per week nationally for the month, with annual growth of 5.0 per cent. Regional South Australia stands out with 2.9 per cent monthly growth to reach $350 per week, alongside the strongest annual figure in the group at 12.9 per cent. Regional Queensland at $650 per week recorded no monthly movement but added 8.3 per cent over the year. Regional Tasmania and regional Victoria both posted 1.2 per cent monthly gains, reaching $430 and $420 respectively, while regional Western Australia was flat for the month at $600 despite 3.4 per cent annual growth.
The variation across regional unit markets reflects differing local demand conditions, but the common thread is that vacancy rates in most areas remain well below comfortable levels. Units in regional areas have become an increasingly important part of the rental
mix as affordability pressures have pushed households away from detached houses. If the budget changes reduce investor interest in the established unit segment, as has been observed in Victoria following that state’s own investor-unfriendly policy shifts, the available pool of rental units in regional areas could shrink at a time when demand from price-sensitive renters and recent migrants remains firm.
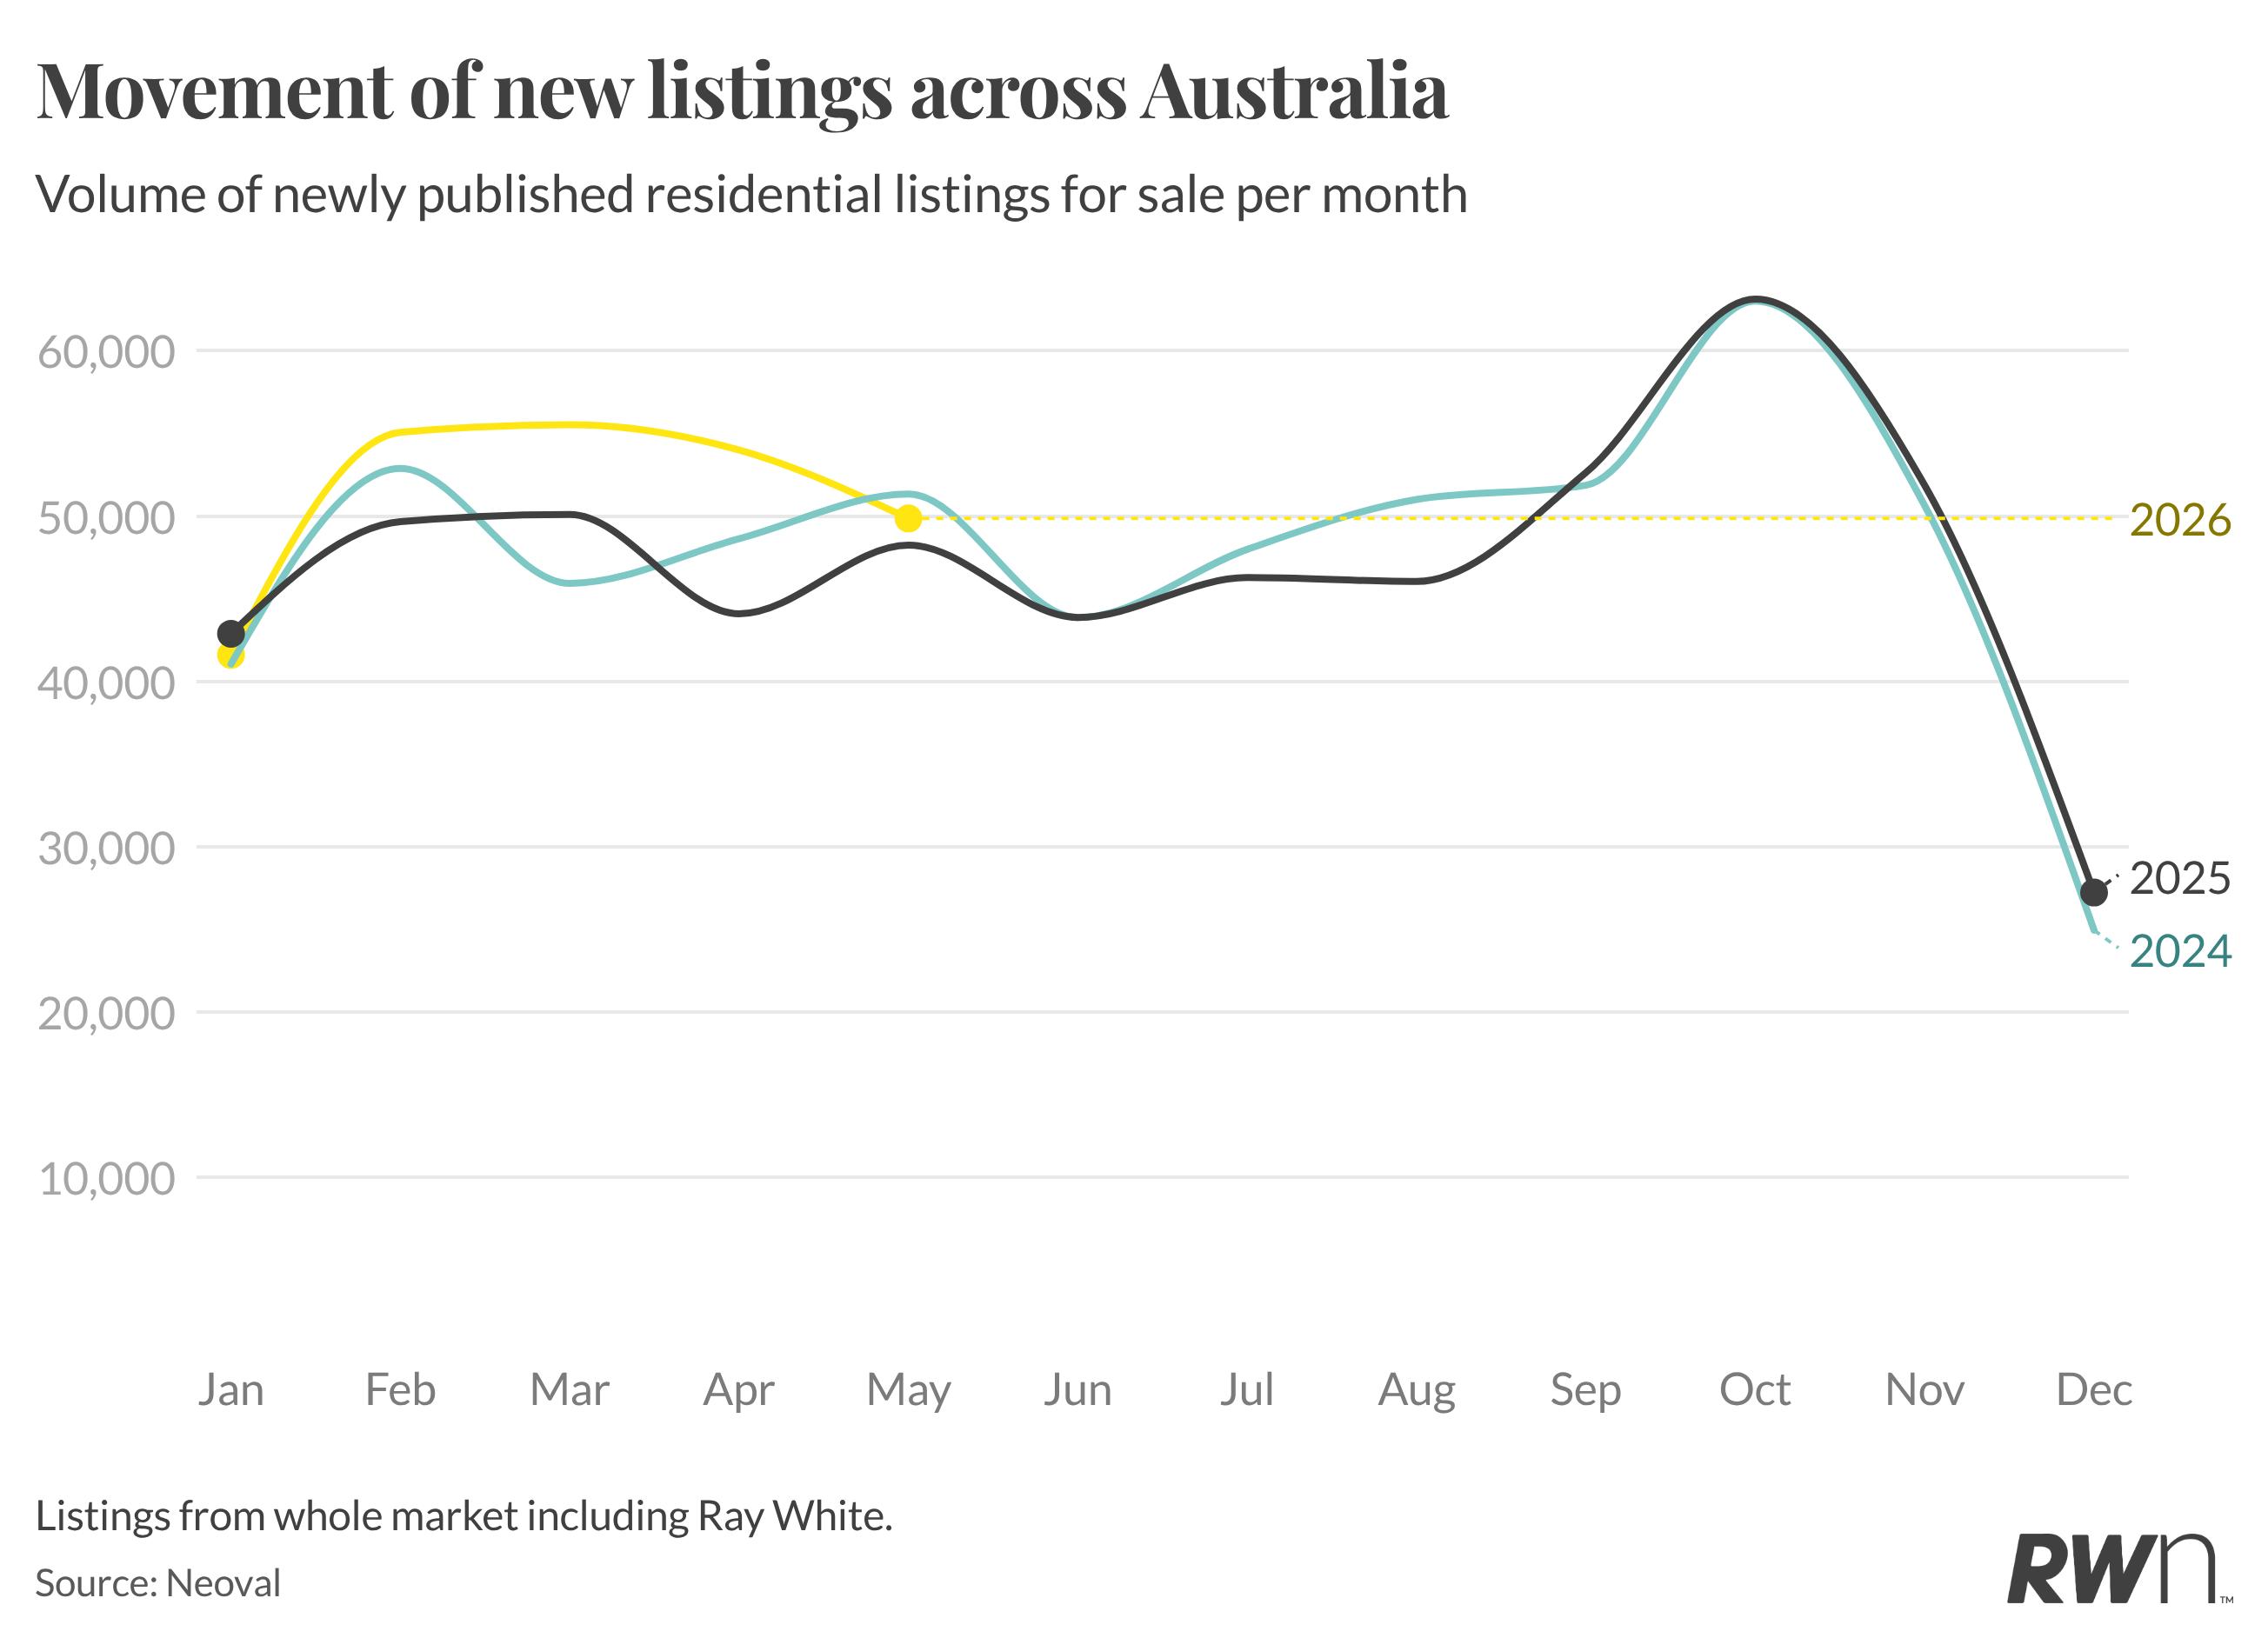
New listings nationally reached 49,800 in May 2026, a result that sits above the 48,245 recorded in May 2025 but below the 51,330 of May 2024. The early months of 2026 told a more striking story, February and March both exceeded 55,000, well above the equivalent 2024 and 2025 readings, as vendors moved to list established properties ahead of the Federal Budget’s anticipated negative gearing changes. That pre-budget surge has now clearly passed, with the May figure representing a sharp pull-back from the year’s highs and the 2026 line converging back toward prior year levels.

The pattern through the first five months of 2026 shows a strong early spike followed by a rapid moderation, reflecting the policy-driven nature of much of that early-year supply. With the budget now announced and three rate increases having reduced buyer purchasing power, the conditions that prompted accelerated listing activity have faded. The coming winter months are likely to see further softening in new supply as vendor confidence adjusts to a more uncertain market.
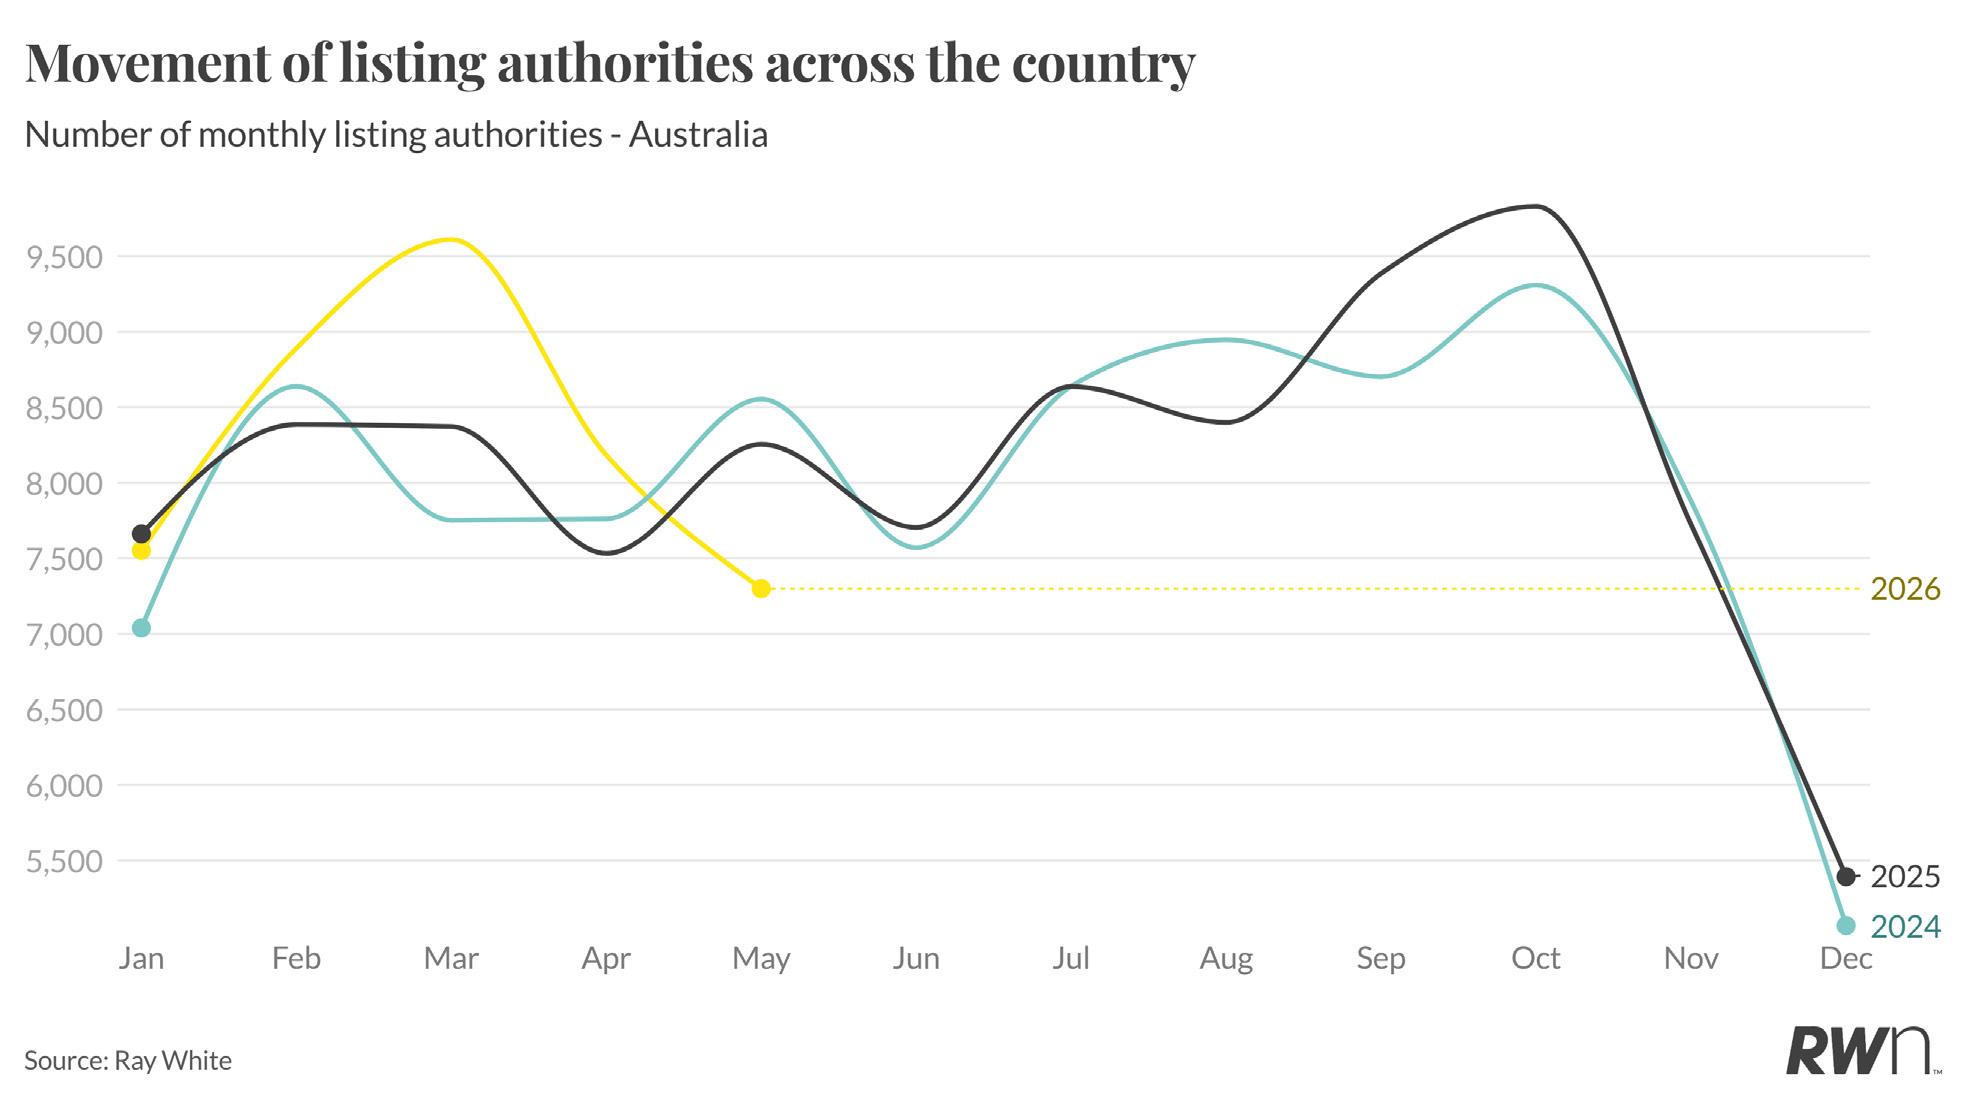
Listing authorities are the formal appointment of an agent to sell, and a reliable leading indicator of supply typically four to six weeks ahead of a property hitting the market, this came in at approximately 7,300 in May 2026. This is down sharply from the March 2026 peak of 9,600, and now sits below both the May 2024 reading of 8,555 and May 2025’s 8,256. The 2026 series opened the year broadly in line with prior years at around 7,600 in January before surging through February and March, but has since retreated more quickly than either of the preceding years at the same point in the calendar.
The fact that authorities are now running below yearago levels is a meaningful signal of reduced vendor intent. Uncertainty is the common thread, higher borrowing costs have narrowed the buyer pool, and the Federal Budget’s changes to negative gearing and CGT have prompted many investors to delay decisions rather than commit. With the forward pipeline of new listings shaped by where authorities sit today, supply coming to market through June and July is likely to be softer than the same period in 2024 and 2025. That will provide some price support, but the underlying driver is hesitation rather than confidence.
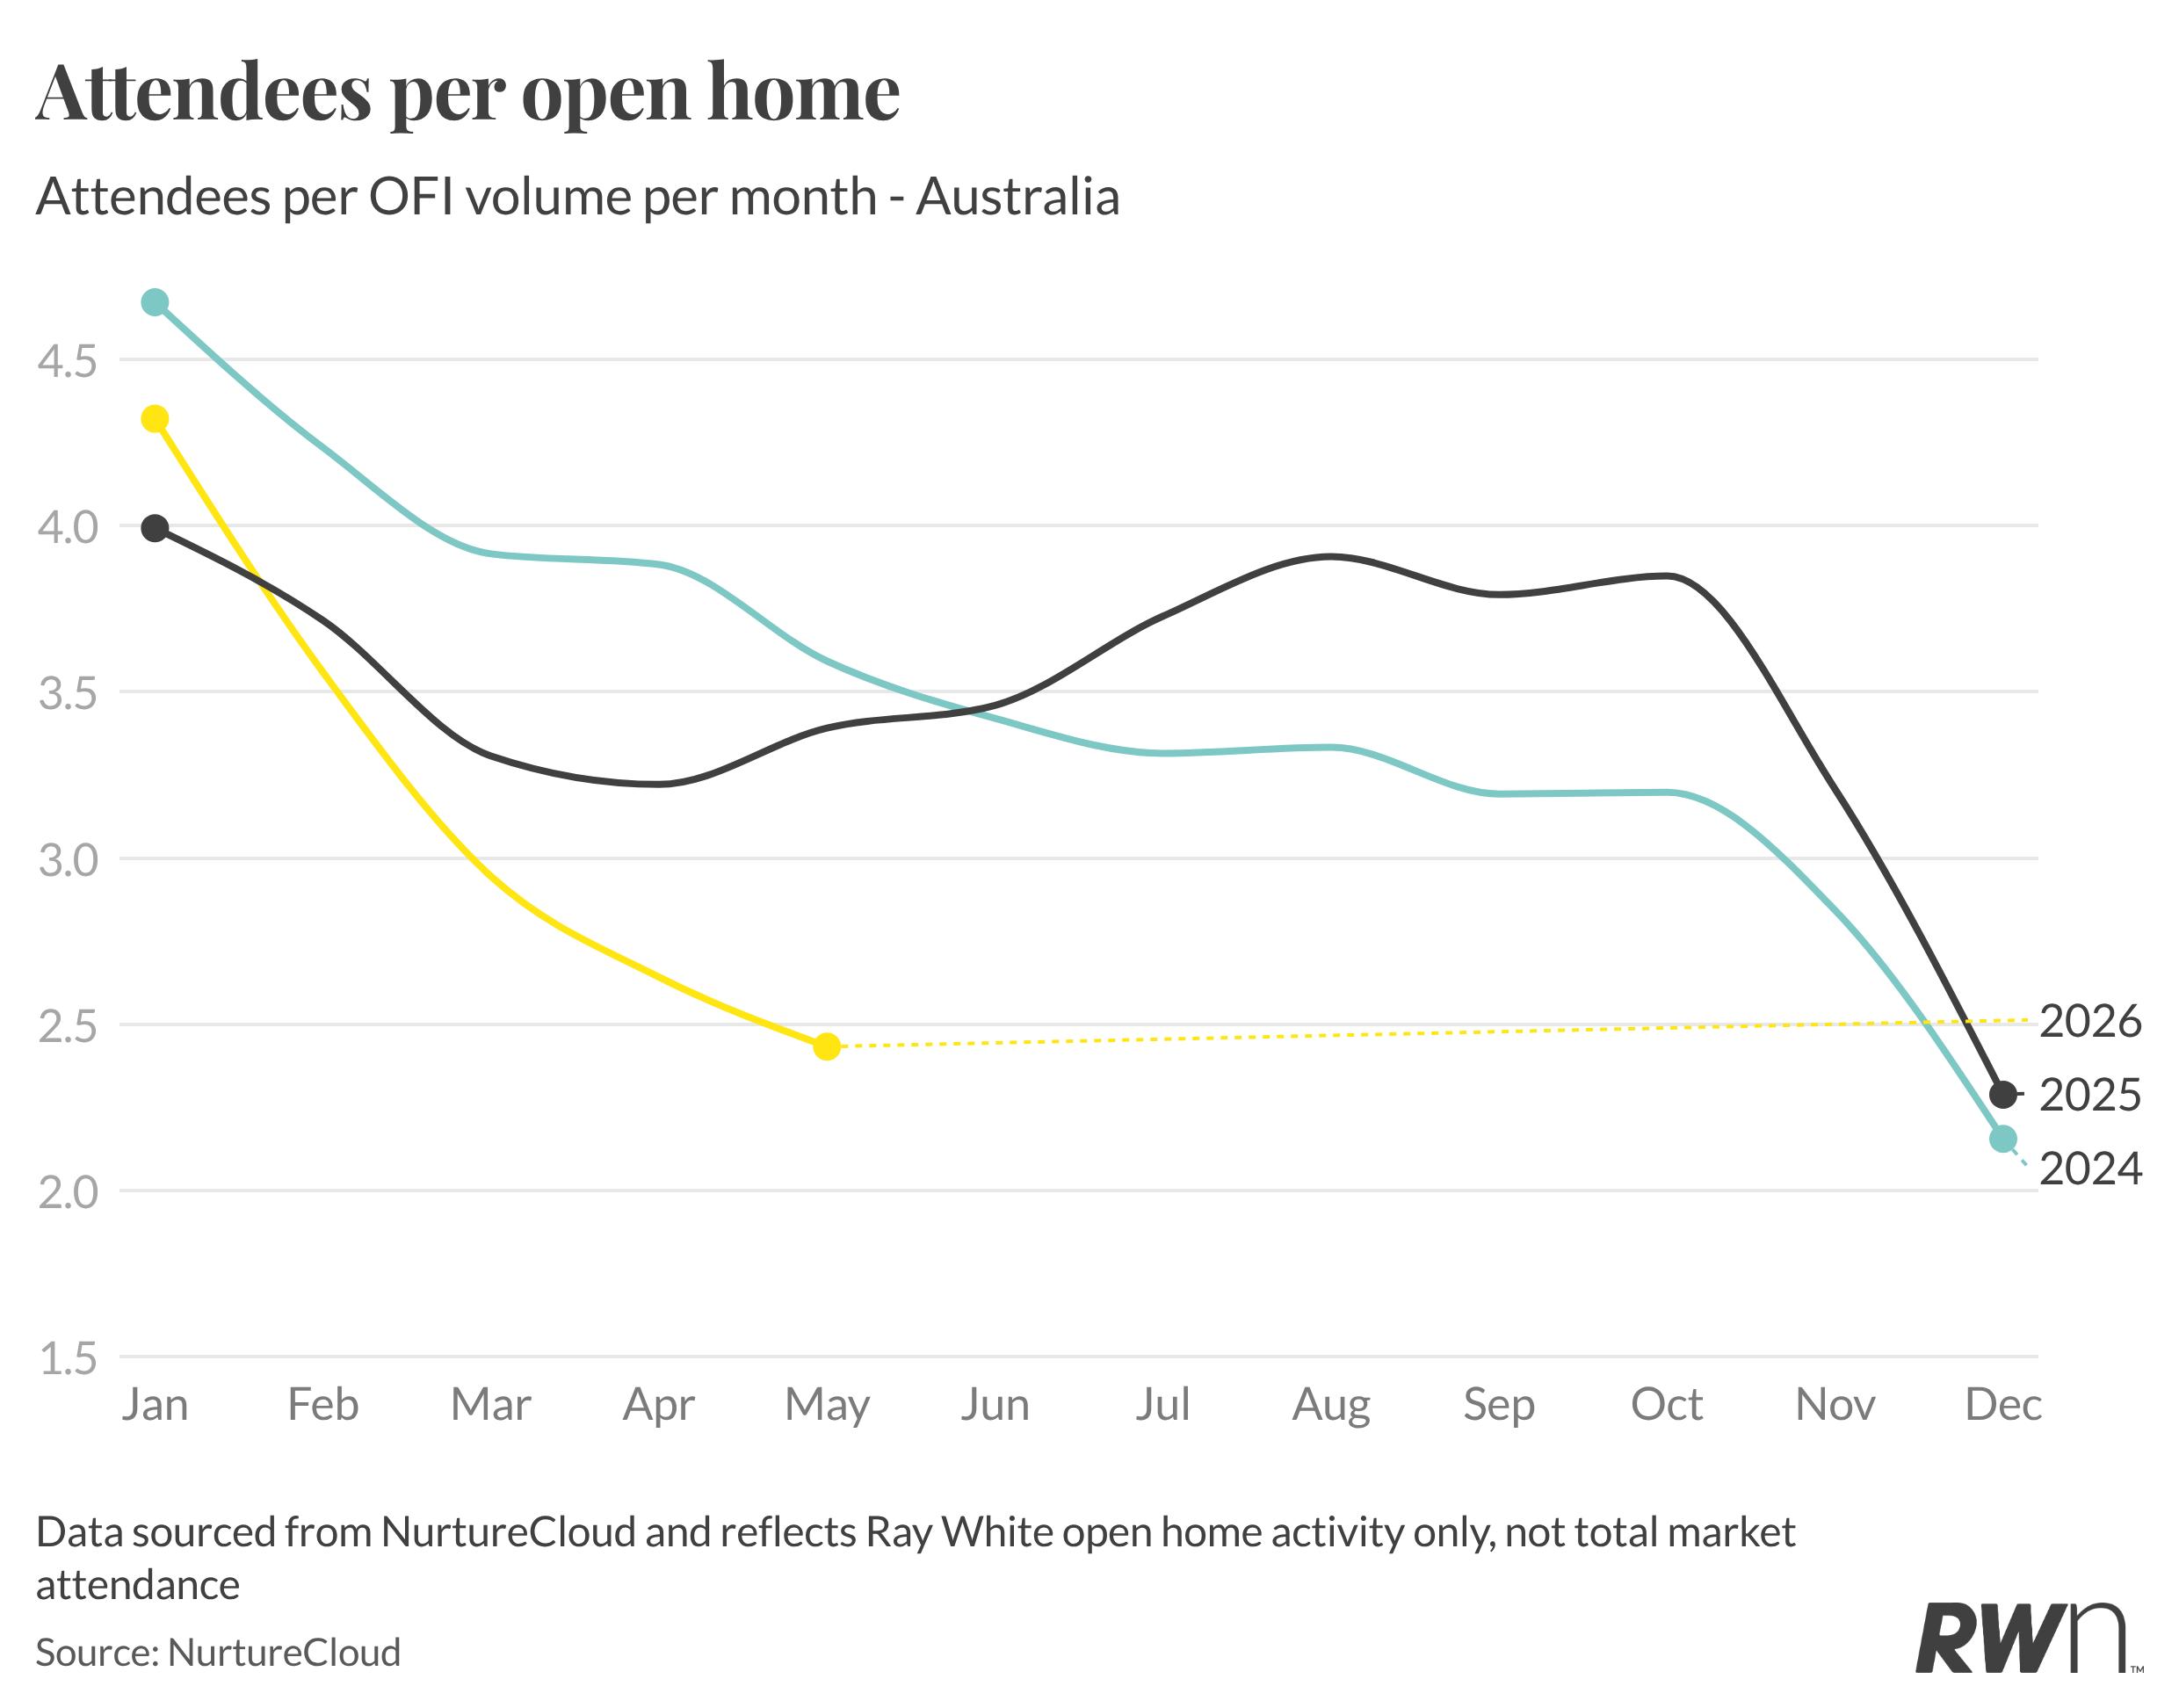
Open home attendance per inspection reached 2.43 in May 2026, down from 4.32 in January and the weakest May reading across the three years of comparable data. The equivalent May figures were 3.59 in 2024 and 3.39 in 2025, placing 2026 roughly a full attendee per open home below the prior year trend at this point in the calendar. The rate of decline through the year has also been steeper than previous years, attendance held more steadily through the autumn months before dipping toward mid-year.
The 2026 trajectory reflects the cumulative effect of three rate rises on buyer confidence and capacity. Each increase has reduced what buyers can borrow, and the Federal Budget’s announcements around negative gearing and CGT have added a further layer of uncertainty, particularly for investors who have historically been active participants at open homes in the established market. At 2.43 attendees per inspection, the competitive tension that characterised open homes through much of 2025 has materially eased.
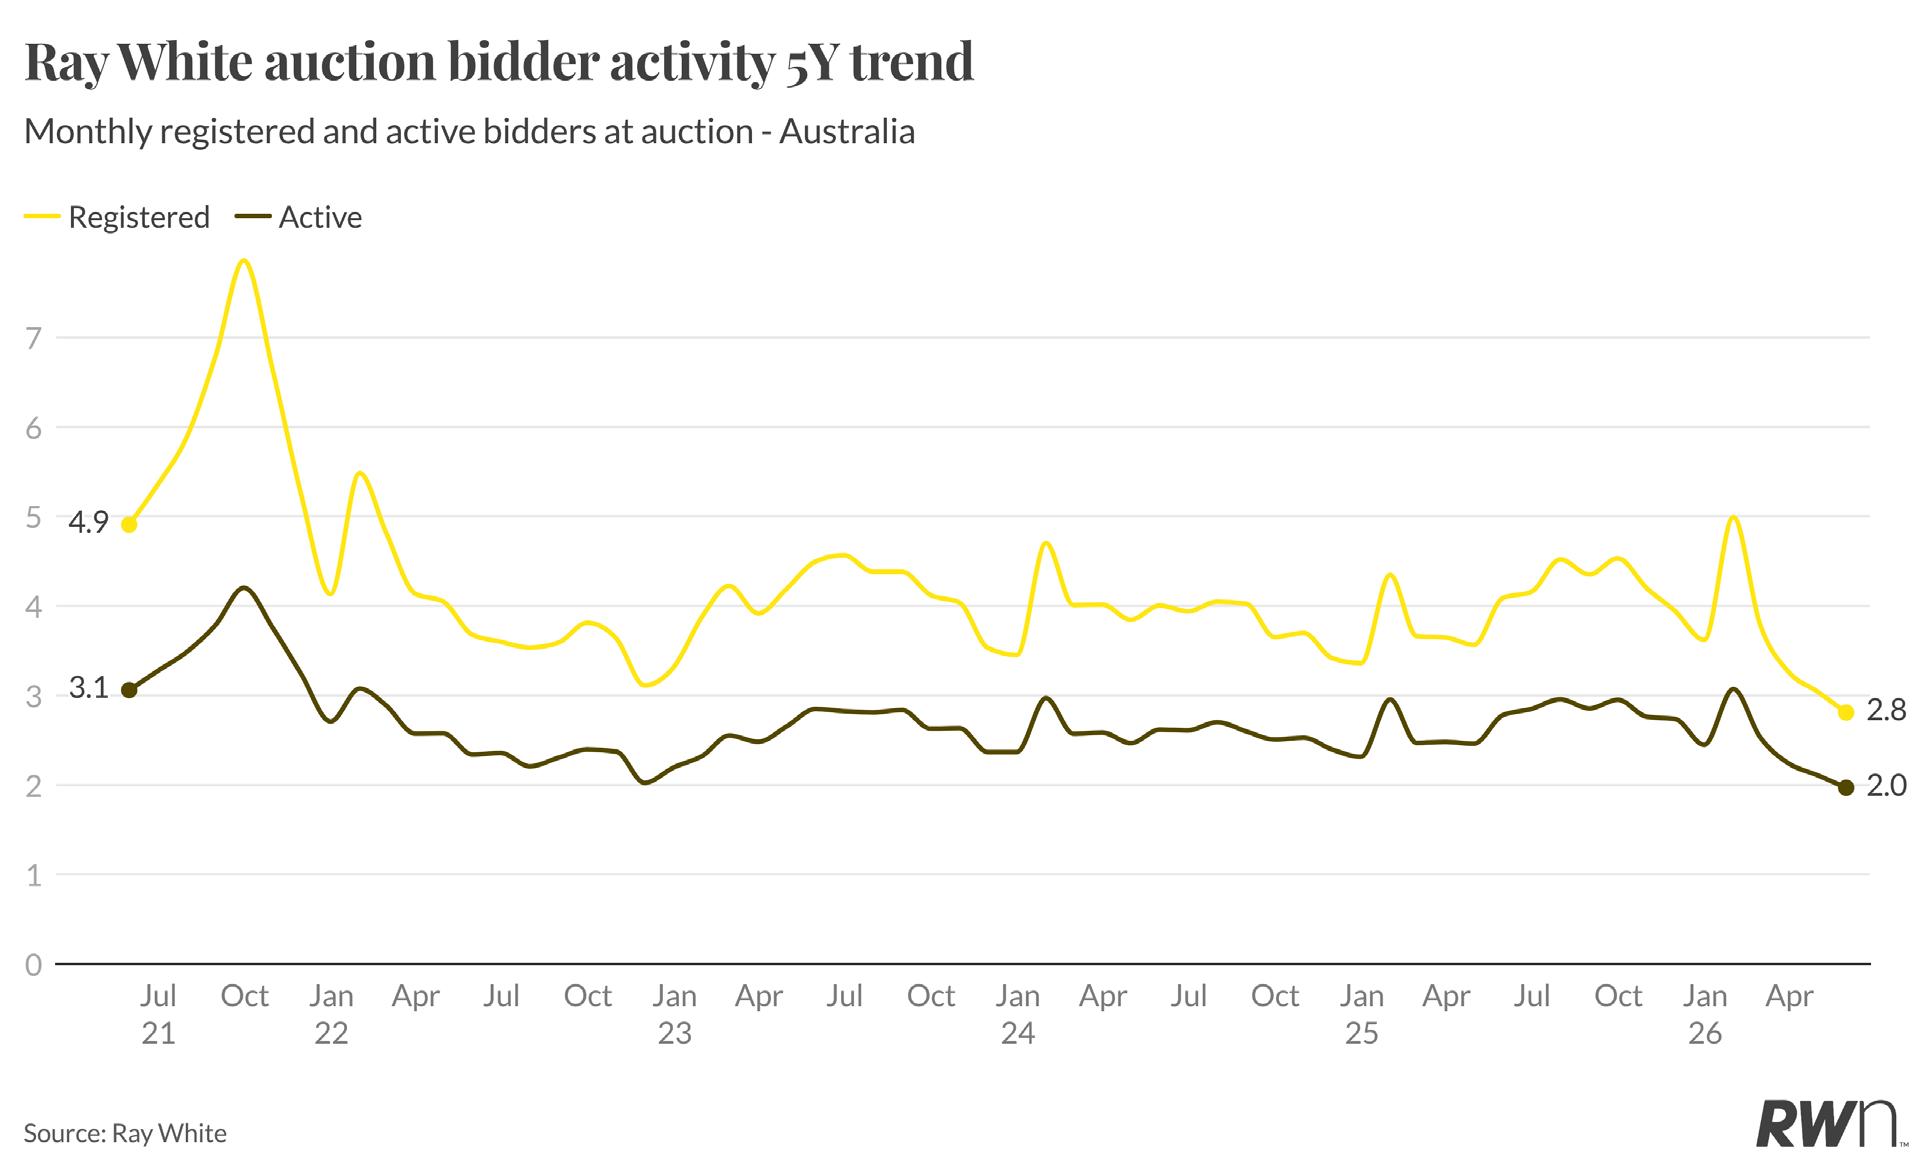
Registered bidders per auction fell to 2.8 in May 2026, down from 5.0 in January and the lowest May reading across the five years of comparable data. Active bidders dropped further to 2.0, again a five-year low for this point in the calendar and meaningfully below the 2.8 active bidders recorded in May 2025. The consistent monthly decline through 2026 across both measures tells a clear story, that buyer participation at auction is contracting, and the gap relative to prior years is widening as the rate cycle and budget uncertainty compound.
The ratio of active to registered bidders is also worth noting. With under two active bidders per auction on average, competitive tension on the day is limited, and vendors are increasingly finding that registered interest does not translate into committed bidding. That dynamic is directly reflected in the clearance rate outcome and is unlikely to reverse quickly while borrowing costs remain at current levels.
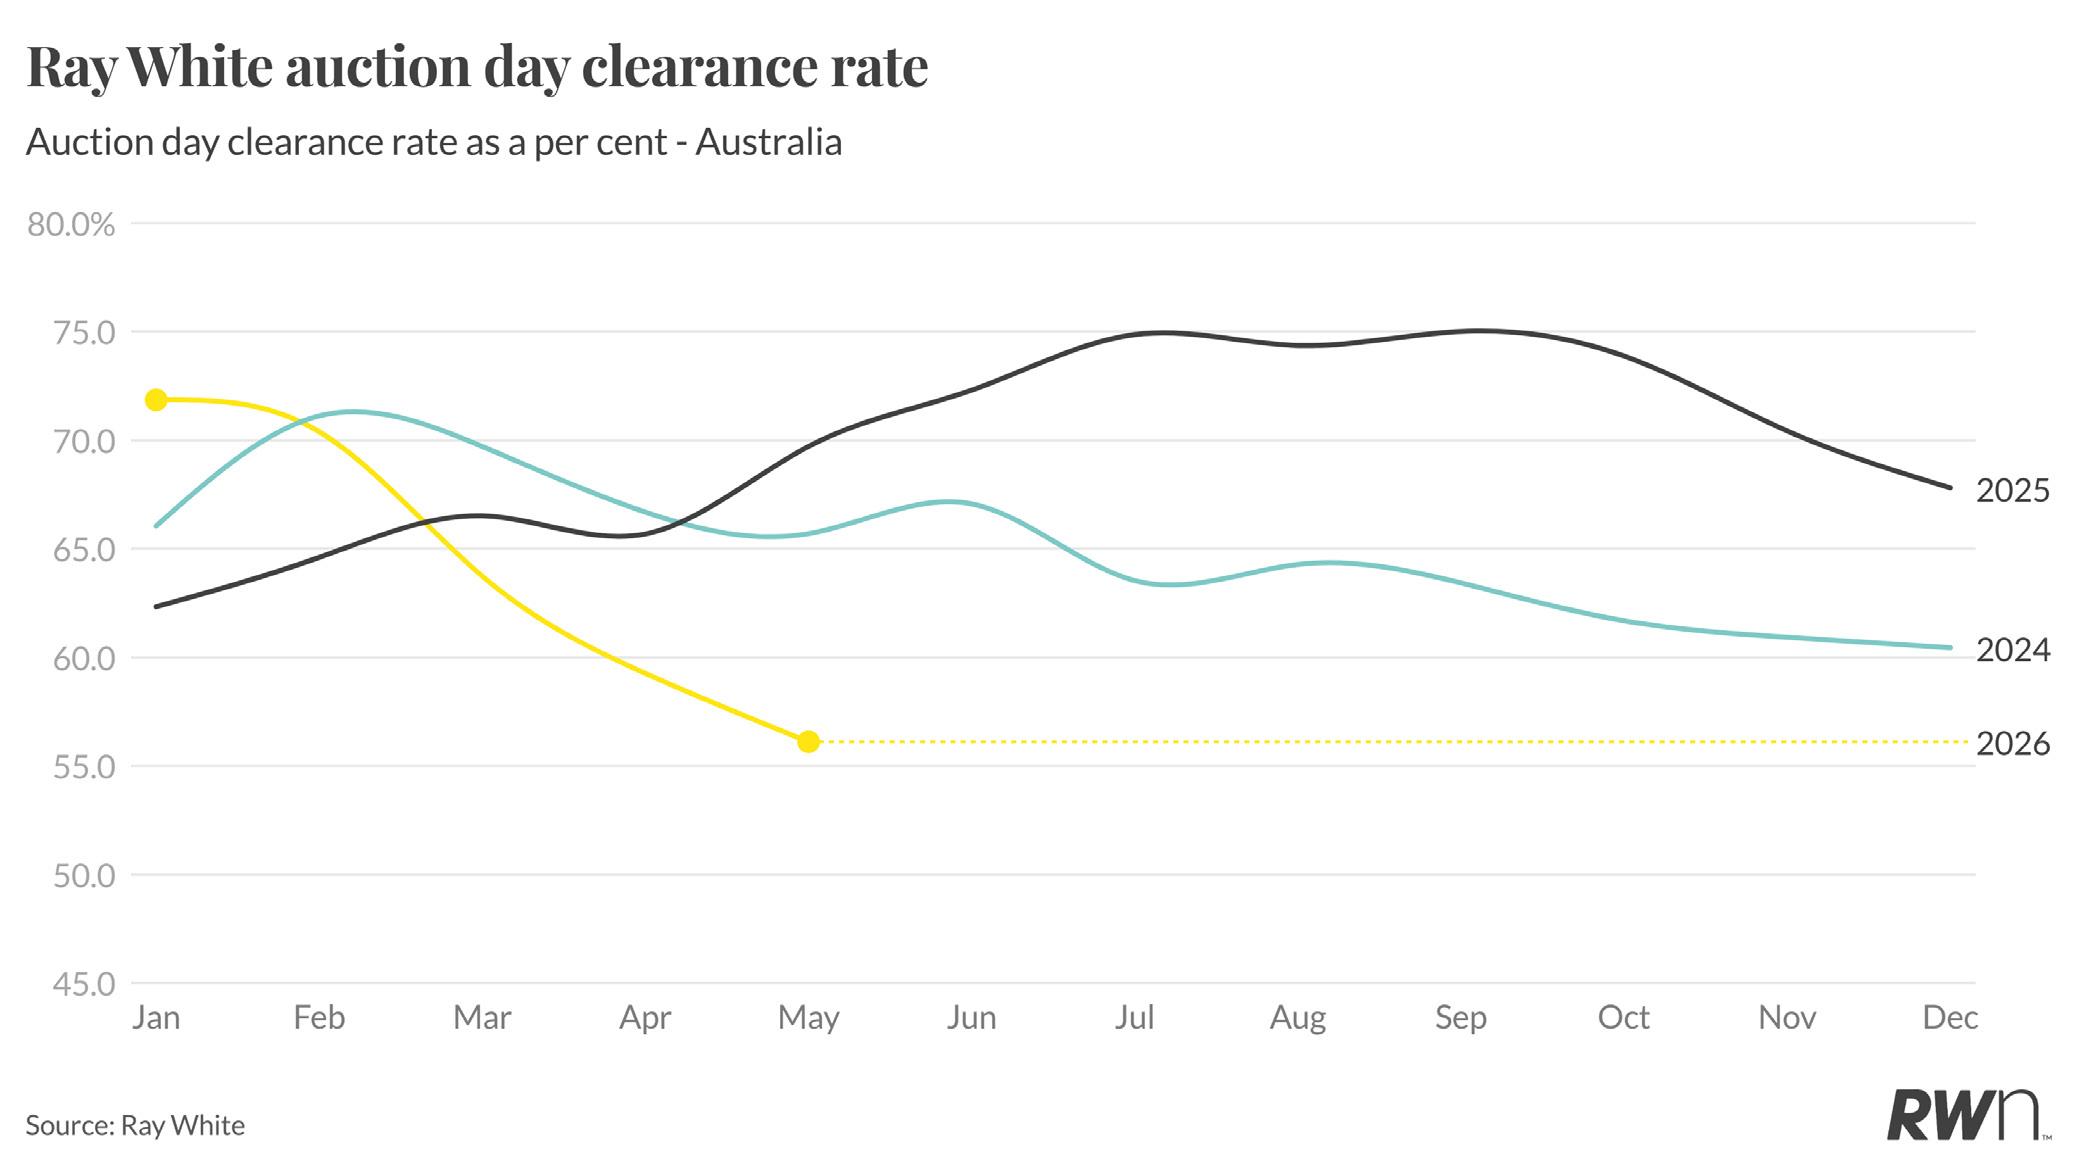
Ray White’s auction day clearance rate fell to 56.1 per cent in May 2026, down from 71.9 per cent in January and now tracking well below both 2025 (69.7 per cent in May) and 2024 (65.7 per cent in May). The gap between 2026 and prior years has widened materially through the autumn months, with the 2026 line sitting roughly 13 percentage points below the equivalent 2025 result. That is a significant deterioration in a short
period and reflects the combined weight of three rate rises and post-budget uncertainty on buyer conviction at auction.
A clearance rate of 56.1 per cent is not a collapsed market, but it does represent a meaningful shift in negotiating conditions. Buyers have more leverage than at any point in the past two years, and vendors who entered the market expecting the competitive tension of 2025 are finding a different environment.
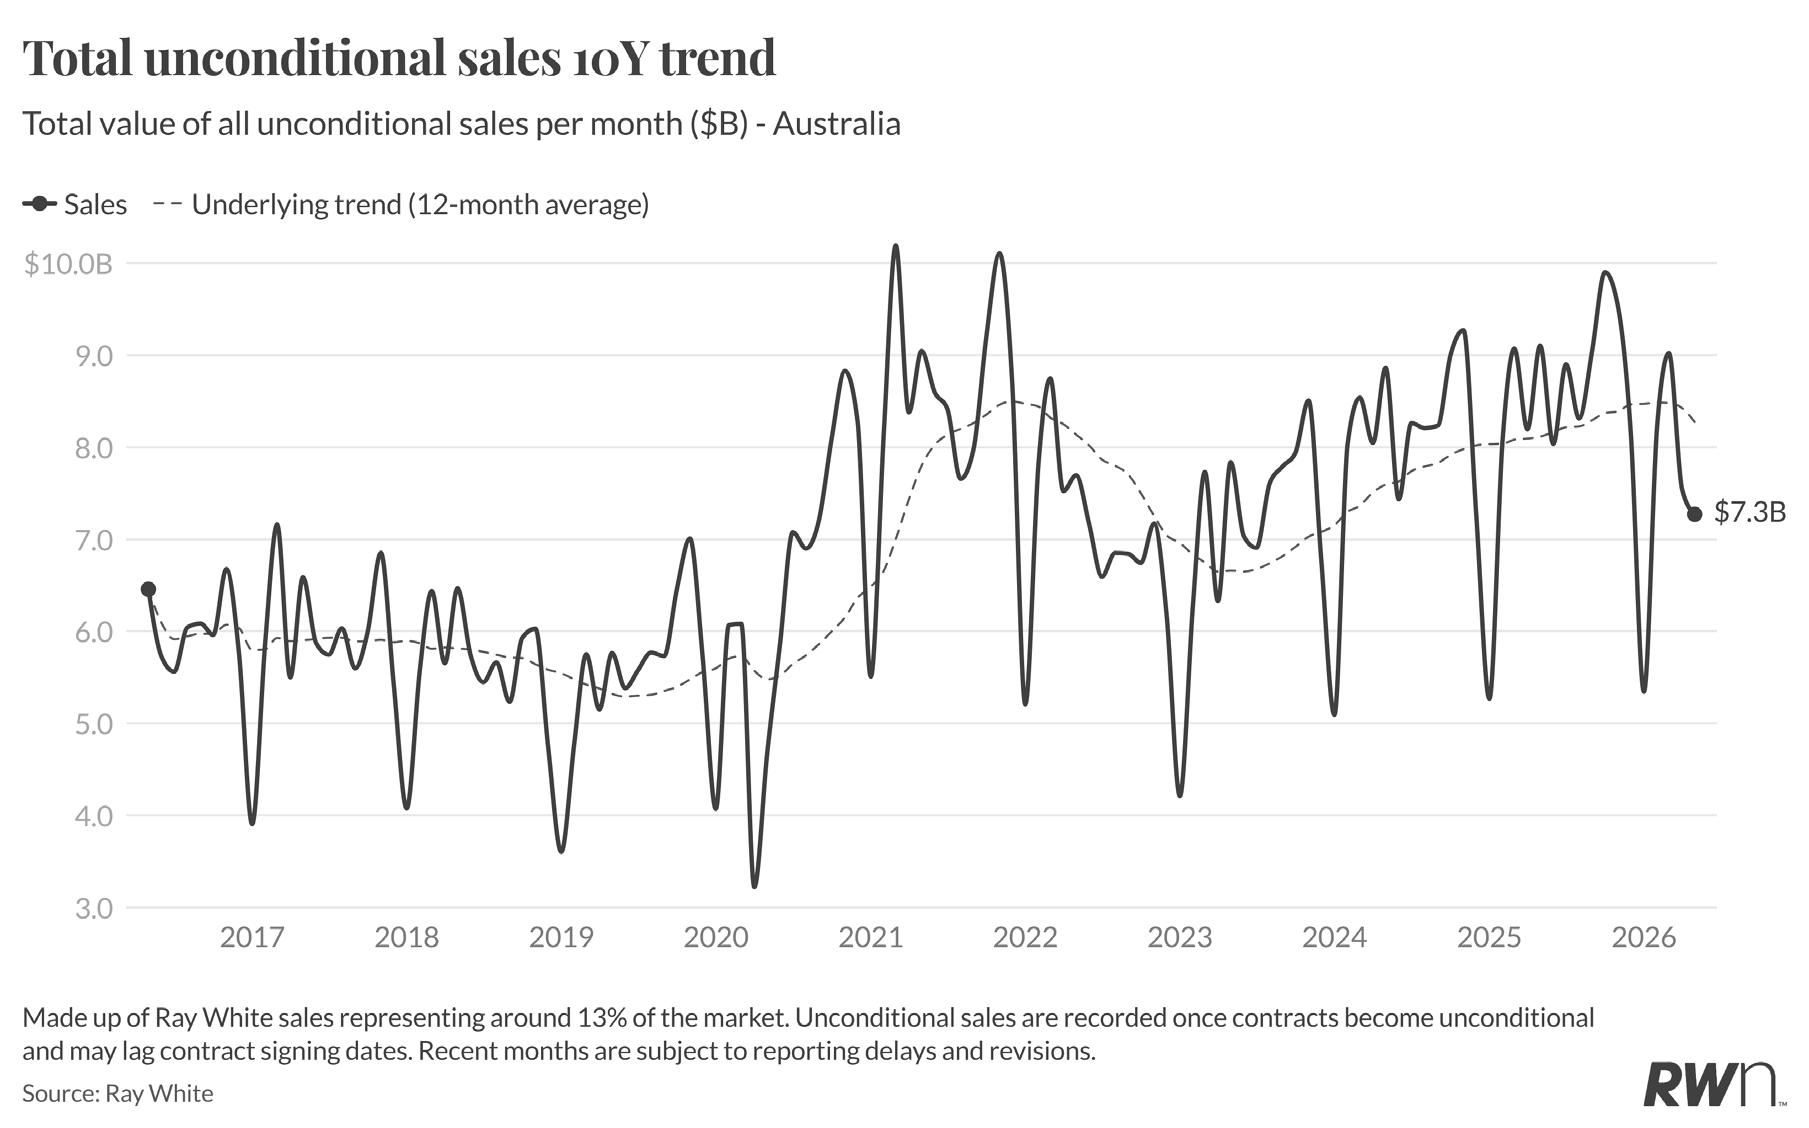
Ray White unconditional sales totalled $7.3 billion in May 2026, a seasonal step-down from the near-$10 billion recorded around the spring peak, yet broadly consistent with the May pattern seen in prior years.
The 12-month underlying trend sits at approximately $8.4 billion, which remains historically elevated and well above the pre-pandemic average of around $6 billion. The trend line has flattened over recent months however, having risen steadily through 2024 and 2025.
The May result reflects a market that is still transacting but at a more measured pace. Three consecutive rate rises have reduced purchasing capacity, and the postbudget pause in investor decision-making has removed a segment of buyers who would otherwise have been active. Market activity suggests that the strong momentum that characterised the sales value series through 2025 has eased.