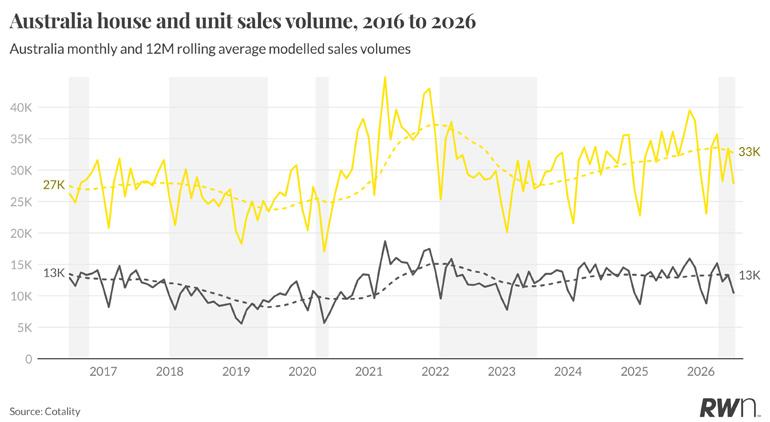
Monthly sales volumes eased in June, with an estimated 27,931 houses and 10,488 units changing hands nationally, down from 33,430 houses and 13,305 units in May. This follows a broadly similar pattern to June last year, when volumes also stepped down from the May result of 36,105 houses and 14,100 units, though this year’s June figure sits below the same month in 2025 for both property types.
The 12-month rolling average, a more reliable read on the underlying trend, tells a steadier story. Houses are averaging 32,725 sales a month on a rolling basis and units 13,115, both little changed from May’s 33,096 and 13,312 and broadly in line with the levels recorded through most of the past six months. Volumes have held in a relatively narrow band since February, between roughly 32,700 and 33,600 for houses, suggesting the softer clearance rates and bidder numbers discussed elsewhere in this report have not yet flowed through to a material change in the pace of transactions. Whether June’s monthly dip marks the start of a genuine slowdown or simply reflects the usual seasonal step down into the middle of the year will become clearer as the rolling average is updated over the coming months.
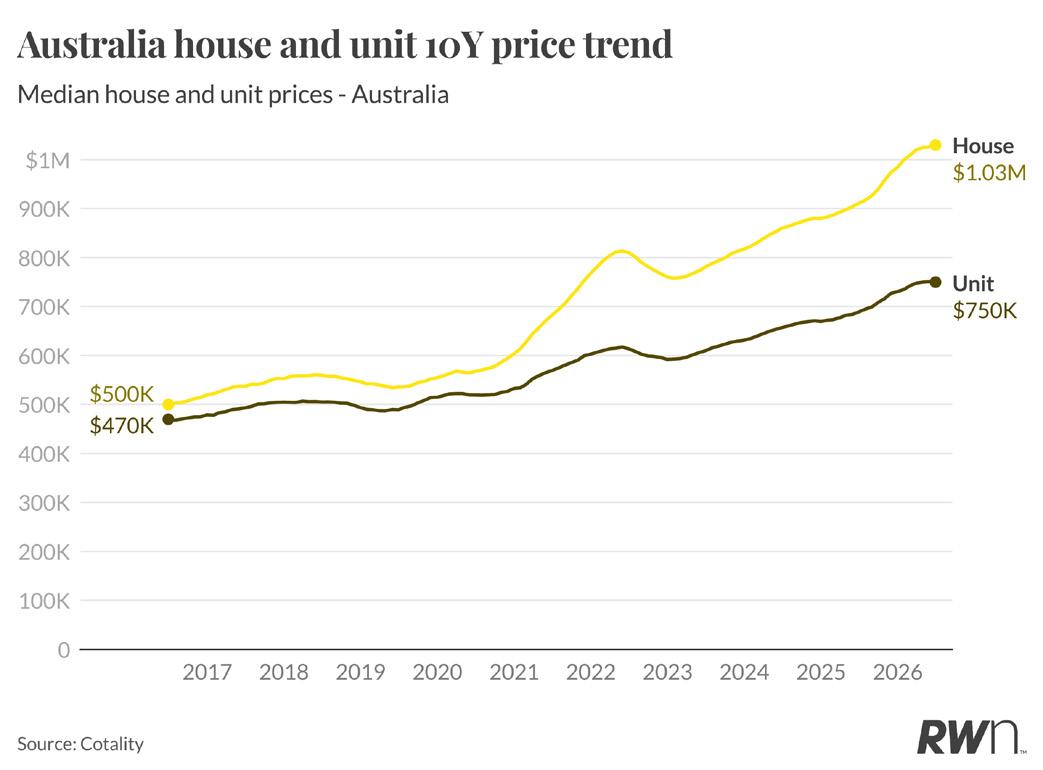
The national median house price now sits at $1.03 million, more than double the $500,000 recorded a decade ago, while the median unit price has grown to $750,000 from $470,000 over the same period. Houses have consistently outpaced units over the decade, particularly through the 2021 and 2024-25 growth phases, widening the gap between the two property types.
The past twelve months have added meaningfully to that long-term trend, even as monthly momentum has begun to slow. The Reserve Bank held the cash rate steady through June after a run of earlier increases, and while inflation continues to ease, now at four per cent, it remains above the RBA’s 2-3 per cent target band, leaving little room for near-term relief. This longer-term view is a useful reminder that periods of softer monthly momentum have historically tended to moderate price growth rather than reverse it.
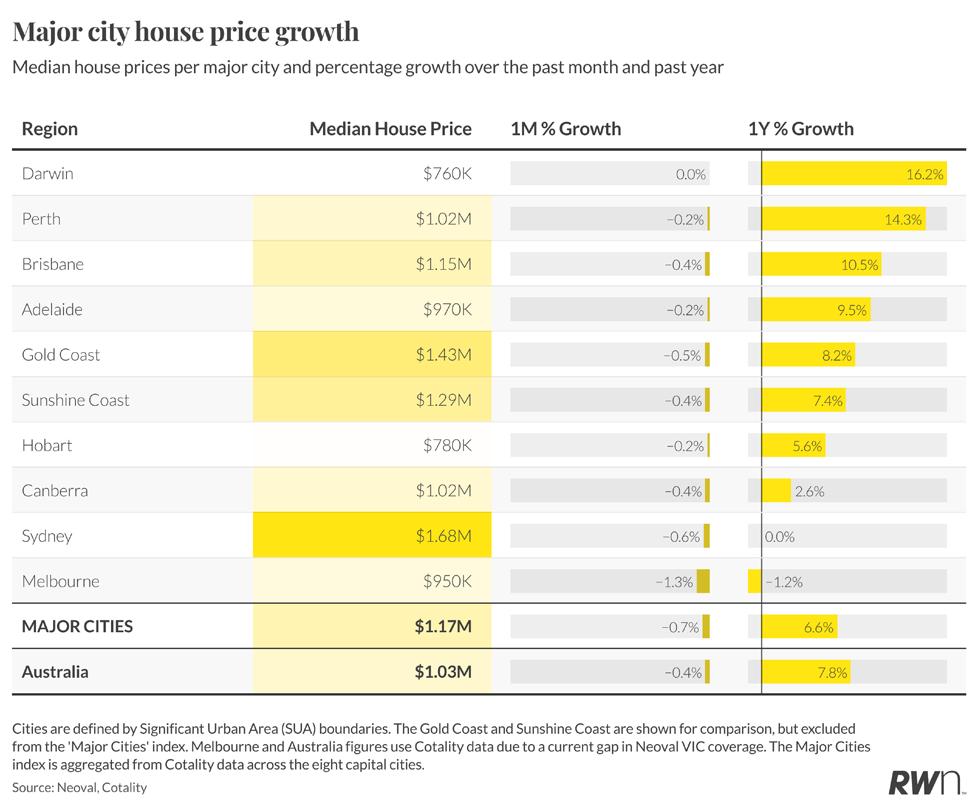
Darwin (16.2 per cent) and Perth (14.3 per cent) continue to lead annual house price growth among the capitals, followed by Brisbane at 10.5 per cent and Adelaide at 9.5 per cent. The Gold Coast (8.2 per cent) and Sunshine Coast (7.4 per cent) remain firmly positive, while Hobart has grown a more modest 5.6 per cent and Canberra just 2.6 per cent over the year. Sydney has flattened out entirely at 0.0 per cent annual growth, and Melbourne is now the only capital in negative territory, down 1.2 per cent over the past twelve months.
On a monthly basis, most capitals recorded a decline in June, led by Melbourne at minus 1.3 per cent and Sydney at minus 0.6 per cent, while Darwin was the only capital to hold flat. The major cities result fell 0.7 per cent over the month to $1.17 million, while the national median eased 0.4 per cent to $1.03 million. This broad-based monthly softening follows the Federal Budget’s changes to negative gearing and capital gains tax now being legislated, alongside a further amendment restricting self-managed superannuation funds from borrowing to purchase residential property. Existing SMSF arrangements are protected and a 45-day transition period applies, so the immediate market impact is limited, though it removes another avenue investors had been weighing up as the tax settings around property continue to shift.
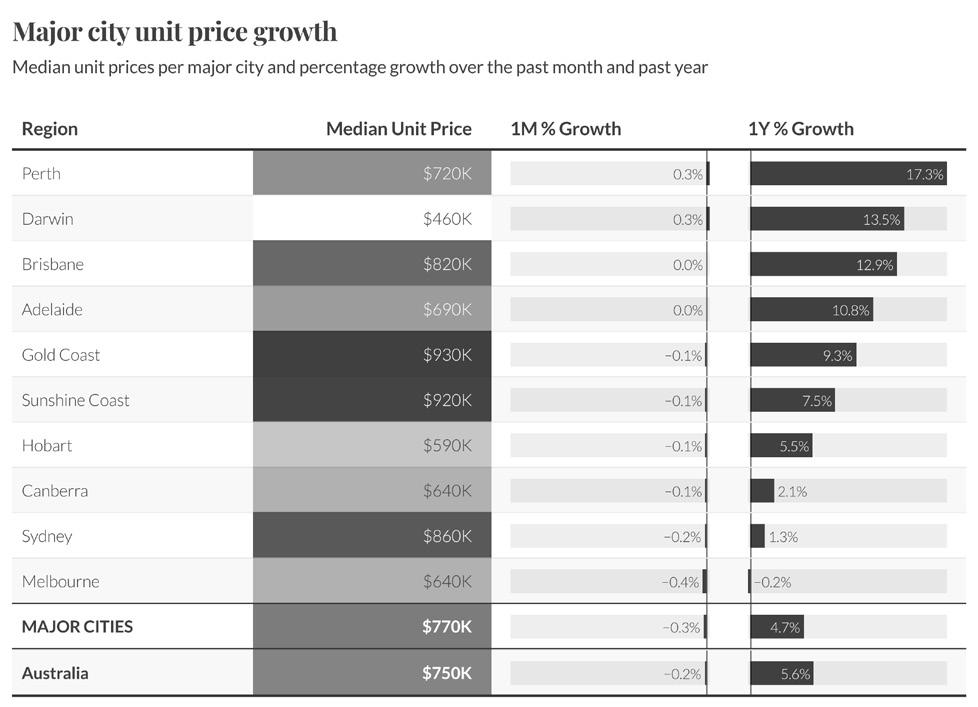
Units have again outperformed houses on an annual basis across most capitals. Perth leads at 17.3 per cent, followed by Darwin at 13.5 per cent, Brisbane at 12.9 per cent and Adelaide at 10.8 per cent. The Gold Coast (9.3 per cent) and Sunshine Coast (7.5 per cent) remain solid, while Hobart (5.5 per cent) and Canberra (2.1 per cent) trail. Sydney unit growth has slowed to 1.3 per cent annually, and Melbourne units recorded a 0.2 per cent annual decline, the only negative result among the capitals.
Monthly movements were mixed rather than uniformly negative, with Perth and Darwin both recording modest 0.3 per cent gains while Sydney and Melbourne eased 0.2 per cent and 0.4 per cent respectively. The major cities unit median sits at $770,000, down 0.3 per cent over the month but still up 4.7 per cent annually, while the national unit median of $750,000 continues to grow faster than the equivalent house figure on a monthly basis, reflecting ongoing affordability-driven demand for higherdensity stock.
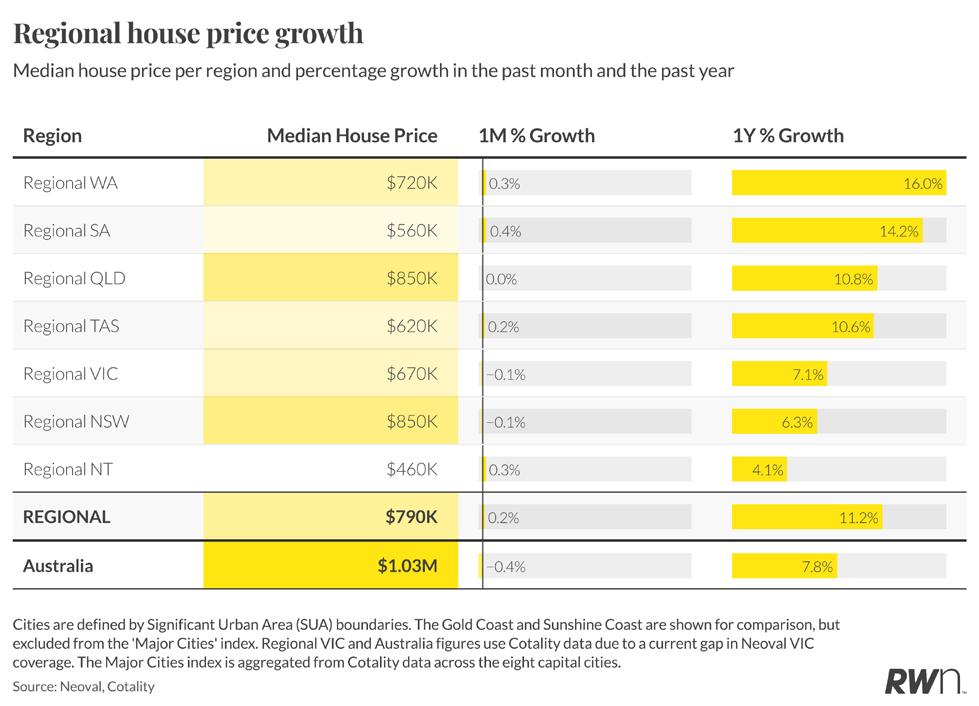
Regional markets continue to outperform the capitals on an annual basis. Regional Western Australia leads the country at 16.0 per cent annual growth, followed closely by regional South Australia at 14.2 per cent. Regional Queensland (10.8 per cent) and regional Tasmania (10.6 per cent) also remain firmly in double-digit territory, while regional Victoria (7.1 per cent), regional New South Wales (6.3 per cent) and regional Northern Territory (4.1 per cent) round out a broadly positive picture across the country.
Monthly growth has also held up better regionally than in the capitals, with the overall regional median rising 0.2 per cent to $790,000, comfortably outpacing the 0.4 per cent decline recorded nationally. At 11.2 per cent annual growth, regional Australia continues to run ahead of the 7.8 per cent national figure, underlining that comparative affordability and tighter listing conditions are still drawing buyers away from the major cities.”
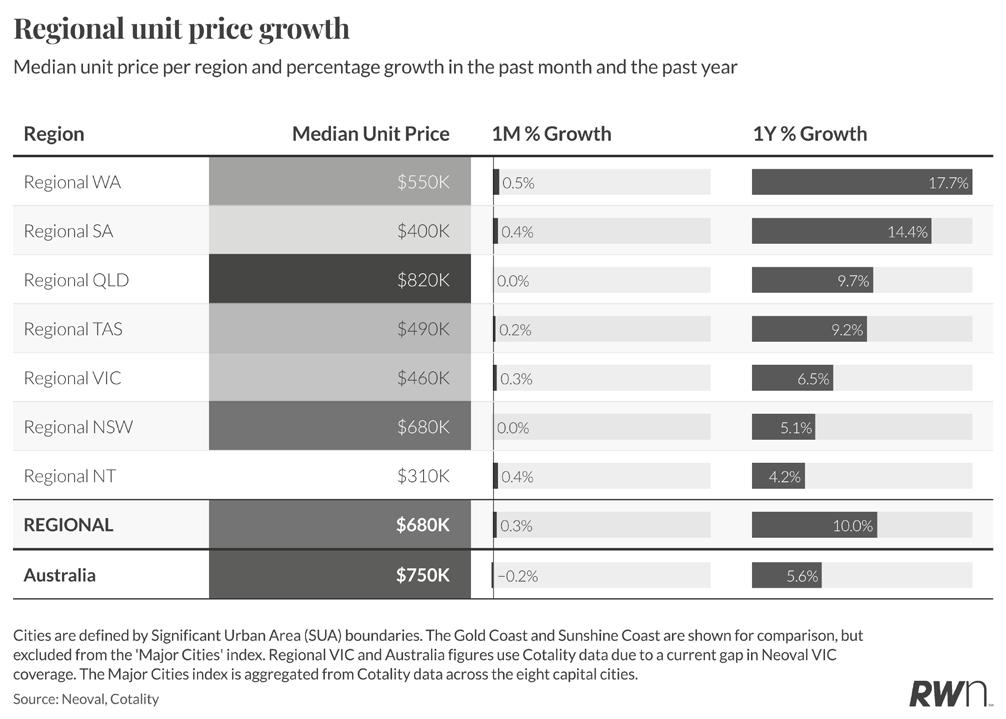
Regional units have followed a similar pattern to regional houses, with regional Western Australia (17.7 per cent) and regional South Australia (14.4 per cent) again leading annual growth nationally. Regional Queensland units, now with a median of $820,000, have grown 9.7 per cent over the year, while regional Tasmania (9.2 per cent), regional Victoria (6.5 per cent), regional New South Wales (5.1 per cent) and regional Northern Territory (4.2 per cent) have all recorded solid, if more moderate, gains.
The overall regional unit median sits at $680,000, up a further 0.3 per cent over the month and 10.0 per cent annually, well ahead of the 5.6 per cent recorded nationally. This continues a now well-established trend of regional and lifestyle markets outperforming the capitals across both housing types, as buyers priced out of the cities look further afield.
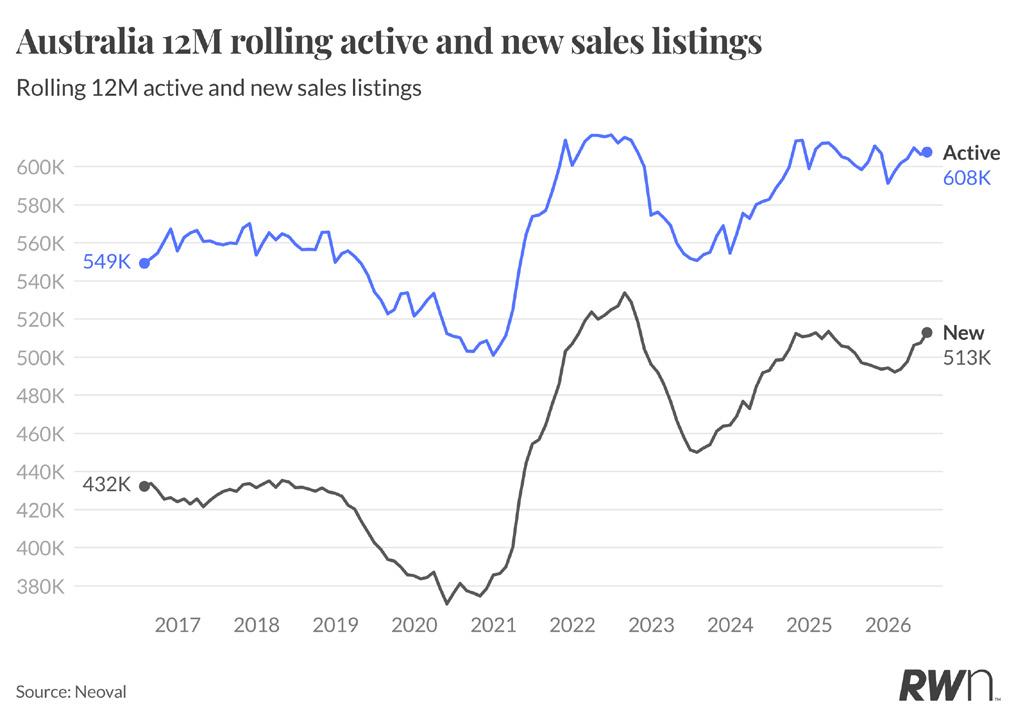
Active listings nationally rose to 607,634 in June, up from 606,435 in May and continuing a gradual climb from the recent low of 591,176 recorded back in December. Over the past twelve months active stock has moved within a fairly narrow band, generally sitting between 597,000 and 611,000, with April’s 609,832 the highest point recorded in that window.
New listings have shown a clearer upward trend, rising to 512,961 in June from 507,492 in May and 492,176 back in January. This is the fifth consecutive month of growth and the highest monthly new listing count in the past year, up from a range that mostly sat between 493,000 and 500,000 through the second half of 2025.
The steady build in new stock coming to market, even as active listings have held relatively steady, points to properties finding buyers at a reasonable pace despite the softer clearance rates and bidder numbers discussed elsewhere in this report. Whether this momentum in new listings carries through into the traditionally quieter winter months will be an important signal for supply conditions heading into spring.
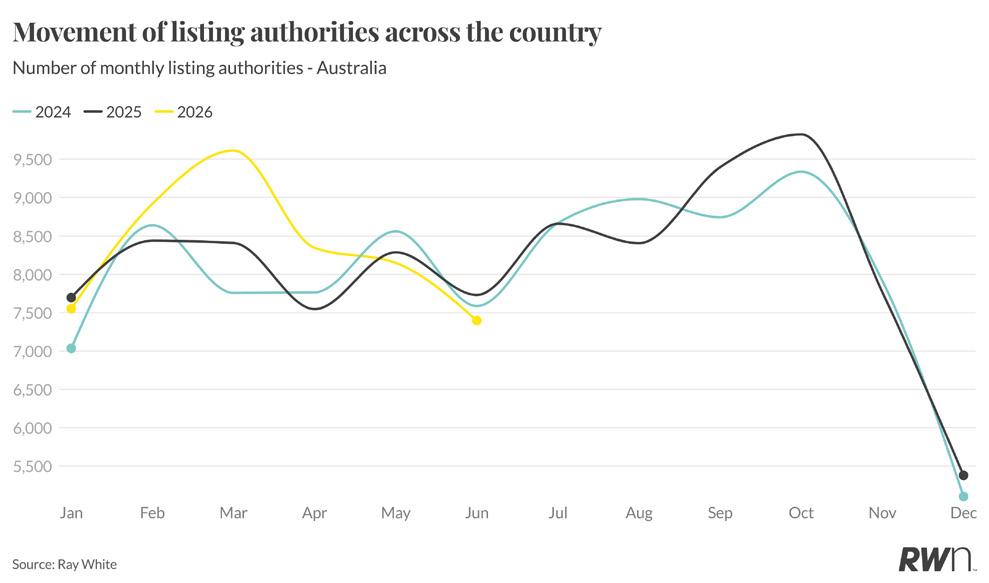
Listing authorities in 2026 have tracked broadly ahead of the prior two years through the first quarter, peaking at roughly 9,600 in March compared to 8,409 in March 2025 and 7,757 in March 2024. That early strength has since eased back more sharply than in either comparable year, with June sitting at approximately 7,300 to 7,400, below both June 2025 (7,731) and June 2024 (7,586).
The pattern this year, a stronger start followed by a faster mid-year pullback, breaks from the more gradual seasonal curve seen in 2024 and 2025, where authorities held up better through the second quarter before building again into the spring peak. Last year’s cycle saw authorities climb from 7,731 in June to a high of 9,824 in October, while 2024 followed a similar late-year build to 9,337. Whether 2026 follows that same pattern into spring, or whether the softer June result reflects the broader vendor hesitation showing up in this month’s clearance rate and bidder data, will be an important trend to watch over the coming months.
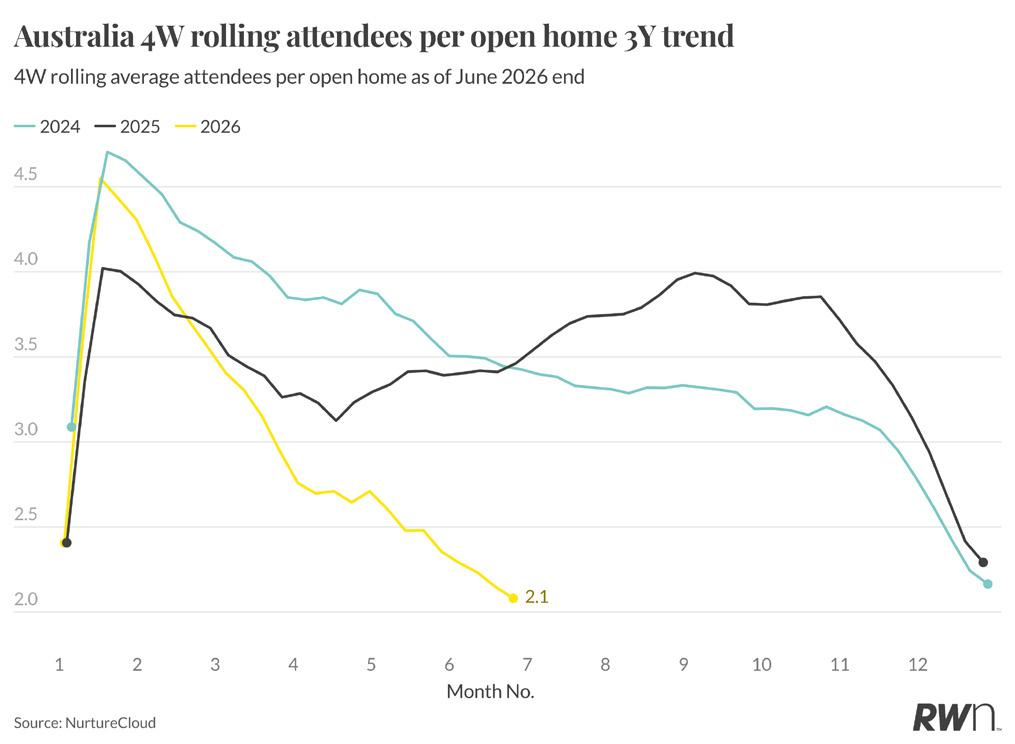
Open home attendance has fallen to 2.1 attendees per inspection on a four-week rolling basis by the end of June, a sharper and earlier decline than either 2024 or 2025, when attendance held up longer into the middle of the year before easing toward year end. At the same point last year, attendance was still tracking above 3.6.
This earlier and steeper fall points to buyer caution building more quickly this cycle than in prior years, likely reflecting the combined weight of the June rate hold following earlier increases, inflation still running above target at four per cent, and the uncertainty created by the recently legislated property tax and SMSF borrowing changes. Attendance trends will be an important early indicator of whether this caution deepens or stabilises heading into the second half of the year.
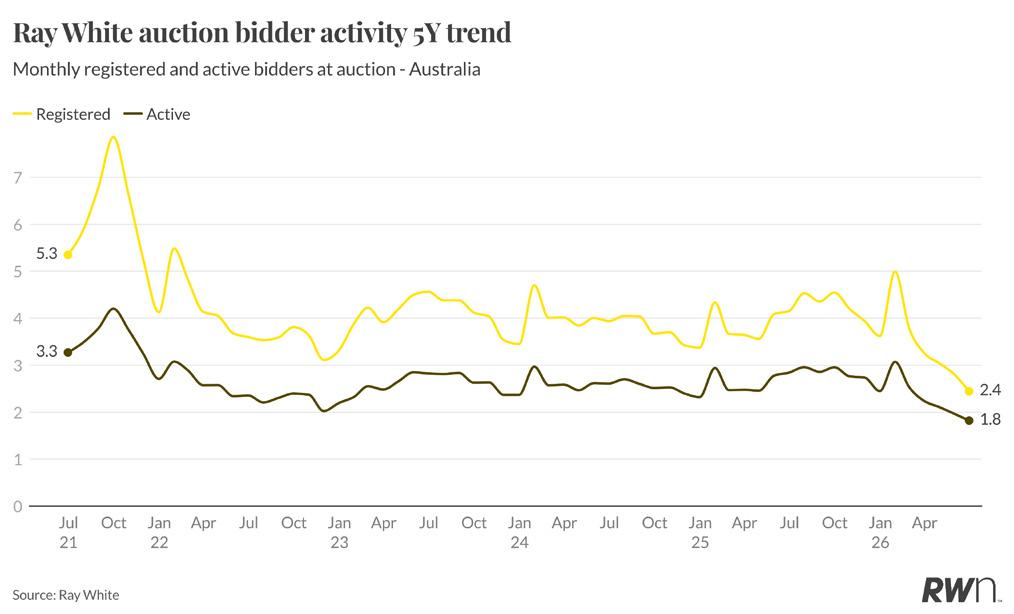
Registered bidders have eased to 2.4 per property, with active bidders down to 1.8, both continuing a downward trend that has been building since the early autumn peak of 5.0 registered and 3.1 active bidders. This is now well below the levels recorded over the same period in previous years and reflects the broader softening in buyer engagement also evident in clearance rates.
Bidder numbers have generally trended lower across the full five-year series since the exceptional 2021 peak, when registered bidders averaged as high as 7.9. The current readings sit toward the lower end of that longer range, reinforcing that competitive tension at auction has diminished meaningfully as households navigate higher borrowing costs, ongoing inflation pressure and uncertainty around the recent tax and superannuation changes.
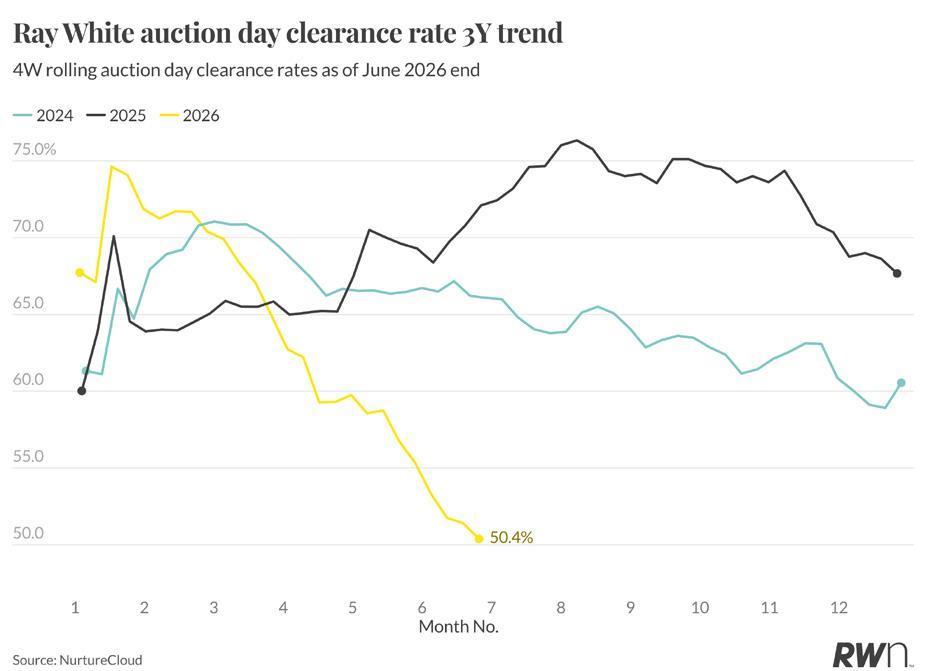
Auction clearance rates have fallen sharply through the first half of the year, dropping to 50.4 per cent on a four-week rolling basis by the end of June, well below the 67.4 per cent recorded at the same point in 2025 and the roughly 60 per cent seen in 2024. The decline has been steady and consistent since March, when 2026 was tracking above both prior years at over 70 per cent.

This is a clear signal that buyer commitment on auction day has softened materially over recent months. While this does not point to a broad price correction given the structural supply shortage still in place, it does confirm that the earlier resilience shown through rate rises and policy changes is now clearly fading, consistent with the sharper pullback in listing authorities discussed above.
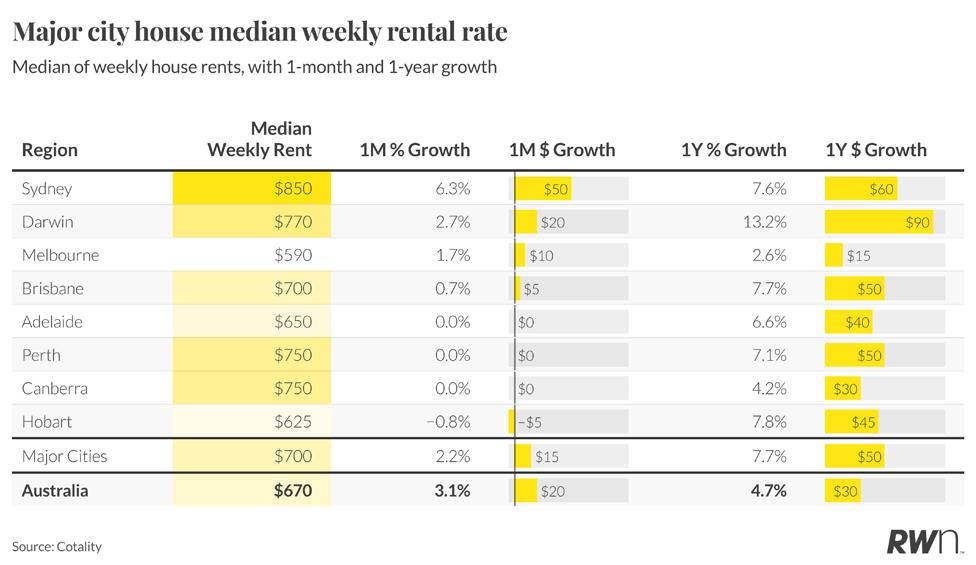
Sydney recorded the strongest monthly house rent growth among the major markets, up 6.3 per cent to a median of $850 a week, and now the most expensive capital for house rentals. Darwin (2.7 per cent) and Melbourne (1.7 per cent) also posted solid monthly gains, while Adelaide, Perth and Canberra all held flat over the month. Hobart was the only capital to record a monthly decline, down 0.8 per cent to $625.
On an annual basis, Darwin leads at 13.2 per cent, followed by Hobart at 7.8 per cent and Brisbane at 7.7 per cent. Melbourne recorded the softest annual growth at 2.6 per cent, continuing to reflect that city’s comparatively deeper rental supply. Nationally, house rents grew 4.7 per cent annually to $670 a week, with the national monthly increase of 3.1 per cent outpacing every individual capital, driven by the size of Sydney’s contribution to the overall figure.
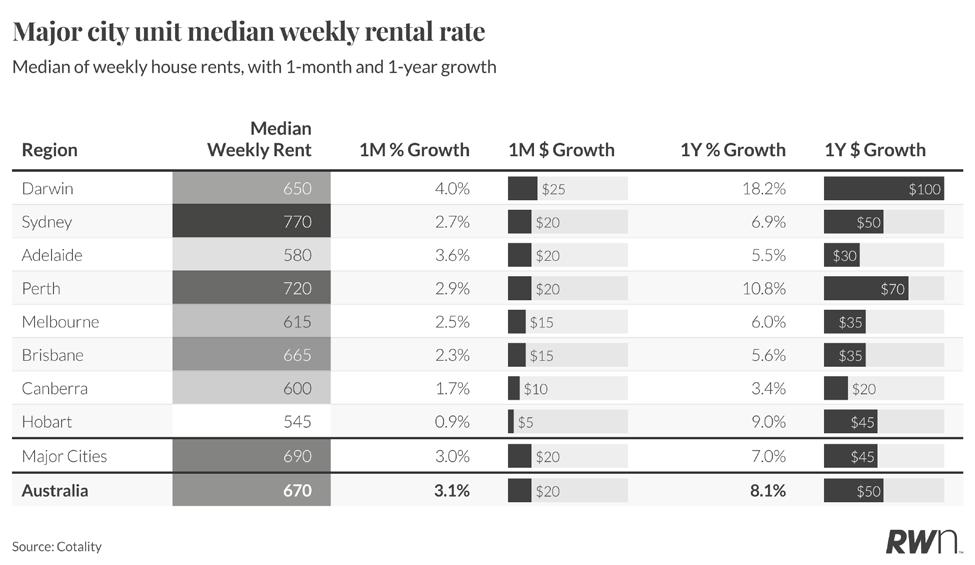
Unit rent growth was broad-based across the capitals this month, with every major city recording a monthly increase. Darwin led at 4.0 per cent to $650 a week, followed by Adelaide (3.6 per cent) and Perth (2.9 per cent). Sydney and Melbourne both grew a further 2.7 per cent and 2.5 per cent respectively, while Hobart posted the softest monthly gain at 0.9 per cent.
Darwin also leads annual unit rent growth by a wide margin at 18.2 per cent, well ahead of Perth (10.8 per cent) and Hobart (9.0 per cent). Canberra recorded the softest annual growth at 3.4 per cent. Nationally, unit rents rose 8.1 per cent annually to $670 a week, now growing faster than house rents on an annual basis and continuing to outpace the sales market’s price growth in several cities.

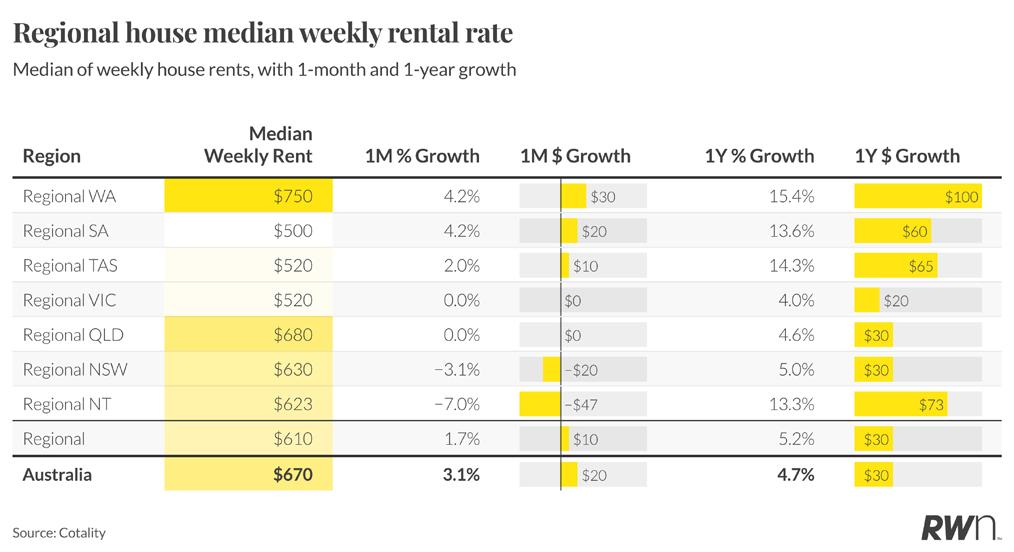
Regional Western Australia and regional South Australia both recorded the strongest monthly house rent growth at 4.2 per cent, taking their medians to $750 and $500 respectively. Regional Tasmania grew a further 2.0 per cent, while regional Victoria and regional Queensland held flat over the month. Regional Northern Territory recorded a sharp monthly pullback, down 7.0 per cent, and regional New South Wales eased 3.1 per cent.
Despite the monthly fall, regional Northern Territory remains up 13.3 per cent annually, behind only regional Western Australia at 15.4 per cent. Regional Victoria recorded the softest annual growth at 4.0 per cent. The overall regional median sits at $610 a week, up 5.2 per cent annually, slightly ahead of the 4.7 per cent recorded nationally.
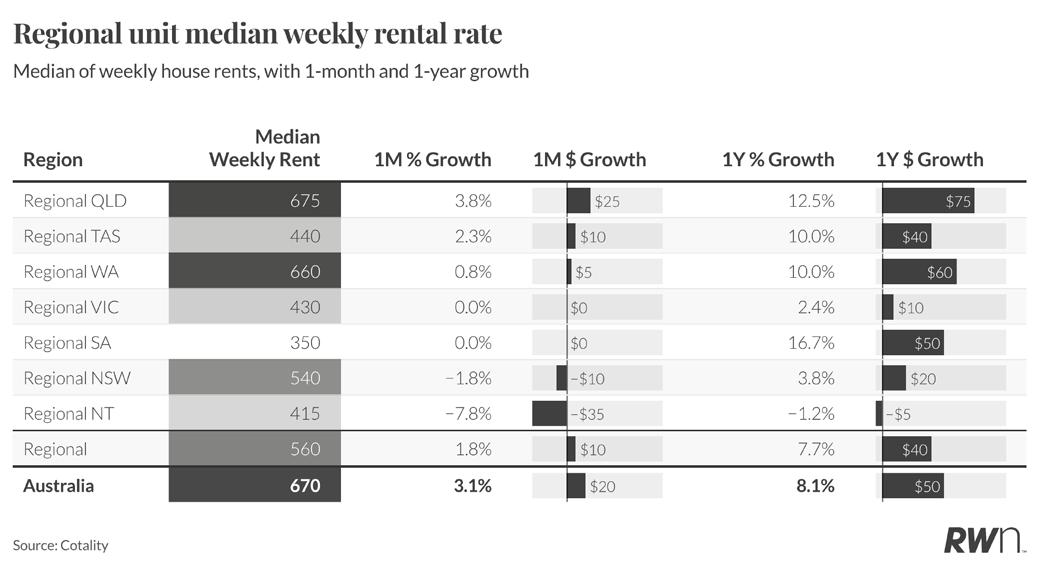
Regional Queensland recorded the strongest monthly unit rent growth at 3.8 per cent to $675 a week, now the highest priced regional unit market. Regional Tasmania grew a further 2.3 per cent and regional Western Australia 0.8 per cent, while regional Victoria and regional South Australia held flat over the month. Regional Northern Territory recorded the softest result, down 7.8 per cent, and regional New South Wales eased 1.8 per cent.
Regional South Australia leads annual growth at 16.7 per cent despite no monthly movement, followed by regional Queensland at 12.5 per cent. Regional Northern Territory is the only market in annual decline, down 1.2 per cent over the year. The overall regional median rose to $560 a week, up 7.7 per cent annually, slightly below the 8.1 per cent recorded nationally.
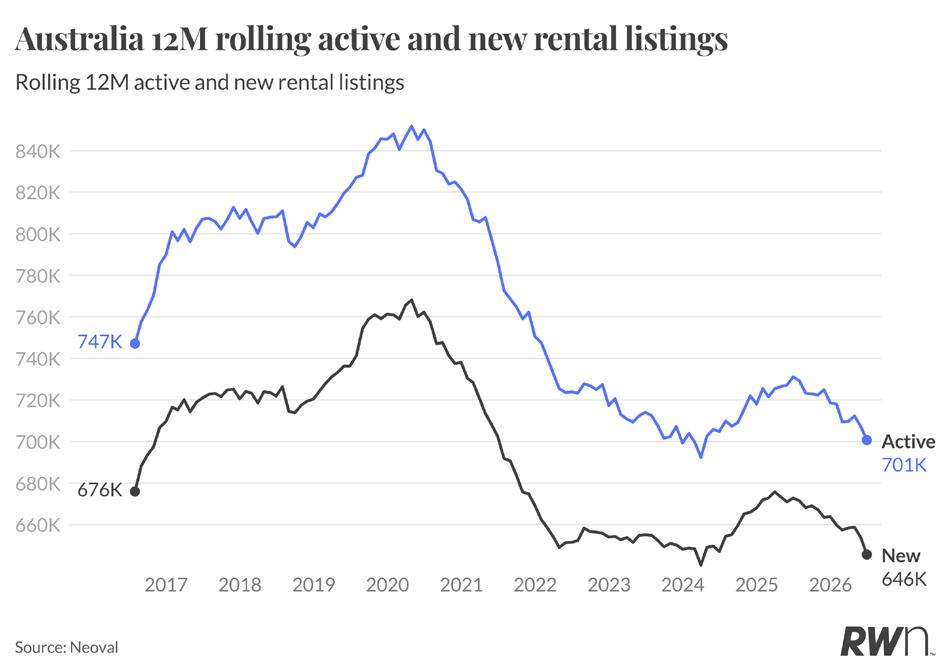
Active rental listings continued their gradual decline in June, easing to 700,692 on a rolling 12-month basis from 707,202 in May and 712,297 in April. This extends a steady downward trend that has been in place since at least last October, when active rental stock stood at 722,416, a fall of more than 21,000 properties over the past eight months.
New rental listings have followed the same pattern, dropping to 645,570 in June from 653,781 in May and 658,728 in April. This is the lowest monthly figure
recorded in the series shown, down from 671,456 in July last year. The consistent decline in both active and new rental stock, even as sales listings have been building over the same period, points to a rental pool that continues to tighten well ahead of any impact from the recently legislated SMSF borrowing changes. With that ban now in effect and negative gearing set to be limited to new builds from mid-2027, the risk is that this existing tightness in established rental supply becomes more entrenched rather than easing.
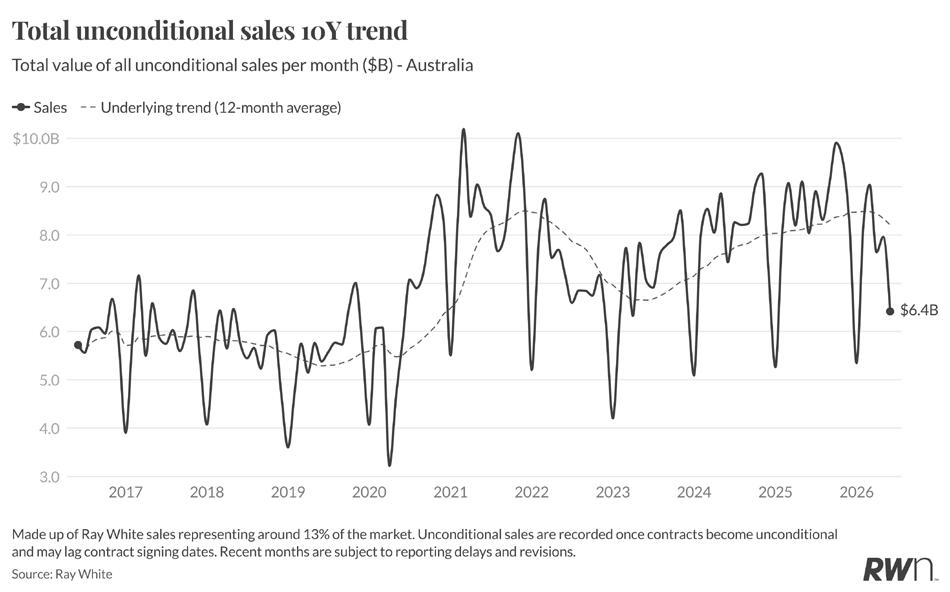
Ray White Group’s total unconditional sales reached $6.4 billion in June, a step down from the elevated levels recorded earlier in the year and consistent with the softer clearance rate and bidder activity outlined above. This figure sits below the 12-month underlying trend, which remains above $8 billion, suggesting June’s result reflects near-term softening rather than a structural shift.
Unconditional sales values have moved through repeated peaks and troughs over the past decade, and the current pullback follows a similar pattern to previous periods of policy or rate driven uncertainty. With the SMSF borrowing changes and broader tax reforms now settled into law, the coming months will help clarify whether this is a temporary pause or the start of a more sustained moderation in transaction activity.