Int J ........ 20XX;2X(X):00-00.
Lead-Less Gresham: A Community Case Study based on Legacy Lead Exposure Mapping in Auburn-Gresham, Chicago
Rana Khaled AlSheikh, MPH, MBA
College of Science and Health, DePaul University, Chicago, IL, School of Public Health and Tropical Medicine, Tulane University
Abstract: Lead exposure poses a serious public health risk, particularly for vulnerable populations such as children in neighborhoods like Auburn Gresham, Chicago. Historical and infrastructural factors contribute to elevated lead levels in drinking water, necessitating effective monitoring and intervention strategies. This study aims to increase public awareness of lead resources through increasing accessibility of data to facilitate informed community-based decision-making.
I developed a user-friendly website with a visual tool that summarized lead level data. I obtained the data from the Chicago Water Department's Lead Safe Chicago website (10). The Chicago Water Department facilitates residential water and lab testing at the request of residents and publishes the data at the Census block level annually. I used Excel and a basic statistical analysis in R to establish a community profile regarding lead exposure. I used Environmental Justice Screening and Mapping Tool (EJ Screen), Chicago Metropolitan Agency for Planning (CMAP) and CDPH statistical and map data to build the basic community profile of Auburn Gresham. Statistical analyses of Auburn Gresham revealed a mean lead concentration of 9.74 parts per billion (ppb), with a maximum observed level of 45 ppb. These findings are significant, as detectable lead in the environment may pose health risks. The FDA mandates that bottled water must be below 5.0 ppb and the Safe Drinking Water Act (SDWA) has reduced the maximum allowable lead content that is, content that is considered "lead-free" to be a weighted average of 0.25 percent, the equivalent to 0.25 ppb, calculated across wetted surfaces of pipes, pipe fittings, plumbing fittings, and fixtures and 0.2 percent for solder and flux (28, 31). The study emphasizes the urgent need for enhanced lead regulations and proactive testing in high-risk communities. The framework established supports future mapping efforts, empowering residents to engage in public health advocacy and promote safer drinking water initiatives.
Keywords: legacy lead issues, aging urban area, GIS mapping, Chicago neighborhood, program development
Correspondence: Professor Rana K AlSheikh, MPH, MBA, Faculty of Continuing Education, Wilbur Wright College, Room A-140, Chicago, IL. E-mail: ralsheikh@ccc.edu
Submitted: October 31st, 2024 Revised: November 22nd, 2024
Introduction
Auburn Gresham is a historically significant community located on Chicago's far South Side. Often shortening its name, Gresham is known for its architecture, which primarily consists of bungalows and multi-unit structures constructed in the 1910s to 1930s (1-3). The neighborhood experienced demographic shifts over the years, particularly during the 1950s. These shifts resulted in a drop of nearly 10,000 residents from 1960 to 1970 due to racial tension and violence in nearby neighborhoods (2, 4). By 1970, the Auburn Gresham population was predominantly Black, with many residents working for Chicago's CTA system or social services organizations, contributing to the community's identity (4). Compared to Chicago, whose average income rests at $67,781, Auburn Gresham households have an average income of $37,741 (11).
Between 1920 and 1930, Auburn Gresham saw one of the largest population increases in Chicago’s history. Over this 10-year period, the population nearly tripled from 19,558 to 57,381 (4). This fueled the construction of residential blocks of buildings constructed prior to the 1970s. Housing built prior to 1978 may be considered as high risk for lead contamination (5).
In 1978, lead was outlawed for use in nearly all widely available materials in the United States. The same year, federal law also implemented the Early and Periodic Screening, Diagnosis, and Treatment Benefit (EPSDT) under Medicaid. The benefit required screening children aged 12-24 months for lead poisoning nationwide by public health departments (6, 27).
Auburn Gresham is the 13th most populated neighborhood in Chicago with children under the age of 4. Children under age 4 make up about 25% of the population in Auburn Gresham and 3% of the population in all of Chicago (14).
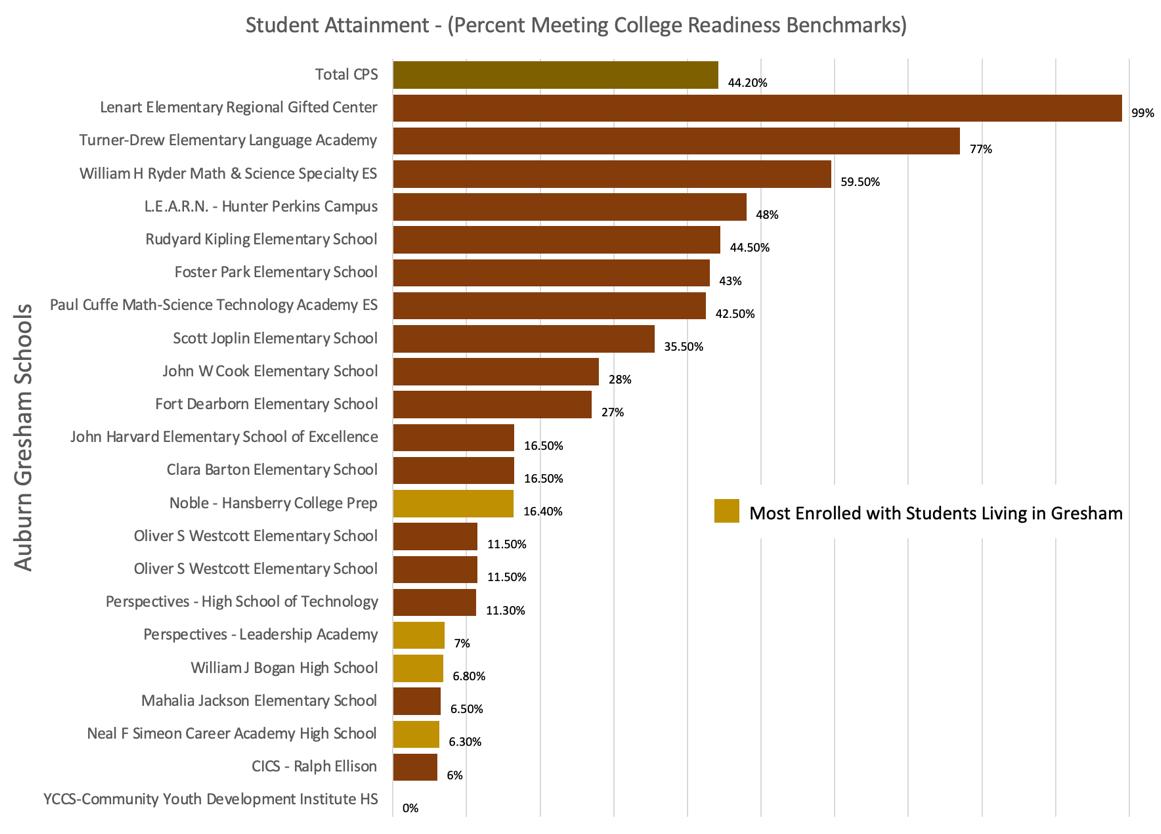

Figure 3: Student Attainment (16, 17, 18)
Only 31% of children in this age group have undergone lead screening, which highlights the level of undertesting that occurs (711). Lead exposure is associated with various intellectual and behavioral problems in children, including lower IQ scores, learning
difficulties, attention deficit-hyperactivity disorder (ADHD), and school failure (6, 12, 13). Lead in residential areas can be in water service lines, paint, and yard soil. Some examples of soil contact include oral behaviors (like hand-to-mouth actions during play), and even through the consumption of lead-contaminated produce (31).
Figure 1 provides side-by-side maps generated by EJ Screen for Auburn Gresham, zip code 60620 (29). In general, darker areas in EJ Screen maps indicate higher levels of burden for various demographic and environmental concerns. As shown in Figure 1, there are children under age 5 living throughout Auburn Gresham. What is perhaps most significant is the high burden of lead paint throughout Auburn Gresham (right side), which also corresponds to the high numbers of homes with children under age 5 (left side). Within the 13 different census tracts in Auburn Gresham, lead-based paint burden associated with housing built prior to 1960 is in the 90 - 100 percentile as compared to other communities in the nation (14, 15). The EJ Screen map presents the potential exposure to lead paint using percentile rank, ranging from 0 (lowest) to 100 (highest) (30). The higher percentile ranks indicate that people who live in that area have a higher burden of exposure to lead paint as compared to the nation. For example, the dark red percentile indicates areas that have a 95 to 100% greater burden of exposure to lead based paint as compared to the nation (29, 30).
This study focuses on lead in water, but it is important to consider all possible lead exposures for young children. While blood lead testing is mandated, the number of children tested has gradually decreased to 31% of screenings performed on children ages down over 20% from 2019 to 2021 (8, 9).
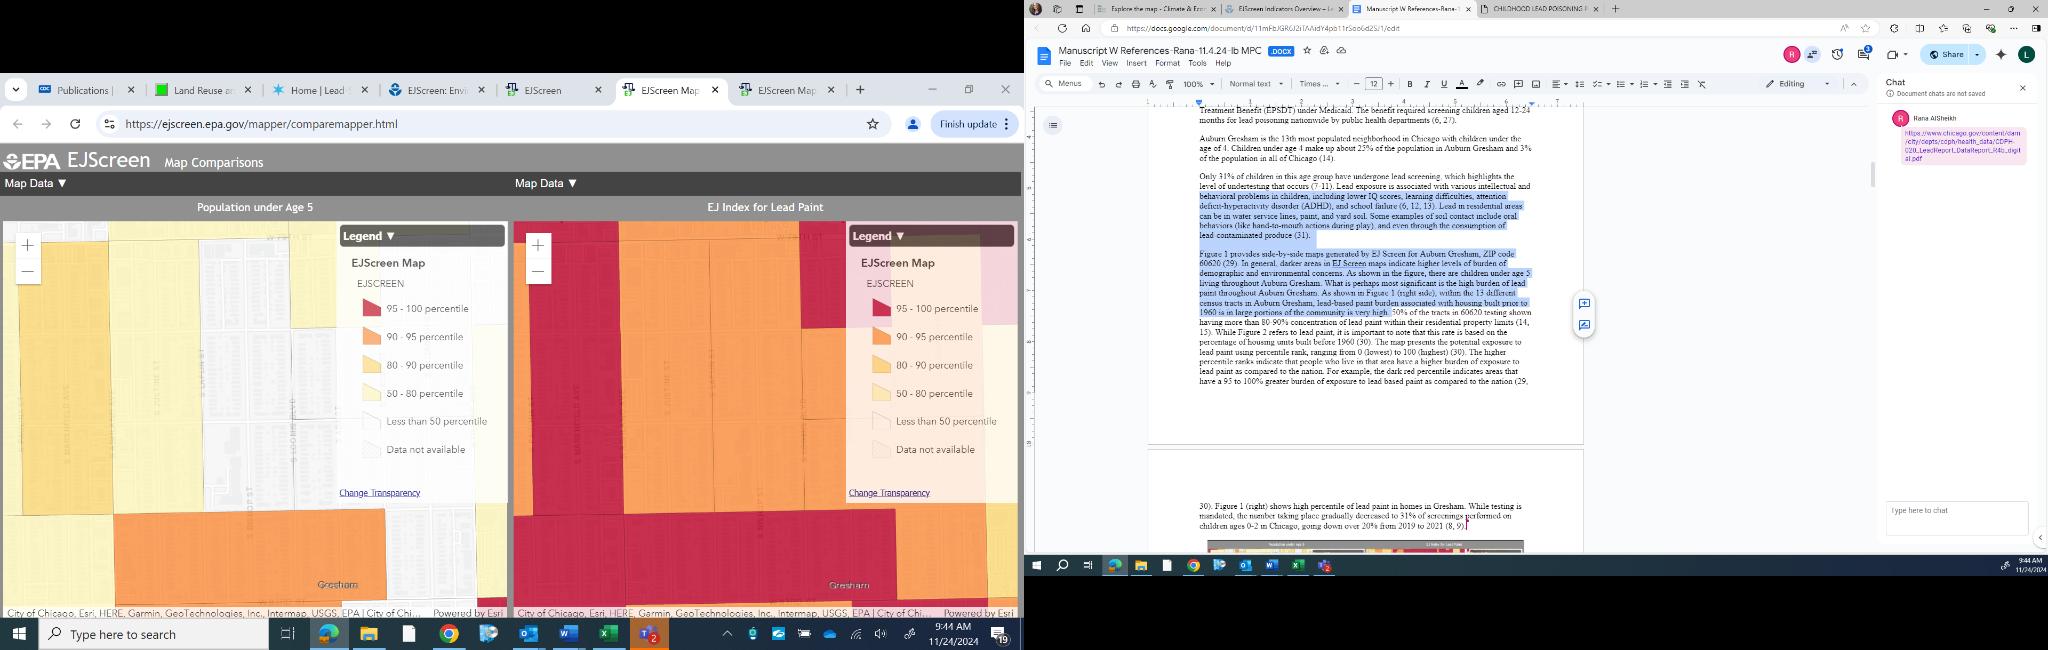
Figure 2 shows Auburn Gresham’s school student attainment, which represents a 75% likelihood of a student achieving at most a C grade in a first-semester, credit-bearing college course in a related subject (15-18). The four schools, highlighted in gold in Figure 2, have the highest enrollment of Auburn Gresham's residents. However, CPS found that in 2022, these schools have some of the lowest attainment scores within the entire zip code area (16).
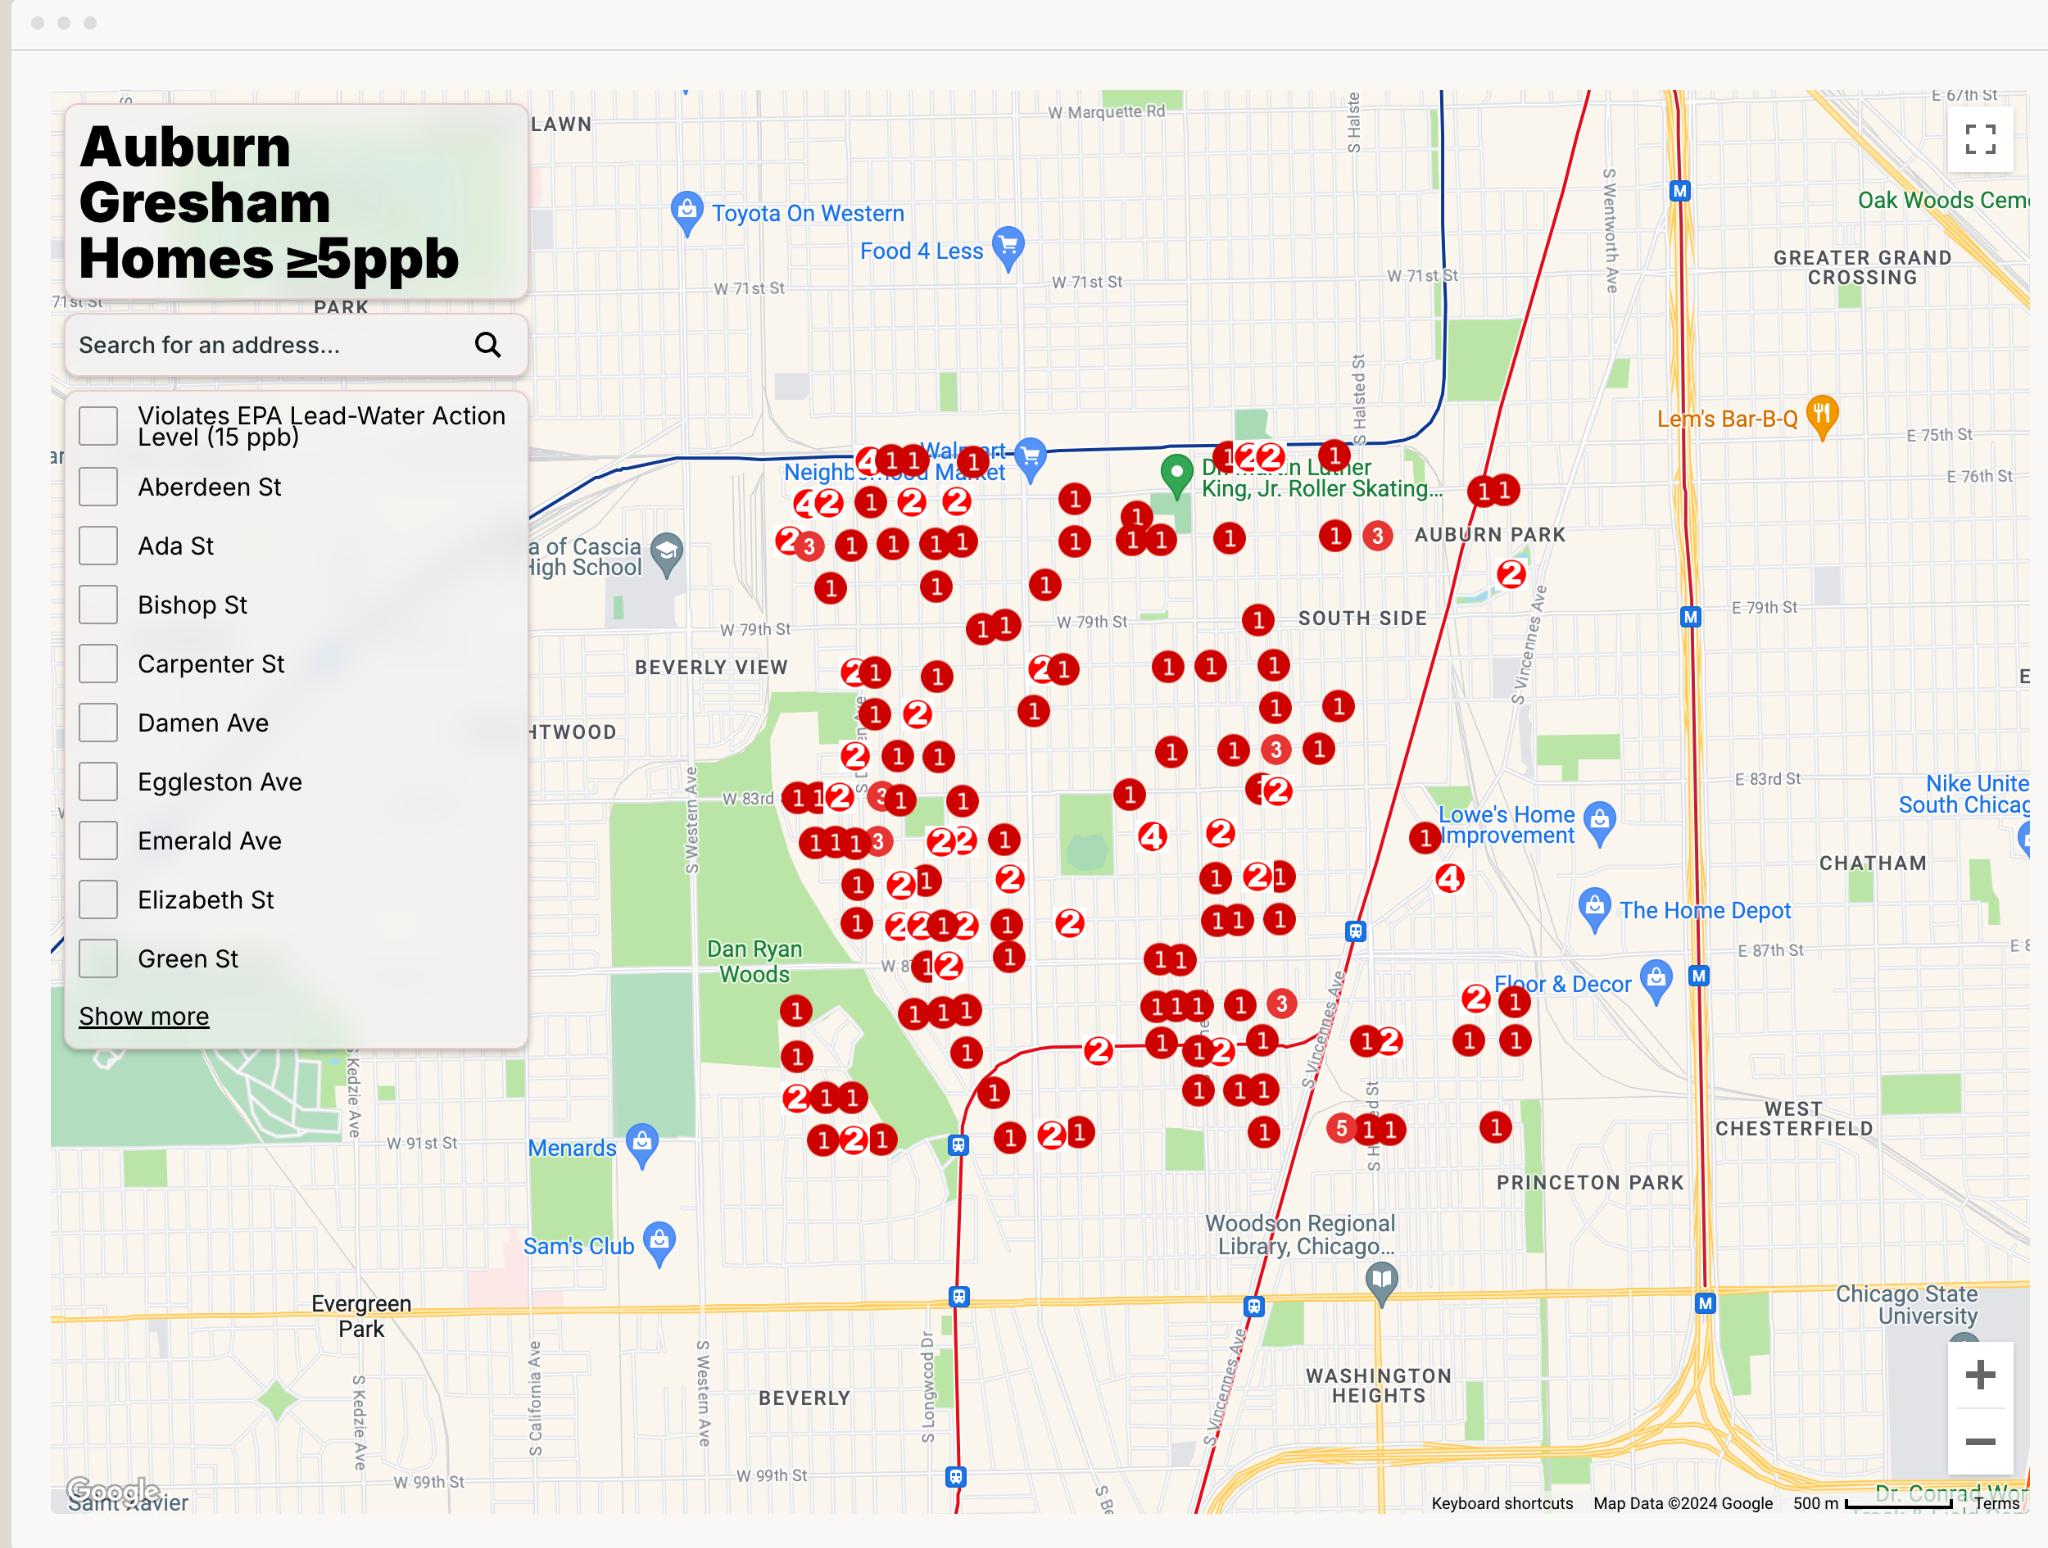
The majority of the homes in Gresham were built prior to the 1970s. With 380,000 lead service lines (LSLs) in Chicago, there is a potential for billions of dollars in replacement costs and widespread lead exposure rates (2, 19). The hope is to call attention to these issues to address the need for lead service line replacement in Chicago and provide a framework for community groups or activists to facilitate wide-scale neighborhood testing prior to costly action. In 2019, Lead-related health disasters, such as the Flint water crisis and the Gold King Mine excavation, emphasize the importance of monitoring and addressing lead contamination to prevent long-term adverse effects (20). Such cases highlight the need for monitoring and evidence-based interventions, which this study addresses by developing a community-specific lead exposure mapping tool. Figure 3 shows an overview of the community mapping tool.
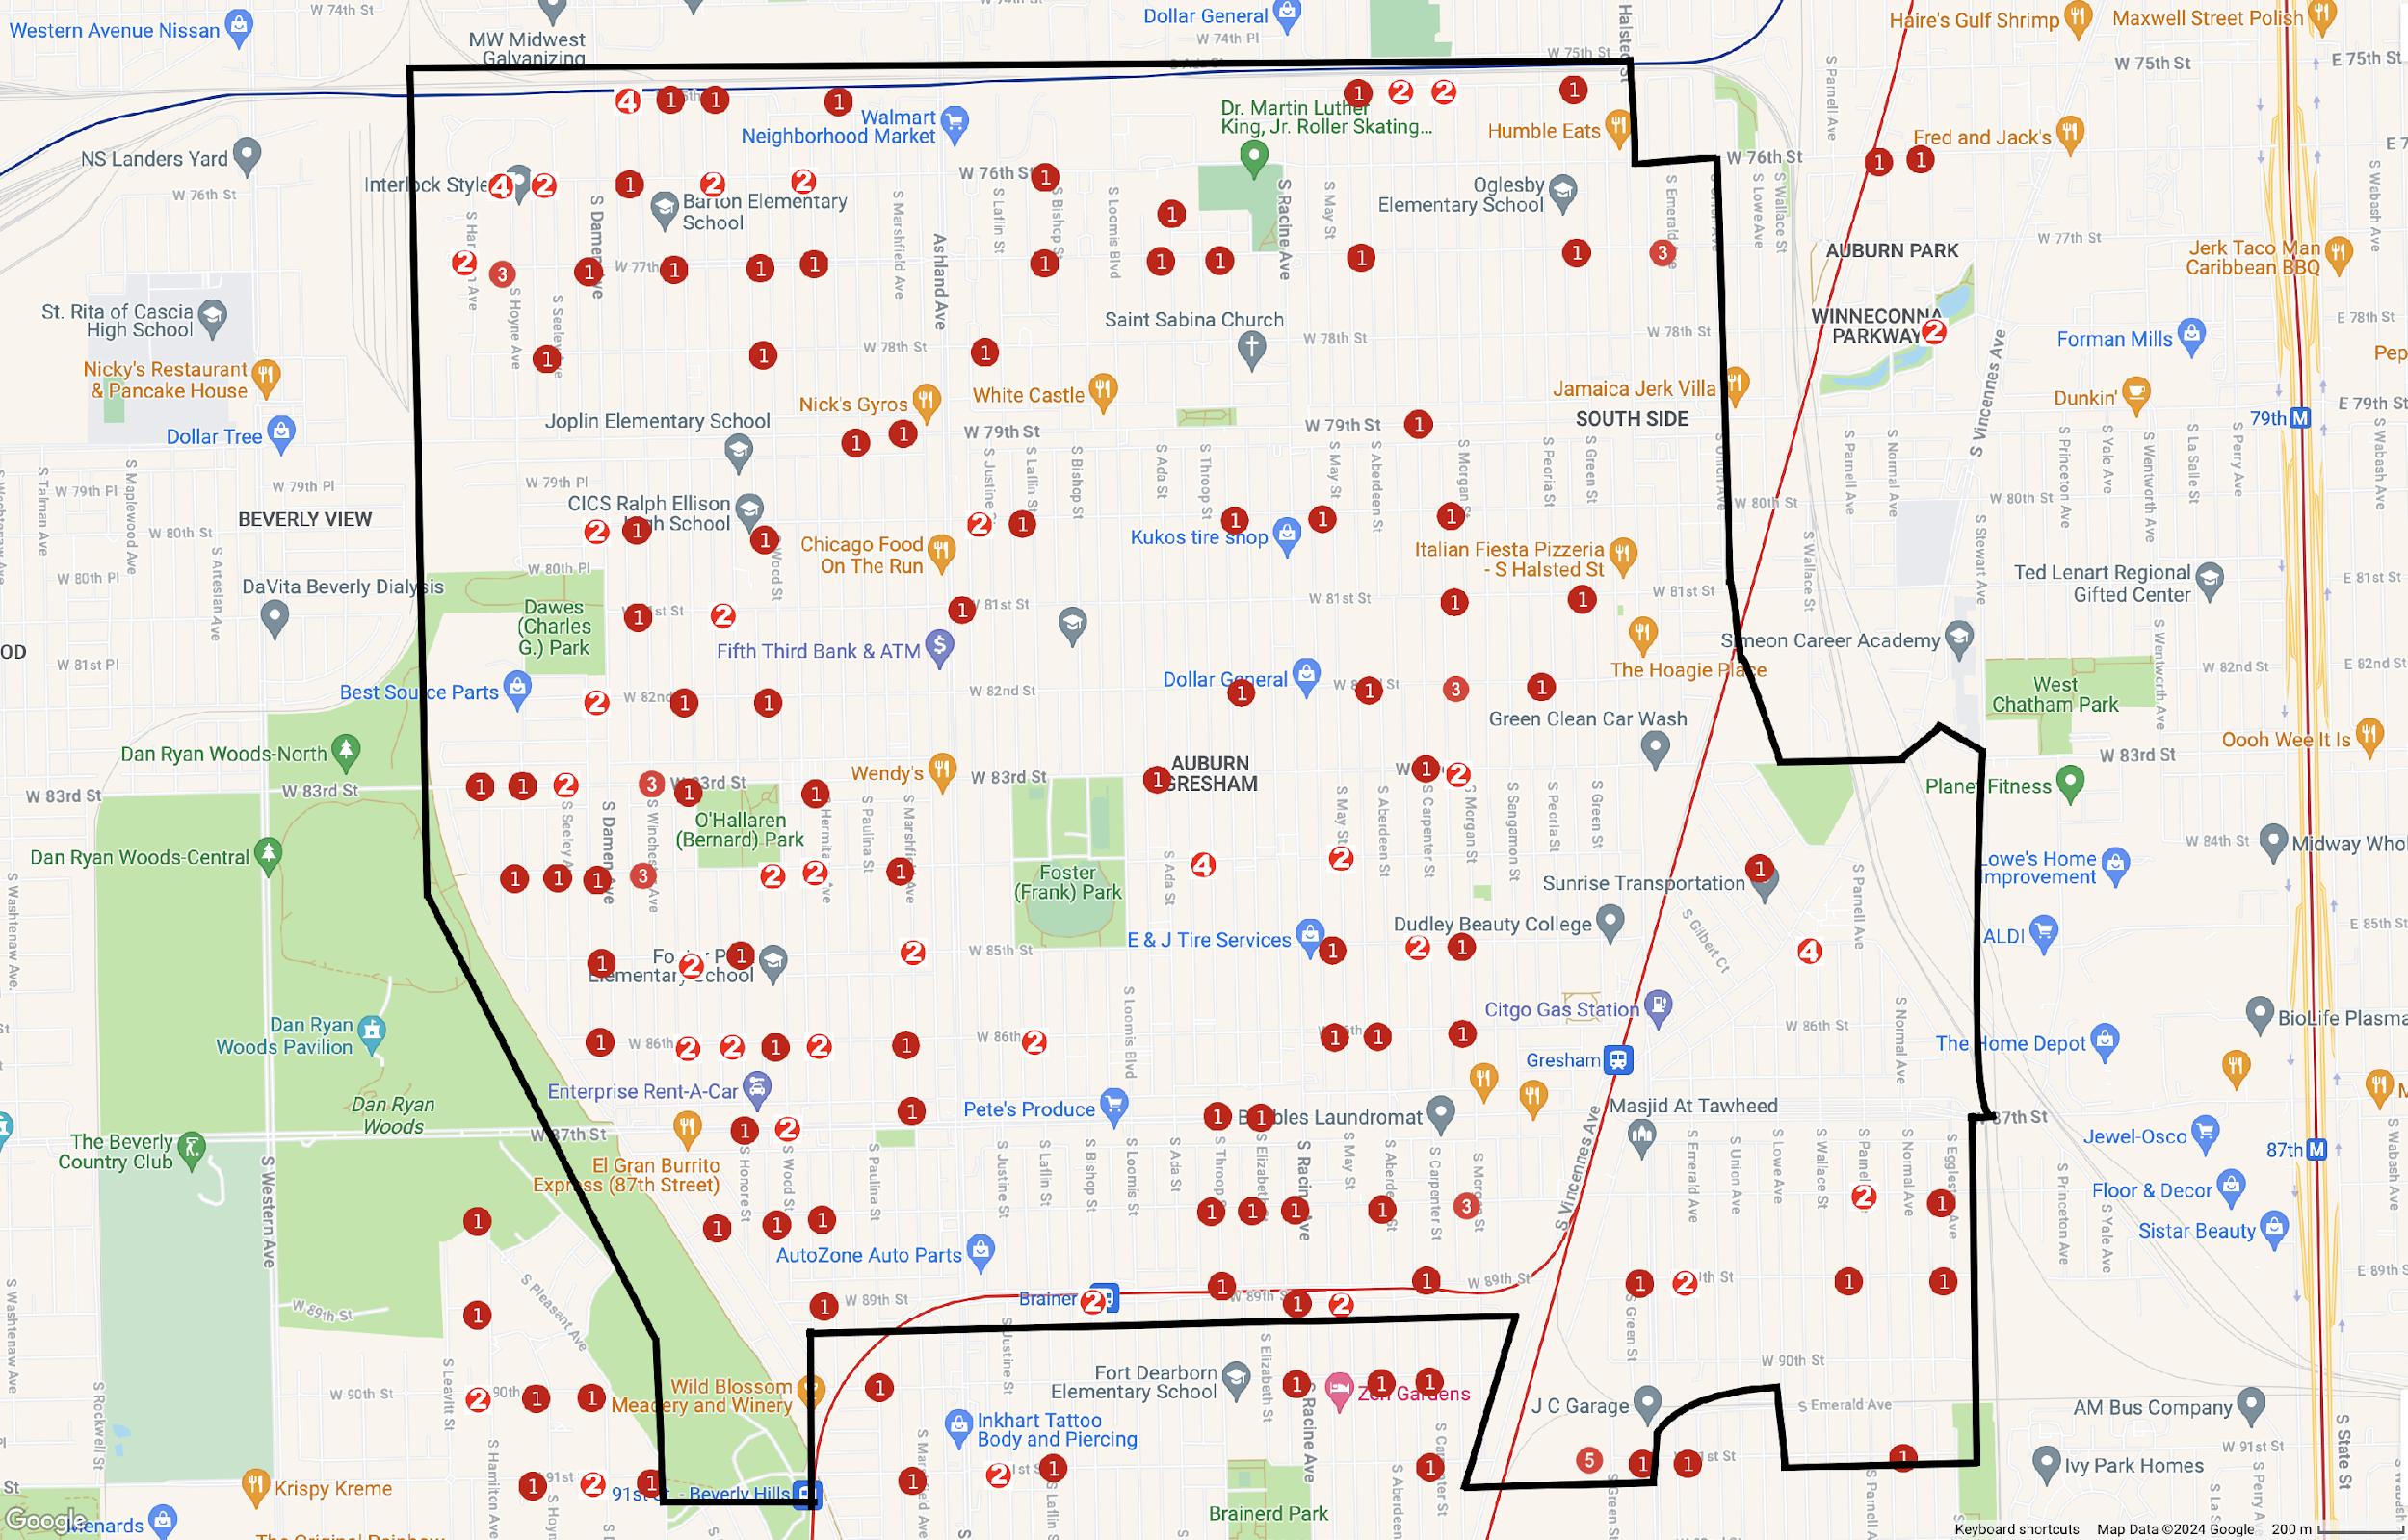
3: Auburn Gresham’s Community Lead Map (10, 14, 29, 33)
Methods
I created a framework of my statistical analysis for Auburn Gresham with the intention of duplicating and furthering my studies with Chicago’s 76 other neighborhoods. In figure 3, a screenshot of the user map may be seen as a whole with the search bar and “Key” minimized. Figure 4 shows a screenshot of the map that indicates categories users can toggle or select. These include individual streets and lead-level data tags, such as “Between 5-10 ppb”, “Between 10-15 ppb”, “Between 15.1-25 ppb”, and “≥25 ppb”.
My visual analysis incorporates data from the Chicago Water Department's Lead Safe Chicago website. The Chicago Water Department facilitates residential water and lab testing at the request of residents and publishes the data at the block level annually. I created a free-to-users map using AtList, a platform that enables users to plot individual data points using clusters, labels, and plots. I have enabled my AtList map through November 2025.
To create the map, I sorted and filtered water testing submissions from residents in Auburn Gresham prior to creating physical plots in order to group multiple points together. I chose to build an offline version of Google Maps into the background layer of my data set for users to potentially recognize significant locations. I used Environmental Justice Screening and Mapping Tool (EJ Screen), Chicago Metropolitan Agency for Planning (CMAP) and CDPH statistical and map data to build the basic community profile of Auburn Gresham, which was captured in a
published Community Health Assessment for a local health organization and in my graduate thesis. I took steps to delineate addresses and remove blank test intervals with Excel before entering individual addresses or groups of clusters, or multiple points. In R, I performed a basic statistical analysis, generating a list of common statistical variables.
The website’s url may be directly accessed at: https://my.atlist.com/map/f4f5b339-0c74-44038d42-b029cbfde357?share=true (33).
Results
I performed a classical statistical analysis in the statistics program R after cleaning, sorting, and grouping the lead service line address data in Excel. I summarized my statistics in Table 1. As shown in Table 1, my analysis revealed key statistics regarding lead concentrations in the sampled water. This data indicates variability in lead levels, with a standard deviation of 5.76 ppb in Gresham and 5.19 ppb in Chicago. However, while many samples are within reach of a relatively safe range of lead (i.e., 5.0 ppb), there are critical outliers that far exceed recommended limits (10). In addition, the mean lead level in Auburn Gresham is 9.74 ppb, nearly double the mean level of 4.97 ppb in the city of Chicago overall. The maximum lead level in Gresham is 45.00 ppb, the same as the maximum lead level in the city overall.
After summarizing the lead service line data for Auburn Gresham, I developed the free Community Lead Map Tool. The screen capture in Figures 5 and 6 show examples of how
residents may view a cluster of points along with available tags. For example, in Figure 5, 5 homes with lead in water service lines were at or above 5 ppb, with one home at 14 ppb and one home at 16 ppb, which is above the action level of 15 ppb. Figure 6 shows 2 homes that both exceed 15 ppb. One home is at 20 ppb and the other home is at 43 ppb, which is near the highest level recorded in Chicago of 45 ppb. The legend on each community map indicates service line categories, such as “Between 5-10 ppb” or “Violates EPA Lead-Water Action Level (15 ppb)”.
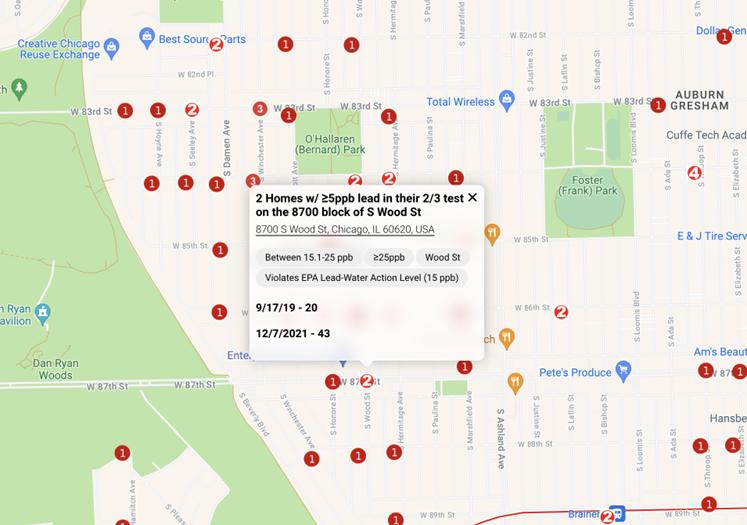
Figures 5 & 6: Auburn Gresham’s Community Lead Map, Example of Search Capabilities (10)
Figures 7 - 10 show additional Community Lead Map examples. I included screen captures of additional points of lead in water service lines in different parts of Gresham. Residents may view points based on their tags (i.e. Violates EPA Lead-Water Action Level (15 ppb)) or search for specific locations. These figures show a range of lead levels in water service lines in Auburn Gresham. For example, the lead levels in Figures 7 -10 are all above 5.0 ppb and several are abutting (e.g., 14 ppb) or above the action level of 15 ppb.
Table 1 Summary of Statistics for Auburn Gresham in Comparison to Chicago (10)
Discussion
Lead exposure is a multifaceted public health issue with significant consequences for individuals and communities. Understanding the inequities drawn from related inequalities related to exposure and sources of lead contamination are crucial for formulating effective interventions, such as policies, to mitigate this problem. Understanding community cultural norms, existing data collection methods, and pathways for support are each essential public health components for community improvement, not just intervention.
53.7% of households in Auburn Gresham are renting homes, which is shown to be attributed to disparities in housing quality (12). The presence of lead in drinking water is a significant public health issue, particularly in neighborhoods like Auburn Gresham, where historical and structural factors contribute to legacy lead issues. Federal lead disclosures exist to hold landlords accountable if they are aware of any lead on the property- however, lead testing is not a requirement (5). The mean lead level was calculated at approximately 9.73 parts per billion (ppb), while the maximum observed concentration reached 45 ppb, 3 times the action level for lead in water (15 ppb) (29). The mean concentration is concerning given that any detectable level of lead in water poses developmental risks over time, especially to children, which make up approximately ¼ of Auburn Gresham (7, 11, 30). Notably, 90% of the samples reached 15.4 ppb, underscoring the presence of lead contamination in many areas (10). The statistical findings highlight the variability in lead concentrations across the city of Chicago and the potential for exposure above safe levels, necessitating consistent monitoring. The expansion of more accessible testing results and intentional testing in high-risk communities in Chicago is a framework undertaken by this study’s map. By fostering awareness and providing access to leadrelated resources, this tool aims to address lead exposure by increasing risk communication and ultimately contributing to better public health outcomes for vulnerable populations.
Strengths and Limitations
One strength of this study is the development of a user-friendly mapping tool that allows locals members to access crucial community health data. However, a significant limitation is the lack of community engagement in the data collection process, as this study was primarily conducted as a one-person effort. I counted an average of 40 user interfaces with the tool using a hit counter. More community involvement could have enhanced the reach and effectiveness of the intervention. With a broader partner base and a longer time period for community health education and outreach, the Community Lead Map could provide valuable information and encourage residents to get their water tested and service lines replaced.
The framework established through this study not only highlights the importance of user-friendly maps, seen in Figures 5 - 10, for public awareness but also serves as an opportunity for future development of additional maps that will extend monitoring efforts across all 77 Chicago communities. This proactive approach will facilitate community engagement, empowering residents to actively participate in safeguarding their health and advocating for safer drinking water.
An opportunity to foster such intervention in Gresham is its home for 92.5% commuters, with easy access to the soon-to-be-expanded commuter rail, train, and bus services. According to the
Chicago Transit Authority, the neighborhood’s primary CTA bus, #79, once had the highest daily ridership levels in the city, ranking third highest in 2024 (21-25). The community's population exhibits similarities in income instability, race, and language spoken, highlighting an opportunity for inclusivity in intervention efforts (7, 22). These disparities accentuate the unique challenges the community faces and emphasize the need for tailored interventions and support. There are 22 public schools in Auburn Gresham, serving children of various age groups, as well as a public library (26, 27). Despite being an integral part of the city of Chicago, Auburn Gresham exhibits marked disparities in demographics, socio-economic factors, and educational attainment compared to the broader Chicago population. Increasing resources to capture intellectual benchmarks could significantly impact both the local community and the city, especially given Gresham’s struggling schools.
Conclusion
This study underscores the critical need to address lead exposure in Auburn Gresham, a historically significant community facing ongoing public health challenges. The user-friendly online map developed through this research serves as an essential tool for empowering residents with knowledge about lead levels in their drinking water. By integrating data from the Chicago Department of Public Health and resident-submitted lab results, the map not only illuminates the extent of lead contamination but also provides a framework for broader statistical analysis across all Chicago communities.
The statistical analysis revealed lead levels, with a mean concentration of 9.74 parts per billion (ppb) and maximum levels reaching up to 45 ppb (10, 14, 33). These findings highlight the variability in exposure and the urgent need for more rigorous testing and monitoring in neighborhoods historically affected by lead contamination. Although the mean level falls below the EPA action level of 15 ppb, the presence of any detectable lead is abnormal and poses significant health risks, particularly for vulnerable populations like children (15, 28, 33).
The findings advocate for the expansion of more stringent lead laws and intentional testing efforts in high-risk areas, reinforcing the importance of public health policies aimed at reducing lead exposure. Additionally, this study emphasizes the potential for future map development, which will facilitate community engagement and promote informed decision-making among residents.
As the community grapples with the legacies of historical injustices, proactive measures to increase awareness and resources for lead testing and intervention are key. By highlighting the prevalent issue of lead exposure and providing accessible tools for monitoring, this initiative aims to foster a healthier environment for all residents of Auburn Gresham, ultimately contributing to improved public health outcomes.