1 minute read
FREQUENCY RESPONSE SYMMETRY


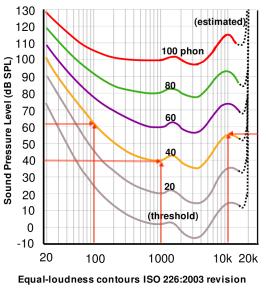
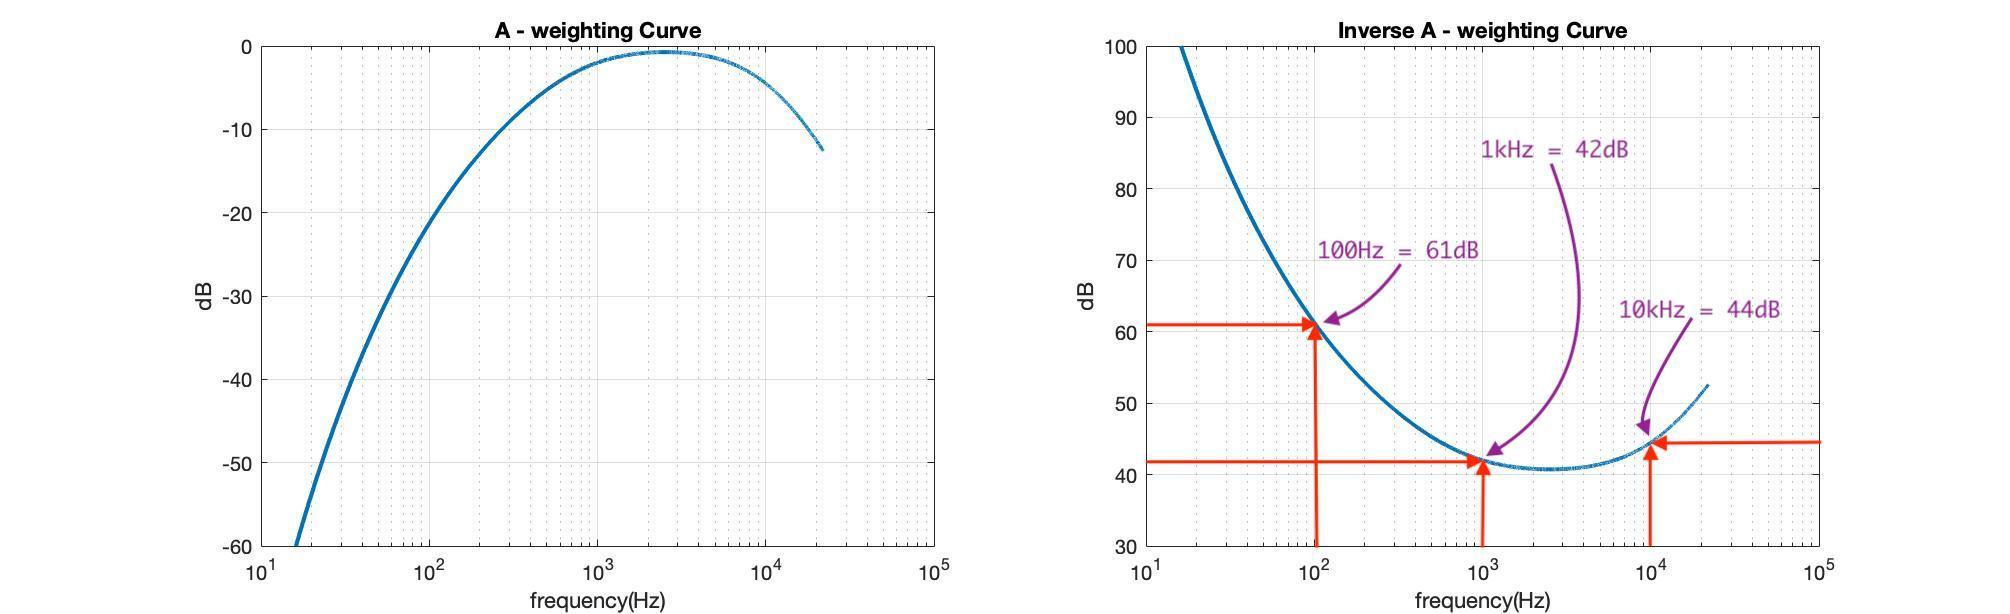
Figure 9. Inverse A-weighting curve approximating a 40 phon equal loudness contour (left), equal loudness contours ISO 226:2003 revision (right)
Advertisement
In [fig. 9] ISO standard equal loudness contours [7] are compared with an approximation of the 40 phon equal loudness contour generated via an inverted A-weighting formula [fig. 7]. Again the gain is compared for frequencies 100Hz, 1kHz and 10kHz. In this case, although the values are a close approximation they are not exact due to the peaks in the original 40 phon equal loudness contour between 1kHz - 2kHz and 8kHz - 11kHz, these peaks represent frequency bands where humans require slightly boosted gain to hear them as “equal”. Note that our approximation (left) instead considers the more extreme highs and lows of the frequency spectrum.
A-WEIGHTING CURVE PLOTS


