6 minute read
4.4.3 Beer Processing


4.4.3 Beer Processing
Market potential at a glance In 2019, it is estimated that 1.52 PJ of thermal energy was consumed during beer production, with all of this energy used for process heat <150°C o This process heat for <150 °C contributed 78.5 kilotonnes of CO2,eq per annum o Fossil fuel energy costs for this process heat is estimated to be $16.7 million per annum Based on a logistic model, by 2035: o Under the BaU scenario, the emission reduction would be 6.3 kilotonnes CO2,eq per annum relative to the 2019 levels; o Under the ACL scenario, the emission reduction would be 32.2 kilotonnes CO2,eq per annum relative to the BaU scenario; o Under the ACL scenario, fossil fuel energy costs will be reduced by $7 million per annum relative to the BaU scenario o To achieve the 50% emissions target by 2035, the uptake rate of renewable technologies needs to be increased by a factor of 3.3 compared to the BAU scenario.
The annual industry revenue is approximately 4.3 billion AUD, and it is projected to have an annual growth of 4.2% from 2021 to 2026 [242]. In Australia, the total beer production in 2017-18 was 1342 million litres [243]. Over the last five years, the overall beer consumption has decreased by 0.7% [244] and it is forecasted to have a drop of 0.4% over four years due to the rising health awareness and higher taxes [245]. On the contrary, the craft beer consumption was anticipated to grow. In this study, it is assumed that the beer manufacturing in Australia will have a contraction rate of 0.1% per year.
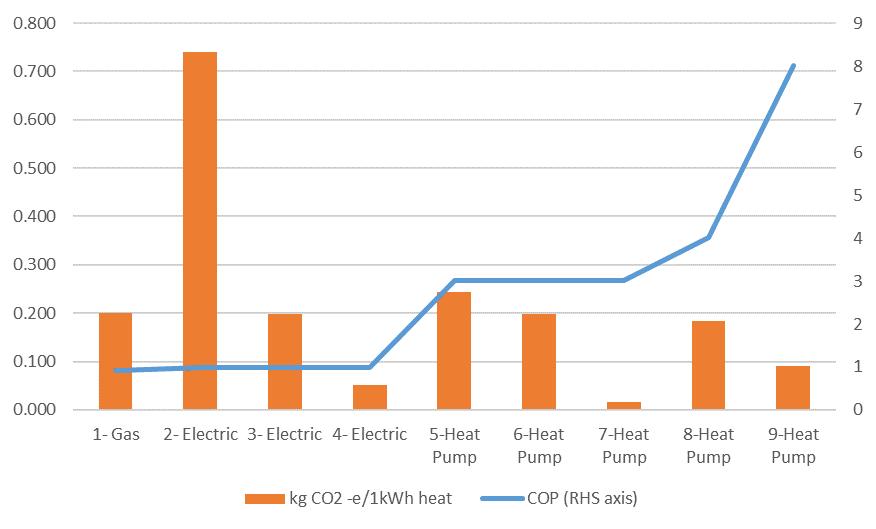
Low pressure steam is the main source of heat in the beer processing. Steam at temperatures of 130160 °C is generated in NG boilers and distributed to various processes where heat is required: gain mashing and lautering (45-75 °C), hop/wort boiling in the kettles (95-100 °C), whirlpool tank (4080 °C), packaging and pasteurization (60-70 °C) and cleaning in place (70-90 °C). A considerable amount of energy results from the steam reticulation system. The production requires 83-144 MJ of energy per hectolitre of beer for breweries whose annual production volume is 10,000-1,000,000 hectolitres. It is estimated that the energy consumption for beer production in 2017-18 is 1.11-1.93 PJ (approximately 1.52 PJ on average). The energy/temperature required in the processes is presented in Figure 27.
4.4.3.1 Beer Processing Technology Options Breweries are very conscious of incorporating renewable energy or energy saving technologies into the brewing process. Victoria Bitter beer is now manufactured using 100% solar PV electricity in 2020, under Asahi Beverages’ sustainability program which aims to power the entire beverages by 100% renewable electricity by 2025 [246]. At Coopers Brewery in Adelaide, a 4.4 MW natural gas-powered co-generation plant supplies 50,000 tonnes of steam per year and the hot water produced is used to kiln the malt, reducing gas usage by up to 40% [247]. Lion has a target to reduce carbon emissions by 30% by 2026 from 2015-year level [247]. Solar PV was also installed in many craft breweries, e.g. the Grove Distillery, Young Henry’s, Helios Brewing (also installed evacuated tube solar thermal system) and Grand Ridge Brewery [248].
Technology solution issues are very similar to options discussed for the previous sectors and are listed in Table 31. In the beer industry, the opportunity favours HP technology. Due to maximum temperatures required being lower, around 160 °C with processes operating at lower temperature, and only chilling required, combined heating and cooling HP is an attractive option. However, this will depend on the matching of load requirements which could be overcome with thermal storage. Alternative options using MVR or solar thermal could also be used if load mismatching exists.
Production of biogas from biomass waste is worthy of investigation if excess heat is needed, however consideration should be given to biomethane gas grid injection should be considered. Similar to microwave technology used in dairy processes, experimental MW assisted configurations are possible but currently no commercially available microwave system exists.
Table 31: Technology options with the potential to electrify/decarbonate beer production.
Processes require heat Hop boiling in kettle CIP and other heating demand Pasteurization and packaging Mashing
Heat demand Steam at 100 °C, 39.1-67.8 MJ/hL Water at 7090 °C, 16.628.8 MJ/hL
Water at 6070 °C, 22.4-38.9 MJ/hL Water at 45-75°C, 4.9-8.5 MJ/hL
Option 1 Produce biogas using wastewater on site + biogas boiler Option 2 Maximize waste heat recovery preheat water and reduce the heat loss from steam reticulation system
Option 3 Option 4 Option 5
Biomass boiler EB/HP/MVR + renewable grid electricity (via PPA’s) Solar PV + EB/HP/MVR storage (thermal or battery)
Option 6
Solar thermal
Option 7 Example optimal option
Solar thermal + thermal energy storage Biogas generation on site from wastewater + biogas boiler, reduce heat loss, recover waste heat to preheat water, PV + HP + storage to meet the rest of demand
4.4.3.2 Beer Processing Market Uptake According to the Market Status report, more than 90% of Australian beer is manufactured by major commercial breweries, and many of them already have ambitious renewable/sustainable target as aforementioned in the last section. To reduce the operating cost and increase business competitiveness, the craft breweries is following major breweries’ step and has started adopting the renewable technologies, especially solar PV and solar thermal. Considering the market status, the initial/current adoption level in logistic growth function is assumed to be 20% in both BAU and ACL scenarios, with all non-renewable energy supplied by natural gas. It is anticipated that 50% of breweries will achieve 50% of GHG emission reduction by 2035 in BaU scenario and it is feasible if those breweries accomplish their targets. In ACL scenario, it is assumed that the beer sector will achieve 50% GHG emission reduction by 2035. Applying iteration procedure, the growth factor in logistic growth function is determined to be 0.075 and 0.14, respectively. The corresponding projected technology market penetration and trajectory GHG emission reduction in the next 15 years under BaU and ACL scenario are presented in Figure 84 and Figure 85, respectively. The results show that with the current assumptions, in 2019 the total emissions in the beer processing sector due to process heat is approxiatmely 78.5 kilotonnes CO2eq per year. Under the BaU scenario, by 2035 the emissions will reduce by 6.3 kilotonnes CO2eq per year relative to 2019 levels, while under the accelerated scenario
the corresponding reduction will be 38.5 kilotonnes CO2eq per year. To achieve a 50% emission reduction by 2035, the rate of renewable energy uptake needs to be accelerated from the current ≈1.1% per year to ≈3.6% per year on average within the next 5 years. Figure 86 shows the net change in annual fossil fuel energy consumption for the beer processing sector relative to 2019 levels. The results show that by 2035, under the business as usual scenario, a modest reduction of 1.34 million AUD per year is expected. However, importantly, the modelling also shows that the trend in annual energy costs is expected to rise post 2035 under the BaU scenario. By contrast, under the accelerated scenario, by 2035 a net annual savings in energy costs of 8.2 million AUD is expected, with this cost expected to continue to reduce post 2035.
Figure 84: The overall new technology market penetration in beer production under BAU and ACL scenarios.