11 minute read
4 Wastewater treatment plant case studies

WWTPs are designed to treat wastewater, one of the UOW streams, with treated effluent released back to the environment according to required environmental standards. Sludge collected from the WWTP process can be further treated through AD to capture biomethane for energy generation. AD at WWTPs can be modified to accept other organic feedstock, such as FO, FOG, and other organic trade wastes. WWTPs are typically built with capacity to accommodate population growth. This project considers three potential WWTPs, out of Sydney Water’s 14 existing WWTPs, suitable to accept external UOW feedstocks for co-digestion.
The three case study sites are selected based on Sydney Water’s priorities which they developed based on the digester sludge volatile solids loading rate capacity, latent loading capacity (considered in conjunction with catchment growth projections), and substrate dose rates. In addition, site assessments such as digester stability and capability of existing ancillary systems (heating, mixing, sludge pumping, solids handling and biogas management systems) informed the selection of the WWTP case study sites
Advertisement
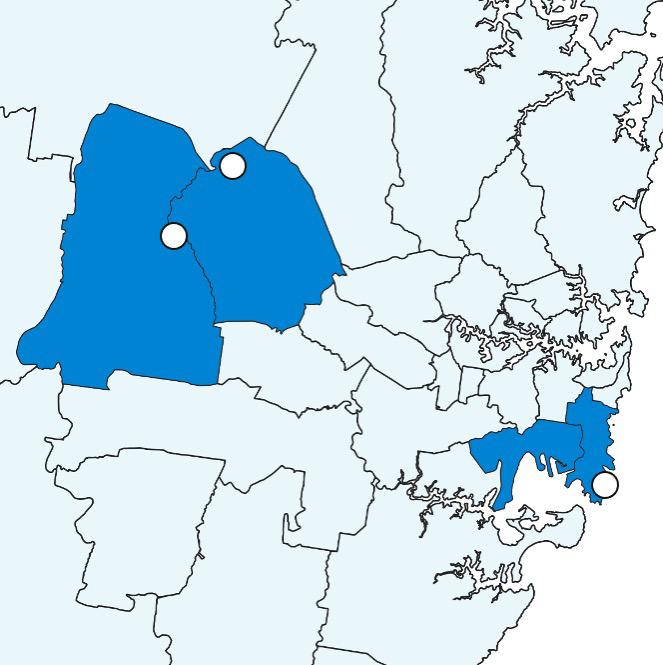
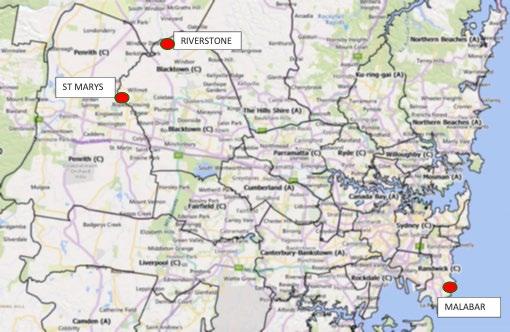
The three WWTPs used for the case study analysis are Malabar, St Mary’s and Riverstone (Figure 6), which service Bayside, Randwick, Blacktown and Penrith LGAs. Table 2 below provides summary information including digestor capacities and planned timelines.
• Three 10,000 m3 ADs and one 4,500 m3 AD (2 primary, 1 secondary, 1 tertiary)
• Capacity to take 125 kL/day FO (up to 12 trucks)
• Available for co-digestion: mid 2023
• Four 2,700 m3 AD (3 primary, 1 secondary), one thermal hydrolysis (CAMBI) – 45 t DS/day at peak load


• Capacity to accept 75 kL/day FO (up to 7 trucks)
• Conversion from aerobic to anaerobic mid 2023
• Two 1,380 m3 ADs and three 6,000 m3 ADs (3 primary, 2 secondary)
• Capacity to accept 140 kL/day FO (up to 10 trucks)
• Commissioned by mid 2024
5 Urban organic waste in the case study LGAs
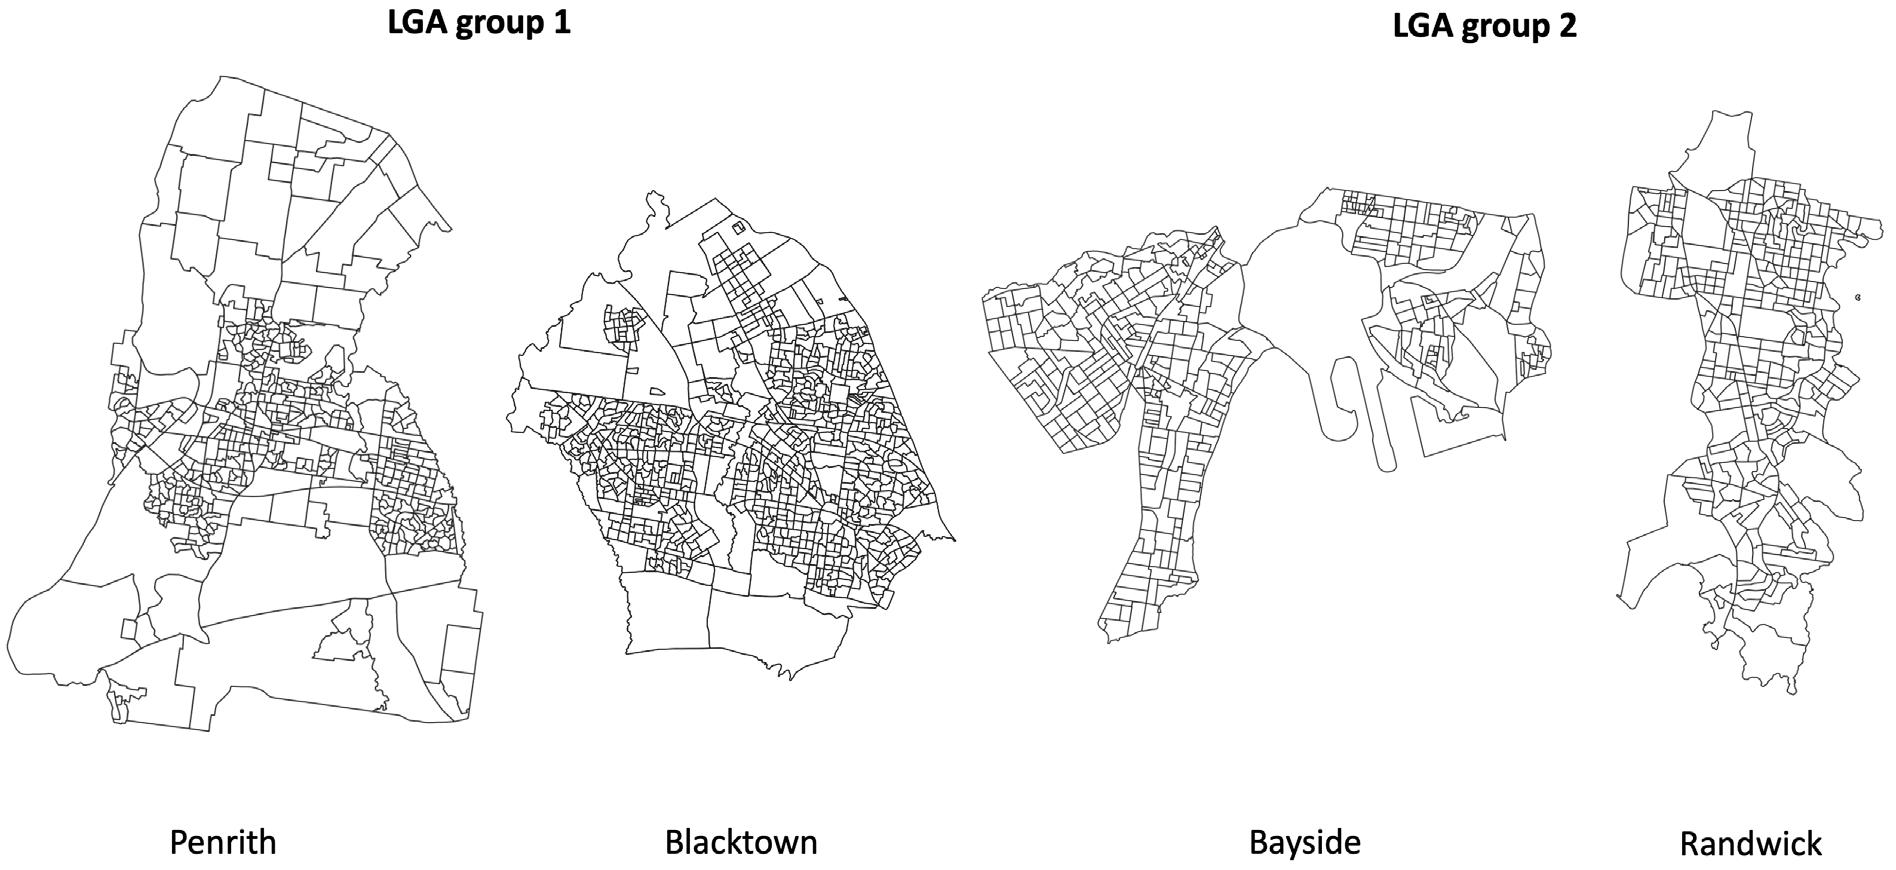
This section summarises the baseline results for the UOW for LGA Group 1 (Penrith and Blacktown) adjacent to St Mary’s and Riverstone WWTPs, and LGA Group 2 (Randwick and Bayside) adjacent to Malabar WWTP
5.1 LGAs’ background
Almost a million people, 18% of the Greater Sydney population, live in the four LGAs considered in this study. In LGA Group 1 – (western LGAs), the population mostly live in single unit dwellings (SUDs) or houses. Conversely, in the eastern LGAs (Randwick and Bayside) the majority of the population live in multi-unit dwellings (MUDs) such as apartment blocks. This is also reflected in the population density, which is significantly higher in the eastern LGAs, although in all four LGAs the population density is higher than Greater Sydney’s average (425 people/km2). Demographics, businesses, organic streams and renewable energy generation in Blacktown, Penrith, Randwick and Bayside are summarised in Table 3 As noted in Appendix Table 7, the UOW statistics are based on estimates drawn from multiple disparate data sources.
Waste audits performed across the Greater Sydney region and NSW observe a variation in the generation of FO and GO based on the dwelling type. Therefore, distribution of dwelling types is an important factor to take into account when considering the economics of separate collection of either FO or GO as opposed to a combined FOGO collection (Rawtec, 2020) and are considered in this study.
About 3% of the Australian businesses (32,156) are within these four councils, with Blacktown generating 3.5% of Gross State Product (GSP). Across all four councils (Figure 7), about 20% are Construction businesses 4 (as per ANZSIC codes grouping itemised in Appendix Table 8), followed by Professional, Scientific and Technological Services groupings. While Randwick has a significant number of businesses in the Health Care and Social Assistance group, in the other LGAs Transport, post and warehousing is one of the main groups. The Accommodation and Food Service group, anticipated to generate large amounts of FO, is also one of the main groups in LGA Group 2 (Randwick and Bayside LGAs).
More than 95% of the businesses are small, employing 1-19 people, with only 31 businesses across all four LGAs employing more than 200 people. Business types and size could provide an insight into the likely type of organic waste that can be anticipated to be generated and in what quantities. Their size and distribution could potentially impact consideration of the most efficient collection methods of the organics’ streams. Therefore, this study aims to develop FO and GO generation factors depending on the business types and size.
4 A large proportion of these are likely sole trade businesses considering that more than 95% of the businesses in the study areas are small employing 1-19 people.
Table 3 : Overview of the Council’s demographics, business activity, organic waste streams and energy potentials.


Across the four councils, an estimated 68 kt/y of FO was generated in the residential sector in 2020/21, and 40 kt/y of FO in the non-residential sector, a total of 108 kt/y. In addition, it was estimated that 77 kt/y of GO was generated in the residential and 32 kt/y in the non-residential sector, a total of 109 kt/y (e.g., a similar quantum to FO). WWTPs are already processing 58 GL/y of sewage from the four LGAs, of which the majority, approximately 79%, is from the residential sector. An estimated 8 GL/y of trade waste was produced in 2020/21 in the combined study area and 3.2 ML/y of FOG.
Generation of biomethane via AD from the organic waste streams could potentially add to the existing renewable energy already generated from the four LGAs. Almost 19 MW of solar panels have been installed in the LGAs, producing roughly 27,740 MWh energy per year. Current installed renewable energy generation from biomass in the LGAs is almost 8 MW, mostly from the existing AD systems operating within the WWTPs. Capturing energy from the other organic streams, such as FO and FOG, could add to the renewable energy generated in the area.
5.2 Urban organic waste generated in 2020/21
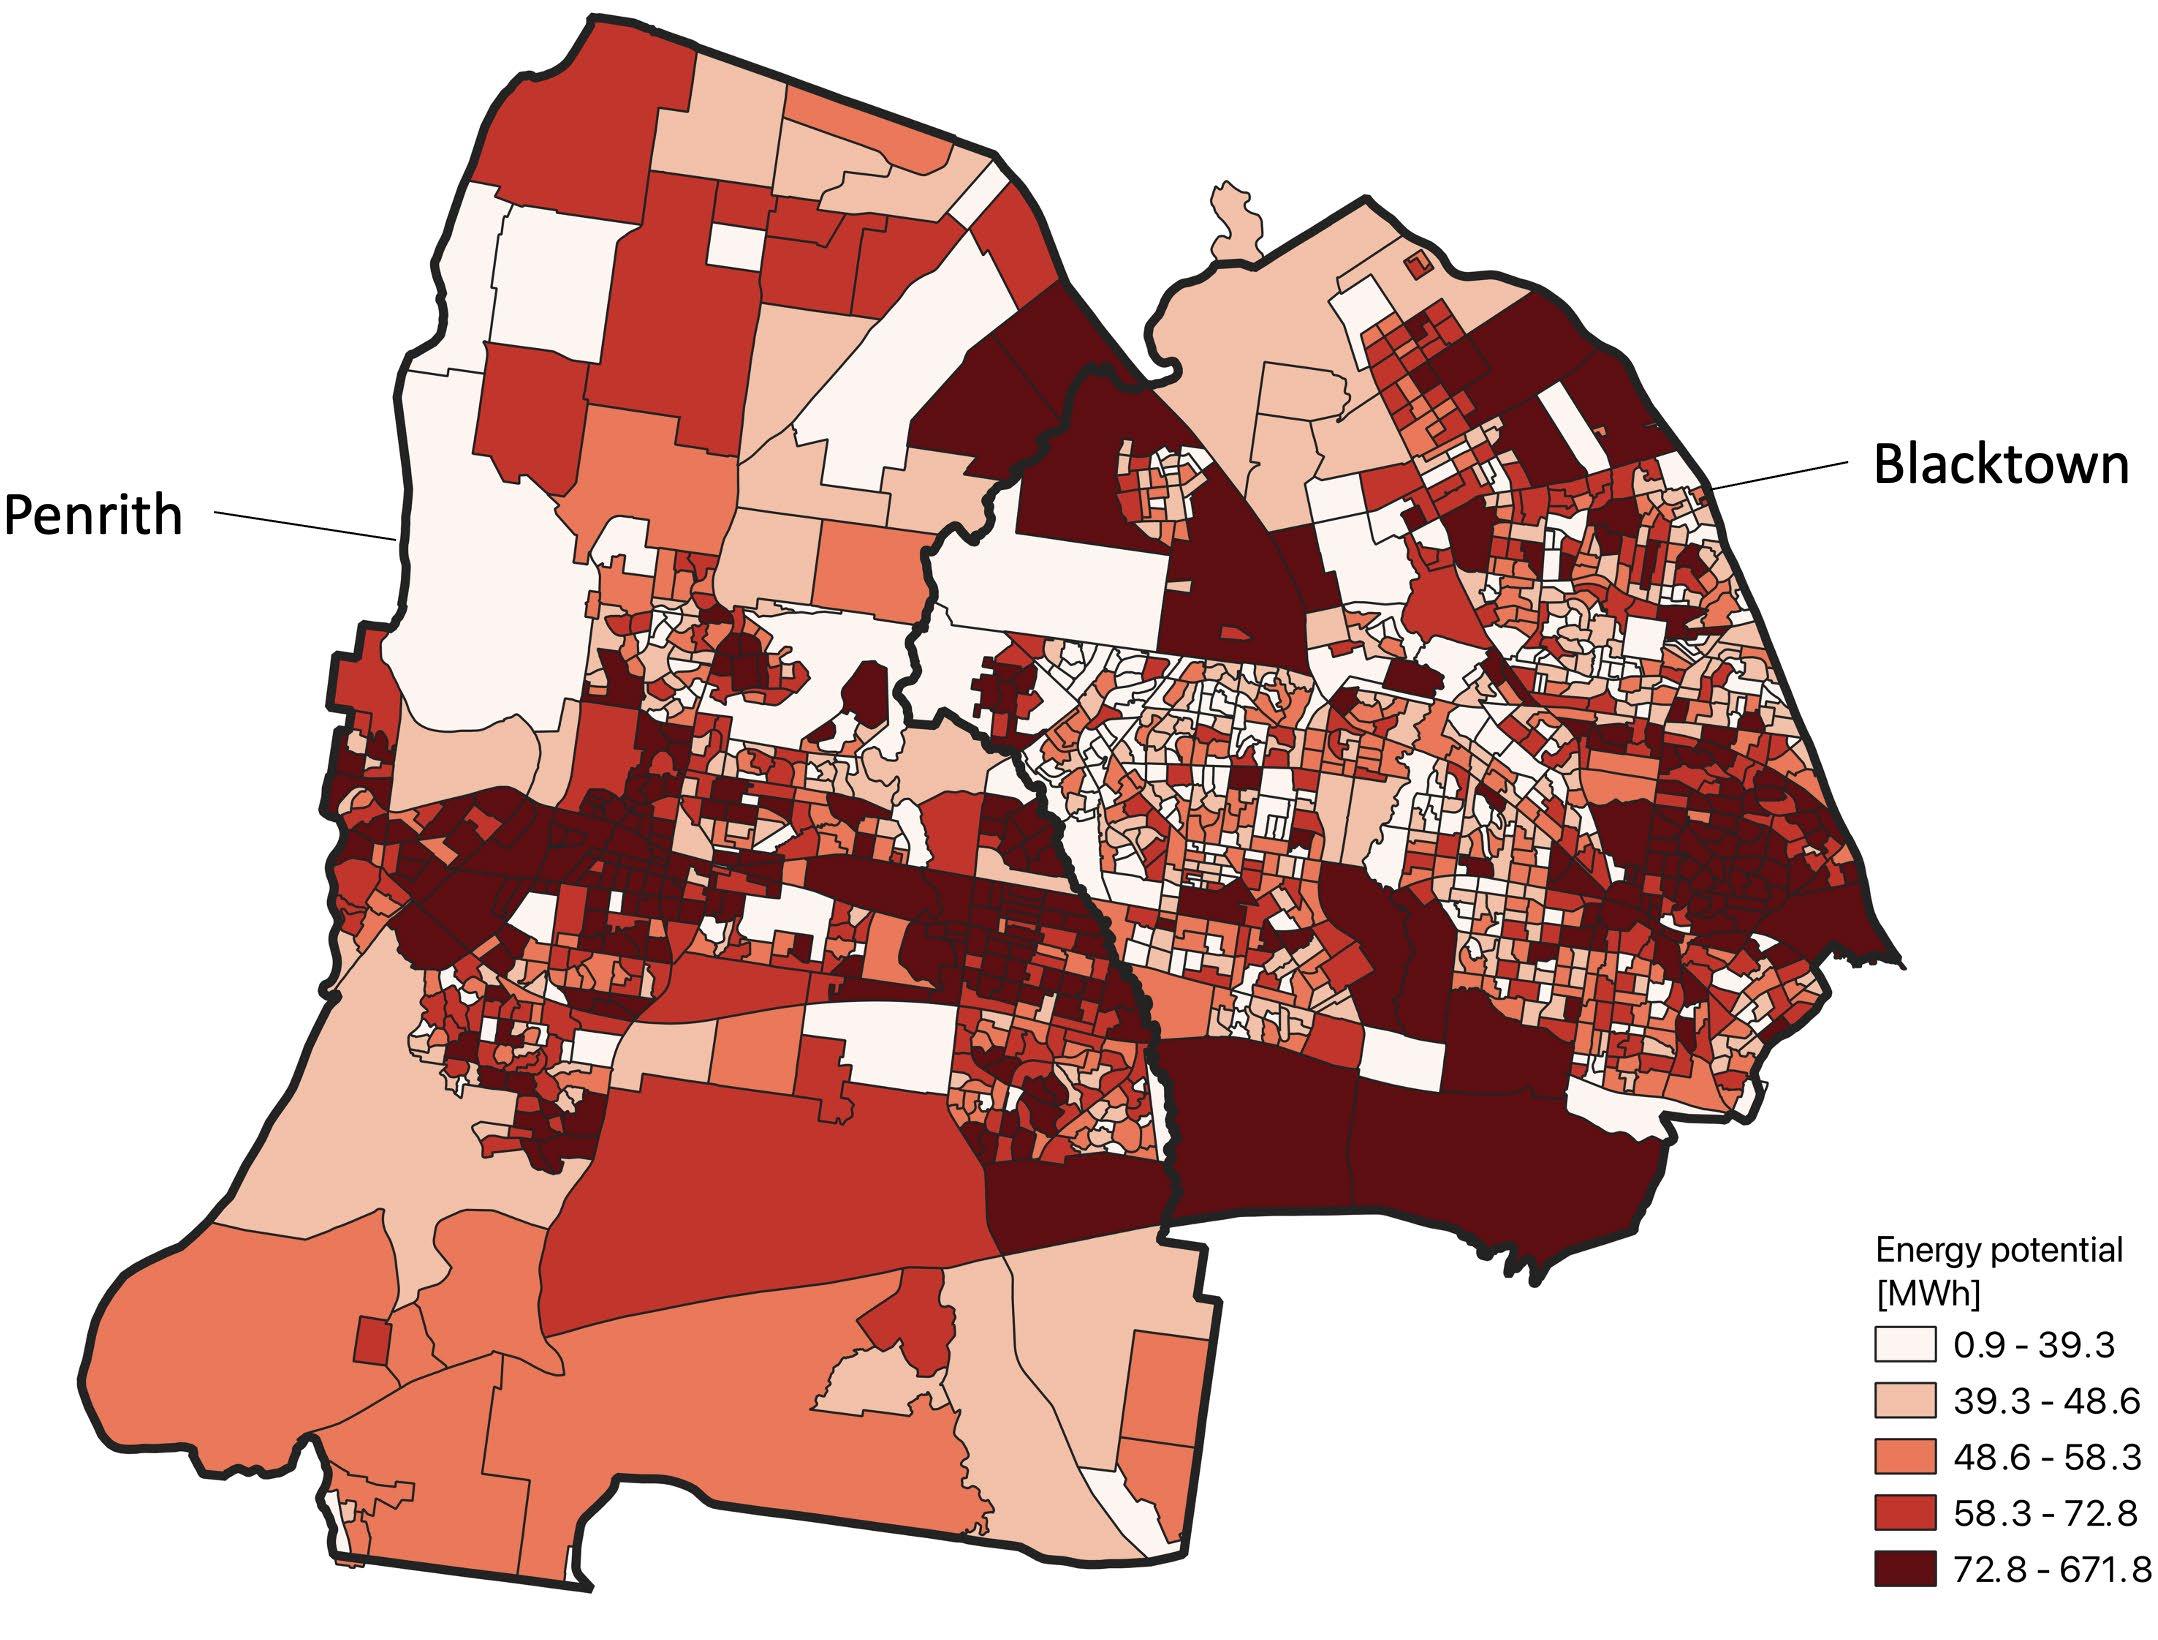
This section aims to quantify and geospatially map the estimated UOW streams generated across Blacktown, Penrith, Randwick and Bayside councils. In Figure 8 the total estimated FO and GO in t/y arising from the residential and non-residential sectors are plotted. Some of the FO and GO were source separated and recycled (44% in the residential sector), however the majority of organics were disposed of in residual waste bins which go to landfill. While some of these organics were captured at AWTs, around 30% were still disposed to landfill.
As it can be seen from Figure 8, LGA Group 1 (Penrith and Blacktown), where people mostly live in SUDs (Table 3), as opposed to the LGA Group 2 (Bayside and Randwick), where people mostly live in MUDs (Table 3), generated significantly higher quantities of GO On the other hand, Blacktown and Bayside generated more FO in total compared to Penrith and Randwick. Penrith and Randwick offer a separate FO collection via FOGO. Randwick introduced the FOGO collection in March 2021 for both SUDs and MUDs, although it had trialled separate FO collection in apartments since 2013. Penrith introduced FOGO weekly collection in SUDs in 2009 and switched the general waste collection in SUDs from weekly to fortnightly. In Penrith MUDs, there is no organics collection available and general waste bins are collected twice per week. The combined FO and GO generation per household is however the largest in Randwick and this is due to the large generation of GO (Table 10). It should be noted however that services offered across the four LGAs are different and have been changing over the recent years all impacting the collected organics and distribution across the bins. In addition, home composting is not included in the estimated generation. Table 10 lists generation per household for the LGAs and streams collected.
When comparing the non-residential sector, although Bayside and Penrith have a comparable number of businesses and employees (Table 3), Bayside produced significantly larger quantities of both non-residential FO and GO. However, the largest non-residential FO and GO appear to arise from Blacktown, which also has the largest number of businesses and employees (Table 3) and is currently the largest council by population in NSW. Randwick has the smallest number of businesses and employees of the four study LGAs and consequently produces significantly smaller number of FO and GO.


Sewage generated in both residential and non-residential sectors is already treated by Sydney Water WWTPs and is either used or will be (as Sydney Water is adding ADs in their treatment processes) to generate bioenergy. In addition to Malabar WWTP, there are additional 6 WWTPs already generating energy from biogas. Additional 4 WWPT, including St Mary’s and Riverstone, are being upgraded to include AD for energy generation at Sydney Water WWTPs. Within the case study LGAs, sewage predominantly arises from the residential sector (Figure 11) Figure 12 shows geospatially mapped sewage distribution for the residential and non-residential sectors for 2020/21

Residential sewage


Non-residential sewage

In the non-residential sector, in addition to sewage, trade waste is also collected through WWTPs, as well as FOG through licensed collectors. In Figure 11, the quantities of sewage are compared to trade waste and FOG. Although quantities of FOG are relatively small, the energy potential of the AD system can increase significantly when FOG is co-digested with sewage.


Trade waste includes a broad range of commercial and industrial wastewaters produced at industrial or commercial premises that require different treatment equipment. Permits need to be issued for the trade waste to be discharged to the sewerage system and most of the waste needs some form of pre-treatment. Due to their variability in nature and therefore complexity, trade waste was only estimated in quantity and geospatially mapped (Figure 13) but was not considered for estimation of the bioenergy potential (Chapter 6). FOG is a type of trade waste collected via grease traps. This type of waste predominantly occurs in retail food businesses and if discharged directly to the sewer can cause blockages. Therefore, grease traps are required for such food related business and are emptied and collected by licensed Wastesafe transporters in Sydney, registered with Sydney Water (Sydney Water, 2022c), before further treatment for bioenergy and disposal via subsoil injection. FOG is geospatially mapped in Figure 13 for the study area. Its energy potential is estimated in Chapter 6.
The graphs and geospatial mapping in this section identify the importance of observing contextual differences between LGAs in terms of the quantum and types of different UOW streams being generated and their potential for collection and treatment.


5.2.1 Pet waste
Pet waste is predominantly disposed to landfill in residual waste and is not considered in the UOW bioenergy potential calculations (Chapter 6). However, for illustrative purposes estimates are included here to show how unassuming waste streams can potentially represent surprisingly large volumes of waste. Approximately 4.8 million dogs and 3.9 million cats live in Australia and more than 60% of Australians own at least one pet (Hannink, 2020). Although an average dog produces only 340g of faeces per day (DoodyCalls, 2022), due to a large number of dogs such organics represent significant quantities. Similarly, although much smaller, is the impact of cat faeces – an average cat produces 50g of faeces per day (Michael, 2022). For the case study LGAs, it is estimated that pet waste could represent 20,466 t/y, which could be as much as one tenth of total waste currently disposed to landfill (e.g., residual waste from AWTs - 150,237 t/y) (Figure 14).
Almost 270,000 pets (cats and dogs) are estimated to live in the four-case study LGAs based on the average pet ownership in Australia. It is estimated that they produce 20,466 t/y of pet waste with the majority disposed to landfill through kerbside residual bin or the four-council park and street bins Some of the pet waste is potentially also naturally composted in the parks or within homes.
5.3 Estimating and understanding non-residential UOW using BinTrim data
While residential FO and GO is captured in NSW through LGAs reporting to the NSW EPA, there is very little publicly available data on non-residential FO and GO. This study explores potential pathways to estimate the quantities and geospatial distribution of FO and GO arising from the non-residential sector due to this major gap in the accessible data
Initially the study aimed to identify the quantities generated by business type categorised by ANZSIC codes (Appendix Table 8). While this captures variation in organic waste generation by business type, there is also a variation within each business type depending on other factors such as the business size. Aiming to capture that variability as well, the businesses were further analysed by the number of employees Factors for FO and GO generation based on the business type (ANZSIC code) and business size (e.g., employing 1-19, 20-199, 200+) are developed using two approaches described in more detail in Appendix Section A.4.7
In the first approach, data from ABS Waste Accounts (based on Australia wide waste data) was used to derive the factors However, the business type grouping in the ABS Waste Accounts is limited to only a few ANZSIC groups. In the second approach, BinTrim data (NSW based), including complete ANZSIC group set, was used to derive the factors. The limitation of a BinTrim data set is that it is based only on the businesses that have participated in the BinTrim program.
The two approaches provide very different estimates (Figure 15). Using ABS factors, 36 kt/y of FO is estimated across the four LGAs. Using the BinTrim factors, 80 kt/y of FO is estimated. In the National Waste Report, it is reported that 1.32 Mt/y of FO was generated across the whole Australian C&I sector in 2018/19 (Pickin, et al.,
2020). Considering 3% of Australian businesses are located in the study LGAs, it could be estimated that 40 kt/y FO arises from these four LGAs This is comparable to the estimated FO using ABS factors (36 kt/y).
There is no such estimate for GO, which also differs between the two approaches (Figure 15). Considering that BinTrim data is generally visually estimated based on volume this could result in potentially high levels of uncertainty in the data. In addition, the BinTrim program aims to address the recycling issues for businesses that mostly focus on FO and not GO, which could lead to a disproportionate representation of businesses addressing FO issues as opposed to GO in the dataset. Therefore, GO data is mostly collected as a stream present in addition to FO.
To establish what is the cause for the differences between the two approaches (ABS and BinTrim), the estimated FO is further analysed for the ANZSIC code groupings that are in common (Appendix Table 8). In Figure 16, estimated FO values for the six common ANZSIC code groups show that in some categories the quantities estimated with the ABS method are higher than quantities estimated with the BinTrim method, but for others it is the opposite. However, in most cases, except for the Public administration and safety grouping, the proportional distribution between LGAs within each of the groupings is consistent regardless of the method used As the BinTrim method includes all ANZSIC groups, FO arising from these sectors is analysed further.
Figure graphs indicate that even though some of
ANZSIC groups have the largest number of businesses (e.g., Construction and Professional, Scientific & Technical Services), they are not the largest source of FO generation. On the other hand, as anticipated, the largest source of FO appears to be from the Accommodation and Food Services group, despite the number of businesses representing that group not being the largest.
Figure 17 : Estimated FO [ t/y ] in 2020/21 by LGA (using BinTrim factors) for ANZSIC groups (primary axis , green bars ) and number of business es for ANZSIC group s (secondary axis , grey line ).
Food Innovations Australian Limited (FIAL) estimates that more than 50% of FO generated in hospitality and institutions in Australia is disposed to landfill (FIAL, 2021). This includes the Accommodation and Food Services group, for which is estimated (using the BinTrim method) that it produces 40% of the FO in the study LGAs (Figure 17), even though only 7% of all businesses are in this group. The second largest generation of FO for the study LGAs arises from the Retail trade group (10%), also representing about 7% of all businesses. FIAL (FIAL, 2021) estimates that more than 60% of FO generated in the retail is disposed to landfill.
Based on this analysis there is a significant opportunity within these sectors to divert FO that is currently disposed to landfill.