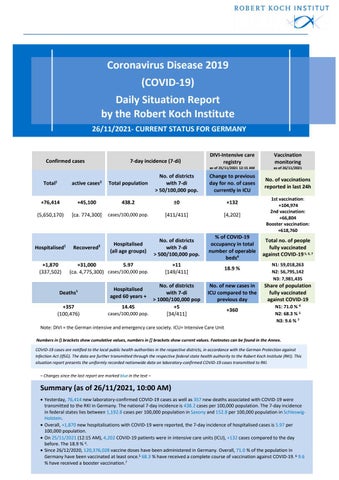
Coronavirus Disease 2019 (COVID-19) Daily Situation Report by the Robert Koch Institute 26/11/2021- CURRENT STATUS FOR GERMANY
Confirmed cases
7-day incidence (7-di)
DIVI-Intensive care registry
as of 25/11/2021 12:15 AM
as of 26/11/2021
No. of vaccinations reported in last 24h
Total1
active cases2
Total population
No. of districts with 7-di > 50/100,000 pop.
Change to previous day for no. of cases currently in ICU
+76,414
+45,100
438.2
±0
+132
(5,650,170)
[ca. 774,300]
cases/100,000 pop.
[411/411]
[4,202]
Recovered3
Hospitalised (all age groups)
No. of districts with 7-di > 500/100,000 pop.
% of COVID-19 occupancy in total number of operable beds4
Hospitalised1 +1,870 (337,502)
+31,000 5.97 cases/100,000 pop. (ca. 4,775,300)
Deaths1 +357 (100,476)
+11 [149/411]
No. of districts with 7-di > 1000/100,000 pop 14.45 +5 cases/100,000 pop. [34/411] Hospitalised aged 60 years +
Vaccination monitoring
18.9 % No. of new cases in ICU compared to the previous day
Note: DIVI = the German intensive and emergency care society. ICU= Intensive Care Unit
+360
1st vaccination: +104,974 2nd vaccination: +66,804 Booster vaccination: +618,760
Total no. of people fully vaccinated against COVID-19 5, 6, 7 N1: 59,018,263 N2: 56,795,142 N3: 7,981,435
Share of population fully vaccinated against COVID-19 N1: 71.0 % 4 N2: 68.3 % 5 N3: 9.6 % 7
Numbers in () brackets show cumulative values, numbers in [] brackets show current values. Footnotes can be found in the Annex. COVID-19 cases are notified to the local public health authorities in the respective districts, in accordance with the German Protection against Infection Act (IfSG). The data are further transmitted through the respective federal state health authority to the Robert Koch Institute (RKI). This situation report presents the uniformly recorded nationwide data on laboratory-confirmed COVID-19 cases transmitted to RKI. – Changes since the last report are marked blue in the text –
Summary (as of 26/11/2021, 10:00 AM) • Yesterday, 76,414 new laboratory-confirmed COVID-19 cases as well as 357 new deaths associated with COVID-19 were transmitted to the RKI in Germany. The national 7-day incidence is 438.2 cases per 100,000 population. The 7-day incidence in federal states lies between 1,192.8 cases per 100,000 population in Saxony and 152.8 per 100,000 population in SchleswigHolstein. • Overall, +1,870 new hospitalisations with COVID-19 were reported, the 7-day incidence of hospitalised cases is 5.97 per 100,000 population. • On 25/11/2021 (12:15 AM), 4,202 COVID-19 patients were in intensive care units (ICU), +132 cases compared to the day before. The 18.9 % 4. • Since 26/12/2020, 120,376,028 vaccine doses have been administered in Germany. Overall, 71.0 % of the population in Germany have been vaccinated at least once.5 68.3 % have received a complete course of vaccination against COVID-19. 6 9.6 % have received a booster vaccination.7
2
COVID-19 situation report as of 26/11/2021
Epidemiological Situation in Germany (as of 26/11/2021, 0:00 AM) Since January 2020, a total of 5,650,170 (+76,414) laboratory-confirmed cases of COVID-19 have been reported to and validated by the RKI (Table 1). The geographical distribution of cases of the last 7 days is shown in Figure 1. Please see the COVID-19 dashboard (https://corona.rki.de/) for information on the number of COVID-19 cases by county (local health authority).
Figure 1: Number and cumulative incidence (per 100,000 population) of reported COVID-19 cases in Germany by county and federal state (n=364,415, 26/11/2021, 12:00 AM). Cases are usually reported according to the district from which they were transmitted. This usually corresponds to the place of residence. Place of residence and probable place of infection do not have to coincide. Table 1: Number and cumulative incidence (per 100,000 population) of laboratory-confirmed COVID-19 cases, hospitalizations and deaths for each federal state electronically reported to RKI, Germany (26/11/2021, 12:00 AM). The number of new cases includes cases newly notified to the local public health authority, but also on prior days.
Cumulative cases Federal State Baden-Wuerttemberg Bavaria Berlin Brandenburg Bremen Hamburg Hesse MecklenburgWestern Pomerania Lower Saxony North Rhine-Westphalia Rhineland-Palatinate Saarland Saxony Saxony-Anhalt Schleswig-Holstein Thuringia Total
Number of cases
Number of new cases
Last 7 days
Cases/ 100,000 pop.
Cases
Cases/ 100,000 pop.
Cumulative deaths Hospitalisat ions/ 100,000 pop.
Number of deaths
Deaths/ 100,000 pop.
796,846 1,090,216 267,867 168,187 38,909 111,477 404,451
11,430 16,558 2,843 3,302 385 956 3,235
7,177 8,297 7,311 6,645 5,721 6,018 6,427
54,398 85,746 13,082 16,795 1,492 3,712 16,887
489.9 652.5 357.0 663.6 219.4 200.4 268.3
6.25 9.52 3.63 3.83 7.20 2.27 4.59
11,622 17,304 3,814 4,077 546 1,885 8,102
105 132 104 161 80 102 129
67,467
1,283
4,188
6,012
373.2
9.25
1,315
82
366,887 1,146,385 225,676 59,246 463,881 147,710 94,393 200,572 5,650,170
3,416 9,502 2,573 770 12,500 3,425 679 3,557 76,414
4,584 6,395 5,506 6,021 11,434 6,774 3,243 9,460 6,795
16,102 49,154 11,814 4,318 48,393 14,978 4,449 17,083 364,415
201.2 274.2 288.3 438.8 1,192.8 686.8 152.8 805.7 438.2
2.89 4.37 3.76 3.25 5.99 13.34 4.36 18.91 5.97
6,304 18,853 4,251 1,106 10,835 3,762 1,783 4,917 100,476
79 105 104 112 267 173 61 232 121
Quality checks and data cleaning by the local health departments and federal state health authorities can lead to corrections to cases previously transmitted (e. g. detection of duplicate reports). This can occasionally lead to negative values for the number of new cases.
COVID-19 situation report as of 26/11/2021
Figure 2 shows the course of the COVID-19 cases per 100,000 population transmitted to the RKI on the last 7 days in each of the federal states and in all of Germany. The values for the 7-day incidence in the federal states range from 1,192.8 per 100,000 population in Saxony to 152.8 per 100,000 population in Schleswig-Holstein.
Figure 2: COVID-19 cases/100,000 inhabitants during 7 days in Germany by federal state and reporting date in the health offices (26/11/2021, 0:00 AM). The grey area delineates a range of dates with yet incomplete data, where changes in incidence are likely to occur.
Estimation of the reproduction number (R), taking into account the reporting delay (Nowcasting) Figure 3 shows the course of estimated 7-day R-value. 7-day R-value 1.08 (95%-prediction interval: 1.00 – 1.16)
Effective Reproduction number R
2
95%-PI 95%-PI
80.000
60.000
1
40.000
20.000
0 1. .1 22
1. .1 15
1. .1 08
1. .1 01
25 .1 0.
18 .1 0.
0. .1 11
0. .1 04
27
.0
9.
0
Date of symptom onset Figure 3: Estimated 7-day R-value (in orange) over the last 60 days, against the background of estimated number of COVID-19 cases according to illness onset (as of 26/11/2021, 12 AM, taking into account cases up to 22/11/2021).
Number of new cases (Nowcast)
Nowcast 7-day R-value
3
4
COVID-19 situation report as of 26/11/2021
Sample calculations as well as an excel sheet presenting the daily updated R-value can be retrieved under www.rki.de/covid-19-nowcasting. A detailed description of the methodology is available at https://www.rki.de/DE/Content/Infekt/EpidBull/Archiv/2020/17/Art_02.html (Epid. Bull. 17 | 2020 from 23/04/2020).
Annex: Notes on data collection and evaluation The data presented in this situation report represent a temporal snapshot. Information on individual cases can be obtained and added by the health authorities in the course of the disease. It is not possible to obtain complete data for all variables. If necessary, the local public health authorities collect additional information, evaluate reported cases and initiate the necessary infection control measures. In accordance with the Infection Protection Act, the data are transmitted electronically by the local public health authorities to the federal state health authority and from there to the RKI on the next working day at the latest. The data is updated at the RKI daily at 0:00 AM. Data entry and data transmission can lead to a time lag from the time the case is reported to the local public health authorities until publication by the RKI, so case numbers may deviate from those from other sources. For the calculation of the incidences, the data of the population statistics of the Federal Statistical Office from 31.12.2020 are used. The calculation of the 7-day incidence is based on the reporting date, i.e. the date on which the local public health authorities became aware of the case and recorded it electronically. For the 7-day incidence, the cases reported on the last 7 days are counted. On the other hand, the number of cases since the previous day, as shown in the situation report and dashboard, is tied to the date when the case is first published in the RKI's reporting. Thus, due to transmission delays, it may occur that cases with a reporting date more than 7 days ago are still included in the situation report. At the same time, the number of cases since the previous day also may contain cases that were subsequently deleted in data quality checks. Thus, the 7-day incidence cannot be readily calculated from these single-day incidences.
Notes 1 2 3
4 5 6
7
The number of cases since the previous day refers to the date of receipt at the RKI; due to the delay in transmission, cases from previous days may be included. The number of active cases results from the number of transmitted cases minus the deaths and the estimated number of recovered cases. The algorithm for estimating the number of people who have recovered assumes an average duration of illness from onset or hospitalization date on. The true length of symptomatic illness and/or sequelae are usually not available in the reporting system. Proportion of COVID-19 occupancy by adults out of all available adult intensive care beds. The total number of persons vaccinated at least once results from the number of reports coded as first vaccination in the transmitted vaccination data. According to specifications for vaccination data transmission, every second vaccination or first vaccination after recovery is to be transmitted with the code as a complete vaccination. A vaccination with the Janssen vaccine is coded and transmitted as a first vaccination, but is also counted as completed vaccination series. The total number of persons with booster vaccination results from the number of reports coded as booster vaccination in the transmitted vaccination data.