
9 minute read
5. Data Talks: Measuring and Monitoring Plant Populations


Data Talks: Measuring Plant Populations
Time Estimate
Advertisement
30-45 minute introduction, 60-90 minute field session; an additional session or two would be needed for Take it to the Cienega!
Best Season
Spring Summer
Grade level 6-8
Learning Targets
1. Students will understand why monitoring is important and be able to describe two methods of sampling plant populations 2. Students will be able to discuss the pros and cons of taking a census versus a sampling method “An experiment is a question which science poses to Nature, and a measurement is the recording of Nature’s answer.” - Max Planck
Overview
It is important for scientists and land managers to measure various characteristics of plant communities. These measurements allow us to evaluate ecosystem health and document changes occurring over time or in response to management actions. It is not practical or possible to count each plant out there, so we use different methods of sampling portions of a larger population or plant community to collect information
Preparation
• Identify a study area; it could be the school yard, adjacent to the school property or if you have time, at the Blue Hole Cienega. • Locate an ideal place to run the transect and get familiar with a number of plants in your study area. • Pick one focus plant species for each group. Focal plant species should be common enough to be encountered in most of the plots. • Prepare 10 hula hoops for estimating percent cover by using string to divide the hula hoops into 4 sections (25% cover) • Label the hula hoops with tape or flagging for each plot 1-10, indicating where it is located along the transect (ie. Plot 1 @ 3 meters,
Plot 2 @ 6 meters)
1 2

Teacher Hints
If you can not purchase a 30 meter tape, the 10 hula hoop plots could be placed randomly in your study area or you can measure a 30m rope and mark every 3m with flagging tape.
This lesson can be adjusted to make it more challenging or less challenging. For instance, each group could study a common plant species as well as a less common plant. To simplify, students could have fun throwing hula hoops to random plot locations.
Data Talks: Measuring Plant Populations

What will you learn?
• Why and how plant populations are monitored • Strengths and weaknesses of using different methods of sampling vegetation • Data analysis skills
Vocabulary
•monitoring •census •cover •transect •plot
Materials Needed
• 30 meter measuring tape • hula hoops • tape or flagging • sturdy string • clipboards/data sheets/pencils • 2 oversized nails • field guides • graph paper “An experiment is a question which science poses to Nature, and a measurement is the recording of Nature’s answer.” - Max Planck
Overview
It is important for scientists and land managers to measure what is happening in a plant community to evaluate ecosystem health and document changes occurring over time, or in response to management actions. It is not practical or possible to count each plant out there, so they use different methods of sampling portions of a larger population or plant community to collect information that is representative of the whole. This lesson will introduce you to several methods of sampling populations and the different types of data that can be collected.
Background
Ecosystem managers and scientists sample plant populations for many reasons, including monitoring or “keeping tabs” on a population of rare plants, comparing the results of habitat treatments in an experiment, or determining the impact of an activity or event (e.g., building a new road, wildfire, or grazing) on a plant population. There are many aspects of the plant populations to consider, such as plant height or number of leaves or how many individuals are present.
Some common types of data collection to meet different objectives are listed below.
Presence/absence: Is the species of interest present or not? This is the fastest and easiest type of data to collect. However, it only lets the researcher know if the species is present or absent.
Population estimates: This method estimates the size of the population without actually counting every plant. During sampling, a representative portion of the population is counted and then this data is extrapolated to estimate the size of the entire population. For this method to be legitimate, the part of the population that is counted (the sample) must be selected carefully, in an unbiased manner and must also be representative of the rest of the population as a whole.
Data Talks: Measuring Plant Populations
Background Continued
Percent cover: This is a measure of the amount of the ground covered by the plant from a bird’s eye view. This is a very useful measure for comparing the abundance of different species. One drawback of measuring cover is that it can vary drastically for an individual plant over the course of the growing season and can be difficult to measure accurately because it is based on visual estimation. This measure is commonly used to study plant communities, showing which species is most abundant and indicating which plants are using resources.
Census (complete population counts): To complete a census, first decide on the area within which all plants will be counted. No statistical analysis is required and therefore any changes in counts from year to year are real. However, this method can be extremely time consuming, costly and, and often impossible. This is the preferred method when possible.
Sampling Layouts: There are different sampling methods and layouts that researchers use to collect data. Here are some examples of common layouts for sampling:
• Transects can be long, narrow strips or wide belts that traverse the landscape. The area within the boundary of the transect is sampled and transects are placed randomly or in intervals across the area to be sampled. Target species within the transect can be counted or percent cover of any or all species present can be assessed.
• Plots are square, round, or rectangular areas within the sampled area in which data is collected. The size of plots can vary with sampling method, though one meter square plots are common.
• Photo points: A picture is worth a thousand words! With this method, the photographer takes photos in the four directions (north, east, south and west) from a set of permanently marked points within the area of study. The photo points should give a good visual assessment of the entire area. Photo points can then be revisited over time, the photos re-taken, and compared to the initial (baseline) photos to evaluate change over time.
Once you have collected your data, the next step is data analysis. Until you do this you just have a bunch of numbers on a piece of paper. Data analysis involves quantitatively summarizing your data to paint a picture of what is happening with the plant community you measured. For example, you may want to know the average cover or average number of individuals across the area you measured. If you repeat these measurements year after year, you can monitor how a population is growing or shrinking over time.
Data Talks: Measuring Plant Populations
Student Directions
1. Divide students into groups of 3-4.
2. Your teacher will tell you what plant you will be measuring. This is your group’s “focal plant species”.
Make sure you can recognize younger and older or flowering and non-flowering individuals. This monitoring exercise will answer the question of how common your chosen plant species is within your survey site.
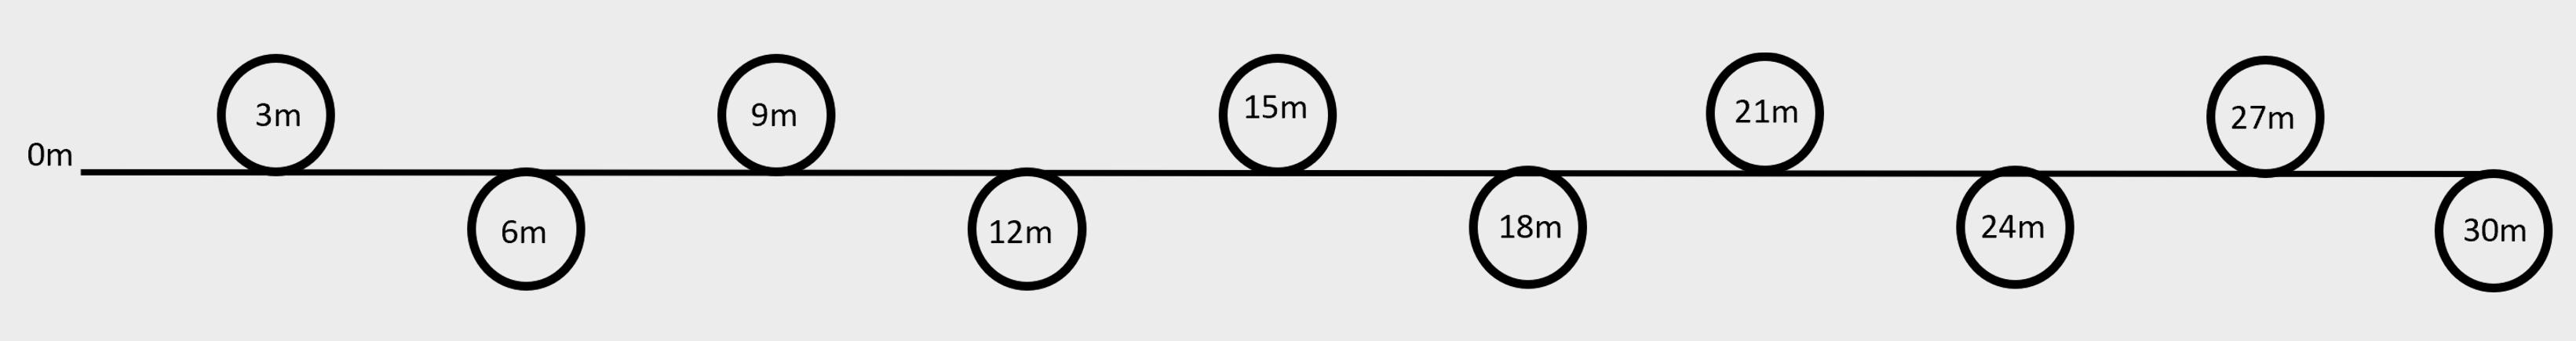
3. Set up a 30 meter long transect in your study area.
Typically plant ecologists randomly locate transects or plots, but for this activity, your teacher will help you set up the transect to make sure you intersect plants you are studying.
4. Once your transect is established, place the hula hoops every 3 meters, alternating sides, starting at the 5 meter mark along the transect line.
5. At each sample point (3 m, 6 m, etc.) place the apex of the hula hoop ring.
6. Record three types of data for the focal plant species on the handout. : a. Presence/absence- Is the species present in the plot (yes or no)? b. Percent cover- visually estimate how much of the plot the species is taking up (% out of 100% cover). c. Count the number of individuals
7. Data analysis- Calculate the frequency (% of plots in which your species is found) at which each species was present in your sample of ten plots. Calculate the average percent cover for each species. Average your count data for each species. Do the same techniques yield similar or different results?
8. Discuss your results as a class. Which type of data most accurately represents the population of plants you are studying? Compare the efficiency of data collection (how long it took) against the usefulness of the information you collected. Which methods were best for the plants you studied? How could you change your methods to collect more accurate data?
How might you change the data you collect if you had a different research question?
Take it to the Cienega! Reflection

Activity could be done at the Blue Hole Cienega. Students should be mindful of trampling vegetation.

Resources
• Measuring and Monitoring
Plant Populations- http://msuinvasiveplants.org/ documents/archives_cism/BLM_Measuring_and_ monitoring.pdf What did you learn about measuring plant populations? Why do you think there are so many different methods used? Does the sampling method influence your interpretation of the data? Will you have greater confidence in some methods of data collection than others?
Tips for Estimating Percent Cover
Estimating percent cover takes practice. Here are a few tips to get you started:
• Work with your team to calibrate your estimations. Have everybody come up with an estimate in their minds.
Then share your estimates and compare how different they are across the team. If needed, explain why each of you estimated what you did and reach a consensus on what makes the most sense. • Narrow down your range. Start by asking yourself, “Is it more than half or less than half? If it’s less than half, is it more than a quarter or less than a quarter?” • Visualize moving everything to one side so that it is all clumped together to help estimate how much space it is taking up. • The back of a closed fist is about 1% of a 1x1 meter plot. • Use the chart below to help estimate:

Datasheet
Record data from each hula hoop plot in the table below.
Focal plant species description and/or name (ex. small hairy plant with yellow daisy flowers):
Plot # Plot Info Present (Y/N)
1 3m Cover % Count
2 6m
3 9m
4 12m
5 15m
6 18m
7 21m
8 24m
9 27m
10 30m
Data Analysis
1. Calculate the frequency your focal plant species was detected:
a. Number of plots the focal plant was present in
b. Multiply the number of plots the focal plant was present in by 10 = ____% 2. Calculate average cover: a. Sum of ‘Cover %’ column = ______________
b. Sum of Cover % column divided by 10
3. Calculate average count: a. Sum of ‘Count’ column =________
b. Sum of ‘Count’ column divided by 10 = _______

