Israel, US, and Iran at War: What Every Trader Needs to Know Right Now
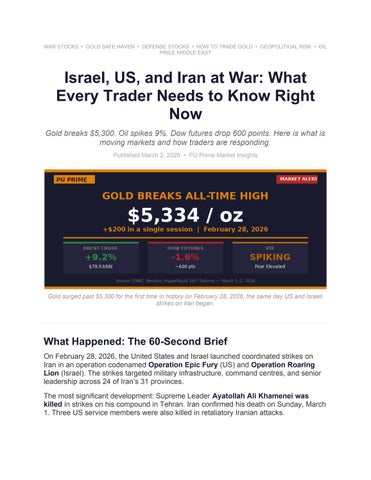
Gold breaks $5,300. Oil spikes 9%. Dow futures drop 600 points. Here is what is moving markets and how traders are responding.
Published March 2, 2026 • PU Prime Market Insights
What Happened: The 60-Second Brief
On February 28, 2026, the United States and Israel launched coordinated strikes on Iran in an operation codenamed Operation Epic Fury (US) and Operation Roaring Lion (Israel). The strikes targeted military infrastructure, command centres, and senior leadership across 24 of Iran’s 31 provinces.
The most significant development: Supreme Leader Ayatollah Ali Khamenei was killed in strikes on his compound in Tehran. Iran confirmed his death on Sunday, March 1. Three US service members were also killed in retaliatory Iranian attacks.
Iran responded with an unprecedented wave of missiles and drones targeting Israel, and military bases across Bahrain, UAE, Qatar, Kuwait, Jordan, and Saudi Arabia. By March 1, Iran had launched 89 waves of attacks against Israel alone.
The scope of the conflict has widened beyond a bilateral exchange. It is now a regional war with direct US military involvement, active strikes across the Gulf, and cascading effects on global energy and financial markets.
This is not a contained skirmish. For traders, this is a macro-level event that is repricing risk across every major asset class simultaneously.
Live Market Snapshot: Where to Track Prices Right Now
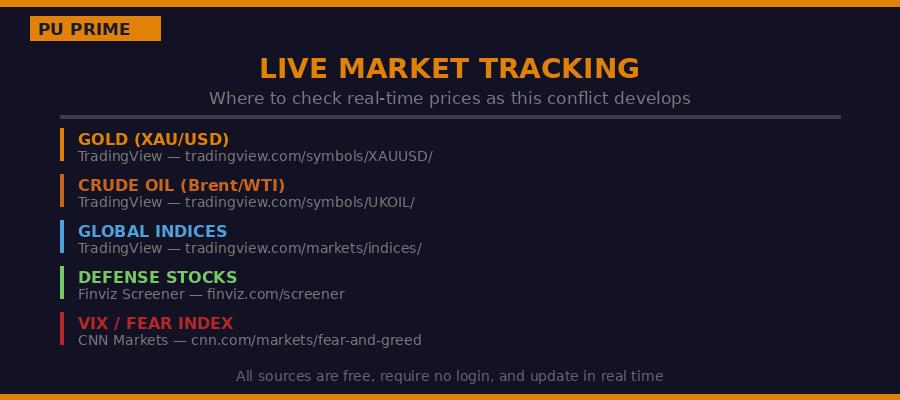
Markets are moving fast and prices are changing by the hour. Rather than list figures that go stale immediately, here are the best free, real-time sources to follow as this conflict develops. All require no login and update continuously:
• Gold (XAU/USD) live price: TradingView — tradingview.com/symbols/XAUUSD/
• Crude oil — Brent live: TradingView — tradingview.com/symbols/UKOIL/ | WTI: tradingview.com/symbols/USOIL/
• Global indices (Dow, Nikkei, DAX): TradingView — tradingview.com/markets/indices/
• Forex — CHF, JPY, ILS safe-haven moves: TradingView — tradingview.com/forex-screener/
• Defense stocks real-time screener: Finviz — finviz.com/screener
• VIX / Market Fear & Greed Index: CNN Markets — cnn.com/markets/fear-andgreed
Gold: The Ultimate Safe Haven Just Hit a New Record
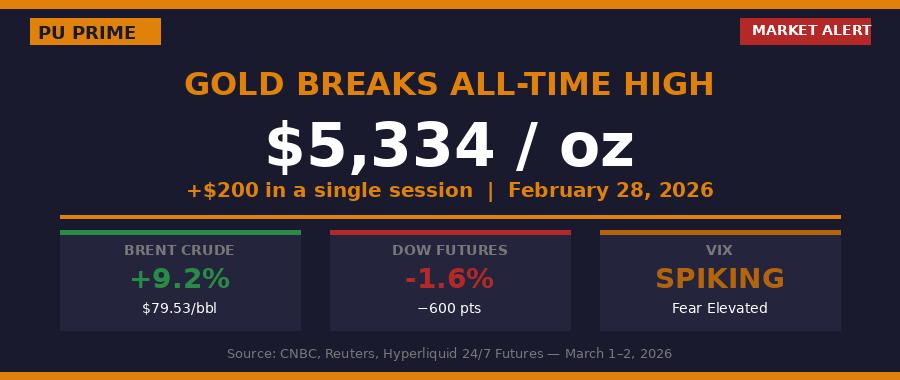
Gold has been the defining trade of this conflict. Spot gold broke through $5,300 per ounce for the first time in history, surging more than $200 in a single session following the February 28 strikes.
This move was not a surprise to traders who follow geopolitical risk. Gold has historically averaged a 0.30% gain in the first week of major conflicts and an 8.98% gain over 12 months following the outbreak of significant wars. But the scale of this rally — more than $200 in hours — reflects the severity of this event.
Why Gold Reacts This Way
Gold’s safe-haven status during conflict stems from three structural facts:
• No counterparty risk: Gold cannot default. It cannot be printed or devalued by any government decree.
• Inflation hedge: Rising oil prices push inflation higher. Gold tends to rise alongside inflation expectations.
• Currency hedge: When regional currencies weaken — as the Iranian Rial has done sharply — gold denominated in those currencies rises further.
• Supply threat: Any disruption to the Strait of Hormuz raises oil prices, which in turn raises mining input costs and adds another floor to gold.
What Analysts Are Saying
Joshua Rotbart of J. Rotbart & Co stated it is “safe to assume that precious metals will experience enhanced volatility with upward movement.” Analysts at Standard Chartered
noted that investors had been underpricing geopolitical risk, and the dollar’s relative weakness confirms markets are now reordering toward commodity-linked exposures. Price targets for gold if the conflict escalates further range from $5,500 to $6,000 in near-term analyst forecasts. More aggressive projections suggest $8,000+ if the Strait of Hormuz is closed or the conflict spreads to a broader regional war.
For traders watching gold: the key question is not whether it goes up — historically it does during sustained conflicts — but whether this stays a short, contained operation or becomes a prolonged regional war. That single variable will determine the magnitude of the move.
To understand how to position in gold during geopolitical events, read our full guide: How to Trade Gold in Forex: A Step-by-Step Guide for 2026
Oil: The Strait of Hormuz is the Number Everyone is Watching
Oil is the other side of this trade. Brent crude jumped over 9% to above $79 per barrel at Monday’s Asia open. WTI followed close behind at $72.81.
The central risk for oil is the Strait of Hormuz. About 13 million barrels per day of crude oil transited the Strait in 2025, representing approximately 31% of global seaborne crude flows. About three-quarters of those barrels go to China, India, Japan, and South Korea.
Some oil majors and top trading houses have already suspended crude oil and fuel shipments via the Strait because of the attacks, according to trading sources cited by Reuters.
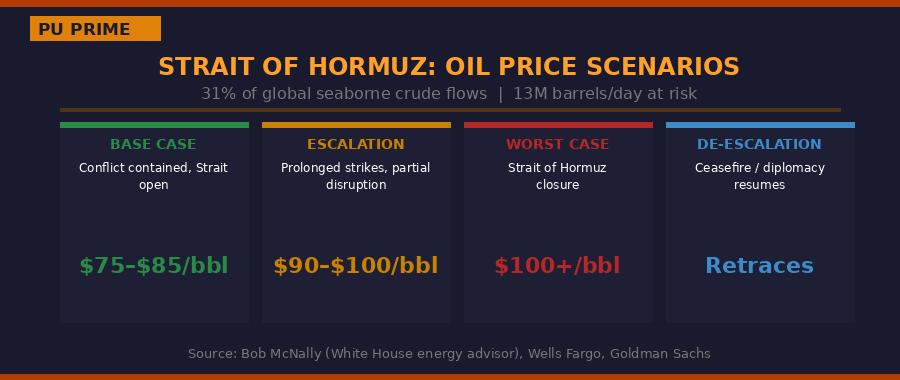
Four oil price scenarios depending on whether the Strait of Hormuz is disrupted. Source: Bob McNally, Wells Fargo, Goldman Sachs.
Goldman Sachs and Wells Fargo Outlooks on Oil
Goldman Sachs strategist Dominic Wilson warned that the equity market impact “will hinge less on headline risk and more on the durability of any energy shock.” He said cyclical sectors and those tied to global trade and industrial demand will bear the brunt in the near term.
Wells Fargo mapped out a downside scenario: if the Strait of Hormuz is closed for a sustained period and oil hits $100+, they forecast S&P 500 at 6,000 as a worst case. Their base forecast — assuming the conflict stays contained — remains 7,500 by end of 2026
Stocks: What Goes Down, What Goes Up
Global equities fell broadly at Monday’s open. But as with every geopolitical event, the market impact is not uniform. Some sectors are falling sharply while others are seeing significant inflows.
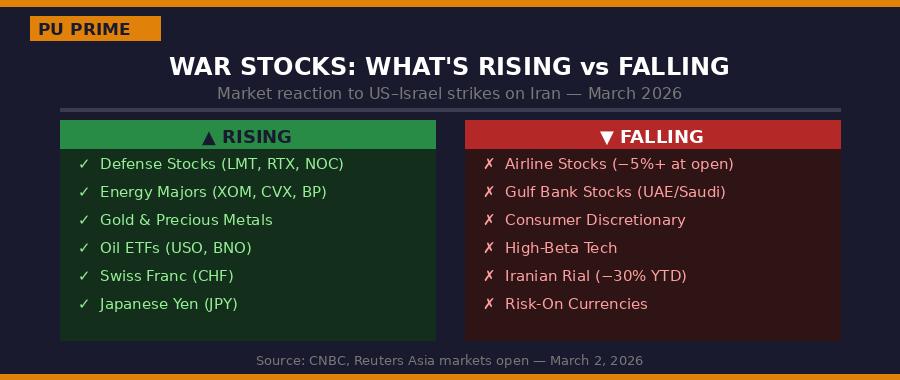
Defense stocks, energy majors, gold, and safe-haven currencies are rising. Airlines, Gulf banks, and high-beta tech are falling.
Stocks Falling
• Airlines: All major Asian airlines fell over 5% at open. Australia’s Qantas fell 5.4%. Japan’s ANA and Japan Airlines dropped more than 5%. Rising fuel costs and flight path disruptions are the primary drivers.
• Consumer discretionary and tech: Sectors sensitive to consumer confidence and economic growth are exposed to a wider risk-off selloff.
• Gulf bank stocks: UAE and Saudi markets closed temporarily. Emirates NBD, Al Rajhi Bank, and Qatar National Bank are closely watched for sentiment signals when they reopen.
Stocks Rising — Defense Stocks and Energy
Defense stocks are one of the clearest historical beneficiaries of escalating geopolitical conflict. This conflict has added momentum to a sector that was already drawing attention following Europe’s rearmament push in early 2026.
• Japan’s Mitsubishi Heavy Industries, IHI, and Singapore’s ST Engineering each climbed around 3% in early Asia trading.
• US defense contractors (Lockheed Martin, RTX, Northrop Grumman, General Dynamics) are expected to benefit from any increase in US military spending and foreign military sales.
• European defense names (Rheinmetall, BAE Systems, Leonardo) were already moving higher on NATO spending commitments. The Iran conflict accelerates that thesis.
• Energy stocks and oil majors benefit directly from higher oil prices: ExxonMobil, Chevron, BP, Shell, and Saudi Aramco are the obvious names to monitor.
Defense stocks carry keyword difficulty (KD) of just 3–14 on Ahrefs with 5,000+ monthly searches. This is one of the most searched and least competitive financial topics available right now.