
Report Date: August 16, 2024 psmj.com

Report Date: August 16, 2024 psmj.com

A number of AEC industry associations and publishers track market trends in this industry on a regular basis. They report billings, backlog, and proposal opportunities for the industry as a whole. But, which of these indicators is most meaningful when it comes to planning for your firm’s future? What types of projects offer the greatest opportunities?
When market trends change (either positively or negatively), this is observed first as a change in the number of available proposal opportunities. These changes in proposal opportunities later become changes in backlog, revenues and cash flow — as shown on the following illustration:
Proposals




In PSMJ’s Quarterly Market Forecast survey, we track these indicators and present them to you in this quarterly update. Strategic and business planning requires you to set your strategies not for where the markets are today but where you believe they will be heading in one to five years. We therefore focus most on the trends (either positive or negative) in proposal opportunities since they are the most leading indicator.
As well as providing an overview of the entire AEC market, only PSMJ’s Quarterly Market Forecast Report details conditions in 12 major markets, and 58 submarkets.
PSMJ’s Quarterly Market Forecast Reports are only as good as the data that goes into them! To learn more about participating in the next Quarterly Market Forecast survey, visit psmj.com/qmf.
Retail Buildings (For Lease Facilities)
Warehouse Distribution (For Lease Facilities)
Office-to-Housing Conversion (For Lease Facilities)
Warehouse/Distribution
Component Assembly/Facilities. (Telecom and Consumer Goods)
Mining/Resource Extraction (Includes Oil Drilling)
Primary Materials Manufacturing (Steel Mills, Refineries, Etc.)
Petroleum Facilities
Product Manufacturing (Food, Auto, Etc.)
Chemical Plants
Pharmaceutical Production
Renewable Energy (Wind, Solar, Hydroelectric, Wave)
Telecom/Cable
Power Plants
Pipelines
Utility Distribution
Support Facilities (Gyms, Dorms, Libraries, Etc.)
Higher Education Facilities
Justice Facilities (Courts, Jails, Etc.)
Public Recreation (Parks, Athletic Fields, Etc.)
Public Safety (Fire Stations, Police Stations, Etc.)
Sports Facilities (Arenas, Stadiums, Etc.) I. Environmental
Waste Disposal (Landfills, Etc.)
Wetlands Delineation
Site Clean-Up (Site Remediation, Nuclear, Etc.)
Environmental Permitting (EIS, EIA, Etc.)
Resource Management (Water Conservation, Dams, Etc.)
Air Pollution
Water Supply
Wastewater Treatment
Water Distribution
Wastewater Reuse
Wastewater Collection
Water Treatment K. Healthcare
Medical Offices
Continuing Care Facilities (Treatment Centers, Etc.)
Medical Laboratories L. Housing
Multi-Family Development
Single Family Development (Subdivisions)
Single Family Development (Individual Houses)
Senior and Assisted Living (Independent Living)

PSMJ
PSMJ PRO is the exclusive business success network just for architecture and engineering firm executives. Join today and access the collective wisdom of thousands of peer leaders, the latest strategies for breakthrough success, fresh data on AEC growth opportunities, and solutions to your most pressing management challenges.
PSMJ PRO annual membership benefits:
•12 issues of the PSMJ PRO newsletter: Each loaded with at least 25 profit-boosting ideas you can try at your firm
•4 AEC Quarterly Market Forecast Reports: Every three months, you see which AEC markets are generating the most (and fewest) RFPs.
•Online AEC Executive Huddles and Discussions: From how to make better AEC tech investments to talent engagement hacks to project profit improvement strategies, and much more, PSMJ PRO has a curated topic-specific forum for asking tough questions and getting answers, fast!
ACTIVATE YOUR PSMJ PRO MEMBERSHIP TODAY!

Is your firm’s growth strategy aligned with the latest market demands?
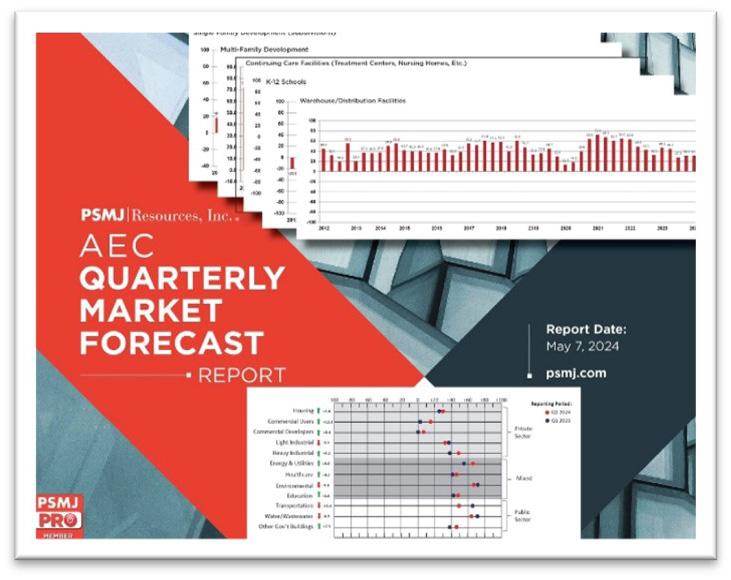
PSMJ PRO members count on the AEC Quarterly Market Forecast, the ONLY forward-looking report revealing changes in AEC proposal activity by market and submarket, to see where demand is heating up and cooling off. Armed with this exclusive data, they drive successful strategic decisions about resource and talent allocation, BD and tech investments, and more.
Join PSMJ PRO for actionable business forecasting intelligence on markets you’re in, and ones you’re interested in, with detailed outlooks for over 50 markets, including:
• Single and multi-family housing
• Water/wastewater
• Light industrial
• Education
• Environmental remediation
• Government and municipal
• Condominiums
• and 47 more!
ACTIVATE YOUR PSMJ PRO MEMBERSHIP TODAY!
Overall, proposal activity in the architecture/engineering/construction (AEC) space remains relatively stable as the industry navigates a mixed bag of headwinds in some areas and tailwinds in other areas. PSMJ’s latest Quarterly Market Forecast surveyed 179 AEC executives (collected between July 9, 2024 and July 26, 2024) and revealed an overall proposal activity Net Plus/Minus Index (NPMI) value of 23.0, which is comparable to the NPMI value of 24.9 for the same period in 2023. The study also tracks NPMI values in 12 key client markets and 59 submarkets.
Any NPMI value above zero indicates that more respondents are seeing an increase in proposal activity compared to the prior quarter (+100 indicates all respondents are seeing an increase in proposal activity, -100 indicates all respondents are seeing a decrease in proposal activity). Since proposal activity is a leading indicator for backlog, revenue, and—ultimately—cash flow, the latest NPMI values provide a valuable glimpse into cash flow over the next 12 to 24 months.
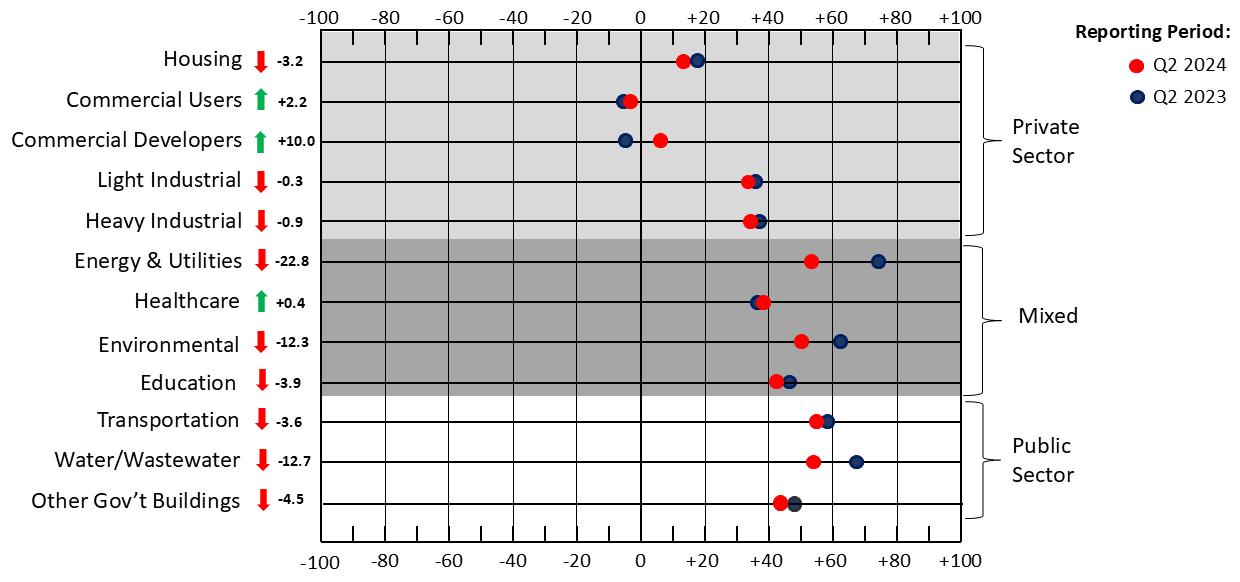
The story as of late for the AEC markets has largely been one of record levels of government spending bolstering public-sector markets while the private-sector markets take the blows associated with rising interest rates and other challenges. As we head into the second half of 2024, some relative stabilization across many markets has been a welcome sight but that won’t last forever. In the latest data set, the market with the largest swing upward was Commercial Developers with a +10.0 gain (driven largely by growth in the Warehouse Distribution and Office-toHousing Conversion submarkets while the Office Buildings submarket struggles) while the market with the largest downward swing was Energy & Utilities that shed 22.8 points but remains strongly in positive territory after near-record levels of proposal activity.
“As an interest rate cut by the Fed in September seems all but certain at this point, that may mean that the worst of it is behind us for the Commercial markets,” states PSMJ President Gregory Hart. “But, the damage is done and the Office Buildings submarket is still in deeply negative territory. It could be some time before we see real relief and associated growth there. We also need to watch for
any signs of potential cooling in the infrastructure markets that have been supported by IIJA spending. That won’t last forever as projects move into construction phases. In fact, some of the mixed markets like Healthcare and Education seem to have the strongest fundamentals right now with all of their respective submarkets consistently delivering double-digit NPMI performance.”
The following table summarizes the latest NPMI values by client market in the most recent period compared to the same period from one year ago:
Based on our latest Quarterly Market Forecast data, the following summarize the five markets with the highest NPMI values:
PSMJ PRO members get access to the complete Quarterly Market Forecast report that includes data on 50+ submarkets to dial in strategic moves on business development, recruiting, acquisitions, and more! Not a PSMJ PRO member yet? Join today at psmj.com/psmjpromembership.
Since 2003, PSMJ has been conducting quarterly surveys to assess the strength of all the major AEC markets. In the surveys, we ask the following questions comparing the current quarter to the previous quarter:
Did your firm’s revenues increase or decrease?
If so, were the increases/decreases more than 5% or less than 5%?
Did your firm’s backlog increase or decrease?
If so, were the increases/decreases more than 5% or less than 5%?
Did the number of proposal opportunities increase or decrease?
What are your expectations for next quarter’s revenues?
Do you expect them to increase or decrease? By more than 5% or less than 5%?
We also ask questions about the respondents’ markets, submarkets, and geographic regions. The responses we receive allow us to compute a Net Plus/Minus Index (NPMI) by subtracting the number of respondents who responded negatively from the number who responded positively. If the same number responded positively and negatively, the plus-minus index would be 0. If more responded positively, the index would be positive. And if more responded negatively, the index would be negative. The higher the positive or negative value of the index, the stronger the positive or negative response.

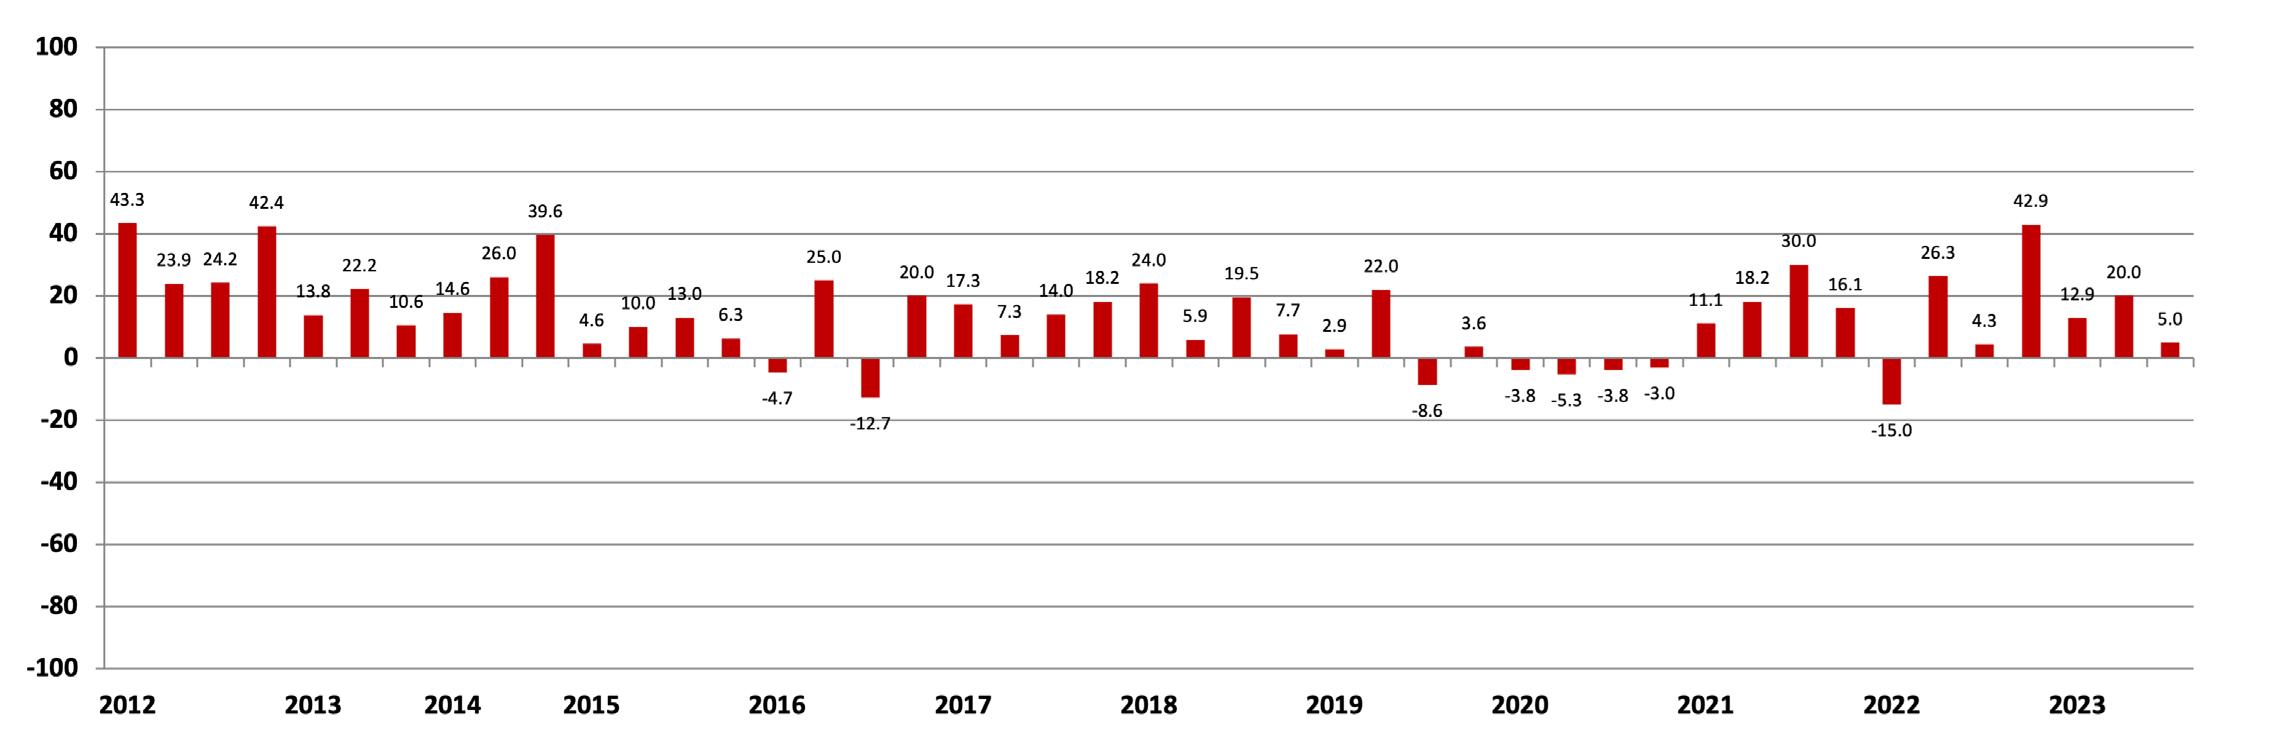
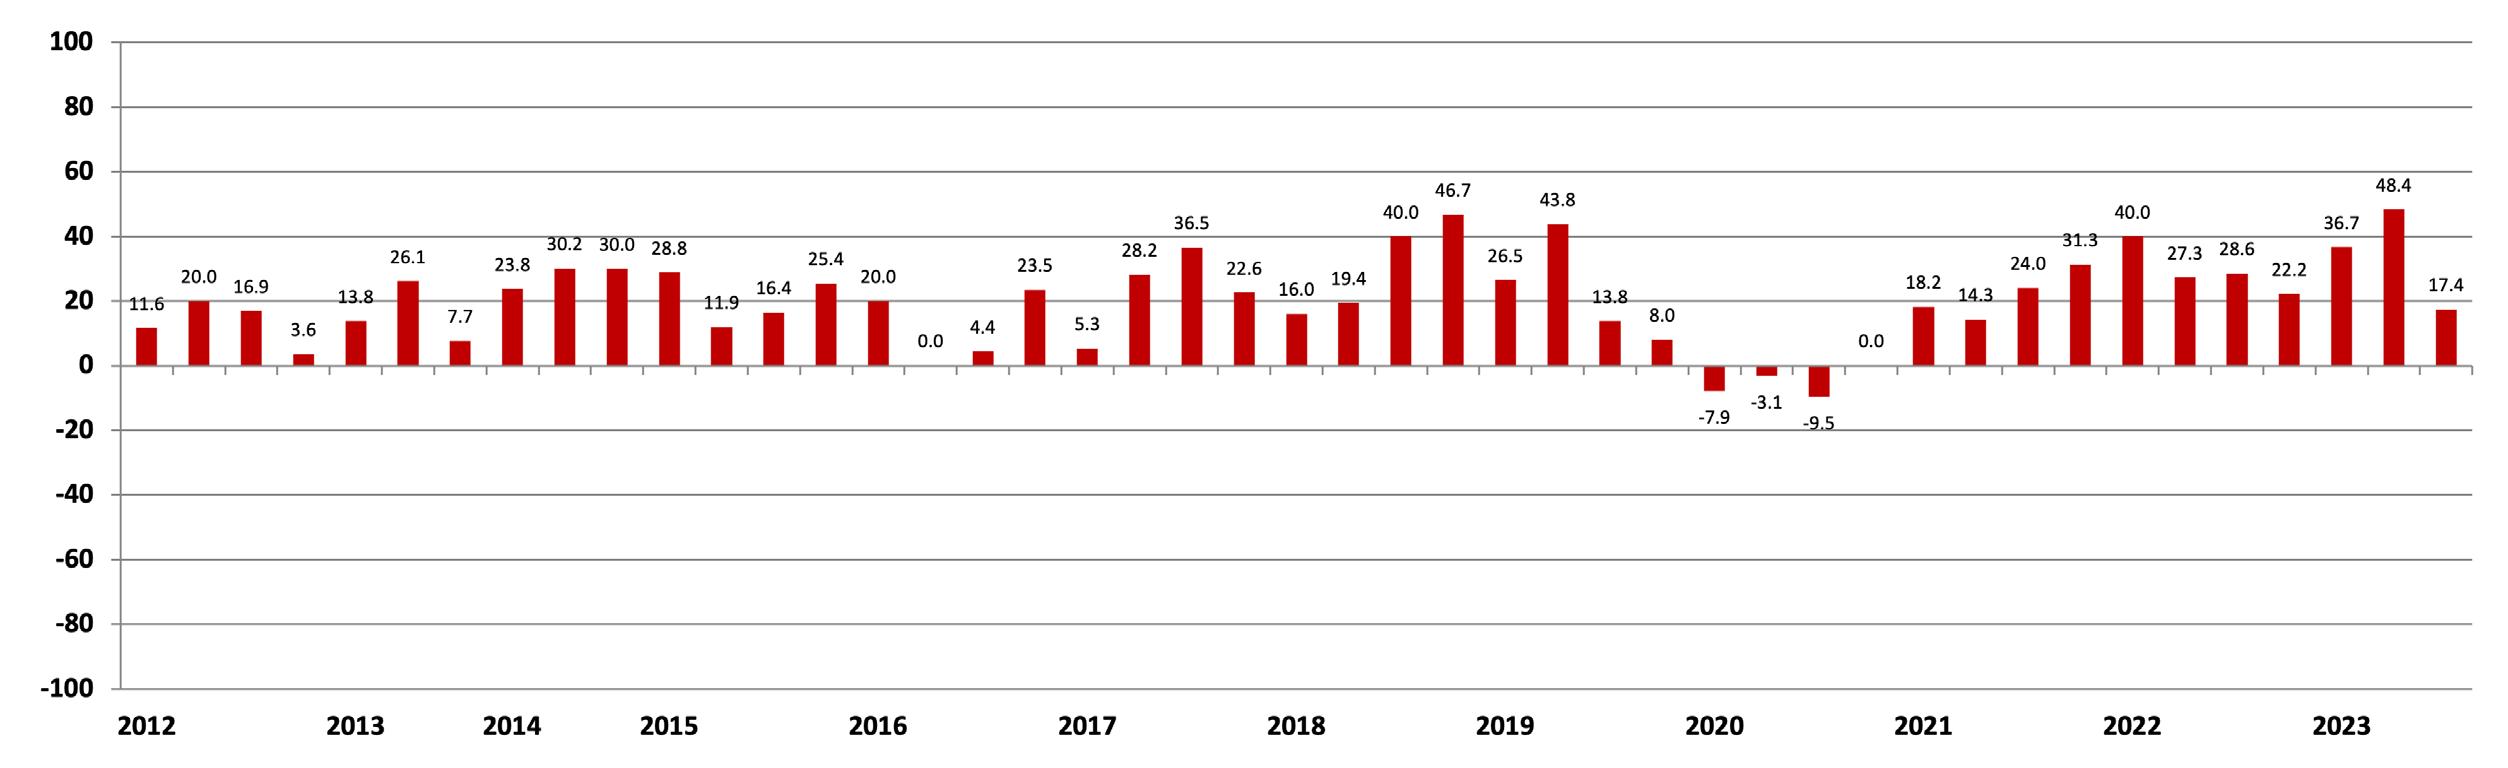
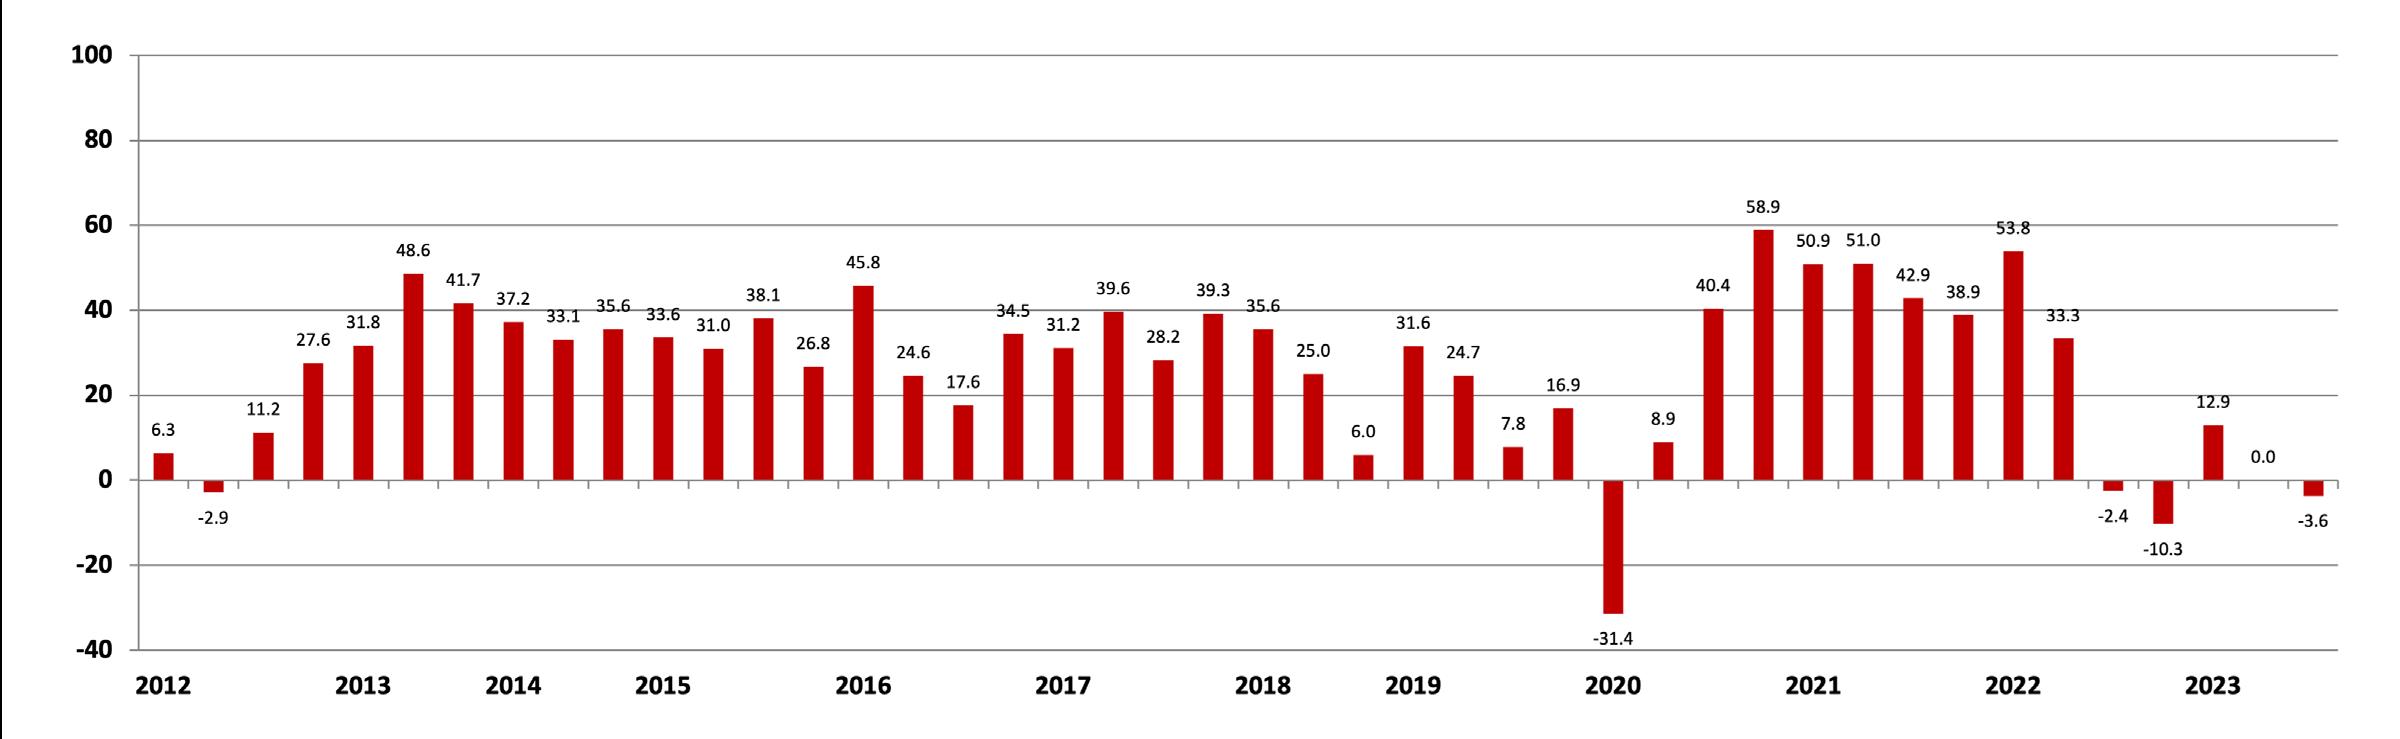
The following charts outline key trends in the overall data set. Throughout this report, trends are articulated using a Net Plus/Minus Index (NPMI). The NPMI value is calculated by subtracting the number of respondents who responded negatively from the number who responded positively. If the same number responded positively and negatively, the NPMI value would be 0. If more responded positively, the NPMI value would be positive.
Long-Term Historical Trends

The following charts drill down into key trends over time in the major markets and submarkets that comprise the AEC industry. Throughout this report, trends are articulated using the NPMI. The NPMI is calculated by subtracting the number of respondents who responded negatively from the number who responded positively. If the same number responded positively and negatively, the NPMI value would be 0. If more responded positively, the NPMI value would be positive.
(Overall Market)
Office Buildings (For Lease Facilities)
Retail Buildings (For Lease Facilities)
Warehouse Distribution (For Lease Facilities)
Conversion (For Lease Facilities)
(Overall Market)
Trends (Overall Market)
Mining/Resource Extraction (Includes Oil Drilling)
Primary Materials Manufacturing (Steel Mills, Refineries, Etc.)
Support Facilities (Gyms, Dormitories, Libraries, Etc.)
Higher Education Facilities
Historical Trends (Overall Market)
Facilities (Courts, Jails, Etc.)
Recreation (Parks, Golf Courses, Athletic Fields, Etc.)
Trends (Overall Market)
Site Clean-Up (Grayfields, Site Remediation, Nuclear, Etc.)
Environmental Permitting (EIS, EIA, Etc.)
Historical Trends (Overall Market)
Single Family Development (Subdivisions) Single Family Development (Individual Houses)

As an AEC firm leader facing a complex issue, it can feel like you’re on your own sometimes. Not when you can tap into PSMJ PRO Peer Connections. This online resource, exclusively for PSMJ PRO members, features
• Topic-specific monthly small group live online gatherings, facilitated by a PSMJ consultant, to share ideas, challenges, and solutions.
• Member discussion forums, grouped by topic, where you can post a question about a business challenge you’re facing, and get immediate feedback from peer AEC executives who have been where you are.
From client management to ownership transition hurdles to benchmarking utilization rates to choosing the right AEC ERP software, PSMJ PRO’s AEC Peer Connections attack the issues you’re facing, connect you to experienced executives, and provide some unexpected approaches to overcoming your business growth hurdles.
Established in 1974, PSMJ Resources, Inc. is the world’s leading authority on the effective management of architecture, engineering, and construction firms. With offices in the United States, the United Kingdom, and Australia, PSMJ offers over 150 titles in book, audio, and video format. We also publish three monthly periodicals and deliver hundreds of seminars, round tables, conferences, webinars, and in-house training sessions every year for AEC professionals around the world. PSMJ’s sought-after consulting expertise covers a range of critical business areas such as strategic planning, project management, valuation, succession planning, and mergers and acquisitions.
You can learn more about us at psmj.com.
10 Midland Avenue I Newton, MA 02458