
Full length article
Permit
Contents lists available at ScienceDirect
journal homepage: www.elsevier.com/locate/fishres
(Trachinotus falcatus)
aggregation fishery dynamics and depredation in the Florida Keys

Gina M. Clementi * , Benjamin M. Binder , Kirk R. Gastrich , Michael R. Heithaus , Andrew Natter , Nicholas Tucker , Kevin M. Boswell
Institute of Environment, Department of Biological Sciences, Florida International University, North Miami, FL, USA
ARTICLE INFO
Handled by A.E. Punt
Keywords:
Fishery dependent survey
Recreational fisheries
Spawning aggregations
Permit (Trachinotus falcatus)
Shark depredation
ABSTRACT


Fish spawning aggregations (FSAs) are predictable events where large numbers of conspecifics gather to reproduce, making them vulnerable to overfishing. Permit (Trachinotus falcatus), a highly valued recreational species, form FSAs during the spring full moons in the Florida Keys (USA) that are targeted by anglers. Depredation mortality during catch-and-release angling at these FSAs may undermine the benefits of a harvest prohibition. We therefore conducted fishery-dependent surveys across three primary permit FSAs in the Lower and Middle Keys to assess recreational effort, catch per unit effort (CPUE), and depredation risk. Effort and CPUE peaked during the March-April full moons, coinciding with peak aggregation occurrence. Site-specific differences in recreational effort and CPUE were apparent between the Lower and Middle Keys. At the Middle Keys artificial reefs (Seven Mile Bridge Rubble, Thunderbolt), effort was higher but CPUE was lower, while in the Lower Keys, the natural reef Western Dry Rocks (WDR) exhibited higher CPUE and lower effort, the latter of which decreased after a seasonal fishing closure (SFC) went into effect. Depredation probability was generally low and variable but highest at WDR, increasing since the SFC went into effect, underscoring the risk of depredation during the openly fished March full moon period. Shifts in effort and depredation probability in the Middle Keys are unlikely to be spillover effects related to the WDR SFC but rather due to changes in tourism, angler behavior, and shark occurrence. These results highlight the need for continued monitoring and adaptive management to assess depredation mortality in recreational fisheries and protect vulnerable spawning populations like permit.
1. Introduction
Fish spawning aggregations (FSAs) occur when groups of conspecifics congregate in high abundances for the purpose of reproduction, usually occurring at specific times and locations (Domeier and Colin, 1997). Many coral reef-associated fishes participate in FSAs as their sole reproductive window, which recur annually on discrete reef promontories and shelf edges during a defined period, where timing and location varies by species (Domeier and Colin, 1997; Johannes, 1978). The predictability of these aggregations makes them an easy target for fishers, increasing the risk of overexploitation and, in extreme cases, extirpation, which has occurred to several economically important FSAs (e.g., Nassau grouper [Epinephelus striatus] in the Greater Caribbean) (Sadovy and Domeier, 2005; Sala et al., 2001). To mitigate high fishing mortality on FSAs, fisheries management strategies have prioritized both harvest bans and spatiotemporal closures that encompass the
* Corresponding author.
E-mail address: gmclementi@gmail.com (G.M. Clementi).
https://doi.org/10.1016/j.fishres.2026.107685
duration and locations of FSAs (Grüss et al., 2014; Jackson and Moran, 2012; Lindeman et al., 2000; Nemeth, 2005; van Overzee and Rijnsdorp, 2015). However, many FSAs are still unprotected and remain open to fishing, necessitating continued evaluation of fishing practices that affect these spawning sites (De Mitcheson, 2016; Erisman et al., 2020; Heyman et al., 2019; Sadovy de Mitcheson et al., 2013).
Most documented and well-studied transient FSAs belong to species within the families Epinephelidae and Lutjanidae (i.e., groupers and snappers) whereas fewer studies have focused on Carangidae (jacks) (Daly et al., 2018; Heyman et al., 2019; Madgett et al., 2022; Sala et al., 2003). Contrary to resident spawners, which spawn frequently throughout the year within their home range, transient spawners may travel long distances during a specific time of year and persist for only a short period of time, increasing their vulnerability to overexploitation (Domeier and Colin, 1997; Grüss et al., 2014). In the tropical western Atlantic Ocean, there are several carangids with documented FSAs,
Received 22 October 2025; Received in revised form 16 February 2026; Accepted 16 February 2026
Available online 28 February 2026
0165-7836/© 2026 Elsevier B.V. All rights are reserved, including those for text and data mining, AI training, and similar technologies.
including permit (Trachinotus falcatus) (Graham and Castellanos, 2005; Heyman and Kjerfve, 2008; Reis-Filho et al., 2021). Permit are a coastal species that occupy a variety of nearshore habitats (i.e., seagrass beds, natural and artificial reefs) throughout their range from Massachusetts, USA to southeastern Brazil including the Greater Caribbean (Robins and Ray, 1986). In the Florida Keys, permit aggregate for spawning on natural and artificial offshore structures throughout the Florida reef tract from March through August, peaking around the full moons from April through July (Brownscombe et al., 2023, 2020; Crabtree et al., 2002).
Permit are primarily targeted by recreational anglers since they are notoriously difficult to catch on the flats (i.e., sight-fishing in shallow coastal areas). Thus, the catch-and-release permit fishery represents a lucrative component of the Florida Keys flats fishery, which collectively generates an economic impact over $465 million per year (Fedler, 2013; Smith et al., 2023). Given their importance to Florida’s economy, permit have been prioritized in fisheries legislation through: (1) the establishment of a Special Permit Zone (SPZ; i.e., stricter size and bag limits, seasonal closure [April 1-July 31], and gear restrictions [hook-and-line only] in waters surrounding the Florida Keys (https://myfwc.com/fish ing/saltwater/recreational/permit/) and (2) the seasonal fishing closure (SFC; April 1-July 31) of a multi-species spawning site (Western Dry Rocks) that includes an important permit FSA (https://myfwc. com/fishing/saltwater/recreational/wdr/; Brownscombe et al., 2020). Although permit are prohibited from being harvested during their spawning season in the SPZ, they are often targeted by catch-and-release anglers while they aggregate to spawn on natural and artificial reefs throughout the Florida Keys from March through June (Holder et al., 2020; Piczak et al., 2023). Permit do not appear to suffer from significant behavioral impairments after capture and release (Holder et al., 2020), implying little to no post-release mortality and the likely resilience of permit as a catch-and-release fishery target.
However, depredation (i.e., when a hooked fish is partially or totally consumed by a predator) is a concern for anglers, especially in recreational catch-and-release fisheries where mortality is generally assumed to be near zero (Mitchell et al., 2023). Depredation differs fundamentally from post-release mortality, which is influenced by handling stress and subsequent vulnerability to post-release predation (Raby et al., 2014). In contrast, depredation occurs during the act of angling (in both harvest and catch-and-release fisheries) and is closely tied to the occurrence of predators nearby. This distinction is important in determining how mortality is assessed in the context of catch-and-release fisheries. As such, depredation threatens the perceived sustainability of catch-and-release practices by obscuring true levels fishing-related mortality, which is assumed to be minimal when post-release mortality is near zero. From a management perspective, depredation mortality is unaccounted for yet can have substantial negative impacts on target species populations, especially in heavily fished systems. In Florida, depredation events by sharks are frequently reported by recreational anglers on both natural and artificial reef structures and vary widely across space and time, complicating efforts to quantify their impact (Casselberry et al., 2022; Klizentyte et al., 2023). Holder et al. (2020) found that depredation mortality of permit was variable but prevalent throughout the range of reef study sites in the Florida Keys, including a primary spawning area, yet was not observed on the flats.
Reef type may also mediate depredation on spawning aggregations and associated fishery dynamics. Natural and artificial reefs that differ in structural complexity, vertical relief, and spatial extent can influence fish assemblage composition, density, and biomass (Bohnsack et al., 1994; Granneman and Steele, 2015), which can scale up to influence predator abundance, including sharks (Paxton et al., 2020). Additionally, artificial reefs are primarily deployed to enhance fisheries and may therefore experience increased fishing pressure relative to nearby natural reefs (Simard et al., 2016), potentially exacerbating encounter rates between anglers and predators. Such habitat-specific differences may ultimately shape patterns of angler effort, catch rates, and depredation
at permit FSAs, which reflects variation in habitat structure, predator communities, and angler concentration.
Given the uncertainty surrounding the extent of depredation and its potential to undermine the harvest prohibition of permit during their spawning season, we aimed to evaluate recreational permit aggregation fishery activity to quantify 1) daily effort (number of boats, time spent permit-fishing), 2) daily catch per unit effort (CPUE), and 3) depredation rates in the Middle and Lower Florida Keys. We hypothesized that these variables would vary spatiotemporally, largely influenced by sitespecific environmental factors, seasonal peaks in aggregation presence (i.e., month, proximity to the full moon), and accessibility (i.e., wave height). Additionally, given the WDR SFC, we assessed post-closure impacts to investigate the extent of effort displacement across sites.
2. Study site
The Florida Keys (hereafter, the Keys) is an archipelago comprised of limestone islands that stretch in a southwesterly arc ~200 km from the southeastern tip of mainland Florida to Key West. Situated between the Gulf of Mexico to the north and the Atlantic Ocean to the south, the Keys provide a variety of marine habitats, including seagrasses and coral reefs. Ecotourism (i.e., diving) and fishing (i.e., commercial, charter) are the two most important industries in the Keys (Bhat, 2003; Gazal et al., 2022). Recreational and charter fishing for permit (Trachinotus falcatus) in the Keys represent a large part of these industries.
Marathon (24.661◦ N 80.963◦ W) is the most populous island in the Middle Keys with a population of ~10,000 (U.S. Census Bureau, 2020), with substantial additional visitors in the spring tourist season (Monroe County Tourist Development Council, 2026). There are several artificial reefs deployed off Marathon (https://myfwc.com/fishing/saltwater/artificial-reefs), which were created to provide enhanced diving and fishing. One of these is the Seven Mile Bridge Rubble (SMB), an artificial reef comprised of steel and concrete bridge spans from the Old Seven Mile Bridge (Fig. 1). SMB was deployed in 1982 and is located at a depth of 35 m and ~10 km to the south of Marathon (24.607◦ N 81.164◦ W). The second artificial reef surveyed is the Thunderbolt wreck (TBT), which is the former USS Thunderbolt, a 57-m steel Navy vessel deployed in 1986. TBT is located at a depth of 36 m and ~8 km to the southeast of Marathon (Fig. 1). Both SMB and TBT have historically hosted permit aggregations during the spawning season (March-June) and have been targeted by primarily catch-and-release anglers.
In the Lower Keys, Key West (24.555◦ N 81.780◦ W) is the most populated island with ~26,500 inhabitants (U.S. Census Bureau, 2020) and the second most popular tourist destination in the Keys (~1 million
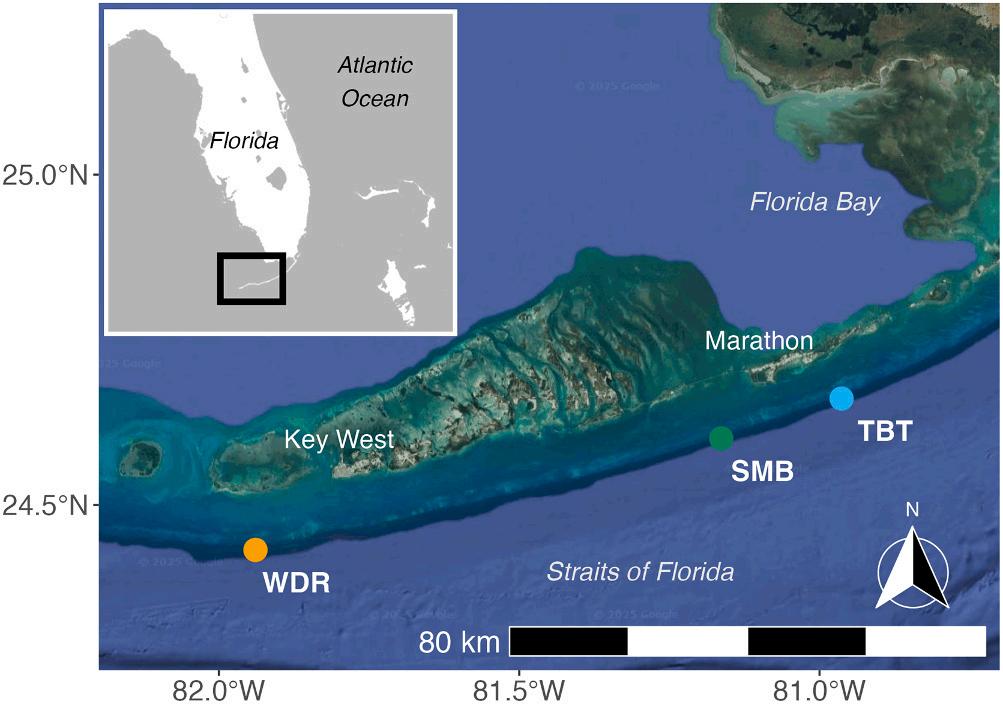
visitors annually) (Monroe County Tourist Development Council, 2026). The Western Dry Rocks (WDR) is a section of the Florida reef tract that extends off the southwestern coast of Key West (~16 km) (Fig. 1). This site is a known multi-species spawning aggregation that includes several economically important species (e.g., black grouper [Mycteroperca bonaci], gray snapper [Lutjanus griseus], mutton snapper [Lutjanus analis], permit) (Keller et al., 2020; Lindeman et al., 2000). Consequently, WDR has historically been heavily fished, with reports amongst the fishing community suggesting high rates of depredation. In response, the 1-square-mile WDR seasonal (Apr 1-Jul 31) closure prohibits fishing and was designed to encompass the spatial and temporal extent of these spawning aggregations, including permit. This site provides a unique opportunity to explore rates of depredation across varying levels of protection and fishing effort as well as changes in fishing effort with respect to the establishment of a seasonal closure.
3. Methods
3.1. Fishing effort
Observational surveys of the recreational fishery were conducted from 2019 to 2025 to characterize permit catch per unit effort (CPUE), the occurrence of depredation events, and overall fishing effort on permit aggregations across the three sites in the Middle (SMB, TBT) and Lower Keys (WDR) (Table A.1). Fishery-dependent data were collected during daylight hours (0900–1900) on the peak days surrounding the spring full moons (Mar-Jun) across sites. To describe fishing effort, we recorded the permit-fishing vessel (i.e., unique identifier including vessel registration number, name, make, size, and/or color), number of occupants per vessel, time each vessel spent permit-fishing, and quantity of vessels on site concurrently. Permit-fishing vessels were identified by gear type and angler behavior (i.e., sight-casting to permit schools or drifting with live or soft plastic crab or shrimp on a hook or jig). Permitfishing gear generally consisted of conventional spinning tackle (i.e., medium-heavy rods with braided line and fluorocarbon leader). Time spent permit-fishing concluded when vessels either left site or switched gear type (to kite-fishing, chumming, etc.). The total number of observed permit-fishing boats per day was divided by survey hours to account for variation in survey effort. The average time spent fishing by each permit-fishing boat was calculated per day.
3.2. Catch per unit effort, landing success, and depredation rate
At the onset of each permit-angling event, we recorded the time at hookup, total fight time, and the result (i.e., landed, lost, depredated). All angling events were observed from a center console vessel on site within 100 m of angling vessel. Catch per unit effort (CPUE) of permit was calculated as the number of permit angling events across the site per survey hour regardless of landing success. Landing was considered successful if permit were at least brought to the boat if not brought aboard. Confirmed depredation events were defined as when a predator either partially or entirely consumed a hooked permit and were confirmed visually by the observer or verbally by the angler (i.e., when in proximity to angling vessel to allow communication). If evidence of a bite was not observed but there were changes in fish behavior (i.e., evasive maneuvers), damage to fishing gear (i.e., abraded line due to shark skin), or observation of a predator (i.e., shark), then the angling event was categorized as a possible depredation. Angling events results that were not observed (i.e., too far from observing vessel) were excluded from analyses. Depredation rate was calculated as the number of angling events resulting in depredation divided by the total number of events.
3.3. Generalized linear models
We used generalized linear models (GLMs) to assess how recreational
fishing effort (1. daily permit-fishing boats per survey hour and 2. daily average time permit-fishing boats spent on site) varied with external factors that might affect spawning and boater access. Factors were site (SMB, TBT, WDR), years since WDR SFC establishment (1 Apr 2021), month (March, April, May, June), the proximity to the full moon (i.e., number of days until or since the full moon [peak spawning period]), and observed wave height (m). Daily observed wave height was derived from the National Weather Service Marine Forecast for the Florida Keys (https://www.weather.gov/key/marine) significant wave height (i.e., average height of the tallest one-third of waves, measured from trough to crest, occurring within in a specific time frame) and validated by onsite estimates. To assess trends in permit catchability, we used a GLM to predict daily CPUE as a function of environmental and fishing-related factors. Factors were site (SMB, TBT, WDR), month (March, April, May, June), and years since WDR SFC establishment (April 1, 2021). The fishing-related factor was the daily number of permit-fishing boats per hour.
Models were fitted with a Tweedie compound Poisson error structure (via ‘cplm’ , ‘MASS’ , ‘statmod’ , and ‘tweedie’ packages using R version 4.5.1 in RStudio [2025.05.1 +513]) (Dunn, 2022; R R Core Team, 2025; Ripley et al., 2025; Smyth et al., 2025; Zhang, 2024), which is appropriate in modeling zero-inflated continuous data (Shono, 2008; Zhang, 2013). Best predictive models were selected using the dredge function in the ‘MuMIn’ package (Bart ´ on, 2025), where models with the lowest corrected Akaike information criterion were considered the most parsimonious.
Daily depredation rate was unable to be modelled similar to CPUE due to low sample size (days where depredation occurred = 8).We therefore estimated the probability of being depredated at different aggregation sites by fitting a binomial GLM with a logit link function. The response variable was the number of depredation events weighted by the total number of angling events across the entire survey period (two-column matrix of successes/failures). Explanatory factors included site (SMB, TBT, WDR) and years since the WDR SFC establishment (1 Apr 2021). We did not include other environmental and fishing-related factors to avoid overfitting. Factor significance was evaluated with a Chi-squared likelihood ratio test.
4. Results
4.1. Fishing effort
We conducted fishery-dependent surveys during 76 days across 16 full moon periods from 2019 to 2025 (excluding 2020) (Table A.1). Overall, we observed 217 total permit-fishing vessels (n = 113, 72, and 32 boats at SMB, TBT, and WDR, respectively), which spent 273.3 h fishing for permit (n = 129.0, 95.4, and 49.1 h at SMB, TBT, and WDR, respectively) across the total survey period (Fig. A.1, A.2). The average number of occupants per vessel was 5 ± 2 standard deviation (SD) (mean = 5 ± 2, 4 ± 2, and 4 ± 1 at SMB, TBT, and WDR, respectively; p = 0.0001, ANOVA) but ranged from 1 to 9 (range: 1–9, 2–9, and 2–7 at SMB, TBT, and WDR, respectively). Post-hoc comparisons using Tukey’s HSD test found no significant difference in the number of occupants on permit-fishing vessels between TBT and other sites (TBT-SMB: p = 0.05, TBT-WDR: p = 0.08), but SMB had significantly more occupants than WDR (SMB-WDR: p = 0.0001).
We observed an average of 0.80 permit-fishing boats per hour ± 1.18 SD (mean = 1.18 ± 1.51, 1.00 ± 1.09, and 0.19 ± 0.0.30 h at SMB, TBT, and WDR, respectively; p < 0.0001, ANOVA). Over the duration of the study, we observed 1–12 permit-fishing boats on site per day, including several days with nine or more in the Middle Keys. The best predictive model of the daily number of boats per hour included site and its interaction with the year relative to the WDR SFC establishment, observed wave height, and the month (Table 1, Table A.2.). WDR had similar numbers of boats per hour through time post-SFC and consistently featured fewer boats than SMB and TBT (Fig. 2A). The relative
Table 1
Analysis of deviance table for the best predictive Tweedie GLM of the daily number of boats per hour (n = 94 survey days). Factors in bold indicate significant p-values (<0.05).
Daily no. boats per hour ~ Site x Years since SFC + Month + Wave height
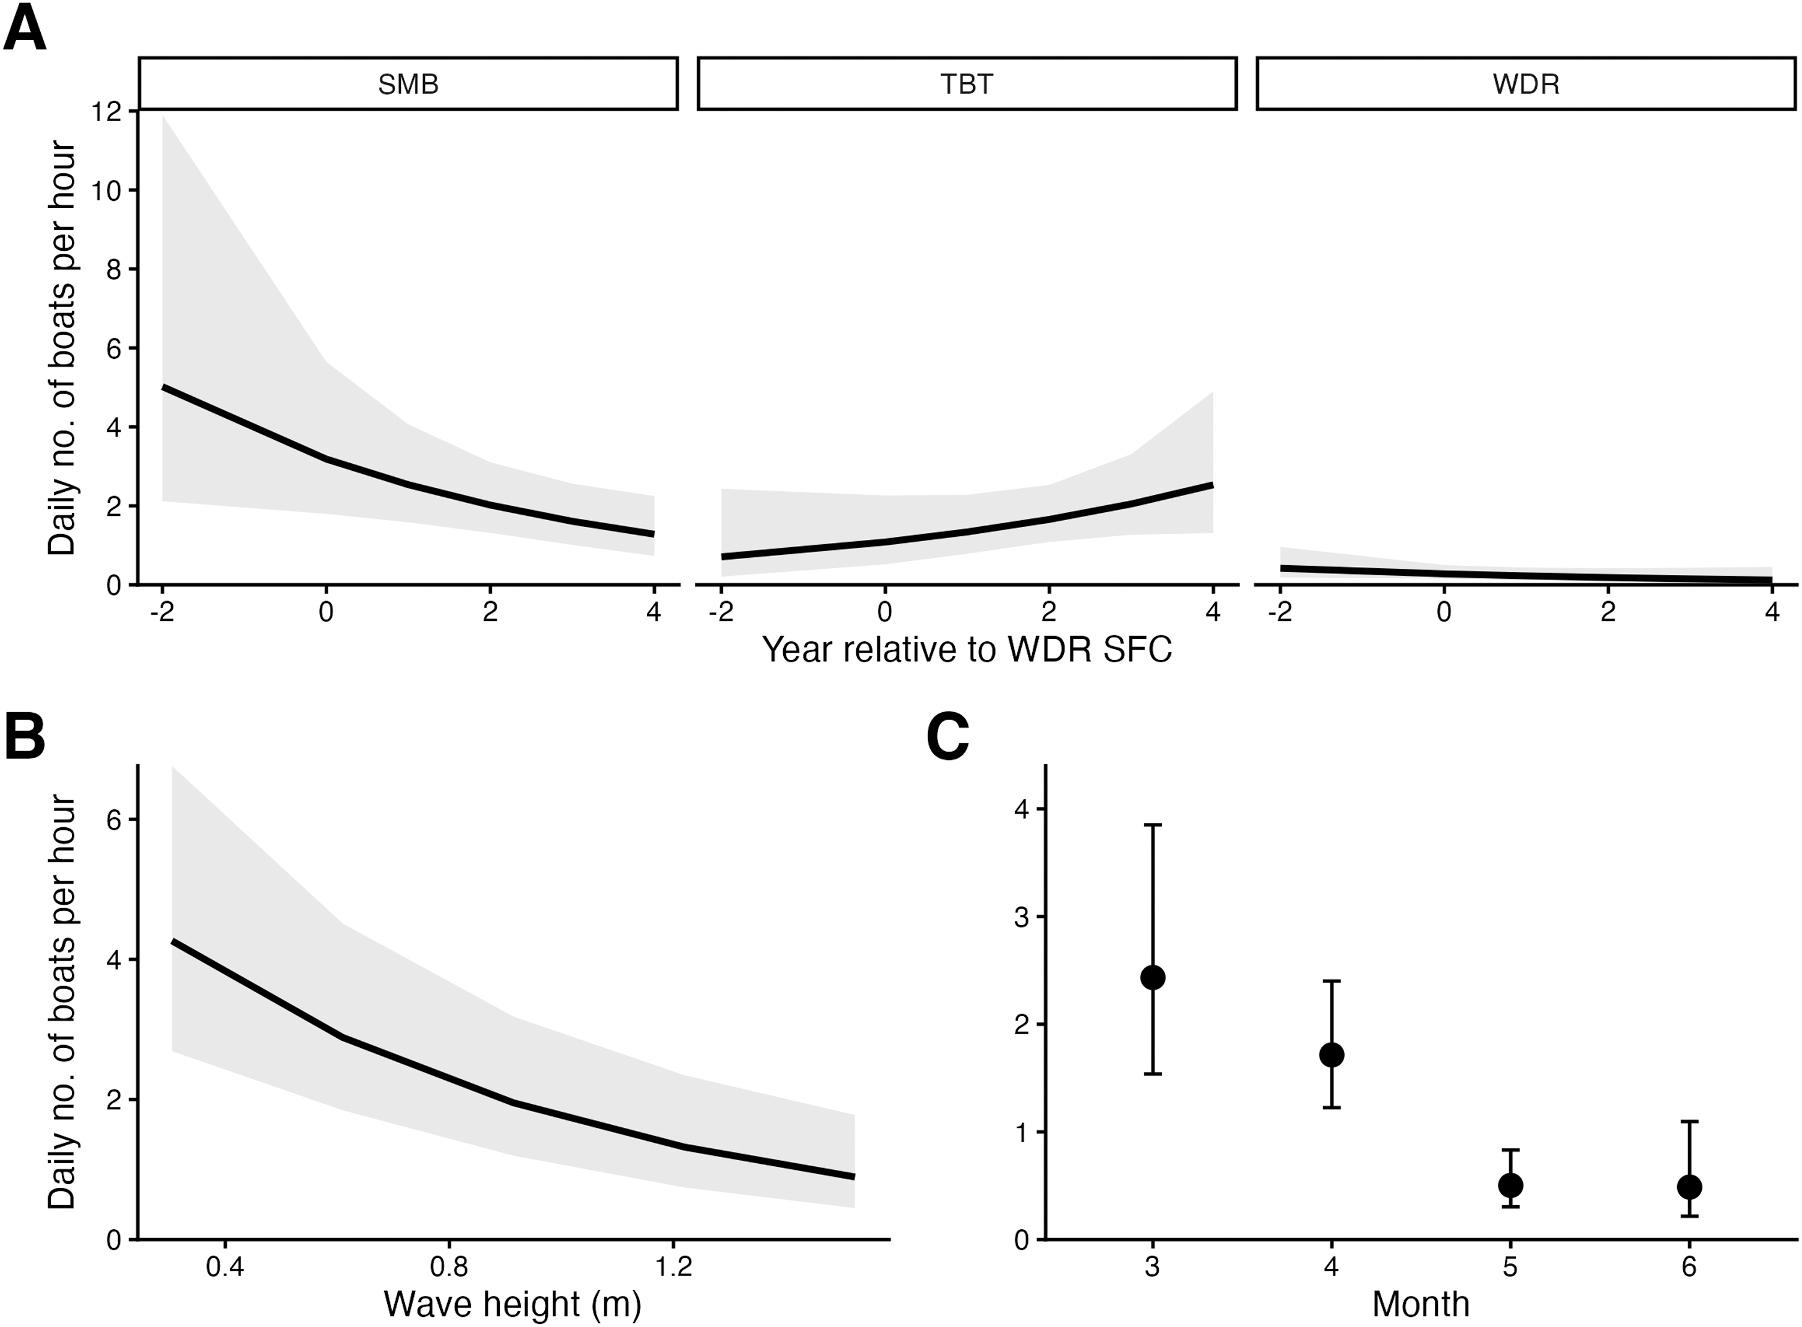
Fig. 2. Marginal estimates of the daily number of boats per hour as a function of A) site and year relative to the WDR SFC establishment (in 2021), B) observed wave height (m), and C) month (3: March, 4: April, 5: May, 6: June) for all sites combined. Line/points and shaded area/error bars indicate the predicted mean and 95 % CI, respectively. Sites SMB, TBT, and WDR refer to Seven Mile Bridge Rubble, Thunderbolt, and Western Dry Rocks, respectively. WDR during years 0–4 post SFC establishment only include the third full moon in March due to the closure (April 1-July 31).
number of boats at SMB decreased across years, while the number of boats per hour increased at TBT. There was also a significant negative effect of wave height on the number of boats on site (Fig. 2B). The greatest number of boats were observed during the March and April full
Table 2
Analysis of deviance table for the best predictive Tweedie GLM of the daily average permit-fishing time (n = 94 survey days). Factors in bold indicate significant pvalues (<0.05).
Daily mean fishing hours ~ Site x Years since SFC + Month + Full moon proximity
Factors Degrees of
moons, followed by fewer boats on site in May and June (Fig. 2C).
Each vessel spent an average of 1.26 hrs ± 1.06 SD permit-fishing (mean = 1.14 ± 1.07, 1.32 ± 1.05, and 1.53 ± 0.95 h at SMB, TBT, and WDR, respectively; p = 0.14, ANOVA). The best predictive model of the daily mean time spent permit-fishing included site and its interaction with the year relative to the WDR SFC establishment, the month and full moon proximity (Table 2, Table A.3.). Time spent fishing decreased in the Middle Keys (SMB, TBT) and increased at WDR since the closure went into effect (Fig. 3A). Permit-fishing time was greater in April and June than March and May (Fig. 3B). Proximity to the full moon had a weak positive effect on the time anglers spent permit-fishing, where anglers spent longer on site further from the peak full moon period (Fig. 3B).
4.2. Catch per unit effort
In total, 286 permit angling events were observed across 76 total surveys days in the Middle and Lower Keys (144, 83, and 59 events at SMB, TBT, and WDR, respectively), with daily totals ranging from 0 to 43. Angling events were recorded on a total of 38 % of observed days (51 %, 31 %, and 29 % at SMB, TBT, and WDR, respectively). When permit-fishing effort was present (at least one boat on site), angling events occurred on 55 % of observed fishing days (58 %, 39 %, and 75 % at SMB, TBT, and WDR, respectively).
Overall, we observed an average of 0.90 angling events per hour ± 1.37 SD (mean = 0.85 ± 1.33, 0.54 ± 0.93, and 1.69 ± 1.87 at SMB, TBT, and WDR, respectively) (Fig. A.3). The best predictive model of the daily permit catch per unit effort (CPUE) included site, month, days until/from the nearest full moon, and the observed boats per hour (Table 2, Table A.4.). CPUE peaked in March and April then began to decrease May through June (Fig. 4A), and CPUE decreased as the number days since or until the peak full moon increased (Fig. 4B). CPUE varied by site, with the highest observed at WDR followed by TBT and SMB, which were comparable (Fig. 4C).
4.3. Landing success and depredation rate
The results of 11 angling events were not observed and were thus excluded from landing success and depredation analyses. Of the observed angling events, permit were landed 70 % of the time. The highest probability of landing success was observed in the Middle Keys (SMB: 67.1 %, 95 % CI: 57.9–75.1 %; TBT: 70.8 %, 95 % CI: 56.6–81.9 %), and the lowest was observed the Lower Keys at WDR (46.6 %, 95 % CI: 28.0–66.2 %). The observed angling events that were not landed (n = 87 of 286; 30.4 %) included one confirmed depredation (1 % of permit not landed), which occurred at TBT, and 28 possible depredations (32 % of permit not landed: 12 %, 15 %, and 77 % at SMB, TBT, and WDR, respectively). While the overall observed depredation rate (including possible depredation events) was 10.1 %, the estimated probability of depredation varied significantly by site (Table 4) (Fig. A.4). Most days (73 %) did not have any possible or confirmed depredation events when permit were caught (93 % and 62 % of days at SMB and TBT, respectively). However, only 43 % of days when permit
Table 3
Analysis
were caught at WDR occurred without depredation. The highest probability of depredation was observed at WDR (41.5 %, 95 % CI: 24.7–60.5 %), followed by TBT (6.6 %, 95 % CI: 2.0–2.0 %), and the lowest was observed at SMB (3.1 %, 95 % CI: 1.1–8.5 %) (Fig. 5). At most, we observed five possible depredation events in a single survey day at WDR in March 2021 (followed by four events observed on three days at WDR and only one day at SMB). Contrary to landing success, depredation probability increased in the years post-WDR SFC across sites (Fig. 5).
5. Discussion
5.1. Spatiotemporal dynamics of fishing effort
Recreational fishing effort for permit across sites and years demonstrated clear spatial and temporal patterns, supporting our hypothesis that accessibility, location, and spawning seasonality influence angler behavior. Not surprisingly, wave height had a large effect on the number of boats fishing, with rougher seas (i.e., 1.2–1.5 m) inhibiting recreational vessels from going offshore to target permit. Weather and wave height have been demonstrated as major factors in determining the quantity and distribution of recreational anglers and boaters at offshore locations, especially for small vessels (i.e., <10 m) (Cabral et al., 2017; Kendall et al., 2021). However, wave height did not affect the time spent permit-fishing, implying that once anglers make the effort to travel to the offshore fishing site, they are likely to stay until they catch permit.
March and April are typically characterized by poorer weather and subsequently rougher seas, but aggregating permit occurrence across these sites is generally highest during these months (Brownscombe et al., 2023, 2020, 2019; Robichaud et al., in review). Based on patterns of permit-fishing effort, which are highest during these months, anglers are likely responding to variation in permit availability. Communication with anglers has indicated that this is the case, but disseminating information regarding permit angling success via social media and through personal contacts may also attract greater effort. They may also be responding to higher CPUE during this time. The number of anglers on site and time spent permit-fishing drops off in May, likely due to the increased effort in other recreational fisheries (e.g., grouper, mutton snapper) in conjunction with reduced permit CPUE at aggregation sites. However, time spent permit-fishing increased again in June, potentially reflecting improved fishing conditions (i.e., calmer seas, reduced number of permit-anglers on site) and/or potentially a shift back from grouper and snapper fishing effort, which sees a surge at the beginning of May during the season opener.
Peak aggregating behavior occurs in the days surrounding the full moon, most notably on natural reefs like WDR (Brownscombe et al., 2023), which is reflected in the time spent permit-fishing as well as CPUE. The amount of time that anglers were willing to dedicate to permit-fishing increased while CPUE decreased as days from/until the peak full moon increased, which is likely due to lower aggregation abundance and residency during the crescent and new moon lunar phases (Robichaud et al., in review), gear avoidance resulting from extended periods of pressure, and the subsequent effort needed to land a
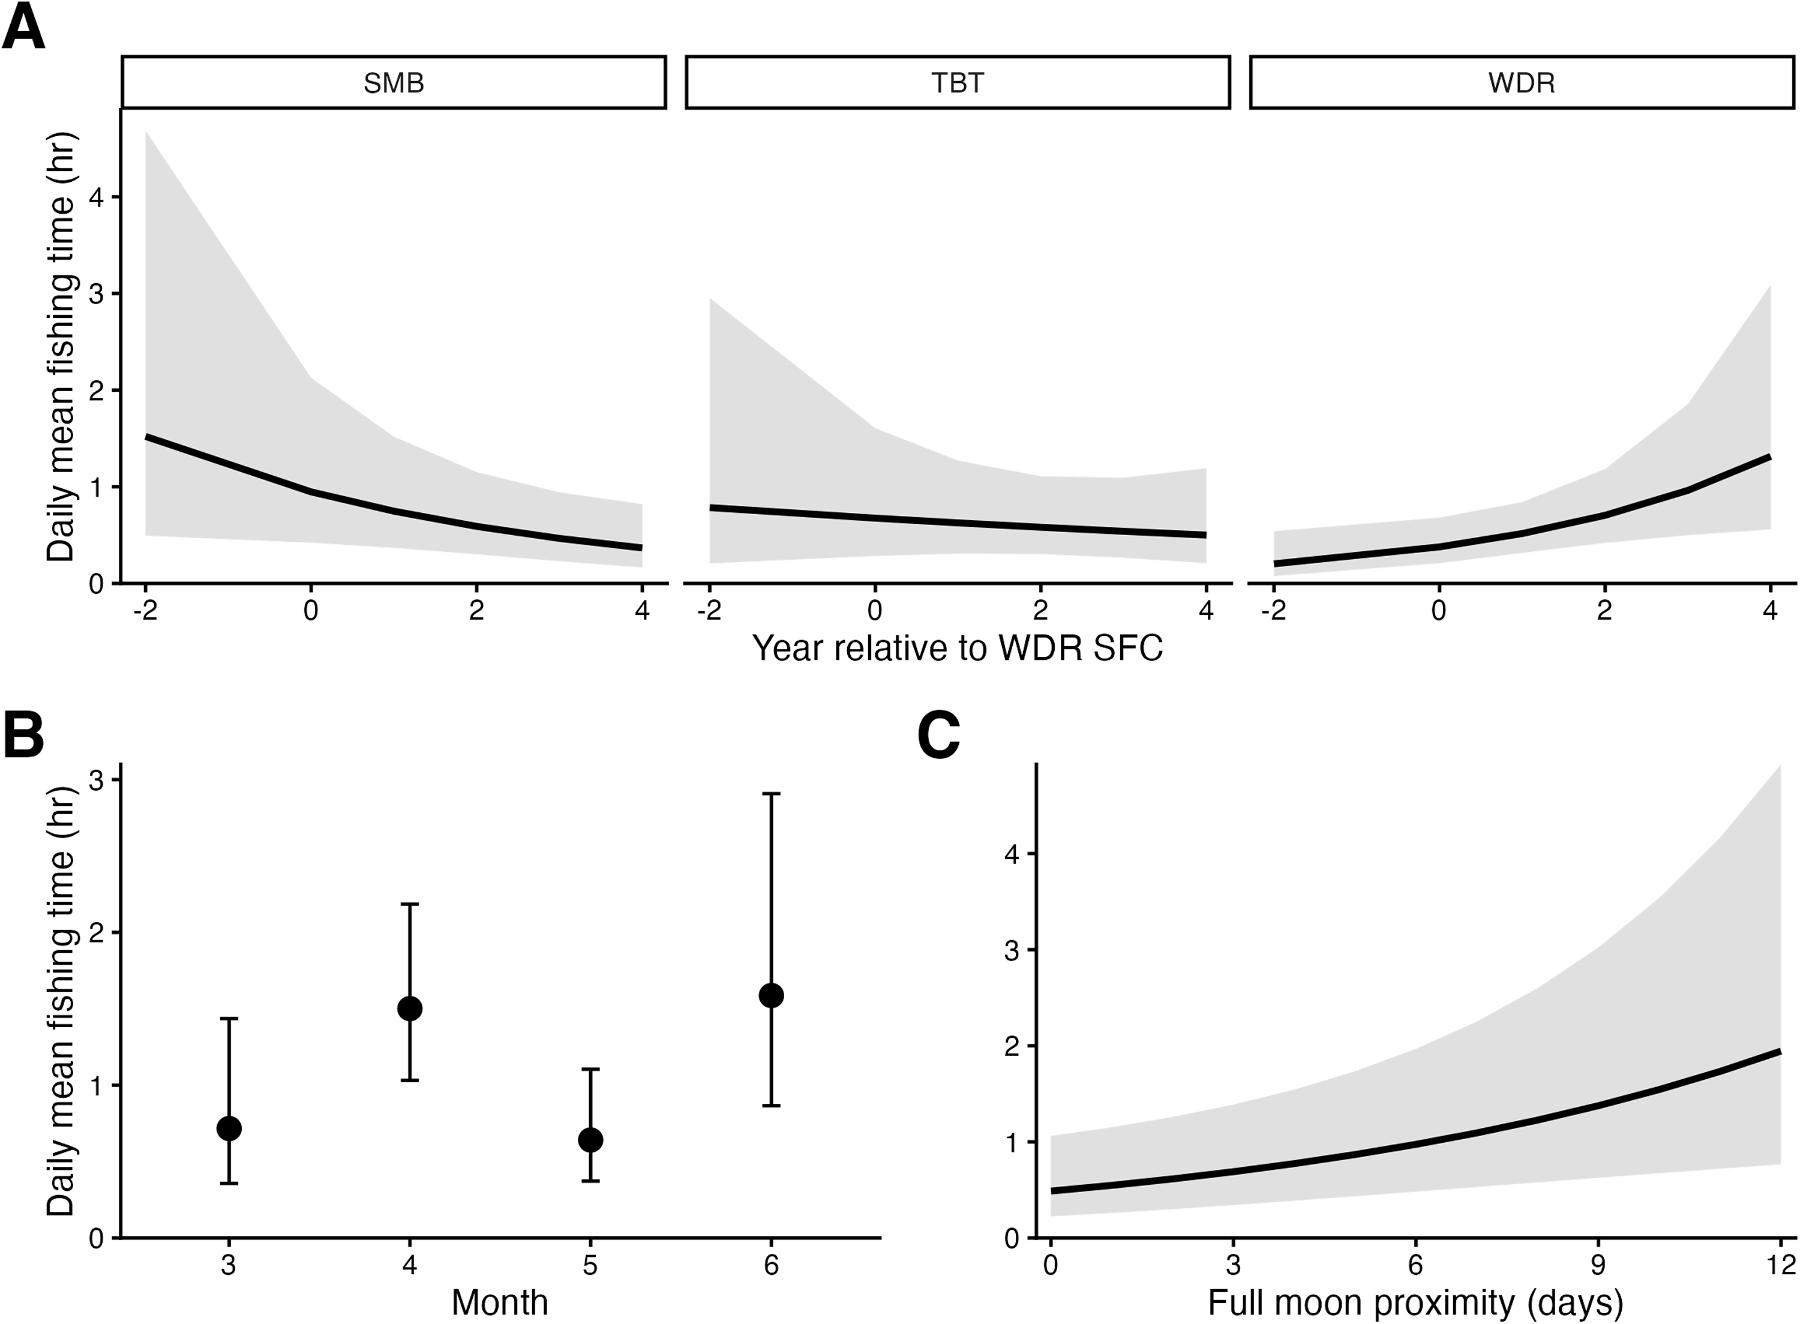
Fig. 3. Marginal estimates of the average time spent permit-fishing as a function of A) site and year relative to the WDR SFC establishment (in 2021), B) month (3: March, 4: April, 5: May, 6: June) and C) proximity to the full moon (days) for all sites combined. Points/line and error bars/shaded areas indicate the predicted mean and 95 % CI, respectively.
permit.
The effects of site and its interaction with year relative to the WDR SFC significantly impacted the number of permit-fishing boats on site and time spent fishing, which was especially apparent after the WDR SFC went into effect April 1, 2021, after which the number of boats decreased and fishing time increased at WDR. In fact, we did not observe any permit-fishing boats at WDR during pre-closure March in 2023 and only a few in 2024. Reduced access due to the SFC has likely caused this decrease in boats because open-access and permit aggregations only overlap during the March full moon. Adding to this brief temporal window is generally poor weather during this time. The few boats observed at WDR post-SFC spent longer on site, potentially taking advantage of the short duration of open access. It is worth noting that March at WDR is outside of the harvest prohibition, so we also observed anglers stay on site until they reached their bag limit of one permit per harvester and no more than two permit per vessel.
After the SFC was established in 2021, the number of boats on site decreased at SMB, while at TBT the number of boats increased. Time spent permit-fishing decreased across both Middle Keys sites, however. Displacement of fishing effort from the Lower Keys to the Middle Keys in response to the WDR SFC should have resulted in overall increased effort in the Middle Keys. This trend, however, occurred only with respect to boat numbers at TBT and these increases might be more easily explained by anglers moving from SMB or other nearby sites to TBT rather than Lower Keys effort shifting north. Increases in TBT boat effort may also be due to increased tourism and recreational angling (i.e., in response to COVID-19) (Midway et al., 2021; Monroe County Tourist Development Council, 2026) or financial or logistical constraints, such as attempts to reduce fuel costs and travel time. It is not uncommon for anglers to travel between SMB and TBT within the same fishing day (~30–45 min
travel time), so if fishing is poor at one site anglers will often depart for another nearby site. While CPUE between the Middle Keys sites (SMB, TBT) was similar, depredation probability has increased at SMB in recent years, which may explain the shift in angler effort to TBT. Indeed, both travel distance and fuel costs have been shown to influence recreational angler behavior and site selection, which likely inhibits Lower Keys permit-fishing effort from shifting to the Middle Keys given the distance between these sites (>80 km) (Cowie and Ridgway, 2023; Hunt, 2005). Nonetheless, while the SFC appears to successfully limit overall effort at WDR, it is unlikely that angling pressure has been redistributed to the Middle Keys aggregations, but rather other factors have driven these changes over recent years that require further investigation (i.e., shifts to other fisheries/nearby sites).
5.2. Lunar and site-level effects on catch per unit effort
Permit CPUE by the recreational fishers varied significantly in relation to the month and the proximity to the nearest full moon. CPUE was highest during the March through May full moon periods and decreased by June. Whereas, the proximity to nearest full moon positively affected CPUE, which then decreased as the moon waned. These trends are consistent with previous telemetry studies that have identified permit residency and habitat-use on natural and artificial reefs relative to month and lunar phase in the Keys (Brownscombe et al., 2023, 2020). Permit occurrence at offshore aggregations peaks during the full moon phase, most notably during March and April (Robichaud et al., in review).
Site-level differences in permit CPUE were also evident. Specifically, the natural reef aggregation site (WDR in the Lower Keys) demonstrated higher CPUE than Middle Keys artificial reef sites (SMB, TBT). The
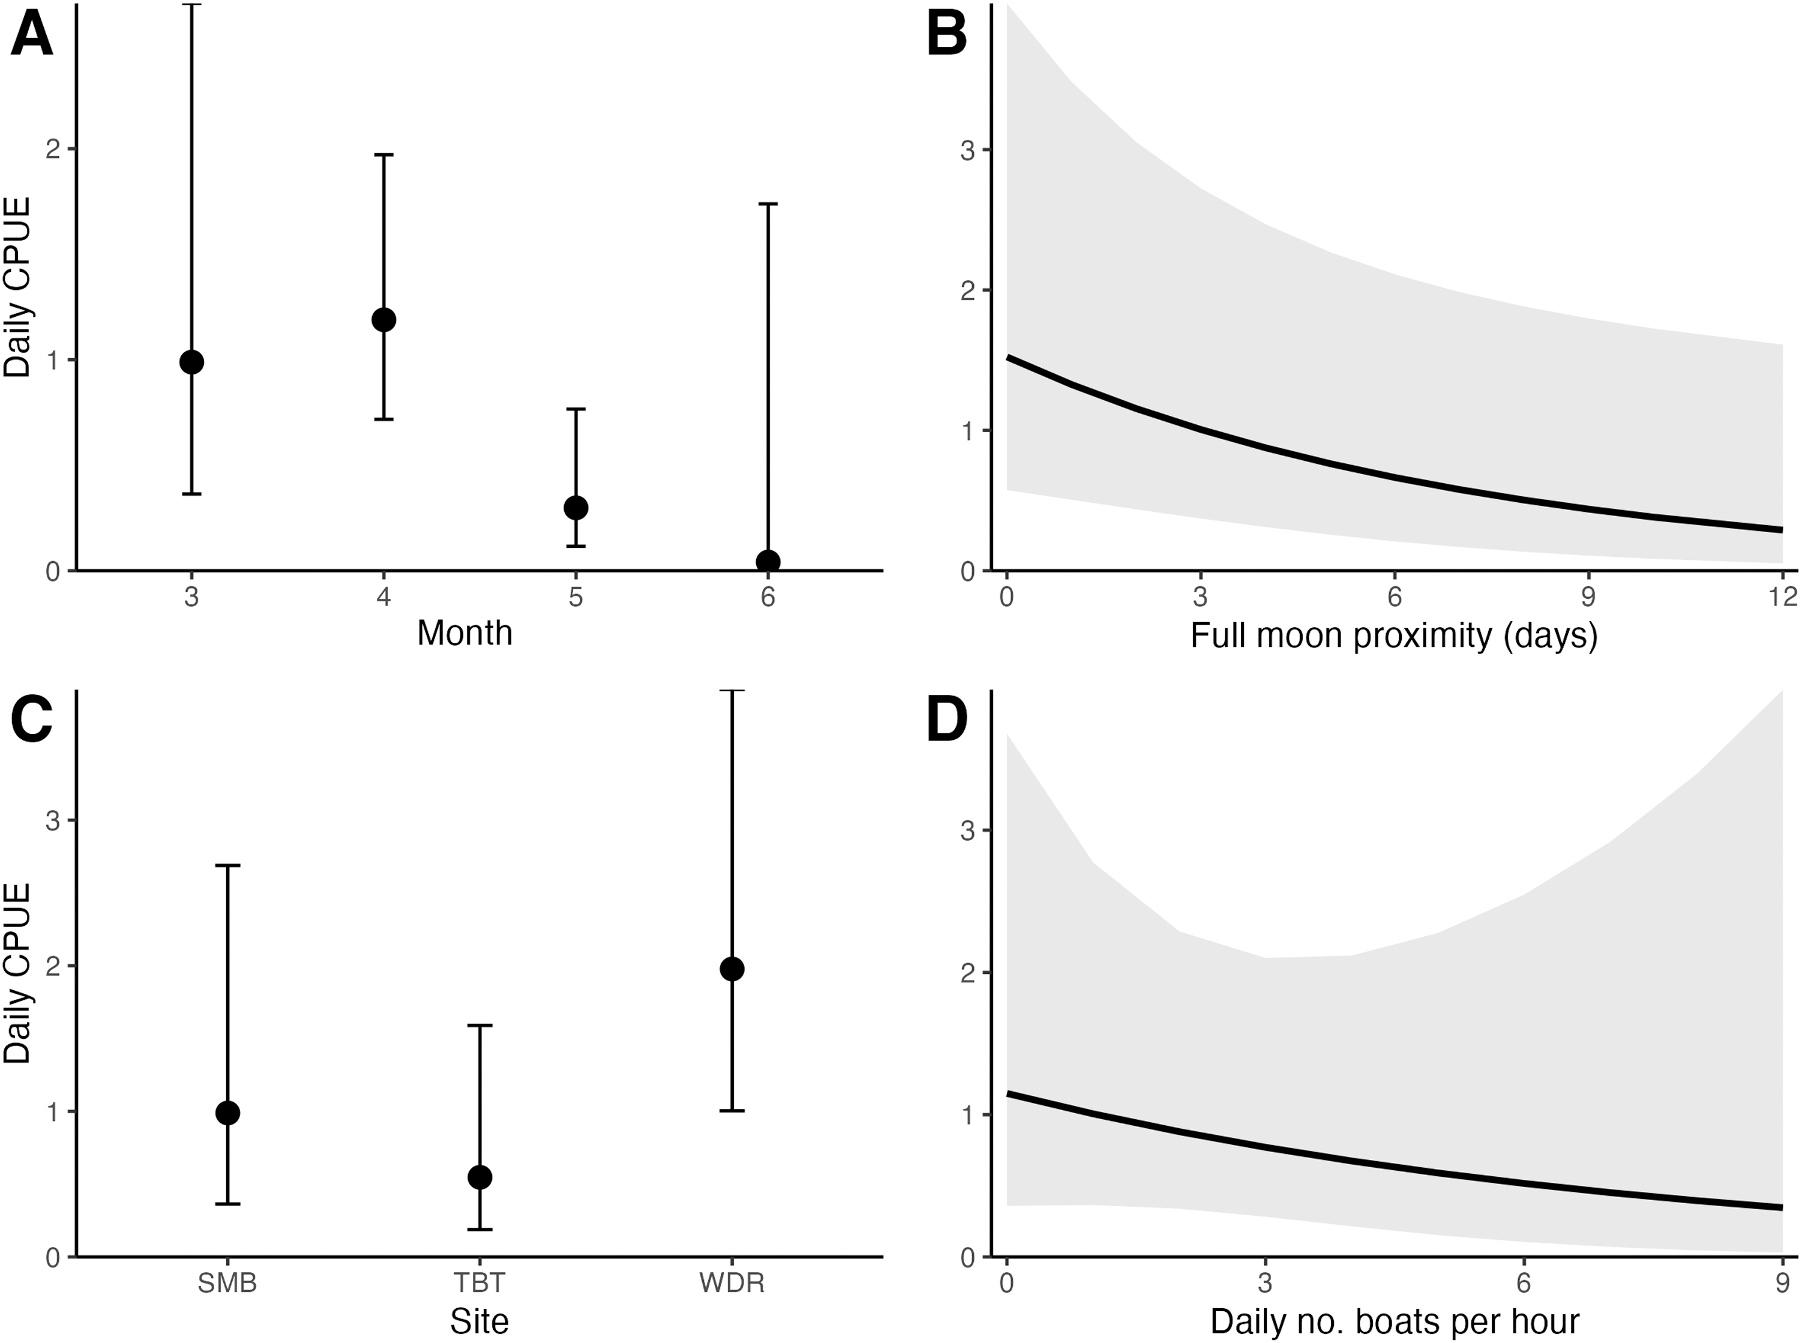
Fig. 4. Marginal estimates of daily permit catch per unit effort (CPUE) as a function of A) month (3: March, 4: April, 5: May, 6: June), B) full moon proximity (days until or since the nearest peak full moon), C) site, and D) observed daily number of boats per hour. Daily CPUE is calculated as the number of angling events per hour. Sites SMB, TBT, and WDR refer to Seven Mile Bridge Rubble, Thunderbolt, and Western Dry Rocks, respectively. Line/points and shaded area/error bars indicate the predicted mean and 95 % CI, respectively.
Table 4
Analysis of deviance table for the binomial GLM of the probability of depredation (n = 35 survey days). Factors in bold indicate significant p-values (<0.05).
Depredation probability ~ Site x Years since SFC
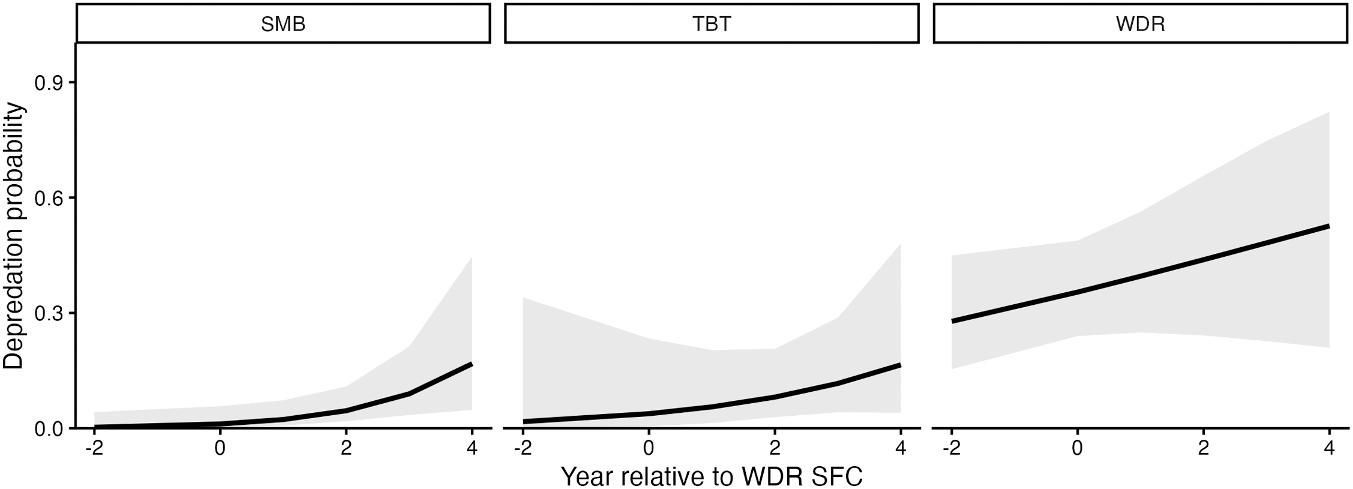
Fig. 5. Marginal estimates of permit depredation probability as a function of site and year relative to the WDR SFC establishment (in 2021). Sites SMB, TBT, and WDR refer to Seven Mile Bridge Rubble, Thunderbolt, and Western Dry Rocks, respectively. Points and error bars indicate the predicted mean and 95 % CI, respectively.
catchability of fish is determined by a variety of factors, including the fishing gear being used, the environment, the probability of encounter,
individual fish state and overall abundance (Lennox et al., 2017; Robinson et al., 2015; Stoner, 2004). As such, these site-level trends may be due to natural differences in permit abundance/behavior as well as environmental variables (i.e., water visibility, depth, habitat structure), which highlights the characteristics of Lower versus Middle Keys and natural versus artificial reefs. Given this fishery is largely targeted by sight-casting to permit at the surface, the ability of the angler to see the permit school and the ability of the permit to locate the bait will both contribute to catchability. This sensory match or mismatch is also a function of water quality, which is likely to vary by tide, currents, and primary productivity. Lastly, the individual state of permit across sites may vary, especially since this fishery targets spawning/prespawning aggregations, which may affect metabolic state and subsequent foraging behavior (Villegas-Ríos et al., 2014). Therefore, more work needs to be done to assess the environmental and habitat-related cues that affect both permit aggregation occurrence and catchability.
There was a weak inverse relationship between fishing effort and CPUE, which may be a function of behavioral changes of permit to angling pressure (e.g., wariness or relocation) and angler saturation/ competition for space at the aggregation site (i.e., multiple anglers targeting the same limited number of aggregating individuals). Although catch rates are often assumed to be proportionally reflect to fish abundance, studies have shown that CPUE can remain high (or low) even as fish abundance increases, which is known as catch rate hyperstability (or hyperdepletion) (Harley et al., 2001; Mosley et al., 2022; Sadovy et al., 2005). This has also been documented in aggregation fishing (Dassow et al., 2020; Erisman et al., 2011), where the interaction between fish behavior and anglers can obscure true population trends. This underscores that catchability is likely not only influenced by permit aggregation abundance (demonstrated by seasonal fluctuations in CPUE) but also by the number of anglers, indicating the density-dependence of effort (Kuriyama et al., 2019). It is also worth noting that angling events are non-random (i.e., multiple hookups from the same vessel/aggregation), which may influence daily CPUE. As such, it is important to consider fishing density when assessing catch dynamics, particularly during spawning periods when fish aggregate in high numbers.
5.3. Spatiotemporal dynamics of landing success and depredation risk
Landing success was comparable across the Middle Keys aggregations (SMB, TBT) and slightly decreased at WDR. While several variables, including individual angler behavior (e.g., skill, experience) and individual fish behavior (e.g., size, manueverability), likely contribute to landing success, it is also inherently correlated with depredation. Though depredation was infrequent when all sites are considered (and highly variable overall), it was generally higher in the Lower Keys at WDR, where we observed at least one depredation event on nearly 60 % of days on site despite observing fewer angling events. Additionally, once sharks were observed and depredation had occurred, landing success decreased markedly. The importance of site was evident considering site alone explained 34 % of the variation in depredation probability. Observed depredation rates were comparable to what Holder et al. (2020) documented across similar areas in the Florida Keys (~ 10–45 % across Atlantic structures), and notably higher than their reported 0 % depredation rate on the flats. Additionally, CPUE at WDR was higher relative to the Middle Keys sites (SMB, TBT), which underscores the fishery-dependent factors that likely contribute to depredation occurrence. In the context of the WDR SFC, observations of higher depredation at WDR do provide evidence that the closure will in fact mitigate this unrepresented source of mortality.
When depredation did occur, particularly in the Middle Keys (SMB, TBT), it occurred in March and April and was largely attributed to great hammerhead (Sphyrna mokarran) and bull (Carcharhinus leucas) sharks, which were sighted during surveys. Both great hammerhead and bull sharks have demonstrated increased site-specific overlap with
springtime spawning/prespawning aggregations of Atlantic tarpon (Megalops atlanticus) and permit in the Keys (Griffin et al., 2022). Caribbean reef sharks (Carcharhinus perezi) were the primary depredating species at WDR and were only observed at WDR during our study. While there is limited information on their space use in the Keys, Caribbean reef sharks exhibit high site-fidelity in other reef systems (Bond et al., 2012), which likely explains the persistence of depredation events throughout the spawning season at WDR.
The establishment of the WDR SFC (1 April 2021) affected both landing success and depredation probability, where in the years postSFC, depredation increased, particularly at WDR. As a result of the SFC, all fishing post-SFC at WDR occurs during the March full moon, which is corroborated by the overall decrease in permit-fishing effort at WDR. However, this increase in depredation probability may suggest that the March full moon is a high-risk time for negative shark-angler interactions due to increased co-occurrence of large migratory (e.g., great hammerhead, bull) and residential sharks (e.g., Caribbean reef). The variability in the occurrence and species assemblage of predators at aggregations sites, most notably at WDR, which is also a multi-species fish spawning site, should ultimately contribute to overall depredation risk. Given the high variability in depredation, the most influential drivers are still unclear, but are likely associated with a combination of habitat characteristics (e.g., depth, visibility) and the behaviors of the angler, fish, and predator.
5.4. Limitations
This study relied on fishery-dependent observations, which, while valuable for understanding angler behavior and fishing techniques, can be subject to sampling bias (e.g., observer visibility, reporting accuracy). However, unlike many fisheries-dependent data, this study relied exclusively on direct observation of fishing activities. Also, it is difficult to monitor co-occurring permit aggregations across a large spatial scale. For instance, although we were able to monitor both Middle Keys sites within the same day, the Lower Keys site WDR is too far to travel to within the same day; therefore, shifts in effort may have been underestimated. As such, expanding the scale of aggregation fishery monitoring would be difficult or near impossible without additional survey teams or reports from collaborating anglers. Notably, gathering data from fishers is not necessarily unattainable based on our experience but logistically quite difficult to organize. In the future, a standardized reporting system could be developed to enhance the spatial and temporal scope of our data collection, which may reveal interesting patterns in the occurrence of permit aggregations, catchability, and depredation dynamics.
Additionally, our ability to classify angling and subsequent depredation events were largely limited by our ability to communicate with the other anglers and observe sharks during the angling event, which may underestimate depredation rate. As alluded to previously, anglers are receptive to sharing depredation and catch data, but the number of anglers and boats fishing simultaneously often makes it logistically difficult to validate every angling event. It is also feasible that events classified as possible depredations may have been misclassified (i.e., abraded line due to structure versus shark), as it is unlikely to retrieve evidence of permit with bite wounds. Incorporating fishery-independent estimates of depredation in addition to line-mounted camera angling surveys would provide a more accurate estimation of depredation risk across the spatiotemporal factors of interest (Mitchell et al., 2019). Additionally, the relatively low number of survey days with observed permit captures (n = 35) constrained our ability to detect finer-scale interactions, particularly regarding depredation rate.
5.5. Conclusion
This study provides a novel spatiotemporal assessment of recreational fishing effort, catch rates, and depredation at prominent spawning
aggregations of permit (Trachinotus falcatus) in the Middle and Lower Keys, with particular emphasis on the effects of the seasonal fishing closure at Western Dry Rocks (WDR SFC). By conducting fisherydependent surveys across multiple full moon periods and years at three popular aggregation sites, we were able to gain insights into the dynamic nature of this economically important catch-and-release fishery.
Our findings have several implications for the management of permit and other aggregating species targeted in catch-and-release fisheries. First, our findings support incorporating effort-related covariates (e.g., angler density) into monitoring and enforcement strategies to improve adaptive management of recreational aggregational fisheries. Catchand-release fisheries do not generate the data necessary for traditional stock assessments, underscoring the importance of continued monitoring of effort and associated mortality, which can be achieved through integration of observational surveys in conjunction with recreational fisher surveys (Adams and Cooke, 2015). Additionally, SFCs can directly reduce fishing effort at vulnerable sites like WDR (i.e., multi-species spawning aggregation with high predator abundance), but displacement of fishing effort may be harder to quantify if shifts are to other fisheries (e.g., mutton snapper) or unmonitored sites (e.g., Eyeglass Bar: natural reef site ~16 km east of Western Dry Rocks). This highlights the need for holistic spatial planning that considers not only site-level protections but also the broader landscape of fishing activity. Regarding permit, fisheries management varies across jurisdictions throughout their range (The Bahamas, Belize; Adams and Cooke, 2015), including bag limits, gear restrictions (i.e., gillnet prohibition), or catch-and-release only practices. The implementation of SFCs that encompass vulnerable permit spawning aggregations may therefore be a useful tool to further advance conservation goals.
Despite limited observations, the elevated depredation rate at WDR suggests that depredation mortality could inhibit the benefits of the SFC, but reduced effort since its establishment has mitigated this negative consequence with respect to permit. Should the goal be to mitigate shark-angler conflict and its potential detrimental impacts to aggregating permit at WDR, the SFC should encompass the full duration of the spawning season by expanding to March. Related to the possibility that fishing effort is displaced by the SFC, it is also possible that predator occurrence is also shifted to the areas being fished. For example, recreational mutton snapper aggregation fishing is common along the SFC border, just over a kilometer from the core of the permit aggregation site, where up to 50 fishing vessels have been observed fishing for multiple days along the border. This begs the question: what level of mortality is occurring in the mutton snapper fishery?
Depredation is of growing concern in the Florida Keys and has subsequently garnered a negative perception of sharks in conjunction with conflicting ideas on how to best mitigate shark-angler conflict (Casselberry et al., 2022; Klizentyte et al., 2023; McCallister et al., 2025). Future work should prioritize fishery-independent monitoring and fine-scale assessments of shark abundance and behavior, particularly during aggregation events. Understanding predator-prey dynamics during these critical reproductive periods is key to ensuring that management strategies truly protect the spawning stock biomass of economically important species like permit.
Funding
This work was supported by the Florida Fish and Wildlife Conservation Commission, the Bonefish & Tarpon Trust, and Florida International University College of Arts, Sciences, & Education.
CRediT authorship contribution statement
Clementi Gina M: Writing – review & editing, Writing – original draft, Visualization, Project administration, Investigation, Formal analysis, Data curation, Conceptualization. Binder Benjamin B: Writing –
review & editing, Project administration, Methodology, Investigation, Funding acquisition, Conceptualization. Gastrich Kirk R: Writing –review & editing, Project administration, Methodology, Investigation, Funding acquisition, Conceptualization. Heithaus Michael R: Writing –review & editing, Supervision, Funding acquisition, Conceptualization. Andrew Natter: Writing – review & editing, Investigation. Nicholas Tucker: Writing – review & editing, Investigation. Boswell Kevin M: Writing – review & editing, Supervision, Funding acquisition, Conceptualization.
Declaration of Competing Interest
The authors declare that they have no known competing financial interests or personal relationships that could have appeared to influence the work reported in this paper.
Acknowledgments
We thank the many individuals who provided invaluable field support during this study, including Monica Castillo, Jessica Robichaud, Luc LaRochelle, Alyssa Andres, Mark Barton, Mark Bond, Jake Brownscombe, Grace Casselberry, Steve Cooke, Michelle Debbaudt, Joe Dello Russo, David Kochan, Bryan Legare, Haley Glasmann, Luke Griffin, Will Sample, Chase Schaffhauser, and Allison White. We also acknowledge the logistical and financial support provided by the International SeaKeepers Society, especially Tony Gilbert, Aubri Keith, Till Koerber, and Katie Sheahan, and by Bonefish and Tarpon Trust, with special thanks to Aaron Adams and Ross Boucek. This is contribution # 2117 from the Institute of Environment at Florida International University.
Appendix A. Supporting information
Supplementary data associated with this article can be found in the online version at doi:10.1016/j.fishres.2026.107685
Data availability
Data will be made available on request.
References
Adams, A.J., Cooke, S.J., 2015. Advancing the science and management of flats fisheries for bonefish, tarpon, and permit. Environ. Biol. FISHES 98, 2123–2131. https://doi. org/10.1007/s10641-015-0446-9
Bart ´ on, K., 2025. Package “MuMIn.” Version 1.48.11. Available at: 〈https://cran.r-pr oject.org/package=MuMIn〉
Bhat, M.G., 2003. Application of non-market valuation to the Florida Keys marine reserve management. J. Environ. Manag. 67, 315–325. https://doi.org/10.1016/ S0301-4797(02)00207-4
Bohnsack, J.A., Harper, D.E., McClellan, D.B., Hulsbeck, M., 1994. Effects of reef size on colonization and assemblage structure of fishes at artificial reefs off Southeastern Florida. U. S. A. Bull. Mar. Sci. 55, 796–823
Bond, M.E., Babcock, E.A., Pikitch, E.K., Abercrombie, D.L., Lamb, N.F., Chapman, D.D., 2012. Reef sharks exhibit site-fidelity and higher relative abundance in marine reserves on the Mesoamerican Barrier reef. PLoS One 7, 1–14. https://doi.org/ 10.1371/journal.pone.0032983
Brownscombe, J.W., Adams, A.J., Young, N., Griffin, L.P., Holder, P.E., Hunt, J., Acosta, A., Morley, D., Boucek, R., Cooke, S.J., Danylchuk, A.J., 2019. Bridging the knowledge-action gap: a case of research rapidly impacting recreational fisheries policy. Mar. Policy 104, 210–215. https://doi.org/10.1016/j.marpol.2019.02.021
Brownscombe, J.W., Griffin, L.P., Morley, D., Acosta, A., Hunt, J., Lowerre-Barbieri, S.K., Crossin, G.T., Iverson, S.J., Boucek, R., Adams, A.J., Cooke, S.J., Danylchuk, A.J., 2020. Seasonal occupancy and connectivity amongst nearshore flats and reef habitats by permit Trachinotus falcatus: considerations for fisheries management. J. Fish. Biol. 96, 469–479. https://doi.org/10.1111/jfb.14227
Brownscombe, J.W., Griffin, L.P., Morley, D., Acosta, A., Boucek, R., Adams, A.J., Danylchuk, A.J., Cooke, S.J., 2023. Spatial-temporal patterns of Permit (Trachinotus falcatus) habitat residency in the Florida Keys, USA. Environ. Biol. Fishes 106, 419–431. https://doi.org/10.1007/s10641-022-01332-7
Cabral, R.B., Gaines, S.D., Johnson, B.A., Bell, T.W., White, C., 2017. Drivers of redistribution of fishing and non-fishing effort after the implementation of a marine protected area network. Ecol. Appl. 27, 416–428. https://doi.org/10.1002/ eap.1446
Casselberry, G.A., Markowitz, E.M., Alves, K., Dello Russo, J., Skomal, G.B., Danylchuk, A.J., 2022. When fishing bites: understanding angler responses to shark depredation. Fish. Res. 246, 106174. https://doi.org/10.1016/j. fishres.2021.106174
Cowie, E.D., Ridgway, M.S., 2023. Angling party persistence and visitation in a recreational Lake Trout fishery: Relative influence of travel distance and fuel costs. N. Am. J. Fish. Manag. 43, 1725–1734. https://doi.org/10.1002/nafm.10949
Crabtree, R.E., Hood, P.B., Snodgrass, D., 2002. Age, growth, and reproduction of permit (Trachinotus falcatus) in Florida waters. Fish. Bull. 100, 26–34
Daly, R., Daly, C.A.K., Bennett, R.H., Cowley, P.D., Pereira, M.A.M., Filmalter, J.D., 2018. Quantifying the largest aggregation of giant trevally Caranx ignobilis (Carangidae) on record: implications for management. Afr. J. Mar. Sci. 40, 315–321. https://doi.org/10.2989/1814232X.2018.1496950
Dassow, C.J., Ross, A.J., Jensen, O.P., Sass, G.G., van Poorten, B.T., Solomon, C.T., Jones, S.E., 2020. Experimental demonstration of catch hyperstability from habitat aggregation, not effort sorting, in a recreational fishery. Can. J. Fish. Aquat. Sci. 77, 762–769. https://doi.org/10.1139/cjfas-2019-0245
De Mitcheson, Y.S., 2016. Mainstreaming fish spawning aggregations into fishery management calls for a precautionary approach. Bioscience 66, 295–306. https:// doi.org/10.1093/biosci/biw013
Domeier, M.L., Colin, P.L., 1997. Tropical reef fish spawning aggregations: defined and reviewed. Bull. Mar. Sci. 60, 698–726
Dunn, P.K., 2022. Package “tweedie.” Version 2.3.5. Available at: 〈https://cran.r-project. org/package=tweedie〉
Erisman, B.E., Allen, L.G., Claisse, J.T., Pondella, D.J., Miller, E.F., Murray, J.H., 2011. The illusion of plenty: hyperstability masks collapses in two recreational fisheries that target fish spawning aggregations. Can. J. Fish. Aquat. Sci. 68, 1705–1716. https://doi.org/10.1139/f2011-090
Erisman, B.E., Grüss, A., Mascarenas-Osorio, I., Lícon-Gonzalez, H., Johnson, A.F., LopezSag´ astegui, C., 2020. Balancing conservation and utilization in spawning aggregation fisheries: a trade-off analysis of an overexploited marine fish. ICES J. Mar. Sci. 77, 148–161. https://doi.org/10.1093/icesjms/fsz195
Fedler, T., 2013. Economic impact of the Florida Keys flats fishery. Rep. Bone Tarpon Trust FL 1–25
Gazal, K., Andrew, R., Burns, R., 2022. Economic contributions of visitor spending in ocean recreation in the Florida Keys National Marine Sanctuary. Water 14 (198). https://doi.org/10.3390/w14020198
Graham, R.T., Castellanos, D.W., 2005. Courtship and spawning behaviors of carangid species in Belize. Fish. Bull. 103, 426–432. Granneman, J.E., Steele, M.A., 2015. Effects of reef attributes on fish assemblage similarity between artificial and natural reefs. ICES J. Mar. Sci. 72, 2385–2397. https://doi.org/10.1093/icesjms/fsv094 (Original).
Griffin, L.P., Casselberry, G.A., Lowerre-Barbieri, S.K., Acosta, A., Adams, A.J., Cooke, S. J., Filous, A., Friess, C., Guttridge, T.L., Hammerschlag, N., Heim, V., Morley, D., Rider, M.J., Skomal, G.B., Smukall, M.J., Danylchuk, A.J., Brownscombe, J.W., 2022. Predator–prey landscapes of large sharks and game fishes in the Florida Keys. Ecol. Appl. 32, 1–24. https://doi.org/10.1002/eap.2584
Grüss, A., Robinson, J., Heppell, S.S., Heppell, S.A., Semmens, B.X., 2014. Conservation and fisheries effects of spawning aggregation marine protected areas: what we know, where we should go, and what we need to get there. ICES J. Mar. Sci. 71, 1515–1534. https://doi.org/10.4135/9781412953924.n678
Harley, S.J., Myers, R.A., Dunn, A., 2001. Is catch-per-unit-effort proportional to abundance? Can. J. Fish. Aquat. Sci. 58, 1760–1772. https://doi.org/10.1139/cjfas58-9-1760
Heyman, W.D., Kjerfve, B., 2008. Characterization of transient multi-species reef fish spawning aggregations at Gladden Spit, Belize. Bull. Mar. Sci. 83, 531–551
Heyman, W.D., Grüss, A., Biggs, C.R., Kobara, S., Farmer, N.A., Karnauskas, M., LowerreBarbieri, S., Erisman, B., 2019. Cooperative monitoring, assessment, and management of fish spawning aggregations and associated fisheries in the U.S. Gulf of Mexico. Mar. Policy 109, 103689. https://doi.org/10.1016/j. marpol.2019.103689
Holder, P.E., Griffin, L.P., Adams, A.J., Danylchuk, A.J., Cooke, S.J., Brownscombe, J.W., 2020. Stress, predators, and survival: exploring permit (Trachinotus falcatus) catchand-release fishing mortality in the Florida Keys. J. Exp. Mar. Bio. Ecol. 524. https:// doi.org/10.1016/j.jembe.2019.151289
Hunt, L.M., 2005. Recreational fishing site choice models: Insights and future opportunities. Hum. Dimens. Wildl. 10, 153–172. https://doi.org/10.1080/ 10871200591003409
Jackson, G., Moran, M., 2012. Recovery of inner Shark Bay snapper (Pagrus auratus) stocks: Relevant research and adaptive recreational fisheries management in a World Heritage Property. Mar. Freshw. Res. 63, 1180–1190. https://doi.org/10.1071/ MF12091
Johannes, R.E., 1978. Reproductive strategies of coastal marine fishes in the tropics. Environ. Biol. Fishes 3, 65–84. https://doi.org/10.1007/BF00006309
Keller, J.A., Herbig, J.L., Morley, D., Wile, A., Barbera, P., Acosta, A., 2020. Grouper tales: use of acoustic telemetry to evaluate grouper movements at Western Dry Rocks in the Florida Keys. Mar. Coast. Fish. 12, 290–307. https://doi.org/10.1002/ mcf2.10109
Kendall, M.S., Williams, B.L., Winship, A.J., Carson, M., Grissom, K., Rowell, T.J., Stanley, J., Roberson, K.W., 2021. Winds, waves, warm waters, weekdays, and which ways boats are counted influence predicted visitor use at an offshore fishing destination. Fish. Res. 237, 105879. https://doi.org/10.1016/j.fishres.2021.105879
Klizentyte, K., Cleary, M., Cox, D., Crandall, C., Foss, K., Hart, H., Paudyal, R., Sweetman, C., 2023. De-hooking depredation: exploring multiple fisher perceptions about marine depredation in Florida. Ocean Coast. Manag. 241, 106677. https://doi. org/10.1016/j.ocecoaman.2023.106677.
Kuriyama, P.T., Branch, T.A., Hicks, A.C., Harms, J.H., Hamel, O.S., 2019. Investigating three sources of bias in hook-and-line surveys: survey design, gear saturation, and multispecies interactions. Can. J. Fish. Aquat. Sci. 76, 192–207. https://doi.org/ 10.1139/cjfas-2017-0286
Lennox, R.J., Alos, J., Arlinghaus, R., Horodysky, A., Klefoth, T., Monk, C.T., Cooke, S.J., 2017. What makes fish vulnerable to capture by hooks? A conceptual framework and a review of key determinants. Fish Fish 18, 986–1010. https://doi.org/10.1111/ faf.12219
Lindeman, K.C., Pugliese, R., Waugh, G.T., Ault, J.S., 2000. Developmental patterns within a multispecies reef fishery: management applications for essential fish habitats and protected areas. Bull. Mar. Sci. 66, 929–956
Madgett, A.S., Harvey, E.S., Driessen, D., Schramm, K.D., Fullwood, L.A.F., Songploy, S., Kettratad, J., Sitaworawet, P., Chaiyakul, S., Elsdon, T.S., Marnane, M.J., 2022. Spawning aggregation of bigeye trevally, Caranx sexfasciatus, highlights the ecological importance of oil and gas platforms. Estuar. Coast. Shelf Sci. 276, 108024. https://doi.org/10.1016/j.ecss.2022.108024
McCallister, M.P., Brewster, L., Dean, C., Drymon, J.M., Hutt, C., Ostendorf, T.J., Ajemian, M.J., 2025. A multifaceted citizen-science approach for characterizing shark depredation in Florida’s recreational fisheries. ICES J. Mar. Sci. 82. https:// doi.org/10.1093/icesjms/fsaf013
Mitchell, J.D., McLean, D.L., Collin, S.P., Langlois, T.J., 2019. Shark depredation and behavioural interactions with fishing gear in a recreational fishery in Western Australia. Mar. Ecol. Prog. Ser. 616, 107–122. https://doi.org/10.3354/meps12954
Mitchell, J.D., Drymon, J.M., Vardon, J., Coulson, P.G., Simpfendorfer, C.A., Scyphers, S. B., Kajiura, S.M., Hoel, K., Williams, S., Ryan, K.L., Barnett, A., Heupel, M.R., Chin, A., Navarro, M., Langlois, T., Ajemian, M.J., Gilman, E., Prasky, E., Jackson, G., 2023. Shark depredation: future directions in research and management. Rev. Fish. Biol. Fish. 33, 475–499. https://doi.org/10.1007/s11160022-09732-9
Monroe County Tourist Development Council, 2026. Tourism Report. 〈https://www. monroecounty-fl.gov/328/Tourist-Development-Council〉
Mosley, C.L., Dassow, C.J., Caffarelli, J., Ross, A.J., G. Sass, G., Shaw, S.L., Solomon, C.T., Jones, S.E., 2022. Species differences, but not habitat, influence catch rate hyperstability across a recreational fishery landscape. Fish. Res. 255, 106438. https://doi.org/10.1016/j.fishres.2022.106438
Nemeth, R.S., 2005. Population characteristics of a recovering US Virgin Islands red hind spawning aggregation following protection. Mar. Ecol. Prog. Ser. 286, 81–97. https://doi.org/10.3354/meps286081.
van Overzee, H.M.J., Rijnsdorp, A.D., 2015. Effects of fishing during the spawning period: implications for sustainable management. Rev. Fish. Biol. Fish. 25, 65–83. https://doi.org/10.1007/s11160-014-9370-x
Paxton, A.B., Newton, E.A., Adler, A.M., Hoeck, R.V.Van, Iversen Jr., E.S., Taylor, J.C., Peterson, C.H., Silliman, B.R., 2020. Artificial habitats host elevated densities of large reef-associated predators. PLoS One 15, 1–17. https://doi.org/10.1371/ journal.pone.0237374
Piczak, M., Cooke, S., Adams, A., Griffin, L., Danylchuk, A., Brownscombe, J., 2023. Permit (Trachinotus falcatus) fishing quality and conservation threats in the Florida Keys: a recreational angler and fishing guide survey. Gulf Caribb. Res. 34, 1–12. https://doi.org/10.18785/gcr.3401.03
R Core Team, 2025. R: A language and environment for statistical computing.
Raby, G.D., Packer, J.R., Danylchuk, A.J., Cooke, S.J., 2014. The understudied and underappreciated role of predation in the mortality of fish released from fishing gears. Fish Fish 15, 489–505. https://doi.org/10.1111/faf.12033
Reis-Filho, J.A., Miranda, R.J., Sampaio, C.L.S., Nunes, J.A.C.C., Leduc, A.O.H.C., 2021. Web-based and logbook catch data of permits and pompanos by small-scale and recreational fishers: predictable spawning aggregation and exploitation pressure. Fish. Res. 243. https://doi.org/10.1016/j.fishres.2021.106064
Ripley, B., Venables, B., Bates, D.M., Hornik, K., Gebhardt, A., Firth, D., 2025. Package “MASS.” Version 7.3-65. Available at: 〈https://cran.r-project.org/package=MASS〉 J.A. Robichaud L.P. Griffin G.M. Clementi B.M. Binder K.R. Gastrich G.A. Casselberry L. LaRochelle D. Morley J.A. Keller M.R. Heithaus K.M. Boswell A.J. Danylchuk A.J. Adams S.J. Cooke J.W. Brownscombe In review. Spawning site residency and connectivity patterns of Permit (Trachinotus falcatus) in response to a seasonal fishing closure in the Florida Keys Environ. Biol. Fishes.
Robins, C.R., Ray, G.C., 1986. A field guide to Atlantic Coast fishes of North America. Houghton Mifflin Company, New York
Robinson, J., Graham, N.A.J., Cinner, J.E., Almany, G.R., Waldie, P., 2015. Fish and fisher behaviour influence the vulnerability of groupers (Epinephelidae) to fishing at a multispecies spawning aggregation site. Coral Reefs 34, 371–382. https://doi.org/ 10.1007/s00338-014-1243-1
Sadovy, Y., Domeier, M., 2005. Are aggregation-fisheries sustainable? Reef fish fisheries as a case study. Coral Reefs 24, 254–262. https://doi.org/10.1007/s00338-0050474-6
Sadovy, Y., Colin, P., Domeier, M., 2005. Monitoring and managing spawning aggregations: methods and challenges. SPC Live Reef. Fish. Inf. Bull. 14, 29
Sadovy de Mitcheson, Y., Craig, M.T., Bertoncini, A.A., Carpenter, K.E., Cheung, W.W.L., Choat, J.H., Cornish, A.S., Fennessy, S.T., Ferreira, B.P., Heemstra, P.C., Liu, M., Myers, R.F., Pollard, D.A., Rhodes, K.L., Rocha, L.A., Russell, B.C., Samoilys, M.A., Sanciangco, J., 2013. Fishing groupers towards extinction: a global assessment of threats and extinction risks in a billion dollar fishery. Fish Fish 14, 119–136. https:// doi.org/10.1111/j.1467-2979.2011.00455.x
Sala, E., Ballesteros, E., Starr, R.M., 2001. Rapid decline of Nassau grouper spawning aggregations in Belize: Fishery management and conservation needs. Fisheries 26, 23–30. https://doi.org/10.1577/1548-8446(2001)026<0023:rdongs>2.0.co;2
Sala, E., Aburto-Oropeza, O., Paredes, G., Thompson, G., 2003. Spawning aggregations and reproductive behavior of reef fishes in the Gulf of California. Bull. Mar. Sci. 72, 103–121
Shono, H., 2008. Application of the Tweedie distribution to zero-catch data in CPUE analysis. Fish. Res. 93, 154–162
Simard, P., Wall, K.R., Mann, D.A., Wall, C.C., Stallings, C.D., 2016. Quantification of boat visitation rates at artificial and natural reefs in the eastern Gulf of Mexico using acoustic recorders. PLoS One 11, 1–14. https://doi.org/10.1371/journal. pone.0160695
Smith, M., Fedler, A.J., Adams, A.J., 2023. Economic assessments of recreational flats fisheries provide leverage for conservation. Environ. Biol. Fishes 106, 131–145. https://doi.org/10.1007/s10641-022-01375-w
Smyth, G., Hu, Y., Dunn, P., Phipson, B., Chen, Y., 2025. Package “statmod.” Version 1.5.0. Available at: 〈https://cran.r-project.org/package statmod〉.
Stoner, A.W., 2004. Effects of environmental variables on fish feeding ecology: implications for the performance of baited fishing gear and stock assessment. J. Fish. Biol. 65, 1445–1471. https://doi.org/10.1111/j.0022-1112.2004.00593.x
U.S. Census Bureau, 2020. Decenn. Census. 〈https://data.census.gov/〉
Villegas-Ríos, D., Alos, J., Palmer, M., Lowerre-Barbieri, S.K., Banon, R., AlonsoFern´ andez, A., Saborido-Rey, F., 2014. Life-history and activity shape catchability in a sedentary fish. Mar. Ecol. Prog. Ser. 515, 239–250. https://doi.org/10.3354/ meps11018
Zhang, Y., 2013. Likelihood-based and Bayesian methods for Tweedie compound Poisson linear mixed models. Stat. Comput. 23, 743–757. https://doi.org/10.1007/s11222012-9343-7
Zhang, Y. (Wayne), 2024. Package “cplm.” Version 0.7-12.1. Available at: 〈https://cran. r-project.org/package=cplm〉