52 minute read
Assessment of the Braking Performance of Unidirectional Idlers

Due to the inherent danger involved in the handling of bulk materials, it is vitally important that the associated safety risks are mitigated. A specific concern in this regard is the transport of material using steep inclined belt conveyors which are vulnerable to rollback and runaway.
Advertisement
Bryan Moore Terrance Frangakis
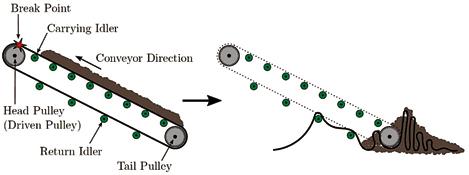
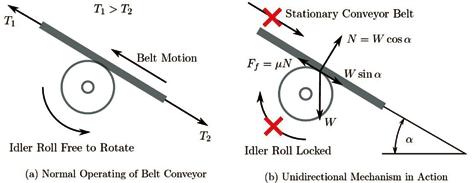
One particularly serious cause of a belt runaway occurs in the event of a belt snap which results in the loaded conveyor belt overcoming the rotational resistances of the idler rolls and accelerating down the incline. Figure 1 illustrates the repercussions of such a catastrophic event. Without adequate safety precautions in place, a belt runaway can lead to fatalities or injuries of personnel, damage to conveying equipment and loss of productivity. To avoid a calamity such as this, safety devices can be used. One such run-back preventing device is the backstop, which permits belt motion in the forward direction and prohibits it in the reverse direction. Backstops are usually mounted to the drive shaft of the head pulley and are effective in preventing runaways when the motor is not energised. However, when considering the event of a belt snap, a backstop is unable to stop the belt from accelerating down the incline. To prevent this type of a runaway, unidirectional idlers may be used. These safety devices make use of high torque rated single-direction bearings installed within the shells of conventional idler rolls. This mechanism allows the roll to freely rotate in the forward direction, but prevents rotation in the opposite direction when the device is engaged – effectively locking the roll in place. Figure 2 demonstrates this functionality.
Unidirectional idlers
Despite their use in industry, very little work has been done in researching the performance of unidirectional idlers to date. Considering the higher costs of these idlers, as well as the additional rotational resistance that they impart to the system, the importance of correctly specifying the required quantity of unidirectional idlers may be appreciated. In order to develop a better understanding of unidirectional idlers, the Conveyor Manufacturers Association of South Africa (CMA) commissioned a test rig to be built that could measure the resistance to motion between an inclined belt and a stationary idler. This test rig was designed to study the effects that the following list of belt conveying factors have on the performance of unidirectional idlers:
Figure 1. Schematic of a Conveyor Belt Snapping at the Head Pulley
Inclination angle (")
Troughing angle ( $)
Belt sag (K S ) Idler pitch (")
Idler roll type (μ)
Idler roll diameter (D)
Belt tension (T)
Material loading (q m )
Literature review
Belt conveying factors: Considering unidirectional idlers as the solution to inherent safety concerns associated with steep inclined conveyors, the factors that possibly influence these safety devices will be explored in the following sub-sections.
Inclination Angle: When a belt is inclined, it is necessary to consider the relationship that material load and belt weight have on unidirectional idlers.
The force component of material load and belt weight acting along the incline increases with inclination, thus requiring more unidirectional idlers to inhibit belt motion.
Troughing Angle: In a three-roll idler set, the troughing angle ( $) is the angle created by one of the wing rolls and the centre roll (as shown in Figure 3). Different troughing angles result in different wing roll contact pressures. Previous research has shown that the normal force experienced at the wing rolls increases with increasing troughing angle. Ilic and Wheeler referenced research by Behrens which showed that the wing roll normal force is 1.2 and 1.9 times greater than would be expected with gravity acting alone on a wing roll troughed at 30 o and 45 o respectively.
In terms of the effect that troughing angle has on the braking performance of unidirectional idlers, the greater normal force experienced by a wing roll troughed at a steeper angle will improve the friction braking capability of a unidirectional wing roll according to the following equation:
where F f is the friction force [N], μ is the coefficient of friction and N is the normal force [N].
Despite the contact pressure multipliers observed in wing rolls, the majority of the conveyed material exists in the region above the centre rollers and as such, normal forces on these rollers tend to be larger. A recent study by Liu et al. recorded the total percentage of normal force on the centre belt section of a 35° troughed three-roll idler system to vary from 66.2% to 74.2%. As such, centre rolls should be prioritised in the
Figure 3. Three-Roll Troughed Idler System
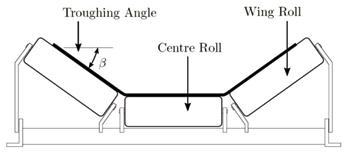
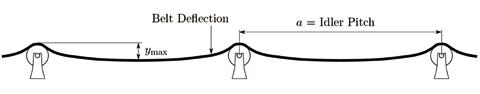
Figure 4. Belt Deflection and Idler Pitch
Belt Sag and Idler Pitch: The friction developed between a locked unidirectional idler and the conveyor belt is not the only factor that affects the resistance to motion of the belt. Instead, the inherent belt sag in the system (as depicted in Figure 4) requires additional pulling force to lift the belt up and over each successive idler set. Belt sag (K S ) is the ratio of maximum vertical belt deflection ( ( max ) to idler pitch ("), and is typically expressed as a percentage.
Idler Roll Type: In the past, the material choice for idler roll shells was invariably steel, due to its availability and durability. In recent years, polymer shells have become more prevalent. The most frequently chosen polymer shells are made from Nylon and High Density Polyethylene (HDPE). With unidirectional idler performance in mind, it is intuitive that the belt and idler roll material combination (with its corresponding friction coefficient) will directly affect the friction braking capability of the unidirectional idler, according to Equation 1. Idler Roll Diameter: When it comes to the diameter of unidirectional idler rolls, this factor is likely to affect belt resistance to motion due to the development of indentation rolling and rotating resistance, and/or as a result of the relationship between beltroll contact pressure and the coefficient of friction. Indentation rolling resistance develops in conveyor systems as a result of the asymmetric compression of the belt bottom cover as it traverses over successive idler rolls, while idler rotating resistance develops as a result of the torsional resistance to rotation experienced by the roller bearing sub-assembly.
Belt Tension: In the event of a belt snap, the complete release of conveyor belt tension is likely to result in considerable belt sagging between successive idlers. This, in turn, increases the force required to cause belt slip, thus helping to prevent a runaway. In terms of the experiments conducted in this research venture, tension was chosen as a variable in order to observe the effects of belt tension from a resistance to belt sliding point of view. This provided sufficient insight into the low/no tension case to be able to state whether the snapped belt would likely runaway in reality.
Material Loading: The mass of material load per metre of conveyor belt (q m ) plays a major role in unidirectional idler functionality. The greater the material loading, the larger the unidirectional idler normal force and associated friction will be. However, a larger load also results in a larger downslope component of weight which needs to be resisted by the unidirectional idlers (refer to Figure 2.b). Furthermore, in the event of a belt snap, the loss of tension in the belt and the downslope component of the material weight will increase the belt sag between idlers; thus assisting the unidirectional mechanism.
Design of Experiment Techniques
When undertaking experimental research in which many parameters are varied, it is useful to employ statistical Design Of Experiment (DOE) techniques in order to identify the variables that have significant influence on a mea
Figure 6. Interaction Effect Plot for Hypothetical 2 3 Factorial DOE

sured output, and to make better informed conclusions about the relationships between parameters and the measured outcome. Of particular interest to this research are the DOE techniques associated with fractional factorial designs – stud
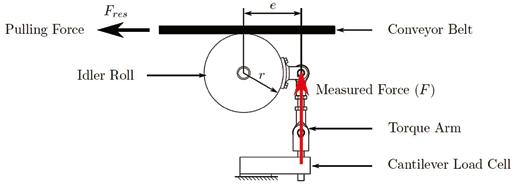
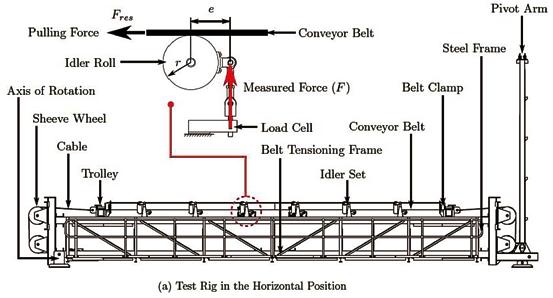
Figure 7. Diagram of the Resistive Force Measurement Technique
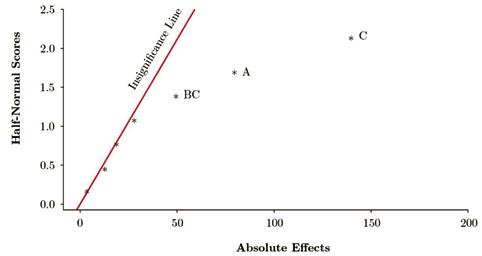
Once a carefully selected experimental design has been conducted, an analysis of variance may be performed to determine which factors (and interactions) have the most significant effect on the measured outcome. The results of an analysis of variance are most appreciably summarised in the form of a half-normal plot (see Figure 5). In these plots, the distance between points and the insignificance line indicates the level of significance. If a point lies on or close to the insignificance line then the factor or interaction can be categorised as insignificant.
With this in mind, the hypothetical half-normal plot presented in Figure 5 shows that the main effects of factors A and Care significant, as well as that of the interaction BC. One of the most advantageous benefits of factorial DOEs is the identification of interactions. In complex study areas, the factors being varied may interact with each other, and therefore simply assessing the main effects can be misleading. To better understand how interactions affect the measured outcome, interaction effect plots (see Figure 6) can be generated following an analysis of variance.
An interaction effect plot presents the average measured outcome on the y-axis, the varied levels of one of the factors making up the interaction on the x-axis, and individual lines for each level of the other factor. When interpreting one of these plots, it is important to consider the difference in gradient of the interaction lines. The greater the difference in line gradient, the greater the strength of the interaction.
With this in mind, Figure 6 reveals a considerable interaction to exist between factors B and C. In this case, it can be seen that the effects of factor B are more significant at higher levels of factor C (indicated by the steeper gradient of the C + line).
The design ultimately chosen for the initial stages of experimentation in this research case was a 2 6-1 fractional factorial design of experiment. This design was particularly favourable in that it allowed for
the effects of a large number of belt conveying factors to be investigated with a manageable set of 32 factor screening experiments. Following the completion of the experiments, this factor screening exercise allowed for subsequent focused experimental programmes to be designed that were able to explore more significant factors in greater depth.
Experimentation Research methods
In order to determine which belt conveying factors have the greatest impact on unidirectional idler performance, a range of experiments was planned using DOE techniques. These experiments were executed using the Unidirectional Roller (UDR) Test Rig that was designed and constructed by various member companies of the CMA. The experiments conducted with this rig were designed to determine the resistive forces that develop between locked rolls (i.e. unable to rotate) and a conveyor belt being pulled over these rolls, to represent a belt slipping down an incline in the event of a belt snap. The mechanism used to simulate a unidirectional roller and infer the resistive force between locked rolls and the belt is illustrated in Figure 7. It is important to note that conventional idler rolls were installed on the UDR Test Rig, not unidirectional idler rolls. These rolls were, however, secured to the rig in such a way as to imitate the functionality of unidirectional rolls. This was achieved through the use of a rigid connection between the idler roll face and the fixed cantilever load cell. From Figure 7 it can be seen that the induced force (F) measured by the load cell at an eccentric distance (e) from the roll axis was used to determine the rotation resisting torque (τ) according to:
Since the forces are in equilibrium just before the belt slips, the opposite oriented resistive torque acting at the belt-roll interface (τ res =F res r) has the same magnitude as the measured torque (τ). Therefore load cell measurements were used to calculate resistive slip forces at the belt-roll interface according to:
Unidirectional roller test rig
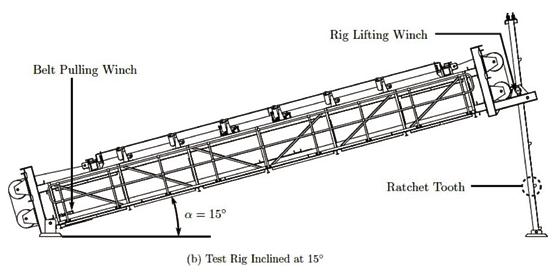
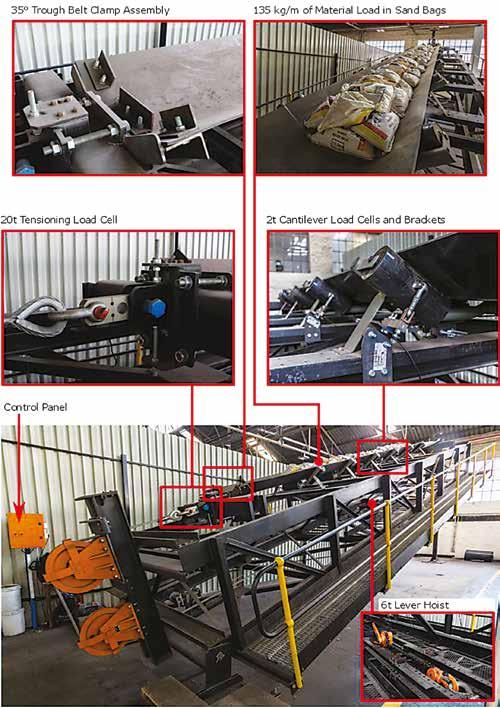
The UDR Test Rig consisted of a steel frame onto which idler sets, sheave wheels, winches and a belt tensioning frame were fitted (Figure 8.a). A ten-metre length of conveyor belting, troughed to the same degree along its entire length, was tensioned over the idlers with cables that were connected to both ends of the belt via clamps attached to trolleys. These cables were guided by four sheave wheels to the bottom of the rig where they were connected to the tensioning frame. This frame used a six-tonne lever hoist to provide the necessary belt tension, in the range of 5 to 25 kN, which was measured with a load cell (Figure 9). The belt pulling force was provided by a winch fixed to the rig which pulled the tensioning frame along steel rails. The rig could also be rotated through one of its ends, thus allowing tests to be run at inclinations between 0° and 15° in 5° increments (Figure 8.b). It is also important to note the mechanism used to simulate unidirectional rolls and measure slip forces, as shown in Figure 7, was installed onto the six rolls of the two idler sets in the centre of the rig. Besides varying the inclination angle, other important belt conveying parameter levels could also be changed with the rig. Troughing angle (0°, 35° and 45°), idler roll type (steel, Nylon and HDPE), idler roll diameter (127 and 152mm) and idler pitch (1200, 1500 and
1800mm) were varied by attaching idlers to the steel frame at different spacings, with different troughing angled frames, installed with rollers of varying size and type. Different levels of belt sag could also be achieved by varying idler pitch, tensioning the belt at different levels and varying the material loading. The belt load was simulated through the use of sand bags (as shown in Figure 9).
Discussion of results
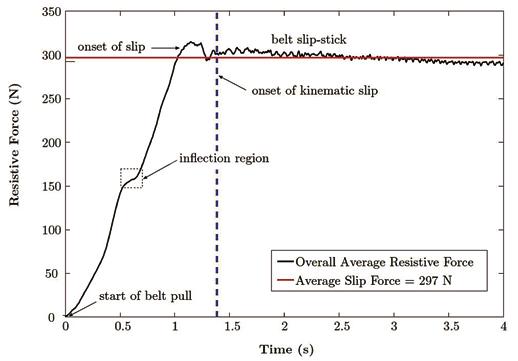
Before the results of the experimental programmes are presented, a typical example of the data collected during a UDR Test Rig experiment will be considered. Once all the test runs of a particular experiment had been conducted, a resistive force graph was plotted by averaging the force response data from all test iterations and across both of the measured idler sets. An example of the resulting resistive force plot is shown in Figure 10. From these graphs, the mean slip force for each experiment was determined using a MATLAB program which calculated the average slip force over an interval of three seconds, beginning at the user defined onset of kinematic slip. Following the overall resistive force line shown in Figure 10, it may be seen that after the instance of initial belt pull (when time = 0), the average idler set resistive force first increases sharply together with the increasing belt pulling force. Then the force levels off briefly (inflection region) as a result of the belt-roll friction limit being reached. However, the belt does not start to slip at this point since there is still not enough belt pulling force to overcome the non-friction sources of slip resistance (such as belt sag). This is why the inflection region is immediately followed by an increase in the resistive force as a result of the remaining resistance inherent in the conveyor belt which needs to be pulled up and over the locked idlers. This period of increasing resistive force ends with a peak force value being reached (the static resistive force limit), at which point the belt begins to slip over the locked idlers. The resistive force seen to oscillate about a lower force value (the kinematic slip force) after the resistive peak is indicative of a typical slip-stick motion of the belt sliding over the locked rolls at a constant velocity.
Factor screening experimental results
In order to determine which factors and combinations of factors contribute most significantly to the resistive force developed at the contact between the belt and a locked idler roll, a factor screening experimental study was conducted. As mentioned earlier, the chosen DOE was a 2 6-1 fractional factorial design requiring a total of 32 experiments. This series of factor screening tests involved two extreme values for each parameter, a high value and a low value, and was used to determine the kinematic belt slip force that results from varying inclination angle (0 o and 15 o ), idler pitch (1200 and 1800mm), roll material type (either nylon or steel), roll diameter (127 and 152mm), troughing angle (0 o and 45 o ) and belt tension (5 and 25 kN). Figure 10. Typical Averaged Resistive Force Graph (Experiment A26) Figure 11. Half Normal Plot for Experimental Programme A
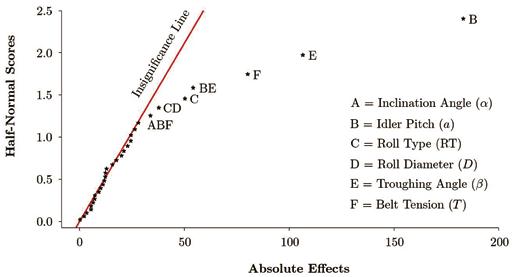
The half-normal plot that was derived from this initial investigation (see Figure 11) shows idler pitch, troughing angle and belt tension to be the most consequential factors, while the interaction between pitch and trough, the roll type main effect and the interaction between roll type and diameter demonstrate a medium-to-low significance level. Considering the half-normal plot, the exceptional significance of idler pitch is particularly appreciable. This high level of consequence makes sense when considering the effect that idler
pitch has on belt friction and sag. The greater the pitch, the greater the loads being supported by each idler set will be (therefore resulting in greater frictional resistance according to Equation 1) and the greater the belt sag between successive idlers will be (thus requiring a greater downward pulling force do drag the belt up and over each idler set). Similarly to idler pitch, varying the troughing angle significantly affects slip resistance due to belt friction and sag. When a belt is bent into a trough, the elastic potential energy stored in the belt tries to push the belt flat again, thus resulting in significant normal forces (and therefore friction forces) acting at the wing rolls. In terms of non-friction resistances, introducing a troughed belt profile results in a type of three-dimensional belt sag when the belt trough opens up slightly between successive idler sets. This means that in order for the conveyor belt to slip down the incline, the gravitational pull of the belt needs to be sufficient enough to flex the sides of the conveyor belt to the troughing profile at the idler sets. Additionally, if the belt is loaded with material, the belt has to compress the material in order to pass the idler rolls. Figure 11 reveals belt tension to be the next greatest contributor to slip resistance. Although the magnitude of the belt
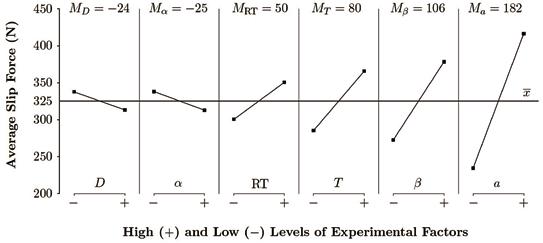
Figure 12. Main Effects Plot for Experimental Programme A
tension main effect may seem reasonable, its direction (see Figure 12) is a bit more difficult to understand. Numerically, the magnitude of the calculated main effect demonstrates the relative significance of the associated factor, while the sign indicates whether the effect increases or decreases when increasing the factor level. With this in mind, the main effects plot shows belt tension to have a positive effect on belt slip; meaning that an increase in belt tension results in an increase in slip force. This contradicted with the initial expectation that an increase in belt tension would reduce the belt sag and thus result in a decrease in the non-friction element of slip resistance.
Insights
At this point it is worth clarifying why tension was varied at all in the various experiments conducted. Low and high tension states were explored in order to determine which tension state is better from a resistance to belt slip point of view. This therefore enabled sufficient insights into the low/ no tension case (that would be expected when a belt snap occurs) to be able to state whether the belt will be likely to run away or not. With this in mind, it would appear from Figure 12 that when the conveyor belt is empty, the worst belt tension case is that when tension is low. In addition to the identification of significant factors, it is also interesting to note which factors were deemed to have little or no significance. Inspecting the half-normal plot in Figure 11, it may be seen that inclination angle has no effect on belt slip. This is because the test rig was designed to force belt slip. Many of the experiments conducted were set up with operating conditions that would never otherwise have experienced slip (such as the horizontal belt case). Despite this, slip was achieved every time by increasing the pulling force until the belt began to move. As such, the inclination effect could not be deduced from the factor screening study, but was further explored in a series of additional experimental programmes.
Finally, although idler roll type was observed to be a significant factor, its significance relative to the other factors was found to be lower than anticipated. It was expected that the roll type would contribute more seriously to the braking of the locked rolls because of the effect that roll material has on friction.
Figure 14. Schematic Diagram of the Experimental Programmes Conducted
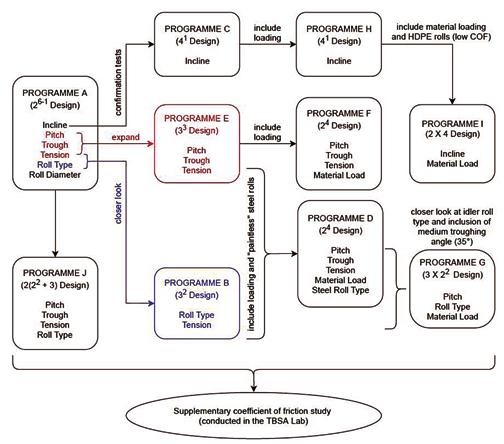
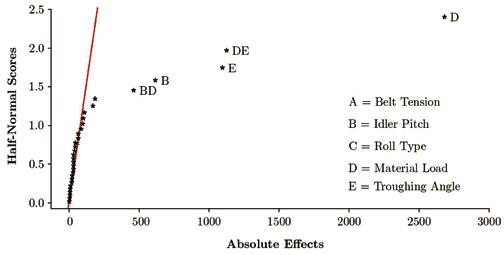
Figure 15. Half Normal Plot for Experimental Programme D
Upon closer inspection, it was deduced that the range of coefficients of friction (COF) tested using nylon and steel rolls (0.3 and 0.4 respectively) was fairly small. In addition, the lower than expected significance of roll type indicates the contribution of non-friction resistances (such as belt indentation and sag) to the overall unidirectional idler resistive force. To gain further insight into the effects of this parameter, HDPE rolls (which exhibit a much lower COF) were incorporated into the experiments of subsequent programmes.
Overall trends
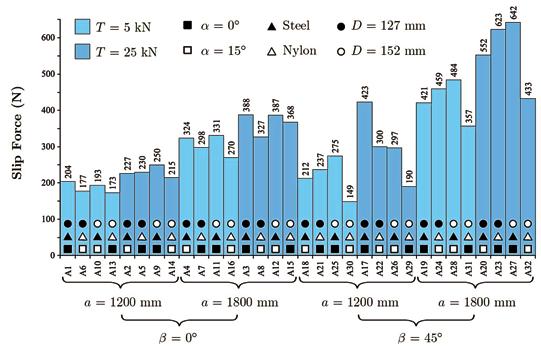
The overall trends of the factor screening experiments may now be summarised. These are presented in the slip force column chart below (Figure 13). It should be noted that in this figure, lower values are indicative of earlier belt slip, and are therefore of concern in the context of this research.
From this graph it may be seen that an increase in pitch, trough or tension results in an increase in the resistive force developed at a locked idler set. For any particular combination of these three factors, the variation in inclination angle, roll diameter and roll material have little influence on the measured slip force. This figure also shows that the worst inclined belt case in terms of unidirectional idler braking performance (i.e. the one resulting in the lowest resistive force at belt slip) is that where the idler pitch is the lowest (1200mm), there is no troughing of the belt and the system tension is low.
Conversely to this, the best case scenario is seen to be when the idler pitch is the highest (1 800mm), the belt is troughed to 45 o and belt tension is high.
Focused doe test results
Based on the results of the factor screening experimental programme, a series of additional experiments was conducted in order to develop a better understanding of how the various factors affect unidirectional idler performance. A summary of the supplementary experiments conducted may be seen in the flow chart presented in Figure 14. In addition to the development of a
better understanding of unidirectional idlers, the experiments presented in Figure 14 also allowed for a larger data set to be compiled and used to develop a unidirectional idler quantity specification model (as seen at the end of this paper). The first of the supplementary experiments conducted, Programme B, was designed to gain further insights into the effect of idler roll material. From this study it was found that a significantly lower force was required to pull the belt over locked HDPE rolls as compared to steel and nylon. The next study conducted, Programme C, was used to test whether or not the inclination angle of the test rig had any significant impact on the measured slip force. Ultimately, very little difference in measured slip force was observed with increasing angles of inclination, thus confirming the insignificance of inclination angle. This discovery allowed the majority of future experiments to be conducted with the test rig in the horizontal position.
Figure 17. Three-Dimensional Surface of Tension Averaged Kinematic Slip Forces

Experimental Programme D was designed to incorporate “paintless” steel rolls into the investigation, where the paint was removed from the rolls and the surfaces polished. This was done to mimic the realistic surface condition of steel rolls, which are likely to lose their paint layers quite quickly when in operation. In addition, this programme introduced the factor of belt loading for the first time. Using the data collected from this study, a half-normal plot was generated in order to reassess the significance of belt tension, idler pitch, idler roll type, material load and troughing angle. The resulting plot is presented in Figure 15 and reveals the three significant main effects to be material load, troughing angle and idler pitch, and the significant interactions to be those between material load and troughing angle, and between material load and idler pitch.
Figure 18. Free Body Diagram of an Inclined Conveyor Belt
Main factors
In terms of the main factor effects, Figure 15 reveals material load to have by far the most significant influence on unidirectional idler performance. This is because the introduction of material load onto the belt greatly affects the magnitude of supporting normal loads at each of the idler rolls, thus increasing the frictional braking potential according to the friction equation (F=μN). In addition, a loaded belt experiences considerably more sag than an unloaded one. Consequently, greater effort
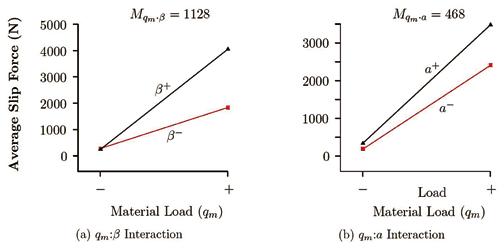
With regards to the second and third most significant main factors (trough and pitch), it is interesting to note that although these factors were also identified as significant in the factor screening study (Figure 11), the order of their significance differs between the two studies. In this case, troughing angle demonstrates greater significance than idler pitch. This is because of the strong interaction between belt load and trough (see Figure 15). This is better understood with reference to the interaction plot presented in Figure 16a.
In this figure, the notable difference in effect line gradient emphasises the strength of the interaction between load and trough. The $ + and $ - lines show that adding material to an empty belt has greater influence on slip when troughed belts ($ + ) are used as opposed to flat belts ($ - ). This is interpreted from the steeper $ + line and may be explained by considering how a fully loaded troughed belt would demonstrate a much greater mass per metre than that of a fully loaded flat belt. This heavier loading condition results in higher slip impeding belt sag and friction.
Keeping the focus on interaction effects, the relationship between material load and idler pitch may be explained. The effect plot of this two-factor interaction (Figure 16b) shows that material load has a greater effect on belt slip when larger idler pitches are used (as indicated by the steeper " + effect line). This is because the increase in slip restricting belt sag that results from adding material load to a belt is further intensified when the horizontal distances between successive idler sets are larger.
Following on from this, Experimental Programme E was designed and conducted to expand on the three most significant factors as identified through the analysis of the factor screening experiments (i.e. pitch, trough and tension). In the case of the first experimental programme, each factor was varied about two levels (low and high), whereas in Programme E, medium levels of idler pitch, troughing angle and belt tension were added. The belt slip trends observed throughout this study are summarised by the kinetic slip force surface presented in Figure 17.
Slip forces
This three-dimensional graph illustrates the best and worst empty belt set up scenarios in terms of resulting belt slip. It is important to reiterate that in the context of this paper; a low slip force is not desirable as it represents a situation of potential runaway in the event of a belt snap. It is therefore preferable to maximise slip forces when possible.
Figure 20. Predicted vs Actual Resistance Factors based on Minimum Values of λ
With this in mind, Figure 17 reveals the best case to be when idler pitch and troughing angle are at their highest (1 800mm and 45 o respectively), and the worst case to be when the idler pitch is 1 200mm and the belt troughing angle is 45 o . These findings make sense when considering that a lower idler pitch results in lower belt supporting normal forces which ultimately lowers the slip resisting friction forces at the idler roll-belt interface.
Conversely to this, the larger idler pitch results in higher normal and friction forces at the locked idler rolls. In terms of troughing angle, it is interesting to note that both best and worst empty belt slip cases were observed when the troughing angle was set to its maximum level of 45 o .
Although it was expected to observe the maximum slip force when the troughing angle was maximised, it was not expected to observe the minimum slip force at this level of belt trough as well. A possible reason for this may be in the way that
Recall from the factor screening experiments that the most significant two-factor interaction was that between idler pitch and troughing angle. When the idler pitch is small, not only are the effects of belt friction lower, but the non-friction effect of belt sag is lower – including three-dimensional sag. When the belt is troughed to 45 o and the idler pitch is minimised, not only is there lower three-dimensional sag due to the short distances between idler sets, but there is also likely to be less conventional sag as a result of the greater degree of longitudinal belt stiffness gained through the curved profile of a troughed belt.
Five additional programmes
Following this, five additional programmes were conducted (as seen in Figure 14). The purpose of these experiments was to gain further insight into the effects of belt loading, idler roll material construction, the interaction between inclination angle and belt load, and the previously understudied medium troughing angle level of 35 o .
In addition to the increased functional understanding gained from running these focused experiments, the collection of more slip force observations allowed for a larger data set to be established and then drawn from when deriving and training the unidirectional idler quantity specifying numerical model. Some of the key findings from the remaining experiments are listed below: • The results of Programmes F and G reiterated the findings of previous experimentation – that slip force increases with increasing idler pitch, material load and troughing angle, and that HDPE rollers result in noticeably lower slip forces when compared to other roll materials. • Programmes H and I showed that when an inclined belt is loaded, the material on the belt introduces an additional downward pulling force which causes a slight reduction in the critical slip force. • The analysis of substituted and repeated experiments showed that belt wear, which develops over time, affects the critical slip force. An increase in belt wear results in a lower observed resistive force at belt slip (i.e. belt wear is detrimental to unidirectional idler performance).
Specifying the required quantity of unidirectional idlers Preliminary analysis of the mechanics of unidirectional idlers
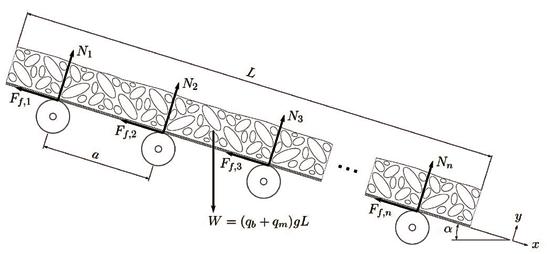
In order to use the experimental findings to determine what quantities of unidirectional idlers are required for any given conveyor belt set-up, it was important to develop a better understanding of the mechanics of the system. Initially, this was done by conducting a basic force analysis (see Figure 18) and deriving a simplified unidirectional idler quantity formula. Figure 18 illustrates the simple mechanics of a length of belt (L), at a specific angle of inclination (α), supported by idlers separated from each other by a constant pitch (a). It is important to note that in this figure, the conveyor belt is assumed to be a rigid straight body and the resistive force is assumed to be as a result of belt-idler contact friction alone. Knowing the system to be static, the force balances relating to this free body diagram can be stated as follows:

where η is the required fraction of idlers that need to be unidirectional to prevent slip, g is the acceleration due to gravity (taken as 9.79 m/s²), N is the normal force of the idler roll supporting the conveyor belt, q b is the mass per metre of the belt and q m is the mass per metre of the material load. Assuming that the material load is distributed evenly along the entire length of the conveyor belt, Equation 5 can be substituted into Equation 4 and the unidirectional idler quantity formula for this preliminary Friction Model can be stated as:
Friction
Model:
Additional friction study
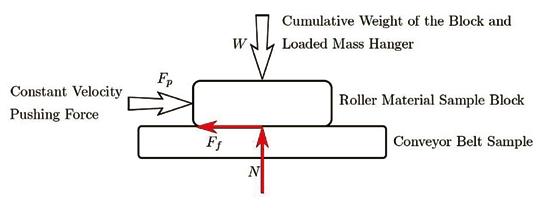
During the course of experimentation, it was discovered that the friction between locked idler rolls and the conveyor belt was not the only source of resistance to belt slip. Thus, the need to isolate the friction force from the overall resistance measured became apparent. In order to do this, a friction study was conducted in the TUNRA Bulk Solids Africa (TBSA) Laboratory, located at Wits University. The experiments that were run in this lab were adapted from the standardised wall friction testing method by clamping belt samples to a shear tester and pushing loaded material samples along the belt (Figure 19). This allowed for the determination of friction coefficients (μ).
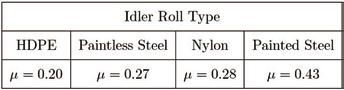
This friction study examined four different belt samples tested against the three most common idler roll materials: steel, nylon and HDPE. A total of 25 experiments were conducted to measure the COF. This study revealed COF to be slightly pressure dependant, with lower contact pressures usually resulting in lower COFs. The results also showed HDPE and steel samples to yield the lowest and highest COFs respectively.
From the conducted experiments, the worst case (i.e. lowest COF) for each roll material sample was identified. With the slight pressure dependence of friction in mind, these worst case values were calculated using a contact pressure of 15 kPa – corresponding to a 900 mm wide, 15 kg/m conveyor belt supported by Ø152 mm idler rolls separated by a pitch of 1.2 m and demonstrating a roller wrap angle of 10°.
The COFs relating to this pressure state (see Table 1) were ultimately used to calculate non-friction coefficients (explained in the next section) for each of the experiments conducted using the UDR test rig.
Quantity formula derivation
Since it was determined that the force resisting belt motion over locked idler rolls is not entirely due to friction, the conventional friction formula (F f = μN) could not be used to determine the resistive force acting at the belt-idler interface. However, using a modified version of this formula, the overall resistance force could be related to the roll normal force. This adapted formula is given by:
where F res is the resistive force and ψ is the resistance coefficient given by the product of the friction and non-friction coefficients (μ and λ respectively). The conventional friction formula was adapted by replacing the friction term with a newly defined resistance coefficient. This coefficient can be broken up into friction and non-friction coefficients, which contribute to overall slip resistance. With the minimum recorded friction coefficients known (see Table 1) and the resistance coefficients determined from the measured slip forces and estimated loading conditions for each experiment (ψ=F res /N), the non-friction coefficient for each experiment was determined using:
The use of these empirically determined non-friction factors (λ) together with the measured COFs, allowed for the resistive force developed at a unidirectional idler set to be found, and for a table of non-friction factors at different operating conditions to be drawn up (see Table 2). In order to extend the empirical findings to the theoretical case, the equations for normal force acting at the unidirectional centre (N c ) and wing (N w ) rolls are given by the following two equations [10].
where:
In the above equations, l 1 is the idler roll face length (m), B is the belt width (m), ρ is the bulk density of the material being conveyed (kg/m³), A c and A w are the cross-sectional areas of the conveyed material directly above the centre and wing idler rolls respectively, and ω is the normal coefficient. These normal coefficients apply to the wing rolls of troughed belts that experience greater normal forces than as a result of gravity acting alone.
Based on the preliminary mechanical model presented in Section 4.1, a more in-depth analysis was conducted, and a unidirectional idler quantity model was derived. This model incorporated the different resistive conditions of the centre and wing rolls resulting from their distinct normal forces (see Equations 9 and 10). In addition to this, considering the significant difference in resistive force at centre rolls as compared to the wing rolls, the model stipulates centre rolls as unidirectional first and only when the required quantity of these exceeds 100% are unidirectional wing rolls designated. The corresponding formulae of this model (the Resistance Model [10]) are given by:
Resistance Model: in order to prevent slip based on the centre and wing roll resistance coefficients (ψ c and ψ w respectively), and η is the total percentage of idler rolls that need to be unidirectional in order to prevent slip.
Numerical model results
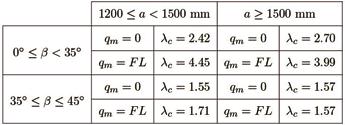
With all resistive and friction coefficients known for each measured belt slip force and knowing the relationship between these two factors (see Equation 8), the non-friction coefficients (λ) were calculated for each experiment. These factors were then condensed into a list of the minimum recorded values corresponding to the varied levels of the three most significant belt conveying factors (belt load, idler pitch and troughing angle). The resulting non-friction coefficients (calculated for centre rolls, wing rolls and idler sets) are summarised in Tables 2 to 4.
The non-friction coefficients listed in these tables were then used together with Equation 8 and the minimum observed coefficients of friction to predict the centre roll, wing roll and overall idler set resistance coefficients (ψ c , ψ w and ψ) for each experimental set-up. These predictions were then plotted together with the actual resistance factors determined through experimentation.
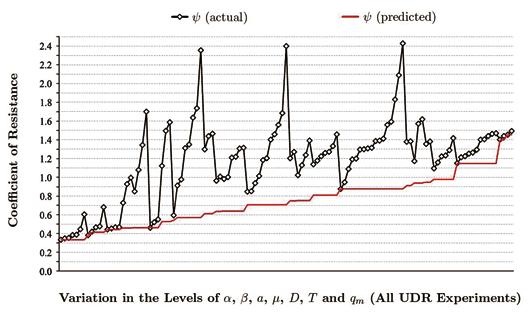
An example of one of these comparison plots (in this case the one for overall idler set resistance coefficient) is shown in Figure 20. This graph consists of a scatter plot of all the experimentally determined resistance coefficients re-ordered according to the ascending order of the resistance coefficient prediction model.
Prediction line
Figure 20 presents a comparison between the predicted and actual coefficients of resistances (y-axis) for all the experiments conducted on the UDR Test Rig (x-axis). This figure illustrates the relationship between the measured slip forces and the derived prediction model – the prediction line is seen to intersect the minimum resistance coefficients corresponding to the eight significant operating conditions (see Tables 2-4). Knowing that lower coefficients of resistance are detrimental to the functionality of unidirectional idlers, Figure 20 shows that the prediction method used is rather conservative – predicting coefficients that are never higher than actual values (especially if a safety factor is used). In summary, the above figure shows that if the Resistance Model is used to predict the resistance coefficient of a particular inclined belt operating scenario, the model will always err on the side of caution and use the worst observed case as the datum for predicting required quantities of unidirectional idlers.
Comparison study
Considering the derived Resistance Model, as well as the preliminary Friction Model presented earlier, a comparison study was conducted for a wide variety of inclined belt operating conditions. The comparison of these unidirectional idler quantity specifying methods was achieved with a numerical program that was designed to cycle through various levels of key conveyor belt factors and calculate the unidirectional idler quantities according to the different model equations. The various factors and corresponding factor levels cycled through this program are summarised in Table 5. A total of 3 240 different belt conveying scenarios were considered by varying these factors at all levels. The factors chosen to be varied in this case were all those that have a direct effect on the resistance coefficients and normal loads, as well as the principal factor of inclination angle.
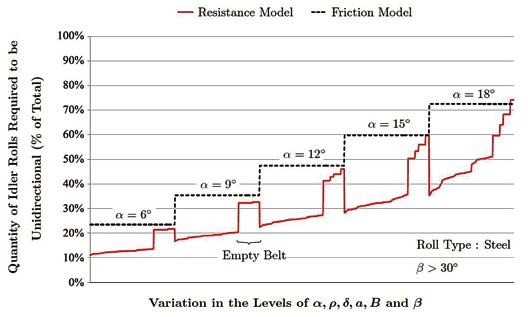
Although this original study assessed a wide range of inclined belt operating conditions, many of the scenarios considered are very unlikely to occur in reality. The two factors that this particularly applies to are troughing angle and idler roll type. It is uncommon to design inclined conveyor belts without at least some degree of troughing (i.e. flat belts are unexpected). It is also rare to find inclined belts installed with HDPE rolls; steel being the gold standard. With this in mind, the more common operating conditions were applied to the numerical simulation. The results of this condensed study, which only considered steel rolls and troughing angles larger than 30°, are shown in Figure 21. This figure illustrates the quantity predictions relating to the derived Resistance Model together with the preliminary Friction Model, grouped according to belt inclination and arranged in ascending order of the required quantity of unidirectional idlers. It should be noted that when calculating the required quantities of steel unidirectional rolls, the worst-case coefficient of friction corresponding to a worn roll, without any paint on its surface, was used (i.e. μ=0.27). It should also be noted that a safety factor of 1.15 was used for both models.
Inclination angle
In the model comparison plot presented in Figure 21, the required quantity of unidirectional steel rolls as specified by the Friction Model is seen to depend on inclination angle alone and is not affected by the idler pitch, belt trough, belt width or material load. This is in accordance with the model Equation 6. The quantity of these safety devices according to the Resistance Model, on the other hand, is seen to change with changing levels of inclination angle as well as with idler pitch, troughing angle, belt width and material loading conditions. With reference to the Resistance Model, it is also interesting to note the spike in required unidirectional idler quantities that occurs when the conveyor belt is empty. This is because an empty belt does not experience as much resistance from belt sag or belt cover indentation as one that is loaded with material. In addition, the increase in COF experienced with increased contact pressure, means that loaded belts exhibit additional resistance to belt slip as a result of contact friction. One of the important conclusions that can be drawn from this observation is that an empty conveyor belt constitutes a worst-case scenario in terms of belt slip resistance. When specifying the required quantity of unidirectional idlers for an installation, the calculations must be done for an empty belt, not a loaded one. If an inclined conveyor belt system has enough unidirectional idlers to prevent the runaway of an empty belt then it will also be able to hold the belt in place when loaded with bulk material.
Quantities
Comparing the two models presented in Figure 21 it may be seen that the Resistance Model derived from the experimentally determined friction and non-friction factors almost always specifies lower quantities of unidirectional idlers than the preliminary Friction Model. In fact, only at an inclination angle of 18° does the Resistance model begin to specify larger quantities for certain combinations of inclined belt parameters (when the belt is empty and the idler pitch and troughing angle are minimised). Knowing the Resistance Model to already be very conservative in its estimation of required unidirectional idler quantities, the comparison plot presented in Figure 21 shows the Friction Model to be somewhat wasteful – particularly in operating conditions that exhibit a high degree of conventional and three-dimensional belt sag (i.e. when the idler pitch and/or troughing angle is large).
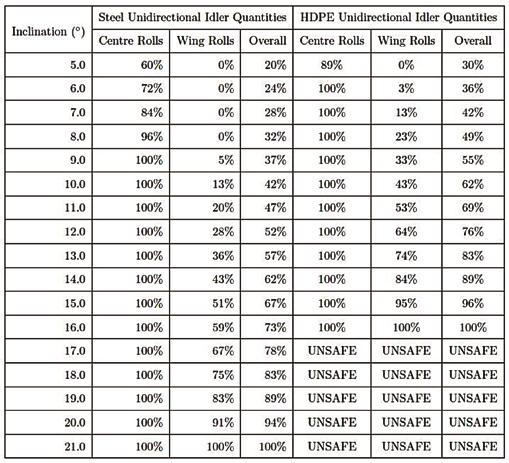
Matrix
Finally, it was desired to condense all the findings down into a compact quantity matrix that may be used in industry as an initial approximate quantity specifying tool. This matrix was generated by using the Resistance Model formulae to calculate the quantity of centre and wing rolls required to be unidirectional at varying angles of inclination for a worst-case scenario. This being an empty conveyor belt troughed at 45° and supported by idlers separated by a 1.2 m pitch. The combination of a 1.2 m idler pitch and a 45° troughing angle constitutes a worst case scenario because of the very low non-friction coefficient that results from this particular pairing (see Tables 3 and 4). The results of this exercise, which was conducted for both steel and HDPE rolls, and which used a safety factor of 1.15, are presented in Table 6. This table shows that it is unsafe to use steel unidirectional idlers for conveyor belts inclined at an angle greater than 21° and it is unsafe to use HDPE unidirectional idlers for inclines greater than 16°. Knowing that inclination angles greater than 18° are uncommon in practice, it is justified to assume steel unidirectional idlers to be suitable runaway preventing safety devices regardless of operating conditions. Unidirectional HDPE rolls, on the other hand, should be used with caution.
Conclusion
The following lists the key findings of unidirectional idler experiments as well as the numerical simulation: • The conveyor belt experiences belt slip at the wing rolls before the centre roll. Therefore, centre rolls should be prioritised when specifying the required quantity of unidirectional idler rolls. • The friction developed between a locked idler roll and the belt is not the only source of resistance affecting the performance of unidirectional idlers. Instead, there are non-friction resistances at play (such as belt sag) that strongly influence the belt pulling force required to induce slip. • High Density Polyethylene (HDPE) rolls perform poorly when converted to unidirectional idlers, exhibiting low resistive forces at belt slip. This is because of the lower
COF of HDPE when compared to nylon and steel rolls. • The smoothing of steel idler rolls (resulting from the painted surface wearing away during operation) has a slight effect on the magnitude of the friction developed at the surface of these rolls, but ultimately has no significant influence on unidirectional idler performance. • The most significant inclined belt conveying factors (in terms of their effect on kinematic slip force) are material load, troughing angle and idler pitch – with material load having by far the most influence. Increasing the levels of these factors results in increased resistive forces at belt slip. • The worst unidirectional idler performance case exists when HDPE idler rolls are used, when the idler pitch is low (1 200 mm), the troughing angle is high (450) and the belt is empty. • A conservative method for specifying the required quantity of unidirectional idler rolls was derived through the

Table 2. Minimum Non-Friction Factor Matrix
separation of friction and non-friction effects and the use of experimental data collected with the UDR test rig. This method took inclination angle, idler type, idler pitch, troughing angle and loading conditions into account whereas the preliminary friction method only considered inclination angle and idler type. Contact friction between an idler roll and a conveyor belt exhibits a slightly positive pressure dependence – friction coefficient increases with pressure. An empty conveyor belt constitutes a worst-case scenario in terms of belt slip resistance. When specifying the required quantity of unidirectional idlers, the calculations must be done for an empty belt, not a loaded one. It is not advisable to specify HDPE and steel unidirectional idler rolls for inclination angles greater than 16° and 21° respectively.
Table 3. Minimum Non-Friction Factor Values for Locked Centre Rolls

Table 4. Minimum Non-Friction Factor Values for Locked Wing Rolls
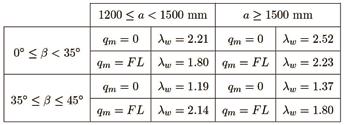
Table 5. Factors Cycled Through the Numerical Simulation
This paper was first presented at the Beltcon Conference in 2019. Copyright is vested with IMHC. www.beltcon.org.za Bryan Moore Data Analyst Business Science Corporation Tel: 072-445-3701 Email: bmoore@bscglobal.com Terrance Frangakis Senior lecturer School of Mechanical, Industrial and Aeronautical Engineering University of the Witwatersrand P/Bag X3, WITS, 2050, South Africa Tel: (011) 717-7333 Email: Terrance.Frangakis@ wits.ac.za
When Diesel Power International Services’ subsidiary, based in Namibia, needed advice on what cranes and hoists could be applied effectively to their newly designed work space, that would house their assembly lines and diesel engine stripping facilities, they called in Konecranes from Cape Town to assist. Installation and delivery times were tight, but the innovative solution that resulted from a Cost and Installation Time Analysis conducted by Konecranes sealed the turnkey deal. “The project was for a semi-free-standing gantry with 1 x 3.5ton single girder crane and 2 x 500kg column mount jib cranes and hoists” says Markus Labuschagne, Konecranes’s Regional Branch Manager who is based in Cape Town.
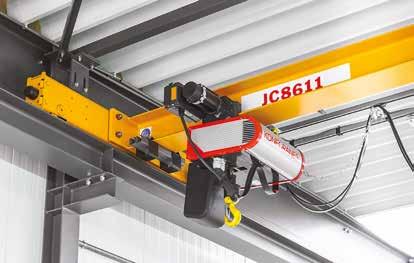
“The equipment specifications that the customer had originally requested - one 3.5ton jib crane and two 500kg jib cranes - would have worked out at a higher costing and not enhanced the layout of the proposed floor area. Additionally, our cranes have enabled the customer to place items on the new mezzanine level in the production plant,” he explains. The 3.5ton crane will be used for the lifting, stripping and assembly of truck diesel engines while the 2 x 500kg column mount jibs will be used for serving two work stations where smaller components and parts are repaired and serviced. Markus continues, “As a result of our Cost and Installation Time Analysis it was our recommendation that the alternate cranes we identified as suitable for their project, would cover a greater area than the equipment originally specified, and would offer greater benefits to Diesel Power International Services. This plus the fact that we were able to deliver the equipment to the customer in Namibia within their stated timeframe. “The other benefit as a result of our analysis was that the equipment we recommended required less excavation work inside of the customer’s workshop, less disruption to their operations and the total site work period was reduced, along with a nearly 40% cost reduction. Safety standards and safe operator conditions are not negotiable and the new installation most certainly is safety compliant,” he concludes. Konecranes Markus Labuschagne Email: markus.labuschagne@konecranes.com
Exceptional warranties and performance
Kemach has launched their new range of forklifts for the South African and Sub Saharan African markets, which will be promoted under their newly-formed Kemach Forklifts division. Frans van den Heever, General Manager for Kemach Forklifts says, “We are delighted to announce the Kemach Forklift range, in partnership with Anhui Heli, which we believe will complement our existing quality earthmoving products. This range offers our customers a South African forklift warranty first - a five year/12 000hr warranty on the complete machine, not just parts of the machine”. The forklifts have specified Japanese engines, Heli built ZF transmissions and robotically manufactured chassis, ensuring premium brand quality at very competitive pricing. “The range comprises a walk-behind powered pallet jack right through to 45ton container handling units, enabling us to compete in all sectors of the market. We have a national footprint of 11 branches and eight sub-dealers across South Africa, giving us the biggest footprint in the materials handling industry when it comes to service-ability and guaranteeing uptime for our customers,” Frans concludes. The forklifts will offer customers the lowest cost of ownership over the lifetime of the machine due to their reliability and competitive pricing. Local support features include aftermarket suppliers for battery and charger supplies, forklift attachments and management systems. Driver training and monitoring through Kemach’s forklift management system is also available. Kemach Equipment Tel: (011) 826-6710 Sales enquiries Chantellec@kemach.co.za Service enquiries Deanv@kemach.co.za

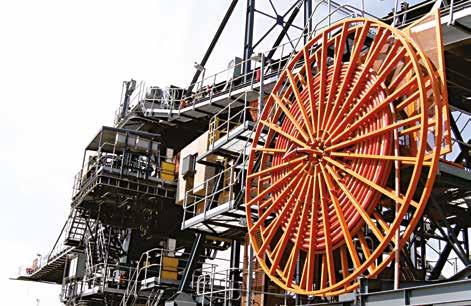
The SR-Express range from Powermite, which forms part of Conductix-Wampfler’s global SR series of spring cable reels, is engineered to meet the energy and data supply requirements of moving machinery including overhead bridge cranes, gantries, mobile tables, aerial ladders, lifts, elevators and elevated work platforms. “Superior product quality is fundamental to reliable performance which in turn drives machine and plant uptime and ultimately, productivity and profitability,” says Jacques van Rooyen, Managing Director of Powermite. “Consequently it is our responsibility to supply our customers with world-class products that will perform efficiently over a long life cycle and minimise Opex to deliver lowest total cost of ownership.” The SR-Express (SR10-SR60) range combines the best qualities of Conductix-Wampfler’s cable reels. All components, from the cables and cable drum to the slip rings, springs and mounting flange, are manufactured from the best and most durable materials to ensure optimum operational efficiency over a long life cycle. Smart engineering ensures that the SR-Express spring cable reels are ready for use and facilitate maintenance to minimise costs and maximise uptime. As the product is supplied with the cable already installed and connected to the slip rings, it is a simple matter of plug-and-play. Featuring winding diameters from 170mm to 400mm, the cable drum is fitted with sealed ball bearings and is lubricated for life. The cable drum body and flanks are manufactured from robust zinc-plated steel; for operator safety, the flank edge has been designed to optimise cable arrangement during winding. The halogenfree PUR (polyurethane) cables, specifically designed for reeling applications, provide excellent wear resistance and high flexibility. Powermite (a division of Hudaco Trading (Pty) Ltd) Tel: (011) 271-0000 www.powermite.co.za

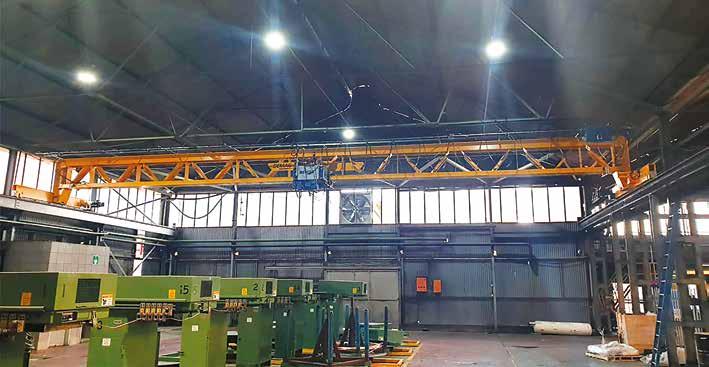
Demag, one of the largest suppliers of cranes in South Africa, recently supplied a 10-ton V-Girder crane to a local copper coil factory. The crane was a new production crane which was installed into an existing production bay. “Prior to recommending the V-Girder product, we conducted wheel loading comparisons for the company. The results showed that the lower wheel loadings of the V-Girder crane meant that no changes were required to the existing supporting gantry structure, thereby offering a substantial cost saving. Additionally, the V-Girder crane is 17% lighter than conventional box girder cranes” says Richard Roughly, Manager for Industrial Equipment Sales, at Demag. He adds, “The V-Girder crane offers benefits such as greater efficiency (as the oscillation of the crane girder dampens 30% faster than a conventional crane) resulting in an increased load handling rate. The 10-ton crane has a 17.5 metre span with a lifting height of 6 metres. The unique design of the V-Girder will also allow more light into the factory, creating a safer and better lit environment for technicians to operate in. "The V-Girder has double the structural design life compared with a conventional crane performing similar functions” While Demag is renowned for its competitiveness combined with high level of technical expertise, critical factors for this client in selecting the V-Girder also included the guarantee of delivery. Initial discussions enabled Demag to correctly assess the required technical specifications and manage the critical six-week delivery timeframe. “We believe the technical advantages of the V-Girder crane coupled with availability of crane sets, enabled us to meet the fast turnaround time from order to delivery that the client required. The importance of availability is often overlooked, but it does play a major role when production outputs are dependent on new equipment being installed within the required production window,” Richard concludes.
Demag Richard Roughly, Senior Manager, Sales & Marketing MH Tel: (011) 897-8123, Email: Richard.Roughly@demagcranes.com
The growing popularity of the Mato Products’ expanded offering has led the company to boost its service and repair facilities. Andrew Frank, operations manager at Mato Products, highlights the recent completion of the new spray-painting booth, which has doubled the firm’s capacity to finish refurbished items. Well known as a leader in conveyor belt lacing, the Multotec subsidiary also offers a range of belt cleaning solutions. “To keep up with market demand, we have expanded our spray booth significantly in terms of size and throughput capability,” More accommodating
says Andrew. “It can now accommodate components up to a length of 2,2 metres and provides a more productive environment for operators.”
This now allows for all repair and finishing work, even on the longer diagonal belt cleaners, to be spray-painted in-house, he adds. Importantly, this improves turnaround time, quality control and cost to customer. Multotec www.multotec.com

Mining industry equipment supply company Austin Engineering, suppliers of customised equipment to large global mining clients, mining contractors and original equipment manufacturers, and ETT, manufacturers of open pit mine support equipment and specialised mobile industrial equipment, have signed the beginning of a partnership agreement which sees them jointly marketing, selling and supporting their products through one company across Africa.
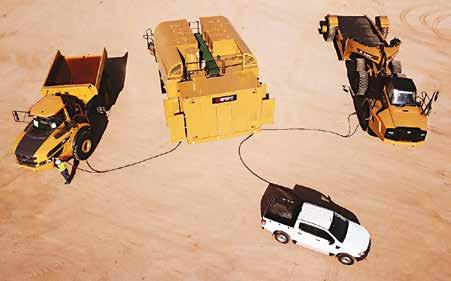
The joining of the two southern hemisphere industry mining equipment powerhouses follows months of discussion and planning to ensure that customers serviced by both companies remain the focus and that product quality and after sales service support are stronger than ever. Austin Engineering, an Australian Stock Exchange listed company with headquarters in Brisbane, has more than 50 years’ global experience in engineering and manufacturing equipment for the mining industry with operations in Australia, Asia, North and South America, and now South Africa. ETT, a privately owned South African company based in Richards Bay, with product already distributed in more than 20 countries around the world, celebrates 25 years of engineering excellence this year. The dispensing systems of ETT’s 100 Series Diesel Lube Truck are configured to customers’ needs and are capable of filling three vehicles simultaneously. ETT is a leader in the field of innovation, design and manufacturing of specialised mobile support equipment for mining and industry. The company has a proven record of providing solutions to improve productivity and safety in mining and industrial operations with its range of rear loading mining lowbed trailers, mining water trucks, fuel and lube trucks. ETT Tel: (035) 751-1630 Email: sales@ett.com, https://ett.com/
Long-term rental
Sumitomo Rubber Industries, a leading global tyre manufacturer, has taken delivery of 43 pieces of materials handling equipment on a 60-month rental facility from Goscor Lift Truck Company (GLTC). The machines have been deployed to work at Sumitomo’s world class manufacturing plant in Ladysmith, KwaZulu Natal. The fleet comprises 15 DEC 5-tonne electric tow tractors recently introduced to the local market by GLTC, 20 Doosan diesel forklifts with capacities from 1,8 to 7 t and eight Crown ESR5620-2.0 reach trucks with 11,5m lift heights. Jogen Moodley, Associate Manager Procurement at Sumitomo Rubber Industries, says the DEC electric tow tractors are deployed to transport work-in-progress material used for tyre production within the factory. He says the machines are powerful and smaller, and fit the bill for the factory’s confined working spaces. “Space constraints have created a challenge to move material within our factory. The DEC tow tractors can easily access confined spaces which cannot be accessed by conventional forklifts. Another key benefit is that these units use less gas or fuel, which in turn translates into both operational savings and fewer emissions, ensuring the health of our employees,” Jogen concludes. Goscor Tel: (011) 230-2600 Email: group@goscor.co.za www.goscor.co.za
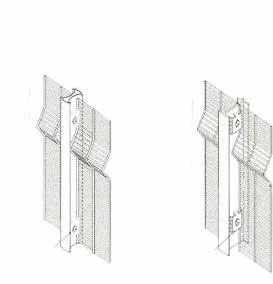
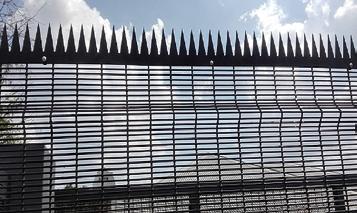
What is High Security Weld Mesh HIGH Security Weld Mesh is wire fused and welded at a Horizontal distance of 76.2mm and a vertical distance of 12.7mm also known as 35B/3510 where 3 denotes 3”(distance between vertical wires), 5 denotes 0.5” (distance between horizontal wires), and B or 10 denotes gauge of wire High security welded mesh Pallisade Gates Gate Automation Razor wire and more ....
Salient Features
• Difficult to Climb: The spaces between the Horizontal wires are too narrow for fingers to have grip • Impregnable: Extremely difficult to cut with a hand cutter as the beak of a wire cutter will not be able to penetrate the horizontal wires
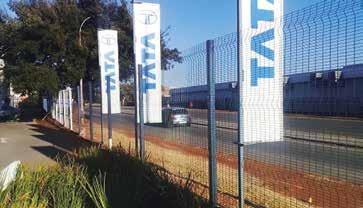
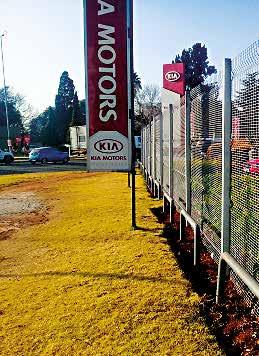
• Excellent Replacement option to Solid Wall as:
1. More economical than a solid wall 2. Faster to install than a solid wall 3. CCTV Camera has a clear view
• Further upgrade possible with electric security system • Anti-corrosive & low maintenance
Standards
• Manufactured according to BS EN 10016-2 • Wire Sizes in accordance with BS EN 10218-2 • Tolerance on Mesh Size in accordance wiht EN 10223-7 • Tolerance on Panel Size in accordance with EN 10223-4 • Welding Strength in accordance with BS EN 1461 • Zinc Coating in accordance with EN 10245-1 • Anti Corrosion in accordance with BS En 3900 E4/F4
Tensile Strength
• Wire has a tensile strenght of min 550 MPA


