
10 minute read
Wearable Technology to Monitor Training

BY JASON VESCOVI
Advertisement
Figure skating is unique as an Olympic sport. The physiological demands of a long program are similar to world-class performances in the mile (Duffield, Dawson, & Goodman, 2005), 3,000 m long track speed skating (Foster, deKoning, Rundell, & Snyder, 2000), and 400 m freestyle swimming (Zacca & de Souza Castro, 2012). Each of these sports last approximately four minutes and places a substantial demand on both the anaerobic and aerobic energy systems. Unlike the other sports, figure skating performances require complex motor skills, much like rhythmic gymnastics, to be performed effortlessly on the ice — all while simultaneously engaging the judges and audience.
Top-level athletes from most sports put in a substantial amount of hours training each year (Tønnessen et al., 2014), which translates into about 15-25 hours per week (i.e., duration/volume of training). However, when asked about their training, runners, speed skaters and swimmers are likely to provide details about the number of kilometers run, skated or swam (other indicators of training volume) as well as a fairly accurate breakdown of the proportion of high-intensity (i.e., anaerobic) and low-intensity (i.e., aerobic) work performed. This is important information for how training is planned (periodization) and the design of tapers for peak performances.
In contrast, there is a notable absence of knowledge about the duration/volume or intensity that is performed by figure skaters. The lack of, and sometimes resistance to, implementing a systematic approach to monitor the training demands of figure skaters results in a substantial gap for coaches, leaving them with only what they can observe. Fortunately, wearable technologies now exist that can be incorporated into the daily training environment and provide valuable insights about the training demands of figure skaters. These wearables offer important information about what occurs internally and opens substantial opportunities to enhance the training and ultimately performance of skaters.
The aim of this article is to highlight a few pieces of technology (there are too many available to discuss them all) that I have used regularly with elite figure skaters. I will also share some of the outcomes and discuss how these data can help enhance our ability to train athletes hard… and smart!
The two critical training components that can be routinely monitored for figure skaters are the cardiovascular and jumping demands. Figure 1 shows the heart rate during a long program (these look the same regardless of skating discipline and gender) and it is clear the demands are sufficiently high with heart rates hovering between 92-94 of maximum for the majority of the program. As a result, skaters need to perform a certain amount of their weekly training duration/volume working at near maximal intensity in order to become accustomed to those program demands. So, then we need a way to measure the training as well as have defined targets for the amount of high-intensity volume we want our skaters to achieve.
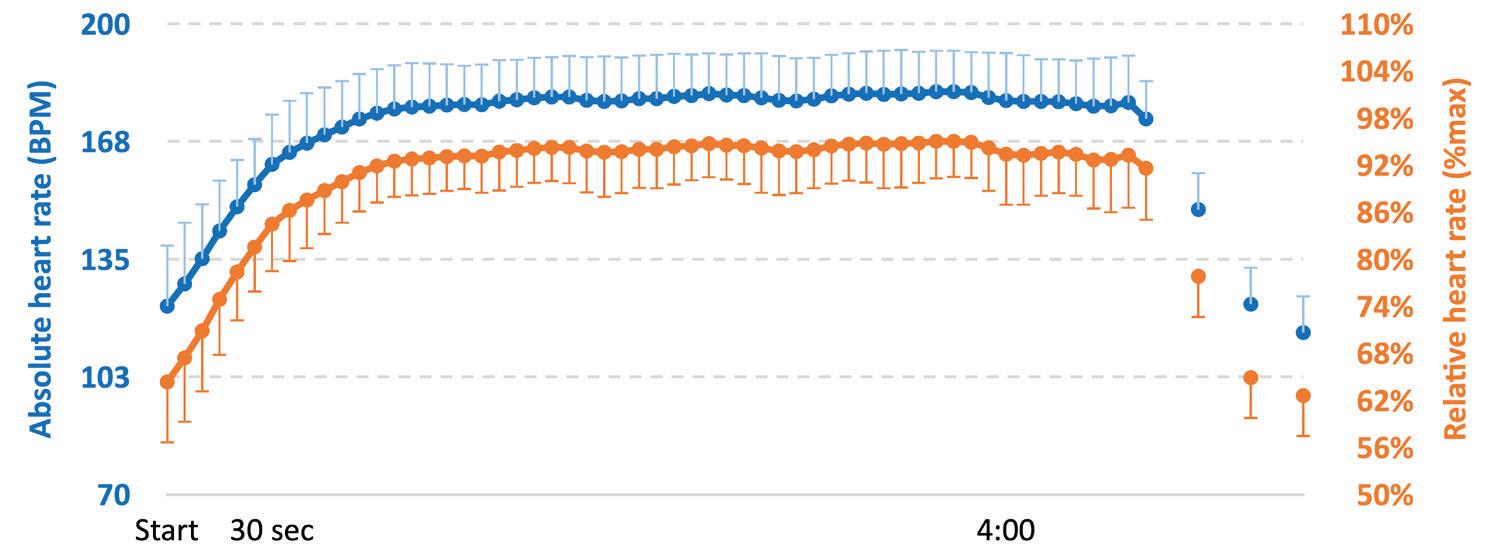
Figure 1*. Heart rate during long program.
The first thing that’s needed is a heart rate monitor. There are a wide range of products on the market, however I have used Polar H10 (NOTE: an important consideration is that heart rate monitors with watches are problematic for pairs and dance teams). Regardless of which brand/ model is used, heart rate monitors allow for the collection of heart rate data during on-ice sessions. The data is classified into different zones based on an individual’s own maximum heart rate. To determine maximal heart rate a graded exercise test is performed under the supervision of an exercise professional (Vescovi & VanHeest, 2018). It is important to find each skater’s own maximal value because they can span a large range (I’ve personally witness max heart rates between 188-213 bpm in figure skaters) and will subsequently impact the thresholds used to classify various heart rate zones. The most basic and commonly used heart rate thresholds are (Seiler & Kjerland, 2006):
• Intensity Zone 1: <80 — low intensity, below the anaerobic threshold
• Intensity Zone 2: 80-90 — moderate intensity, at the anaerobic threshold
• Intensity Zone 3: >90 — high intensity, above the anaerobic threshold
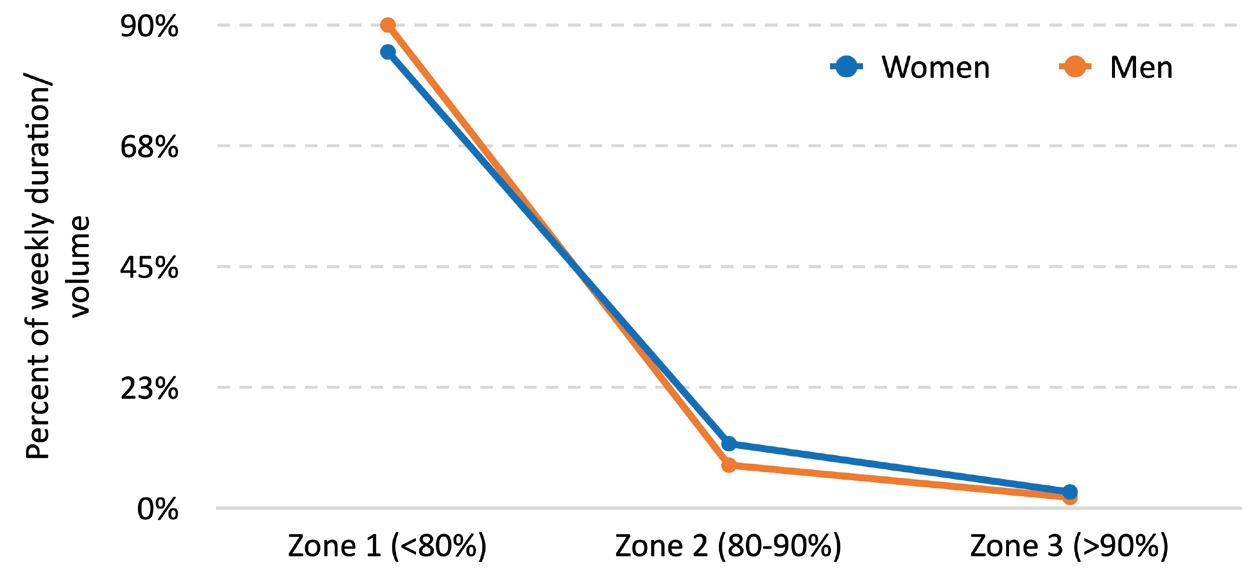
Figure 2*. Training intensity distribution of elite figure skaters.
With the hardware in place and heart rate zones defined, we can turn our attention to targets for the amount of weekly duration/volume we want skaters to achieve in intensity Zone 3. The scientific literature has revealed a small number of consistent patterns when describing the training intensity distribution of athletes (Stoggl & Sperlich, 2015) – which is simply the duration/volume spent in each of the intensity zones. The two most common patterns are called polarized (75-80/5/15-20) and pyramidal (70-75/15-20/5-10) training, where the proportions of weekly training duration/volume are distributed across intensity Zone 1, Zone 2, and Zone 3, respectively. Work I have done with elite figure skaters revealed the natural distribution resembled pyramidal training, but with a greater proportion of Zone 1 (85-90) and smaller amounts of Zone 2 (8-12) and Zone 3 (2-3) than the weekly duration/volume which is commonly reported for other endurance sports (Figure 2). This highlights a gap that can be addressed with additional high-intensity off-ice training. For example, if a skater trains 20 hours per week (1,200 minutes), then 5 in intensity Zone 3 would be a target of 60 minutes for the week. Since about half of that is already accumulated during on-ice sessions, the off-ice training can be designed to make up the difference (30 minutes) and achieve the overall weekly target. Therefore, the knowledge of what a skater does naturally with the help of a heart rate monitor provides a way to tailor their cardiovascular training.
From my perspective, monitoring jumping demands is the equivalent to tracking pitch counts in baseball – it is necessary to protect the athlete from potential overuse injuries and maximize the longevity of their career. The commercially available options to monitor jumping are limited for use with figure skaters. The two most promising technologies are Vert (www.myvert. com) and Hexoskin (www.hexoskin. com) — each having their upside and downside.
Vert
Vert is an inexpensive device and has a simple, easy to understand interface with its app. It is widely used with volleyball and is highly accurate for counting the number of jumps performed on the court (MacDonald, Bahr, Baltich, Whittaker, & Meeuwisse, 2017). However, the high rotation velocity of figure skaters while jumping causes problems for the device and substantially reduces the accuracy of counting how many are performed.
On the other hand, Hexoskin is an extremely sophisticated device (it was originally developed with the Canadian Space Agency for astronauts) that allows the number of jumps to be counted as well as measures the landing forces (g-forces). Unfortunately, it is expensive (400-500 USD) which may be prohibitive to implement on a large scale with figure skaters.
Tracings provided by Hexoskin for an entire on-ice practice session and a long program (see Figures 3 & 4 in the print version) show each ‘spike’ is the landing from a jump with some of those peaks reaching more than eight g-force — in other words, each time a skater lands it has the impact of up to (and sometimes more than) eight times their body mass.
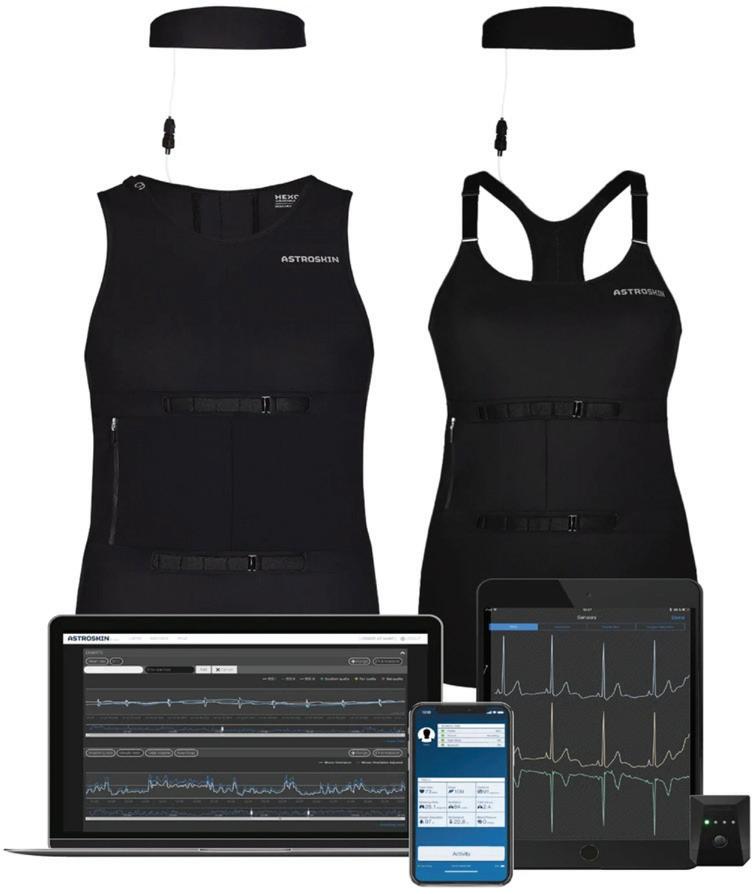
Hexoskin
In comparison, individuals might experience 2-2.5 times their body mass while running (Kluitenberg, Bredeweg, Zijlstra, Zijlstra, & Buist, 2012); between 3-6 times their body mass when dropping from 30-90 cm box and landing on both legs (Seegmiller & McCaw, 2003); or about 4-4.5 times body mass when dropping from a very low height (20 cm), but landing on a single leg (Huurnink, Fransz, Kingma, de Boode, & Dieen, 2019). So, the landing forces are compounded for figure skaters because of single legged landings onto a hard surface, with a narrow blade attached to a rigid boot.
Also impressive with Hexoskin is the high-resolution outcomes – even a combination jump can be easily identified (just before 12:22 in Figure 4). Data from these types of wearable devices can provide valuable insights into the jump volume and intensity in figure skating. In turn, coaches could fluctuate between high volume and low volume jumping days in order to allow for sufficient recovery of the neuromuscular system.
Monitoring training demands is slowly becoming more accepted within the figure skating community. Having the tools available to collect relevant information is a key part of creating individualized training programs that serve to enhance performance and minimize injury risk. It is also critical to the process to have personnel that can appropriately interpret the data and ensure the outcomes are effectively incorporated into the athlete’s annual training plan. The coordination between sport science and coaching who integrate wearable technologies will ultimately lead to successful outcomes for the figure skaters.
*All figures are from the author and his work with national and international figure skaters.
References
Duffield, R., Dawson, B., & Goodman, C. (2005). Energy system contribution to 1500- and 3000-metre track running. Journal of Sports Sciences, 23(10), 993-1002.
Foster, C., deKoning, J.J., Rundell, K.W., & Snyder, A.C. (2000). Physiology of Speed Skating. In W.E. Garrett Jr & D. T. Kirkendall (Eds.), Exercise and Sport Science (pp. 885-893). Philadelphia: Lippincott Williams & Wilkins.
Huurnink, A., Fransz, D. P., Kingma, I., de Boode, V. A., & Dieen, J. H. V. (2019). The assessment of single-leg drop jump landing performance by means of ground reaction forces: A methodological study. Gait and Posture, 73, 80-85.
Kluitenberg, B., Bredeweg, S. W., Zijlstra, S., Zijlstra, W., & Buist, I. (2012). Comparison of vertical ground reaction forces during overground and treadmill running. A validation study. BMC Musculoskeletal Disorders, 13, 235.
MacDonald, K., Bahr, R., Baltich, J., Whittaker, J. L., & Meeuwisse, W. H. (2017). Validation of an inertial measurement unit for the measurement of jump count and height. Physical Therapy in Sport, 25, 15-19.
Seegmiller, J. G., & McCaw, S. T. (2003). Ground Reaction Forces Among Gymnasts and Recreational Athletes in Drop Landings. Journal of Athletic Training, 38(4), 311-314.
Seiler, K.S., & Kjerland, G.O. (2006). Quantifying training intensity distribution in elite endurance athletes: is there evidence for an “optimal” distribution? Scandinavian Journal of Medicine and Science in Sports, 16(1), 49-56.
Stoggl, T. L., & Sperlich, B. (2015). The training intensity distribution among well-trained and elite endurance athletes. Frontiers in Physiology, 6, 295.
Tønnessen, E., Sylta, O., Haugen, T. A., Hem, E., Svendsen, I. S., & Seiler, S. (2014). The road to gold: training and peaking characteristics in the year prior to a gold medal endurance performance. PLoS ONE, 9(7), e101796.
Vescovi, J.D., & VanHeest, J.L. (2018). Physiology and physiological assessment of figure skating. In J.D. Vescovi & J.L. VanHeest (Eds.), The Science of Figure Skating (pp. 1-12). London: Routledge.
Zacca, R., & de Souza Castro, F.A. (2012). Bioenergetics Applied to Swimming: An Ecological Method to Monitor and Prescribe Training Bioenergetics (pp. 159-180): InTech.
