



























































As the saying goes, desperate times call for desperate measures. Actions that might have been rejected under normal circumstances may be seen as the best choice now.
It could be argued that with the COVID-19 pandemic we live in such desperate times - and are apparently headed into more as countries struggle with containing a second wave of infections. Financial resources of governments worldwide are dwindling as they attempt to prop up their economies. ey are pumping billions into sustaining businesses hit hard by closures and into health services coping with overstretched hospitals.
However long this pandemic lasts – and who knows – there will a erwards be a road to recovery, both metaphorically and physically.
If anything good has come out of this pandemic, it is a reinforcement of just how important transportation is to, not just national economic health, but also the health of citizens. is is especially true in urban areas where inner city and suburban roads have been repurposed from strictly vehicular use to non-vehicular use.
In some cities, complete thoroughfares have been closed to vehicles and local bylaws
4: ROLLING DYNAMIC TESTING
A Texas airport is saved from major runway reconstruction
8: SOFTENERS vs REJUVENATORS
ere are choices for maintaining aged bituminous binders
12: MICROPLASTICS DETECTION
Sweden’s National Road and Transport Research Institute reviews the research
EDITOR: David Arminas
CONTRIBUTING EDITORS: Mike Woof, Geoff Hadwick
SUB-EDITOR: EKH Services
PRODUCTION MANAGER: Nick Bond
OFFICE MANAGER: Kelly Thompson


ere are many ways to test for microplastics – some methods better than others (photo: David Arminas)
quickly amended or passed to allow for outdoor café and restaurant tables on the pavement. With winter now arriving in the northern hemisphere, innovative plastic bubbles are popping up to protect diners from the cold.
As people shun public transport in fear of COVID infection, more bicycles and scooters – many of them electric – are cruising the streets. Walking to work or the shops is much more common. To facilitate this, entire tra c lanes are being appropriated for these increasingly popular mobility choices.
Ordinary people, not just academics and consultants, are now questioning urban design, from housing and retail space, to road layout and public transportation connectivity. Where does this leave the road design and construction sector?
Within the pages of this year’s Road Surface Technology Review, there are many examples of how innovation is driving our sector, everything from non-destructive pavement testing to data collection. For example, one company is testing bre optics to monitor
17: SURFACE INSPECTIONS
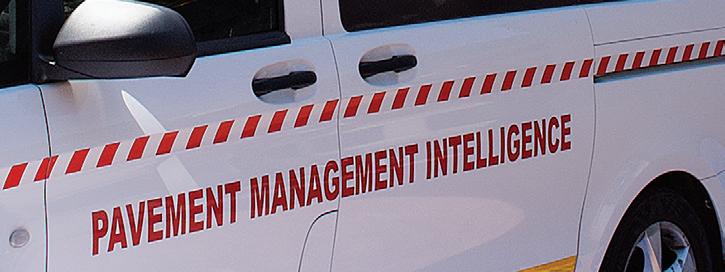
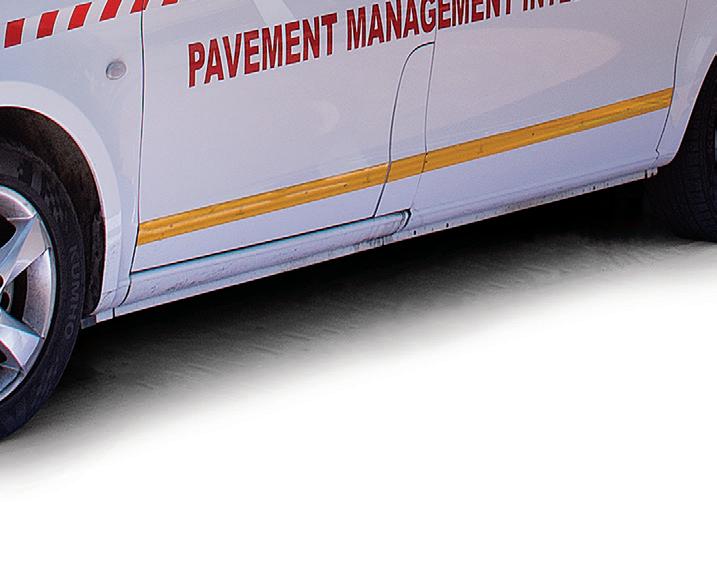
South African authorities are using a Network Survey Vehicle for inspections
23: ACOUSTIC SENSING
Fibre-optic cables collect data to help maintenance scheduling
25: COMPACTION TECHNOLOGY
A review of the latest equipment to ensure a perfect road surface
DESIGNERS: Simon Ward, Andy Taylder
CIRCULATION & DATABASE MANAGER: Charmaine Douglas
WEB ADMINISTRATORS: Sarah Biswell, Tatyana Mechkarova
INTERNET, IT AND DATA SERVICES DIRECTOR: James Howard
MANAGING DIRECTOR: Andrew Barriball
PUBLISHING DIRECTOR: Geoff Hadwick CEO: Roger Adshead ADVERTISEMENT SALES:
PUBLISHED BY:



vibrations from road surfaces to relay all kinds of data about the use and health of pavement. Environmental concerns will become more important. We have an excellent review of the literature concerning research on microplastic pollution from road surfaces, including road markings.
As nancing for road construction and improvements takes a hit, alternatives to milling and repaving thousands of kilometres of highway will be in demand. Our article on the advantages of slurry surfacing, especially microsurfacing, is extremely timely.
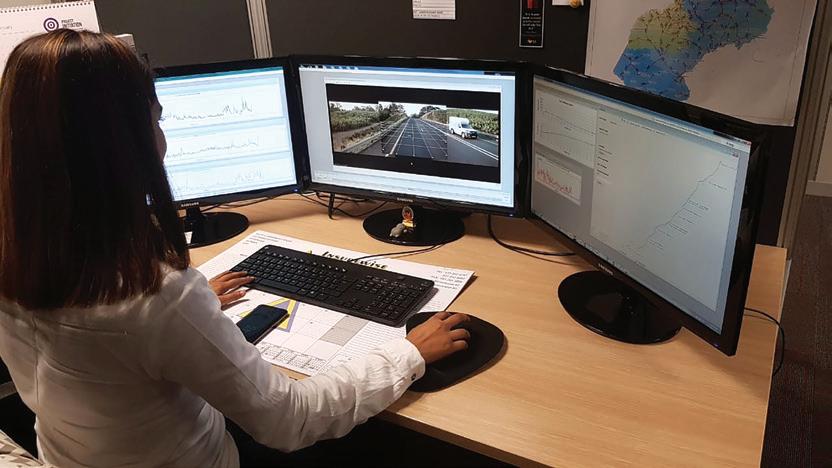
Visual road surface inspections can be costly and time-consuming. We see how two provincial road authorities in South Africa have routinely been undertaking semi-automated, full-spectrum road surface surveys using a Network Survey Vehicle. Hundreds of kilometres of surface ratings and gradings can be done from the convenience of an o ce desktop.
As countries struggle to get back on their feet post-pandemic, they will be looking to the road sector to help them maintain a highquality road network but on much-reduced spending. As shown by our articles this year, we have the experience, insight and research capability to help achieve this.
David Arminas, EDITOR darminas@ropl.com
28: COMMAND PERFORMNCE
Caterpillar explains its semi-autonomous compaction
30: AI PAVEMENT INSPECTION
Data-driven pavement decisions in the US city of Savannah
32: SLURRY SURFACING
Alternative surfacing, especially microsurfacing, gains ground
Iterchimica’s research, in collaboration with the University of Calabria, applied various testing methods to study the chemical impact of different types of recycling agents on the bitumen’s features. Several recycling agents were investigated using a variety of physical and chemical testing methods.
According to the results, all the recycling agents were capable of recovering the physical properties to a varying extent. But not all of them were capable of restoring the chemical features, as found by using different chemical testing analyses.
Among the testing methods, atomic force microscopy (AFM) revealed how a rejuvenator acts to restore the chemical structure and components of an aged bituminous binder. Depending on the type of the measurement, non-contact mode or pulsed-force mode, the results can be presented either by surface topography image or phase image (see box).
In Figure 1, the top images are phase images and the bottom images are surface topography images.
Column A in Figure 1 is virgin bitumen that hasn’t been aged.
Column B shows how the chemical features of a virgin bituminous binder were changed after an ageing process. In this case, the images are after both short-term and longterm ageing that were done in a laboratory.
The performance of the rejuvenating agents on the aged bituminous binder is shown in column C. In fact, the images in column C are those of column B but taken after a rejuvenator has been added to the aged bitumen.
Atomic force microscopy – sometimes called scanning force microscopy – is a very high-resolution-type of scanning probe microscopy. Resolution is in the order of fractions of a nanometre, making it more than 1,000 times better than the optical diffraction limit.
Unlike the electron microscope, which provides a two-dimensional projection or a two-dimensional image of a sample, the AFM provides a three-dimensional surface profile. Also, in order to be seen, the samples under observation using AFM need no special treatment, such as metal or carbon coatings, which would irreversibly change or damage the sample.
AFM, in normal contact mode, generates images by scanning a small cantilever over the surface of a sample. The sharp tip on the end of the cantilever contacts the surface, bending the cantilever and changing the amount of laser light reflected into the photodiode. The height of the cantilever is then adjusted to restore the response signal, resulting in the measured cantilever height tracing the surface.
But there are several modes of AFM, depending on the information required from the sample.
In non-contact mode – sometimes called tapping mode – the tip of the cantilever does not contact the sample’s surface.
The cantilever is oscillated at its resonant frequency (frequency modulation), or just above (amplitude modulation), where the amplitude of oscillation is a few nanometres (<10nm), down to a few picometres.
Pulsed-force mode adds another dimension to AFM by measuring the elastic, electrostatic and adhesive properties of a sample under investigation. Scanning speed is comparable to that for the contact mode.
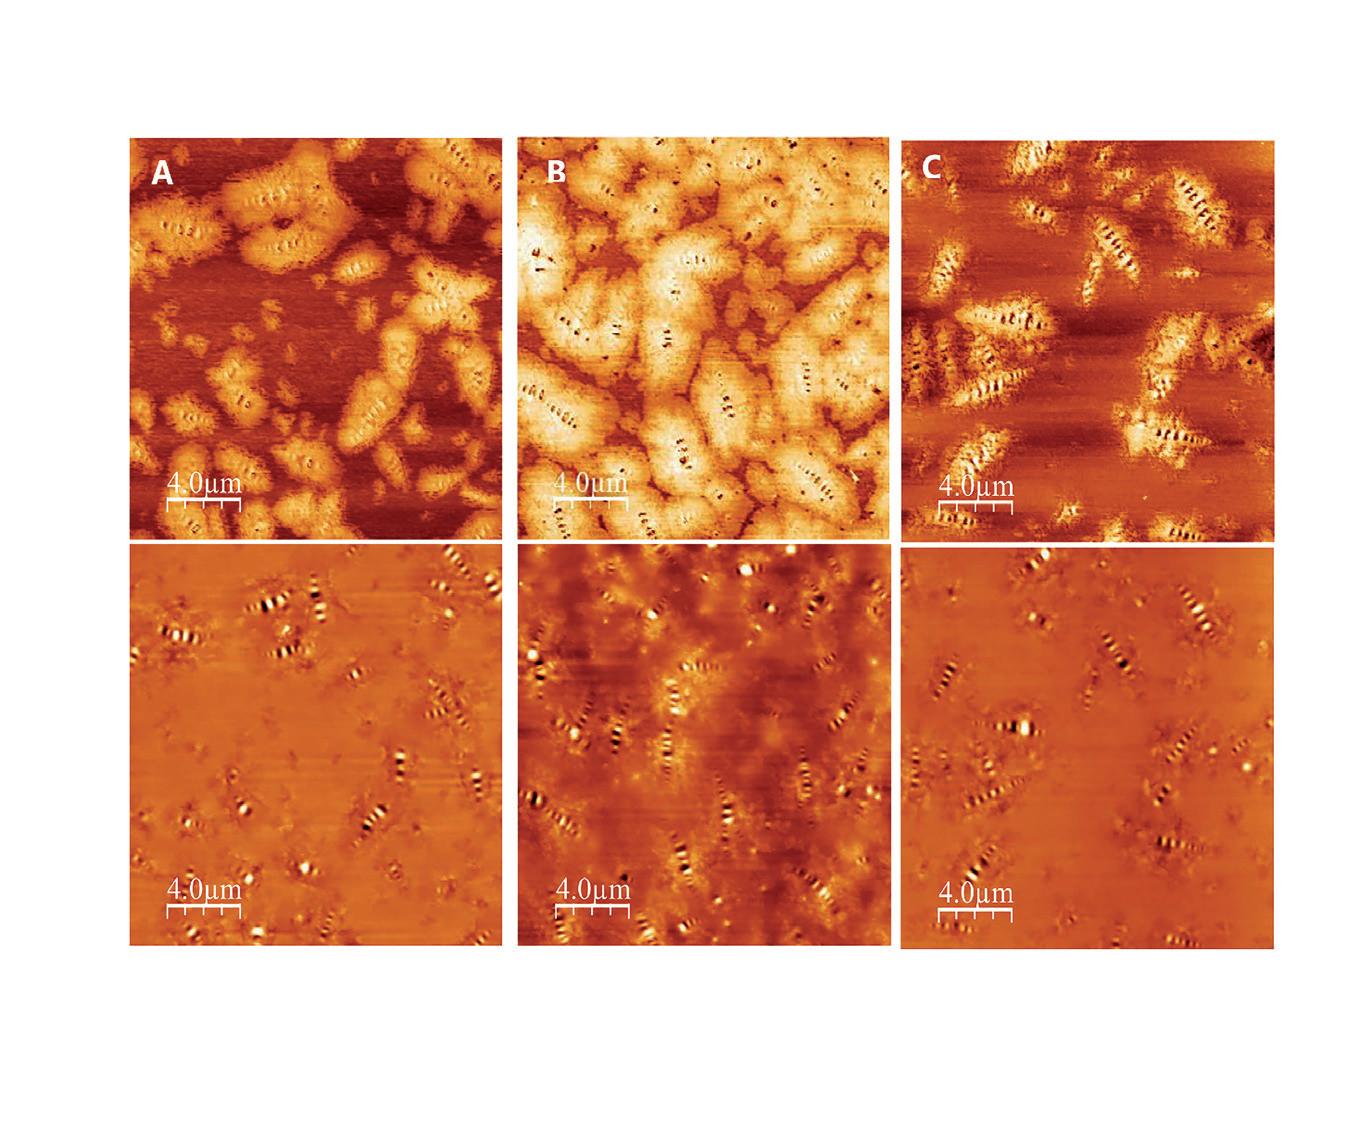
there is a considerable likeness in the images, pointing to rejuvenation of the aged bitumen, as seen in column B. However, it should be noted that chemical scientists are divided over what they are actually seeing in column C. Some scientists believe that the beeshaped structures are asphaltene and other researchers believe that they are petroleum waxes. Asphaltenes and waxes are a general category of solids and cover a wide range of materials.
Asphaltenes, and resins, are large molecules consisting mostly of hydrogen and carbon, with one to three sulphur, oxygen or nitrogen atoms per molecule. Asphaltenes tend to form aggregates, called micelles, in hydrocarbon solutions. The basic structure is composed of rings, mainly aromatics, with three to 10 or more rings per molecule.
Meanwhile, there are two general types of petroleum waxes. Waxes composed primarily of normal alkanes crystallise in large, flat plates – macrocrystalline structures – and are called paraffin waxes. Waxes composed primarily of cycloalkanes and i-alkanes crystallise as small needle structures and are called microcrystalline waxes.
Yet, regardless of what these features are in the rejuvenated bitumen, the aged bituminous binder plus a real rejuvenator would provide the same image of the virgin bituminous binder as reference¹.
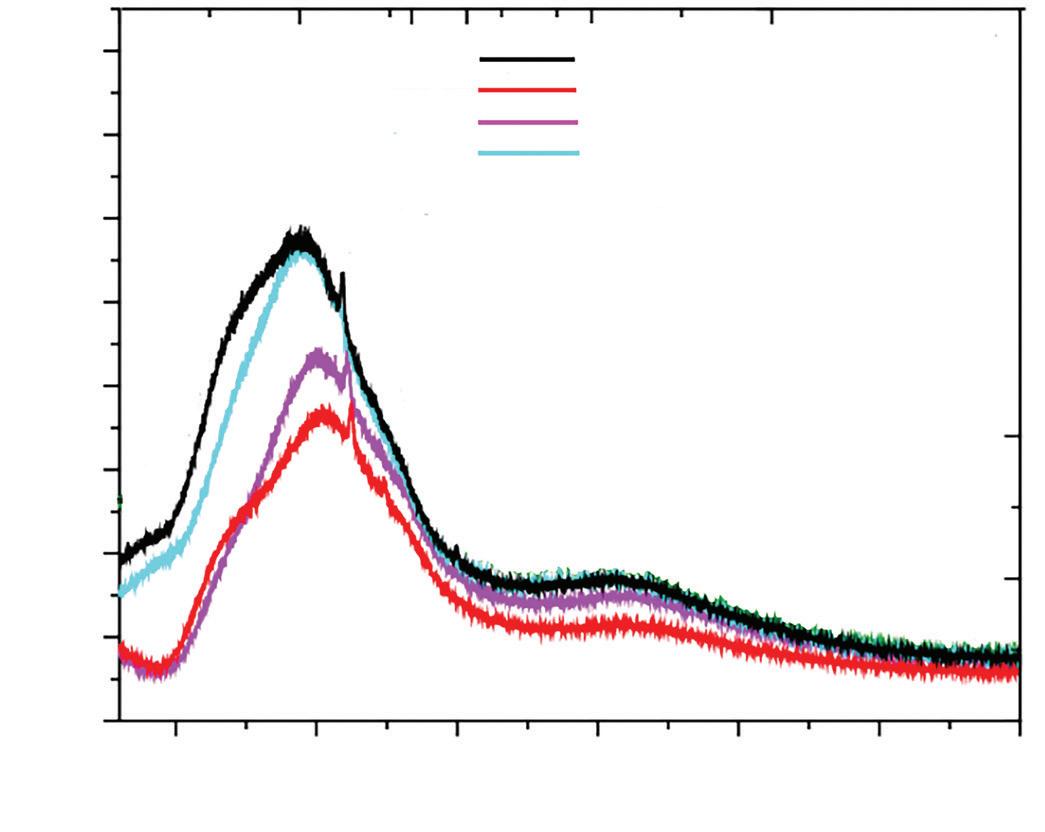
In addition to AFM, X-ray diffraction (XRD) was another technique used for investigating the performance of the recycling agents. XRD is a non-destructive method often employed to gather information about the microstructure and crystallite parameters of asphalt mixtures and a defined atomic



A rejuvenator has the capacity to partially restore the lost chemical features of the reclaimed asphalt and the properties of its old bitumen
arrangement5. e technique is based on the interaction between the incident wave, or X-rays, and the crystal lattice.
Figure 2 shows how the di erent concentration of a rejuvenator impacts on the chemical properties of an aged bituminous binder.
anks to advances in industrial chemistry, several types of recycling agents are available for recycling asphalt at di erent temperature levels. ese can be as cold, warm or hot mix asphalt.
Cold asphalt recycling agents are composed mainly of so bituminous binders or binder from any origin as well as various additives including ux oils. ey are considered as an alternative solution for bitumen emulsions in cold asphalt recycling. While these bituminous emulsions are associated sometimes with practical di culties, alternative recycling agents can be used for a variety of paving applications including maintenance and rehabilitation work. Iterchimica’s Iterlene ACF 1000 HP has been successfully used also for construction of the binder layer of a low-tra c-volume road in Spain, providing a new sustainable technology for road-paving applications6.
Nowadays, hot mix asphalt recycling is the most common recycling practice. Hot mix recycling agents with a high boiling point can be added either to the hot bituminous binder or to reclaimed asphalt materials. Iterchimica’s Iterlene ACF 1000 and ACF 2000 belong to the rejuvenator category of recycling agents.
In addition to cold mix and hot mix recycling agents, there is a third category that also enables the asphalt production at a moderate level of mixing/laying temperatures (WMA), providing its workability. For this purpose, Iterchimica o ers two products: Iterlow RS and Iterlow V, to be used according to the production temperatures.
* e authors are Shahin Eskandarsefat, a senior researcher at Iterchimica, and Loretta Venturini, Iterchimica’s scienti c and strategic development director.
**Maltenes are the n-alkane (pentane or heptane)-soluble molecular components of asphalt, which is the residue remaining a er petroleum re ners remove other useful derivatives such as gasoline and kerosene from crude oil. Asphaltene compounds are the other primary component of asphalt.
References
[1] V. Loise et al., A rheological and microscopic study. Proceedings of rst Macedonian Road Congress, 2019.
[2] S. Ashimova et al., Organic-based recycling agents for road-paving applications in coldclimate regions. International Journal of Pavement Engineering, 2020.
[3] European Asphalt Pavement AssociationEAPA Position paper, Recommendations for the use of rejuvenators in hot and warm asphalt production. Online at: https://eapa. org/eapa/, 2018.
[4] I. Soohyok, et al., Impact of rejuvenators and performance and engineering properties of asphalt mixtures containing recycled materials. Construction and Building Materials, 2014.
[5] Chemistry LibreTexts, Powder-Xray di raction. Online at https://chem.libretexts. org/, 2020.
[6] S. Eskandarsefat et al., 100% cold recycled asphalt mixture using a multi-functional rejuvenator/binder. Proceedings of Road and Environment Conference, 2019.
Sweden’s VTI recently published an update on the research literature concerning microplastics from tyre and road wear; the following is an edited version of Chapter 6,Sampling Methods
The push towards greener, more sustainable roads is improving our knowledge about microplastic pollution. We know it comes from a myriad of sources – from tyres to highway paints – and has a wide variety of dispersal patterns allowing it into the ecosystem. Yet research into microplastics specifically focusing on roads remains sparse and often obscure.
This is why Sweden’s National Road and Transport Research Institute – VTI – has brought together detailed information about what research exists. Microplastics from Tyre and Road Wear: a literature review is an invaluable sampler for highways authorities, road concessionaires and contractors. Chapter 6 covers sampling methods.
Sampling for tyre particles and road wear particles differs according to the medium in which the particles exist. A simple method for sampling materials from tyre tread is to cut pieces using a knife. Another commonly used method is to use a file to remove material, which gives coarse tyre filings rather than whole pieces. Samples are also often frozen using liquid nitrogen, after which they are ground into finer materials to be analysed for chemical composition.
A common denominator for all these methods is that they do not reflect actual tyre wear. They tell nothing about the physical characteristics of the wear particles, such as shape or size, but only provide information about their chemical composition. Naturally, the metal in knives and files can contaminate the samples. But as long as the focus of the analyses is microplastics or other organic compounds, this is a minor problem.
A more realistic sampling of generated tyre wear particles requires sampling of wear dust either from a laboratory environment, where tyres are worn against a road surface from a
real road, or under similar conditions. The Korea Institute of Machinery and Materials has a test rig where a tyre is worn against a drum covered in sandpaper. The drum is enclosed in a chamber through which purified air flows. Samples are collected from the air, downstream from the contact point between the tyre and the sandpaper-covered drum. The main focus is on PM10 and smaller particles.
There are at least two types of large-scale test facilities where real road surfacing materials are used to study both tyre wear and road surface wear.
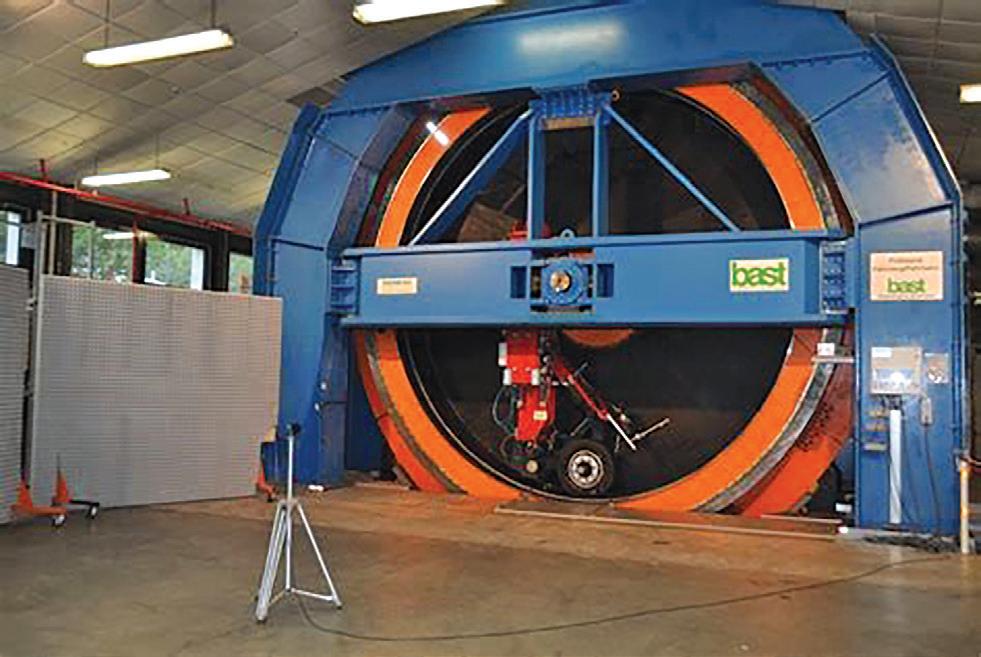
In Germany, BASt (Bundesanstalt für Straßenwesen/Federal Highway Research Institute) and the Karlsruhe Institute of Technology have standing drums with road surfacing on the inside which are equipped with an internal wheel rig (Figure 1). The
equipment was used in the European Union’s Re-tyre project, the classification of re-treaded truck tyres. It was also used to study wear particles from tyres using cyclone vacuum cleaners to collect dust behind the wheels. The collection efficiency was low and the study focused on the inhalable fraction of the dust (PM10).
As only small amounts of this fraction were collected, coarser particles up to 150µm were also collected for analysis. At present, no methods specifically for microplastics from tyre wear have been published.
The other type of facility used for studies of road surface and tyre wear is the Circular Road Simulator of Sweden’s VTI. It consists of a 16m-long circular track that can be covered in any road surface material (Figure 2). The machine rotates around a central vertical axle on which six-wheel axles are
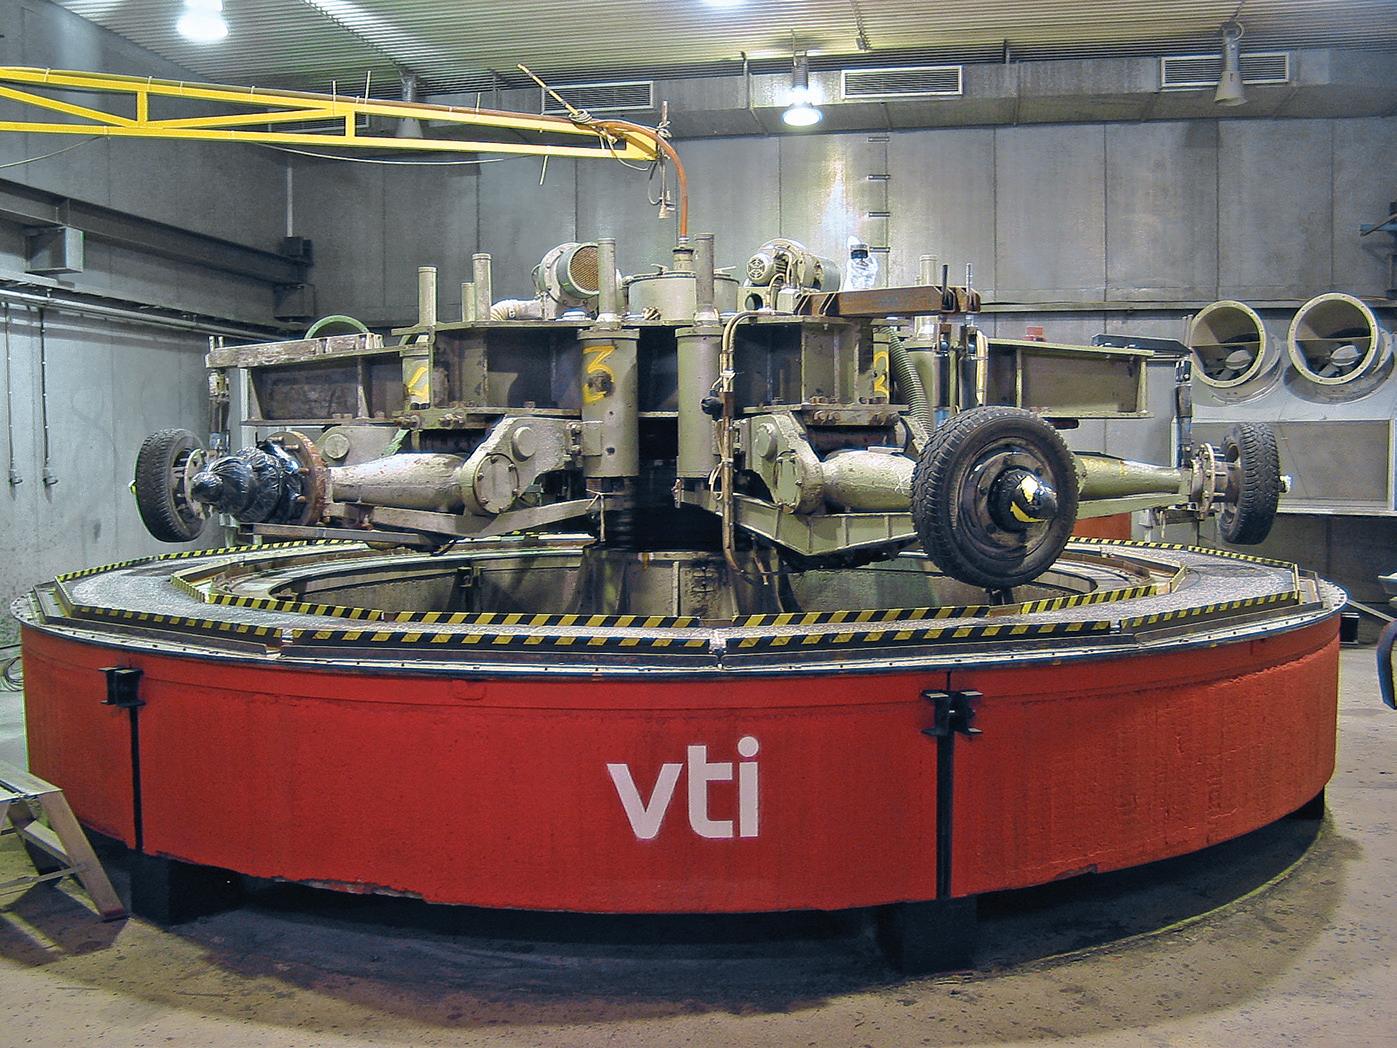
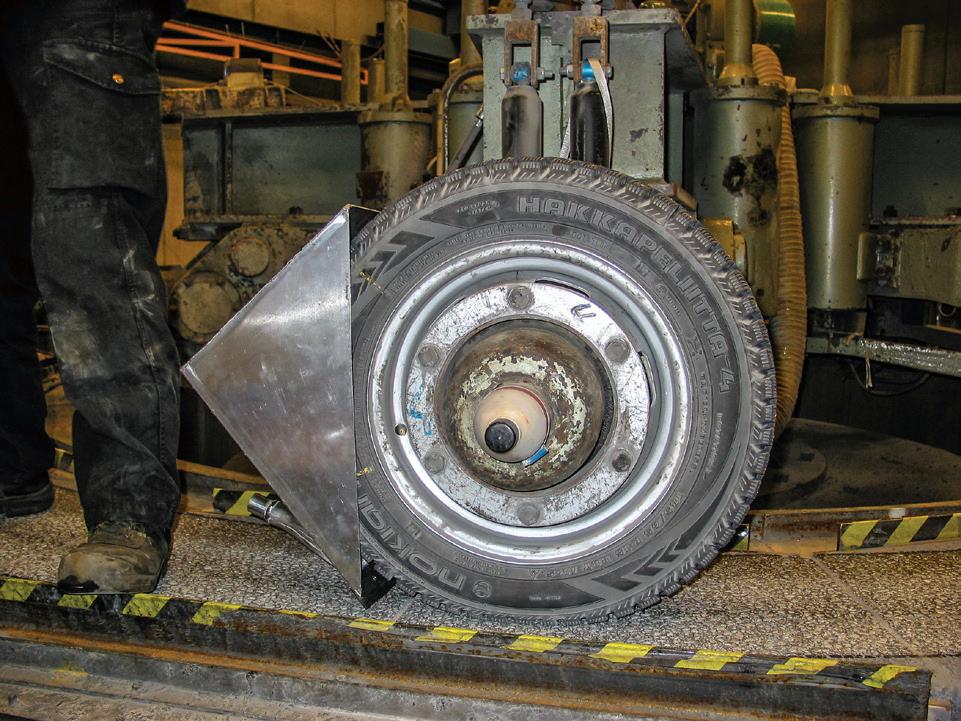
mounted. Four of the axles are powered, in this case by electric motors.
Different types of personal car tyres can be mounted on the wheel axles. During testing, the wheels are lowered onto the track until the desired axle load is reached and the wheels then drive the rotation of the machine. The speed can be varied continuously to up to 70kph. At speeds above 30kph, an eccentric movement can be activated causing the wheels to move across almost the entire width of the track, rather than follow the same line.
During tests using the Circular Road Simulator, the tyres follow a fairly tight circular track. The inner edge of each tyre travels slightly more slowly over the surface than the outer edge. This results in a small rotational slip of the contact surface which is why the tyre wear in the simulator is greater than in real driving.
Since the early 2000s, the simulator has also been used for generation and sampling of wear particles with a focus on the inhalable fraction – PM10. The majority of the studies have focused on the wear caused by studded tyres on different types of road surfacing materials. Some studies on tyre wear have also been carried out, although without all the wear materials being collected for analysis.
Particles larger than PM10 have been collected by the simulator using wet vacuum cleaners connected to a device behind one of the tyres (Figure 3). This method may not be optimal for the collection of samples of microplastics from tyre wear. Both the hoses between the device, the vacuum cleaner and the vacuum cleaner container are made of plastic which may contaminate samples.
A number of vehicle-based systems have been developed to sample emissions from the contact between tyres and the road
surface. Like most laboratory methods, these are designed to study emissions and characteristics of PM10. Studies by the Tyre Industry Project (see box) used cyclone vacuum cleaners with specially designed mouthpieces mounted behind the tyres.
Examples of systems include the Finish Sniffer for measuring behind the left back wheel of a van and the TRAKER which measures particle concentrations behind both front wheels. This type of method has been copied by a number of researchers. However, particles have generally not been collected to determine a source.
A similar measuring vehicle has been used in the Republic of Korea to collect particles for elementary analysis and electron microscopy. Bit-only PM10 has been collected, which means that a large proportion of tyre wear has probably been missed. Other studies suggest that larger particles make up the main part. Without exception, the collection methods used are designed to collect mainly inhalable particles.
There are multiple studies concerning resistance and wear of road markings. These are to assess whether they meet physical requirements and to evaluate the wear of new markings. However, no studies were found focusing on road marking wear specifically for environmental purposes. Some test facilities designed for other particles could be used to test the wear of road markings by tyres.
In the field, tyre and road wear samples can be collected in a similar way as for soil samples which are then sieved and separated from other types of particles.
Studies where the main aim is to analyse road dust simply use a dustpan and brush or a basic vacuum cleaner. In some cases, pre-
determined areas are sampled to determine the amount of material per square metre. In other cases, sampling focuses on collecting a particular sample volume without any relation to the size of the sampled area.
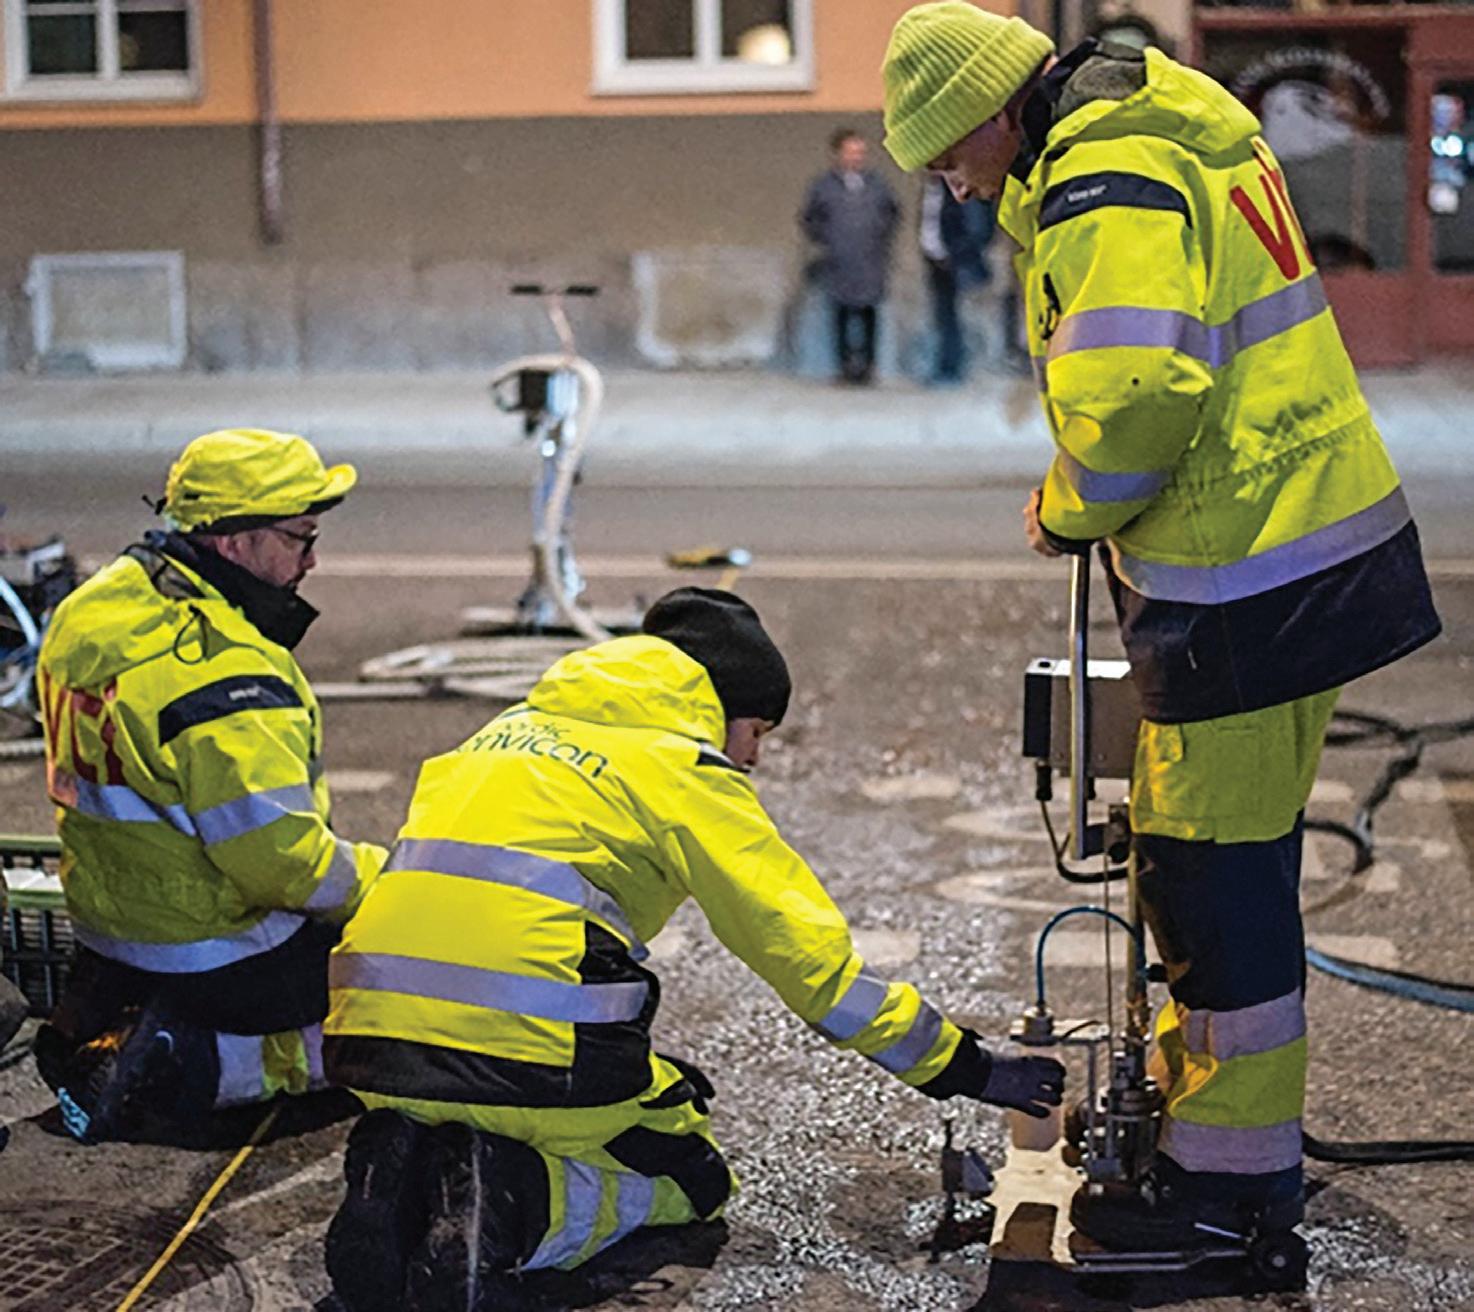
For collecting dust from a road surface, VTI uses a proprietary machine called the Wet Dust Sampler (WDS). A prototype was used from 2011 until 2014 when an improved version, the WDSII, was developed. Two copies of a slightly modified and further improved version, the WDSIII, have been built and sold to Finland and Norway.
The WDSIII washes a known area of road using a known amount of pressurised water after which it is transferred into a sample bottle using air pressure (Figure 4). The collected dust samples can also be analysed for physical and chemical characteristics.
For many years, the focus of the analyses was on the amount of dust, size distribution and proportion of organic materials. It was aimed at evaluating different methods for decreasing particle concentrations in the road environment. Since 2017, samples have been collected to also determine the microplastic content of road dust. In Norway, the WDS has also been used in studies of organic compounds associated with tyre rubber.
One of the samplers for road surfaces most commonly mentioned in the literature is based on a vacuum pump which sucks air through a deposition chamber, a PM10 separator and a filter for PM10 with 25 litres per minute. Samples are collected over 1m² using a hose nozzle.
Another road dust sampler uses a leafblower to blow air onto a section of road surface. A particle sampler is connected to a hood between the blower’s nozzle and the road surface. The sampler collects PM10 on a filter for analysis (Figure 5). Samples have been collected for elementary analysis
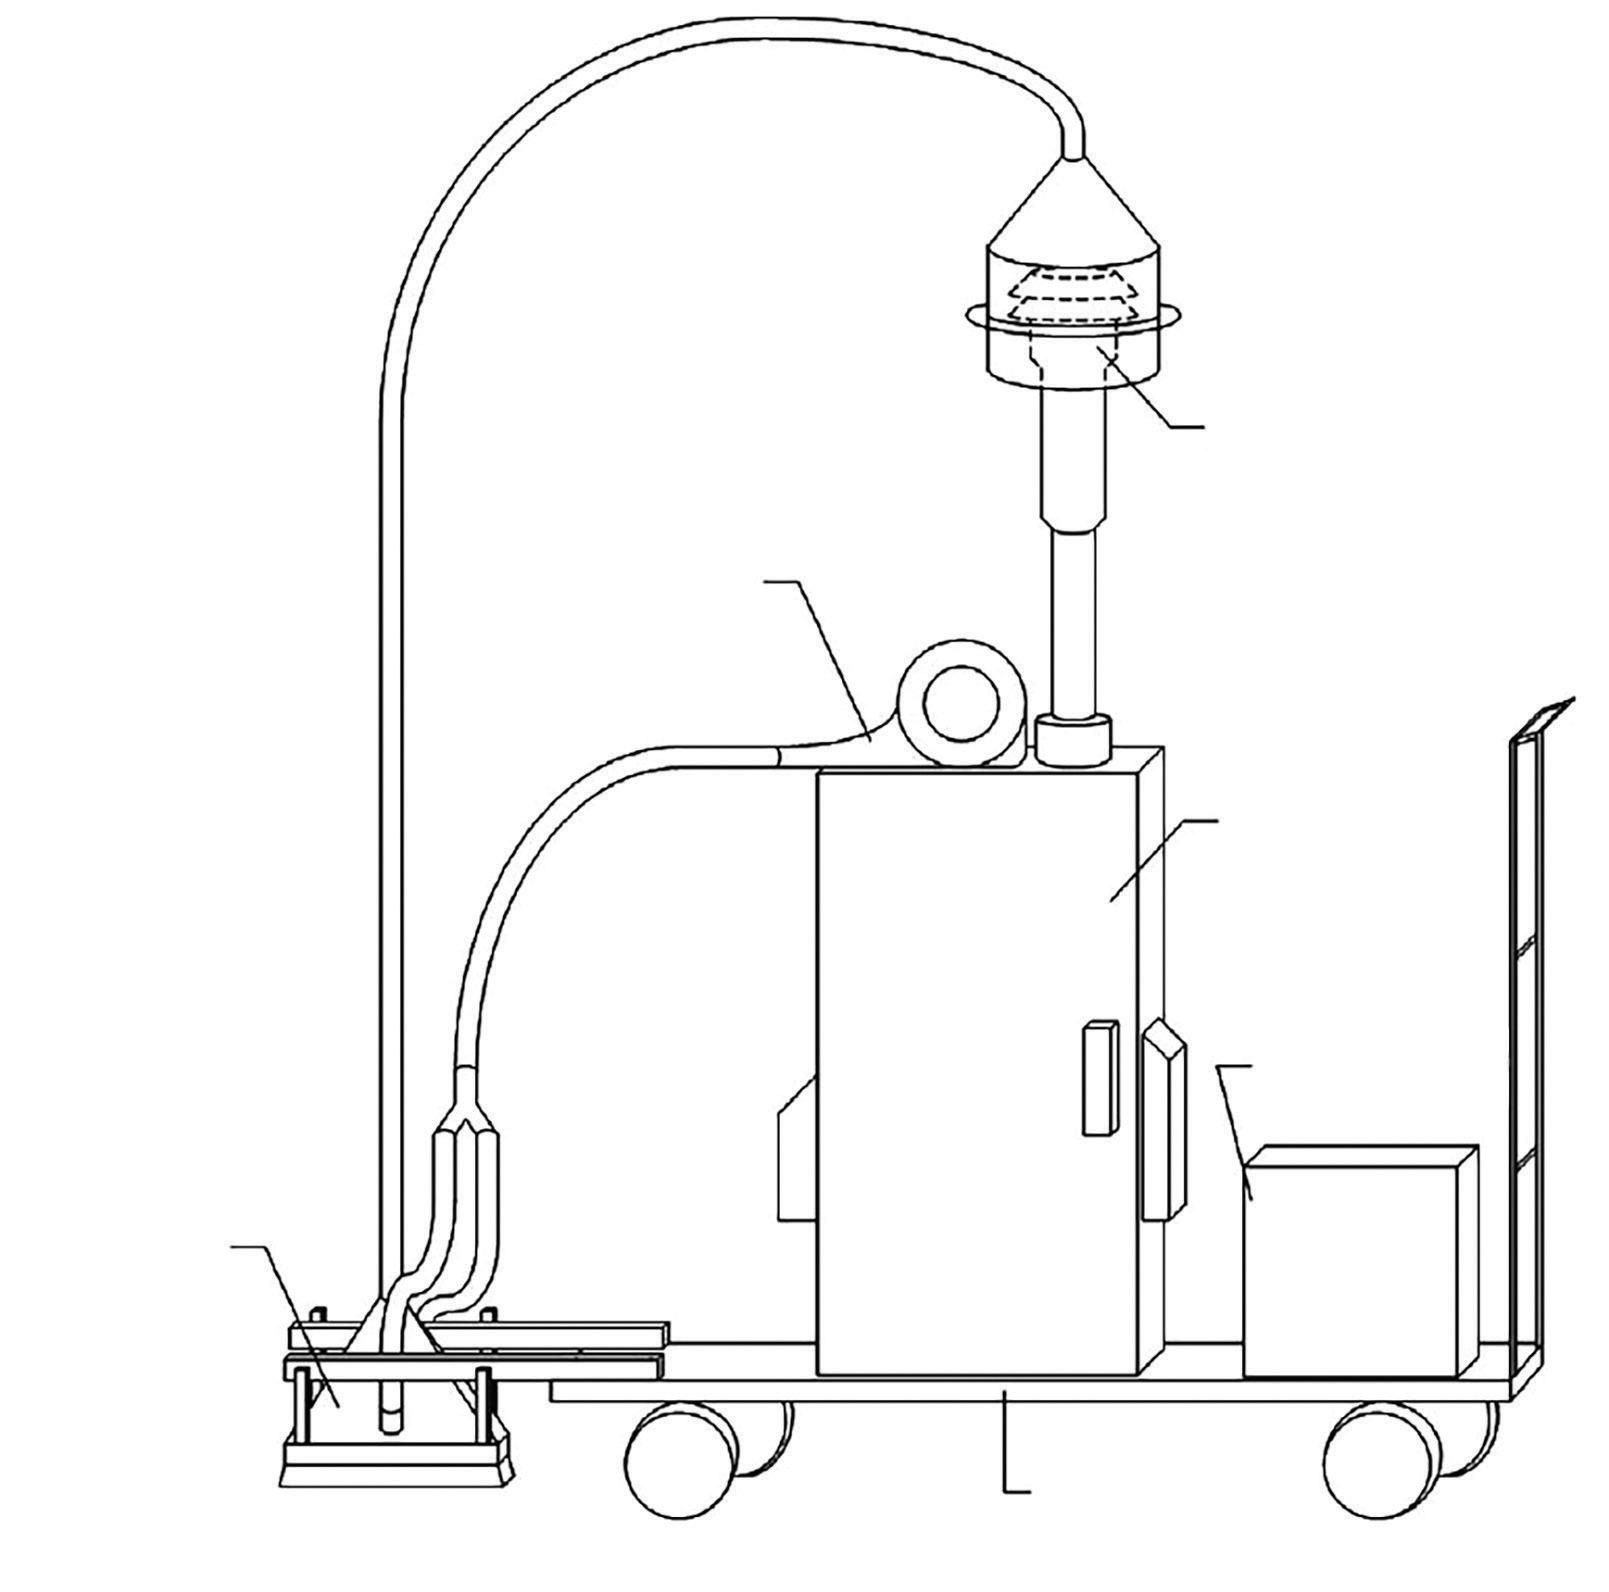
and microscopy but not yet for analysis of microplastics or organic compounds.
When sampling for road surfaces, variations in both the size and composition of dust deposits over the year are likely. Consider the use of summer and winter tyres, as well as meteorological variations - wind, temperature, rainfall. All these may influence the accumulation of road dust on the surface, as well as the emissions of microplastics.
Study over shorter periods (hours, days, weeks) may indicate how wind, precipitation and sudden changes in traffic volume, composition and characteristics affect dust deposits on a road surface.
Variations between different traffic environments, with different road surfaces, traffic volume and composition, speeds and so on, would also make for interesting study. Variations in how dust and microplastics are distributed across and along a road may show where deposits of microplastics are to be found and how they are affected by differences in the macro-texture and condition of the road.
Coarser particles above 10µm can be collected using a dustpan and brush, as was done in the recent project Tire Abrasion in the Environment at the Technische Universität Berlin which analysed for microplastics. A number of studies have used an antistatic brush with durra (sorghum bicolor) bristles and a steel dustpan to avoid contaminating samples with plastic.
Samples of runoff water have been analysed for different types of pollutants. But it has not been possible to find in the literature a sampler specifically designed for collecting microplastic samples. Plastic content in the
physical sampling system should be avoided to reduce contamination; a sampler may need to be adapted away from plastics to achieve this.
Unless runoff sampling during real precipitation is required, tunnels make a good sample area. Samples of runoff water can be collected after washing the tunnel road surface using flushing equipment. The advantage of using a tunnel is that it provides a more controlled environment with minimal impact from the weather, such as wind and rain. There may be fewer particle sources, but
the particles are more closely associated with the only traffic and no other source.
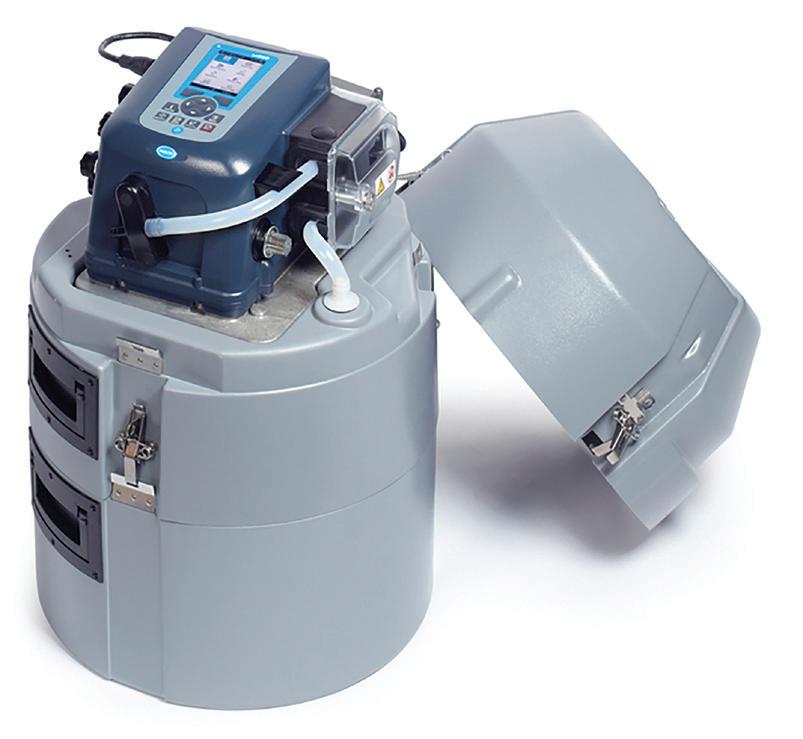
Runoff samples may also be collected from gully pots or specific facilities for runoff collection. As runoff only takes place during precipitation, it is often difficult to plan and carry out manual sampling. This is why automatic samplers – passive and active - are frequently used.
Active samplers come in a wide range of designs and can often be programmed to collect samples at certain times or set up for flow-proportional sampling. An example of this type of sampler is shown in Figure 6. This sampler can be used with different types of containers, either for bulk sampling or for sampling at pre-set intervals.
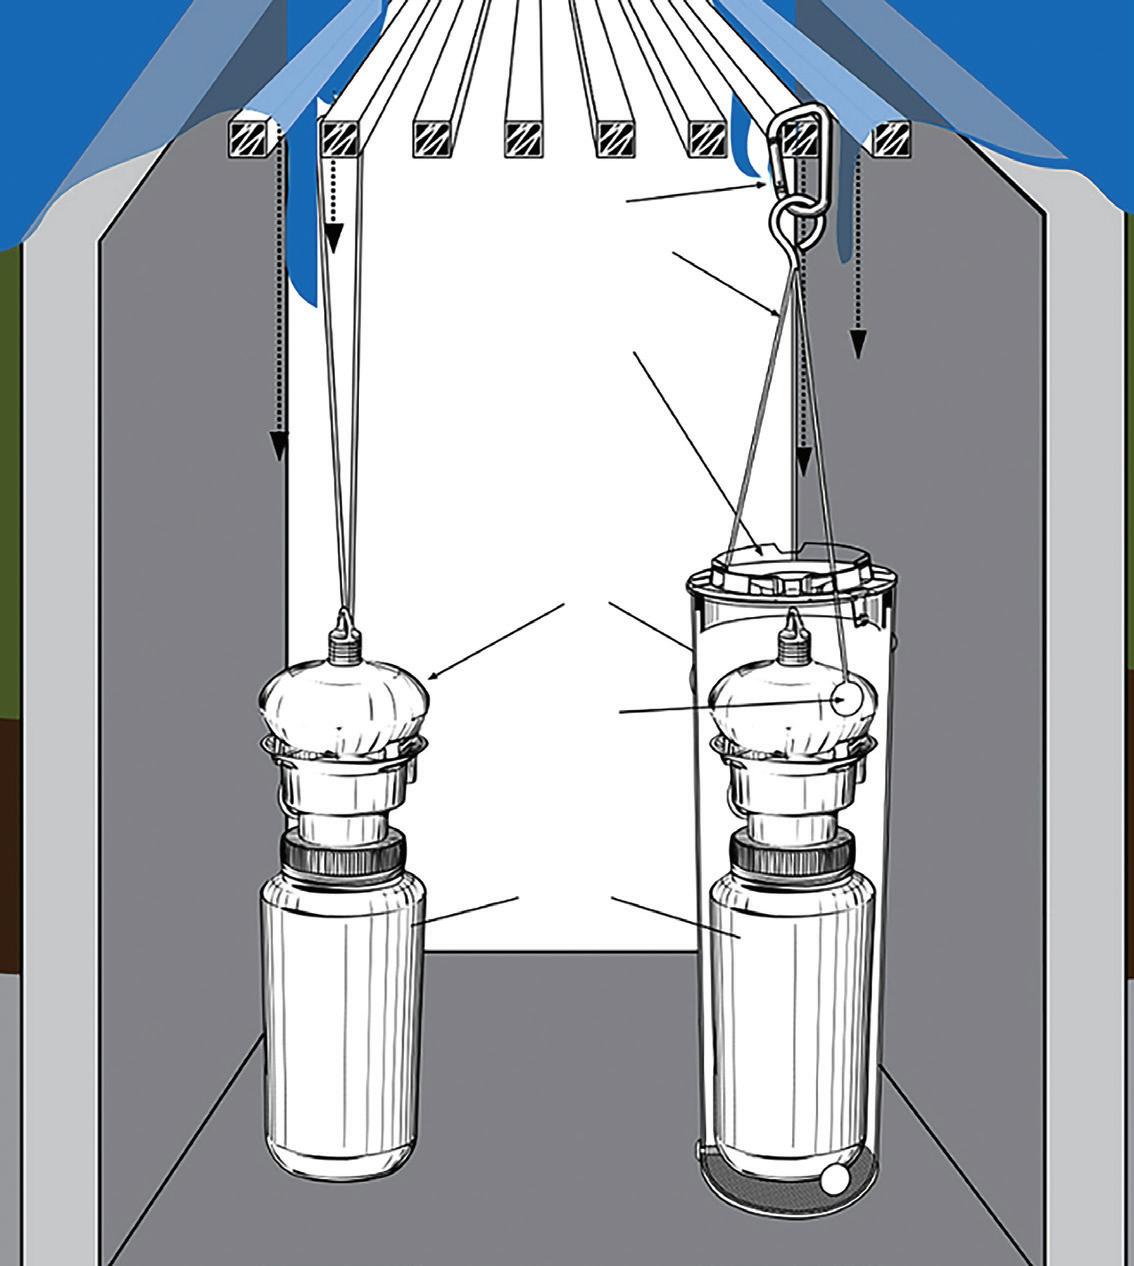
A type of passive sampler is shown in Figure 7. This particular type is placed in gully pots or similar places and fills to a pre-defined volume during the rainfall. A cover prevents leaves and large objects from obstructing the bottles. Once full, it closes automatically using a floating ball and no more water is collected. For this reason, it is known as a first-flush sampler, but it is also used to sample during an entire rain event. However, it is usually made of plastic, meaning that there is a risk of contamination if used for microplastic sampling.
Another type of passive sampler uses a series of filter cloths with gradually decreasing pore size. A further type, a gravity flow sampler, is a type of first-flush sampler which closes automatically once it is full. A number of different versions of the gravity type are available; one is mounted on the carriageway and another model is combined with pipes used to collect runoff water directly by the roadside.
The Swedish road research facility Test Site E18 (Figure 8) has a structure designed to collect runoff water. It consists of curbs
Temperature sensors on different depths
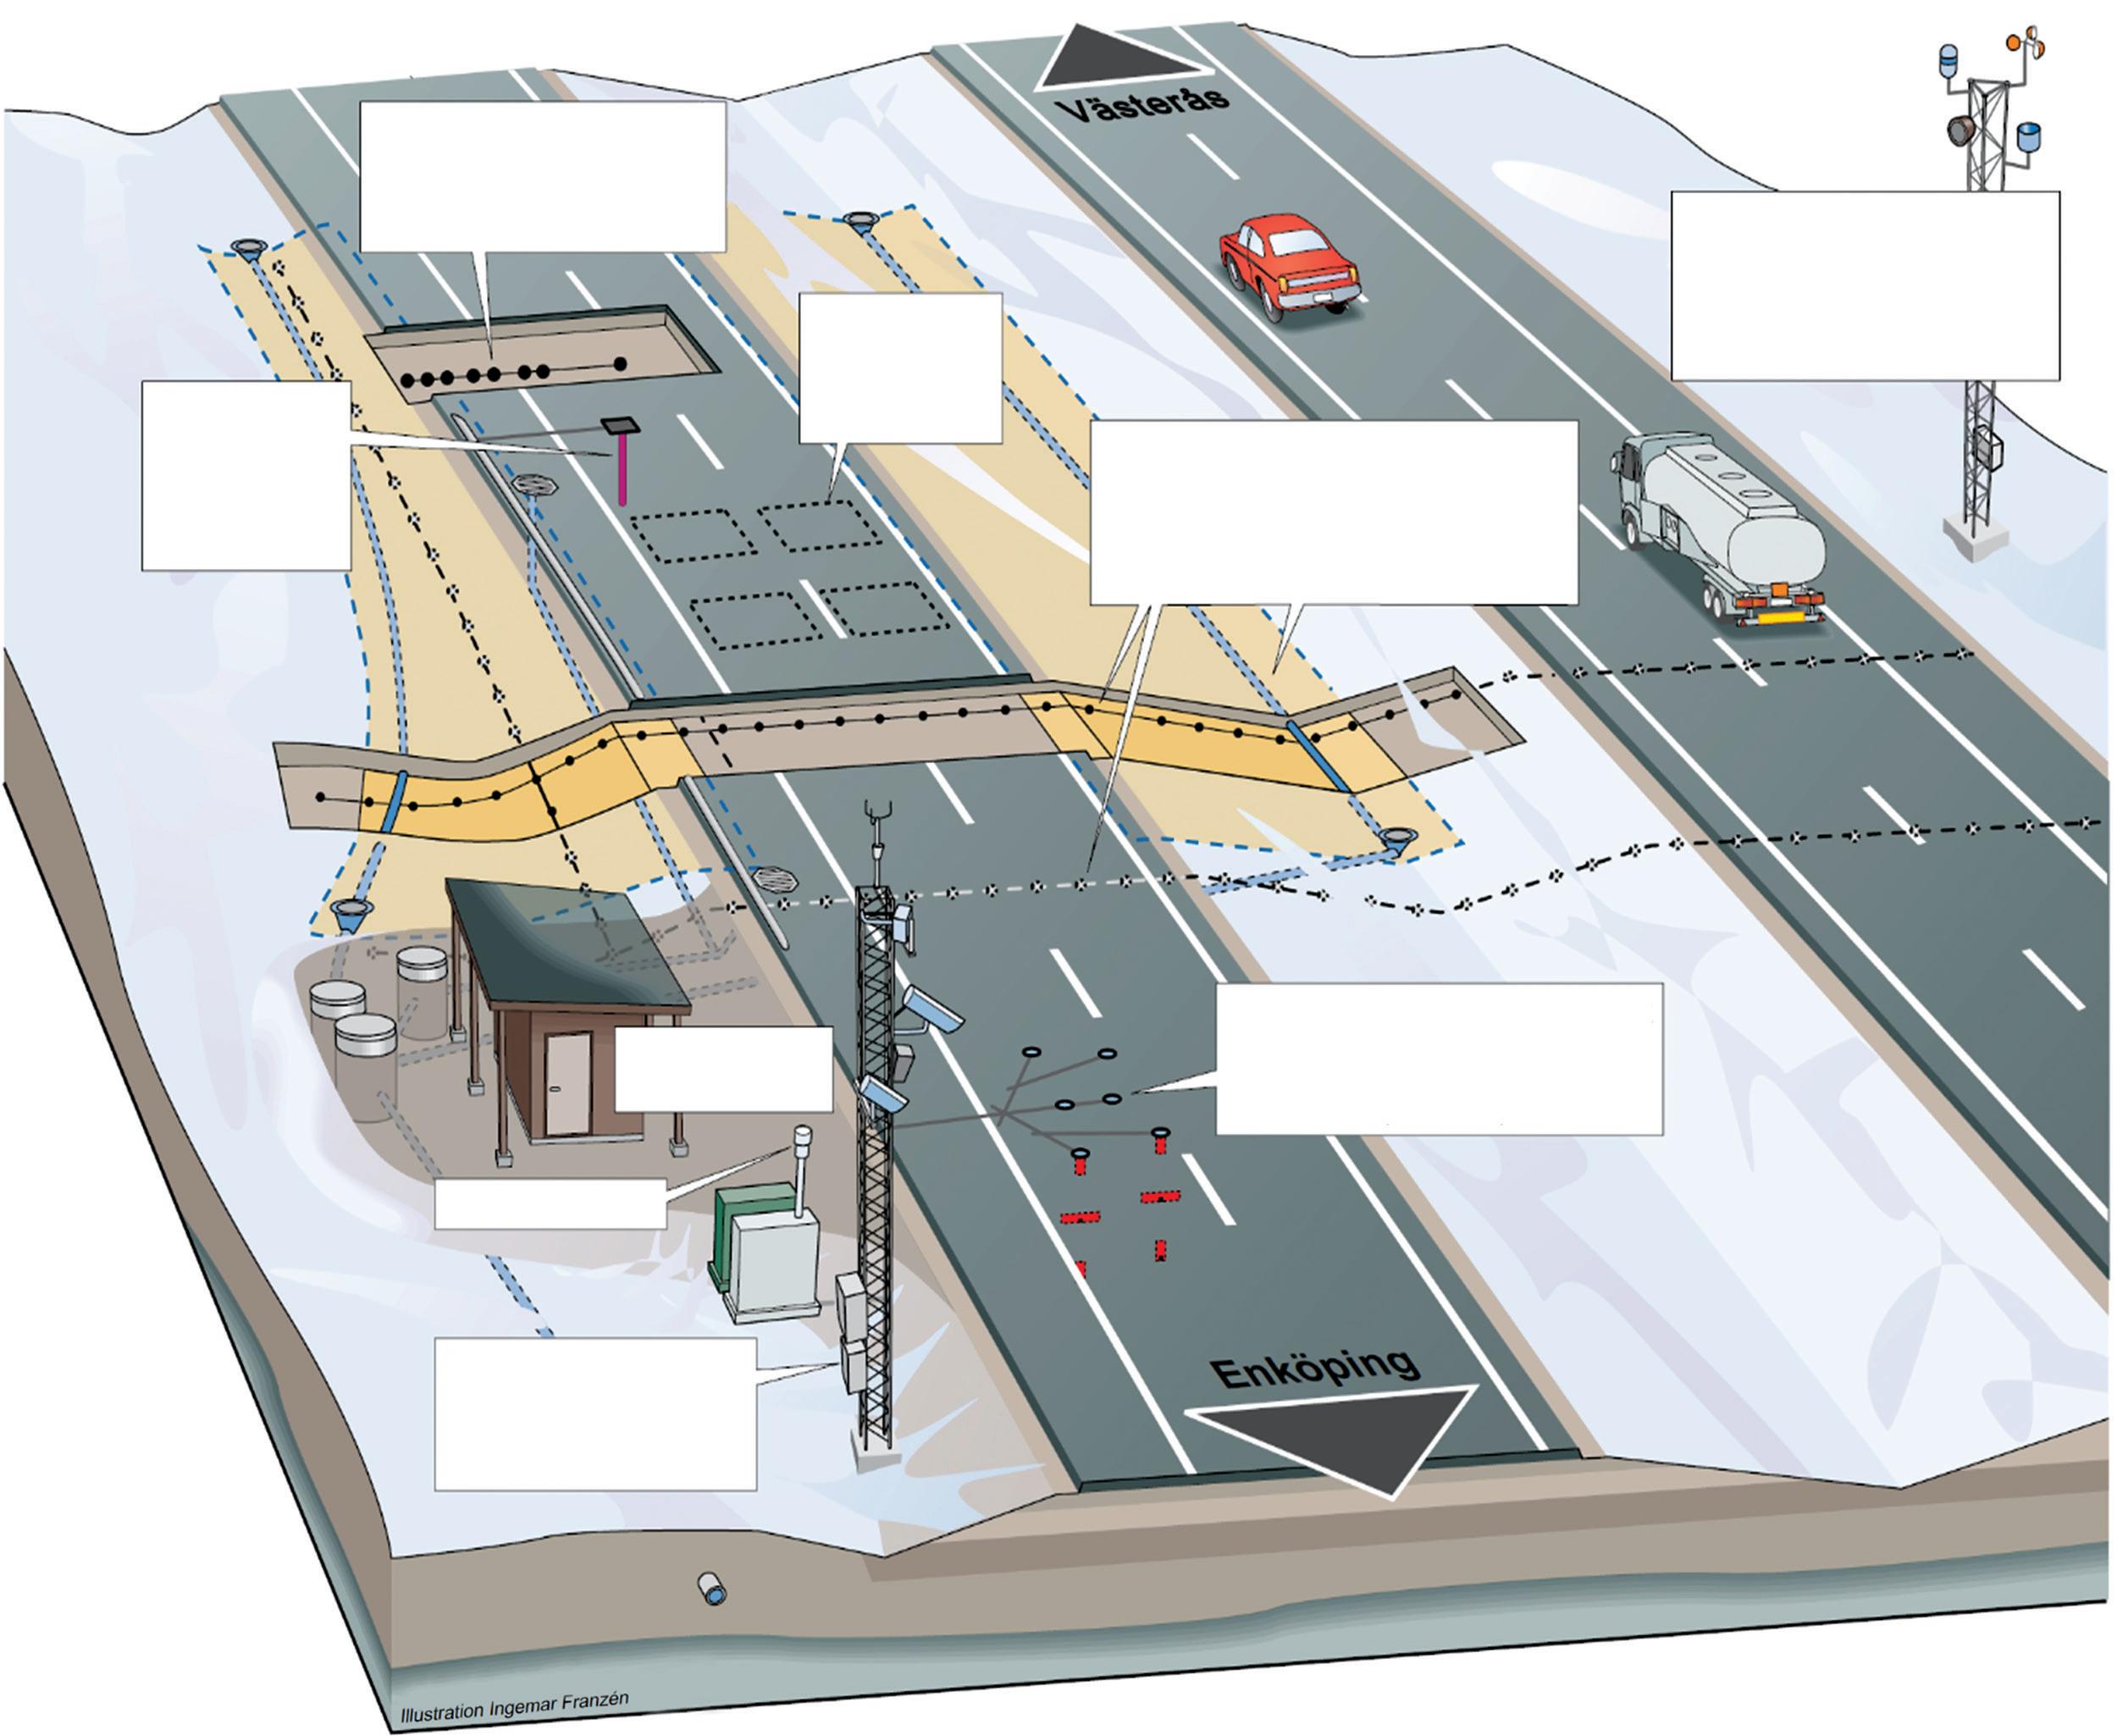
Eight sensors for temperature, water content and electrical conductivity
Data-collection building
Air quality
Four weather station masts for evaluation of sensors
along a 100m stretch of road where water is collected and transported to a drain. The outlet of the drain is equipped with a flowmeter.
Standardised methods for sampling are often not available and there are no standardised methods for sampling microplastics. The choice of sampling method depends upon the medium to be sampled. The subject of the analysis determines the sample volume required, how samples should be prepared before analysis and which analytical methods to consider.
A variety of issues must be taken into account to ensure the collected samples are relevant and representative. For example, different densities of microplastics mean that they spread by different dispersal pathways and accumulate in different environments. Some microplastics accumulate in surface water and along beaches, while others, such as tyre rubber, accumulate in bottom sediment. n
Traffic sensors
Sensors for electrical conductivity. Collection of percolating precipitation and melt water from road and ditches
Sensors for temperature, relative humidity and vehicle acceleration (three levels)
Meteorology including temperature, wind, percipitation, moist levels, radiation, turbulence and heat flows
Microplastics fromTyre and RoadWear: a literature review; by Yvonne Andersson-Sköld, Mikael Johannesson, Mats Gustafsson et al; published by VTI, Sweden’s National Road and Transport Research Institute 2020. Full references to the research are given in the 146-page publication which is available as a free download on the VTI website: www.vti.se/en.
The Swedish government commissioned VTI in 2018 to develop and disseminate what little knowledge exists about microplastics from road traffic and the road surface. VTI’s report notes that the vast majority of microplastics from road traffic are tyre wear particles. Particles also come from other sources such as the wear of road-marking paint and from road re-surfacing which may contain polymer modified bitumen. Based on the available knowledge and mapping of microplastic sources in Sweden, it can be assumed that at least half of the Swedish microplastic emissions are tyre wear particles. Other unrelated sources - crashed vehicles, general littering, wear from brake pads - are not included in the report.
The Tyre Industry Project (TIP) started in 2005 and operates under the umbrella of the World Business Council for Sustainable Development, a non-governmental organisation based in Geneva, Switzerland. Three tyre companies - Bridgestone (Japan), Goodyear (US) and Michelin (France)
– lead the project on behalf of the TIP members, all global tyre makers. Research involves the complete lifecycle of tyres, from production chemicals to use and eventually recycling and disposal. Recent work includes the use of nanomaterials to improve product performance and reduce environmental impact. Results are available to the public via the WBCSD’s website and published in a number of scientific journals.





The ef ciency of using a network survey vehicle to capture road condition can be improved upon by operating an iPAVe, as recent case studies in South Africa have shown, notes Simon Tetley*






road networks, the collection and analysis of network-level road condition data for pavement management is essential. It enables the development of e ective maintenance and rehabilitation strategies for project-level design and implementation (see box at end of article).
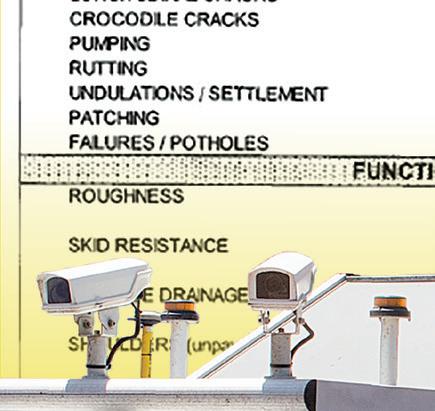
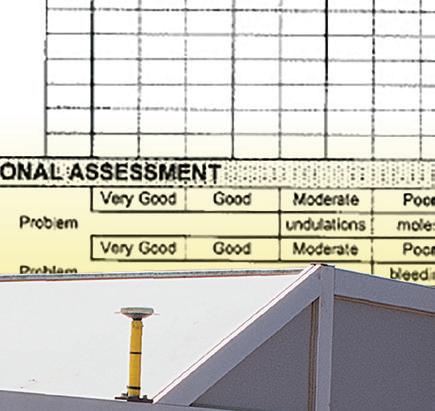
Indeed, systematic road-condition data collection has been carried out by South African road authorities for the past 40 years. e determination of road pavement condition – both surface and structural – based primarily on information from a physical visual assessment of the road







surface is done in accordance with South Africa’s Dra TMH9 Visual Assessment Manual.
Occasionally the visual assessment is augmented with functional data in the form of riding quality, using a vehicle equipped with a linear displacement indicator and structural measurements from a falling weight de ectometer (FWD) or similar device.


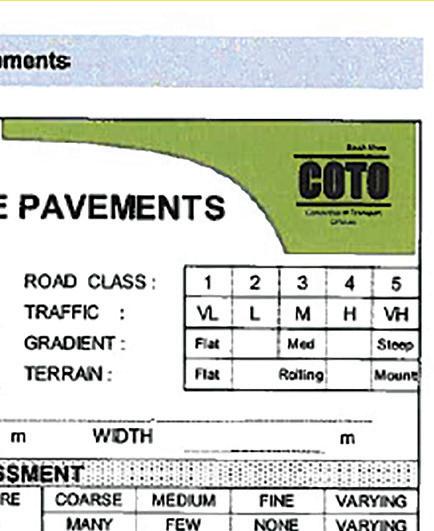
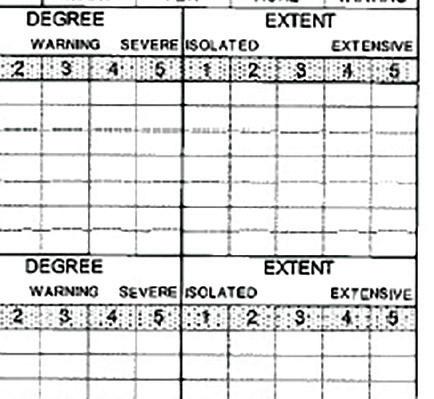
Figure 1 - e TMH9 Assessment Form
ABOVE:




Figure 2 - Network Survey Vehicle road agencies – national, provincial and municipal –to maintain their respective

e capture of degree (of a problem’s severity) and extent (frequency of occurrence) of road condition assessment ratings onto a TMH9 assessment form has been the norm for more than 30 years (Figure 1). Some road agencies have now migrated to completing the form on electronic data-capture devices.
e vast majority of South Africa’s road network-level condition data remains dependent on undertaking physical visual assessments. e South African National Roads Agency and most of the provincial and metropolitan road authorities also undertake pro ling and falling weight de ectometer measurements. It should be noted that falling weight de ectometer measurements are done on only higher order roads and so are seldom used at the municipal level where these roads are not within the authority’s remit.
Two provincial road authorities in South Africa have routinely been undertaking
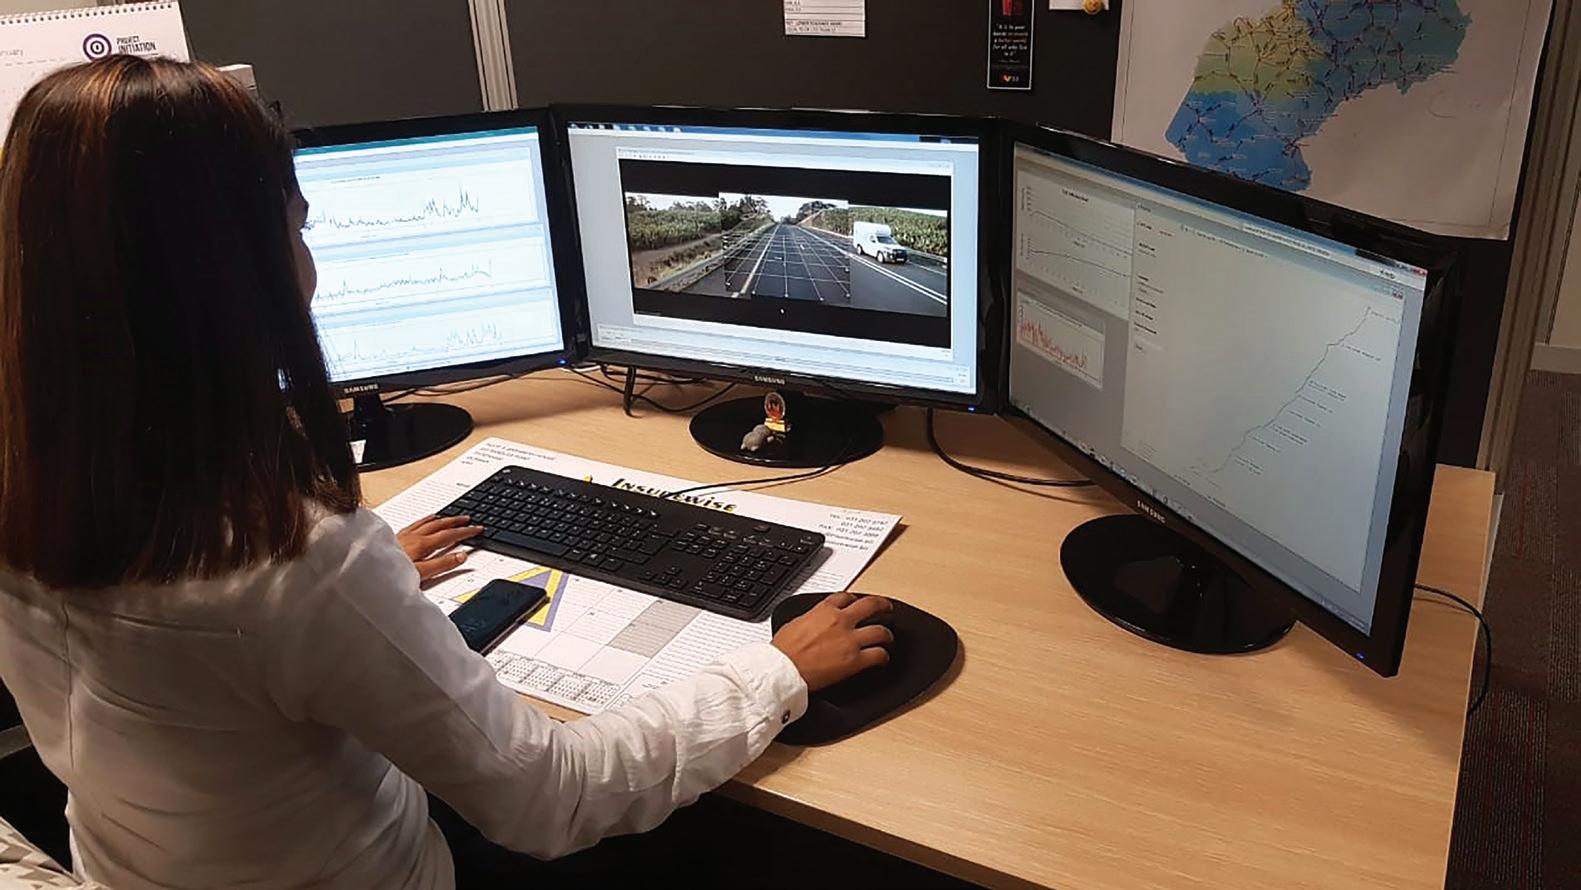
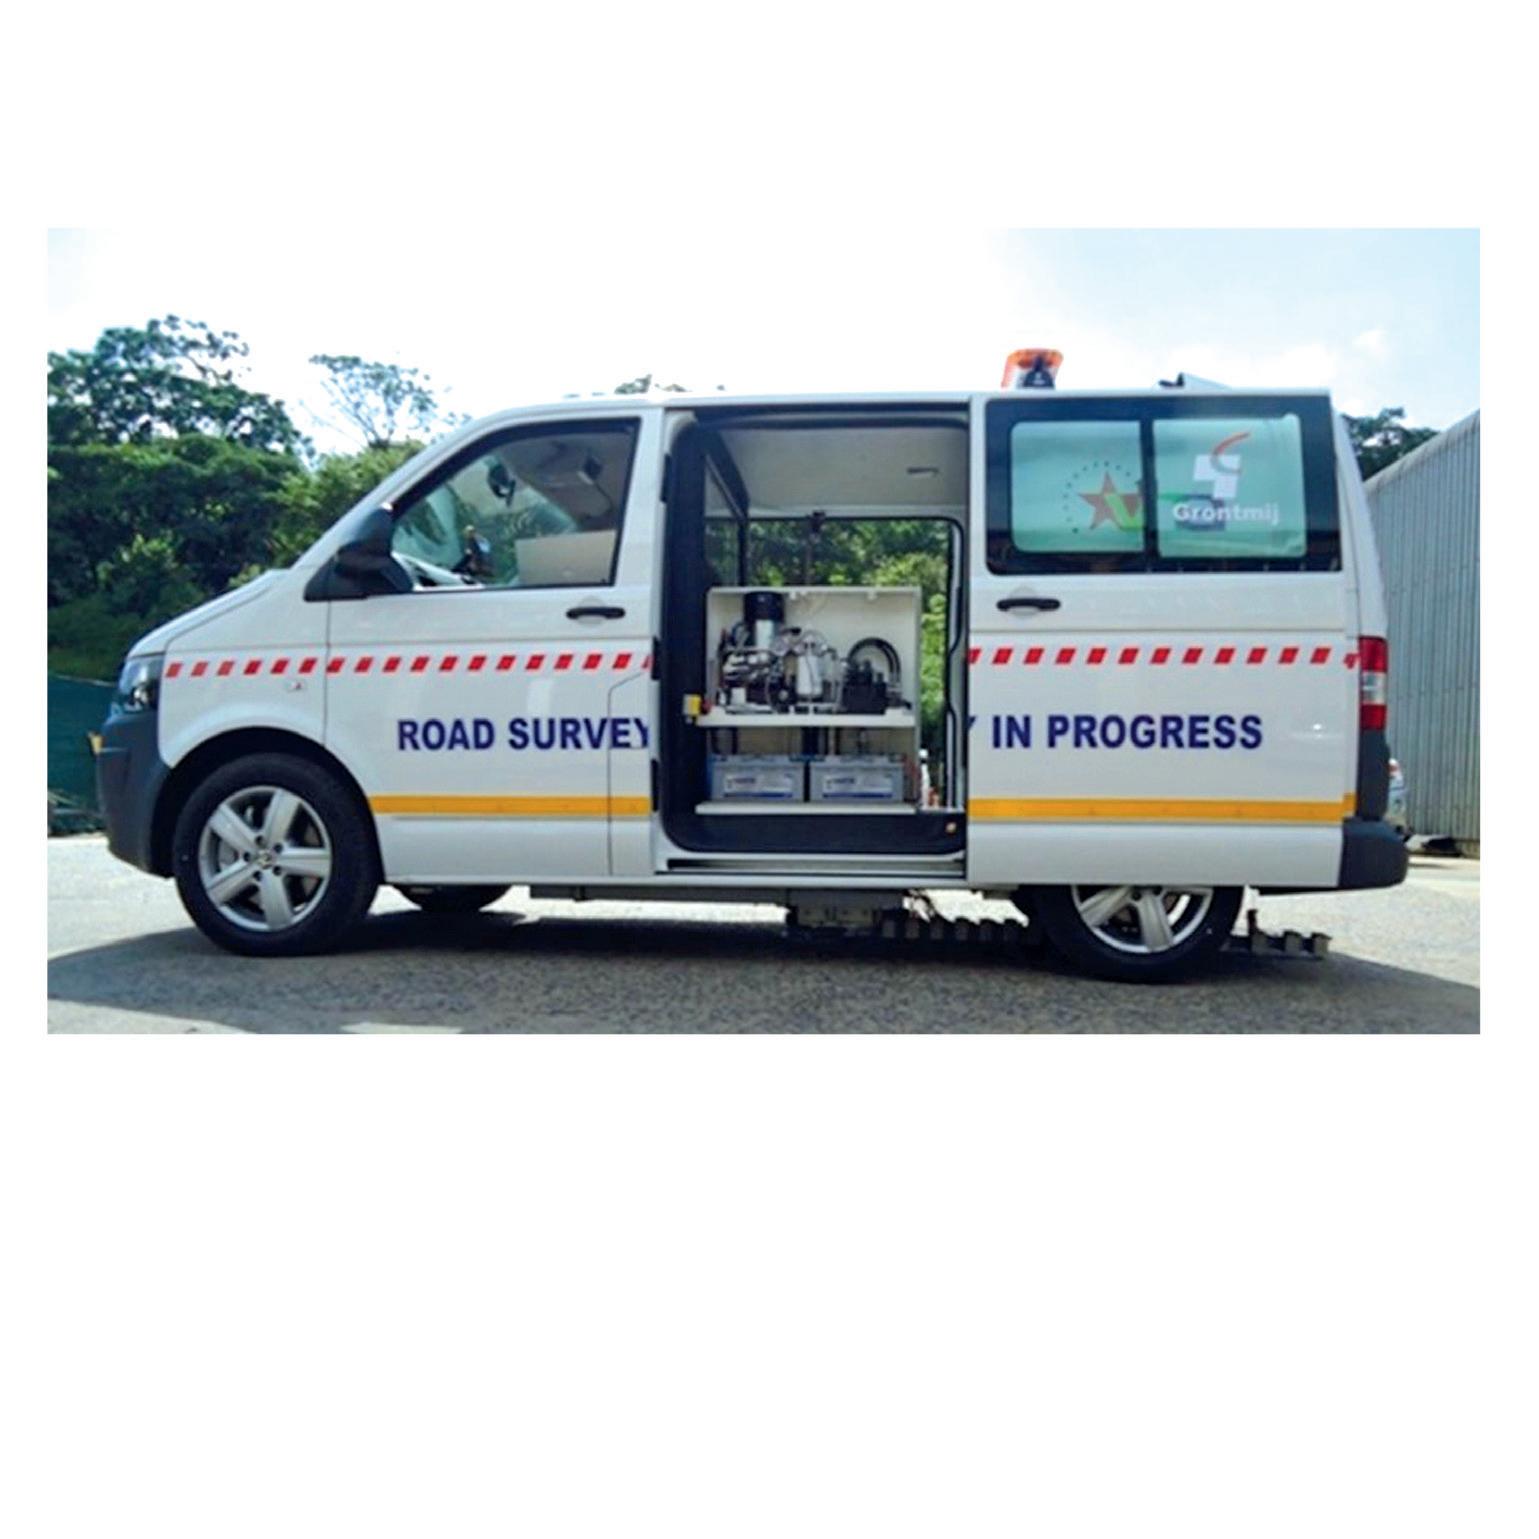
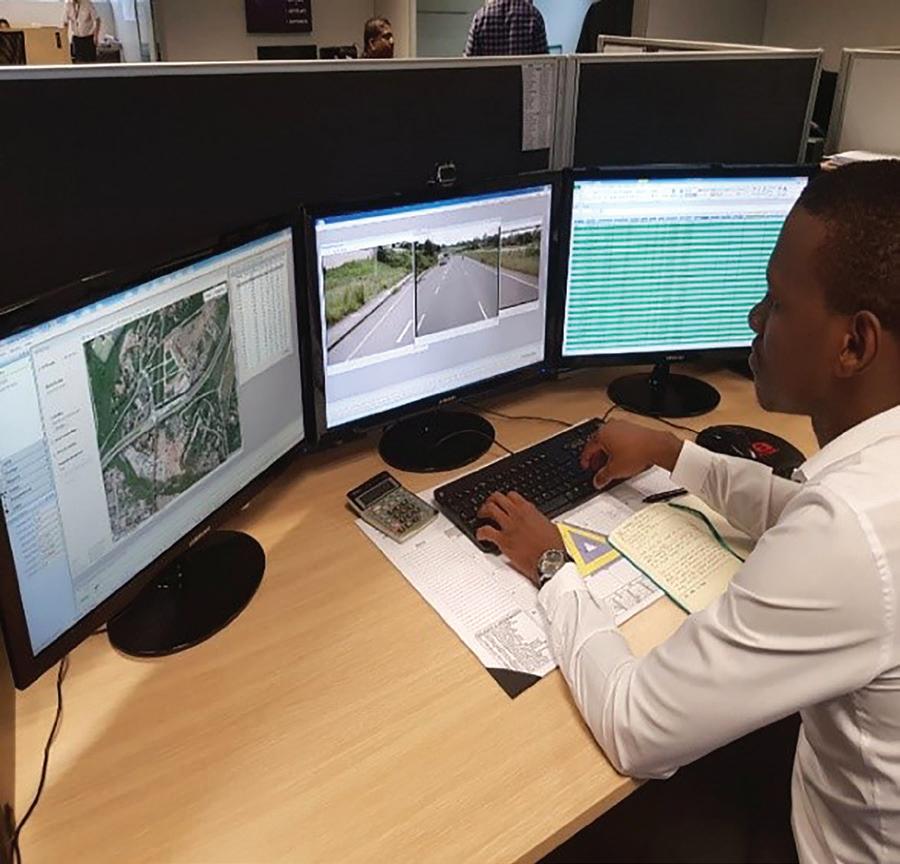
Unlike the majority of South African road authorities, these provinces use the postrating technique to evaluate and assess road conditions. With this method, digital images and cracking data collected by an NSV are assessed in terms of the TMH9 manual, as would be the case for a physical field assessment. However, the difference is that the defects are rated in the comfort and safety of an office environment by experienced visual assessors (Figures 3a and
This process is obviously much safer than undertaking physical field surveys, especially during this time of the COVID-19 pandemic. It is also significantly more
productive and less fatiguing. Each assessor can visually rate around 150km of road per day.
The method does have an element of subjectivity to it but this is much reduced in comparison to physical field assessments. Quality assurance is done through exception/validation algorithms incorporated into the data-capture software. Meanwhile, quality control is managed through independent double rating of random road sections and panel inspection.
Pavement structural data is provided by pavement deflection. This is typically measured using a falling weight deflectometer (Figure 4). For networklevel surveys, these deflections are usually measured at 100m to 200m intervals in the outer wheel path of each slow lane.
In summary, the methodology for undertaking network-level road condition assessments in South Africa can be described as discrete, non-synchronised and semi-automated at best. At worst, it is outdated when compared to global norms.
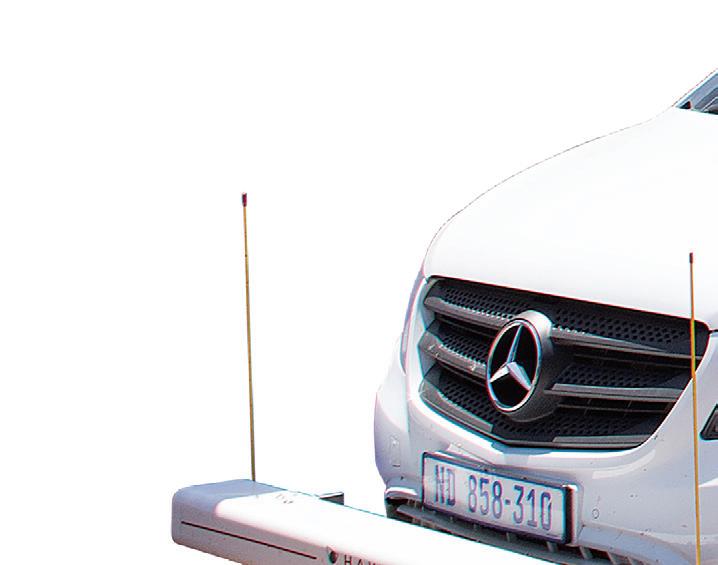
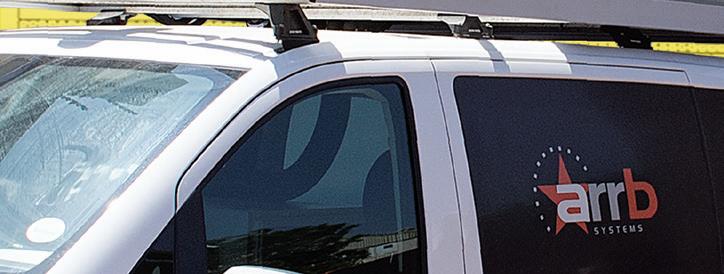
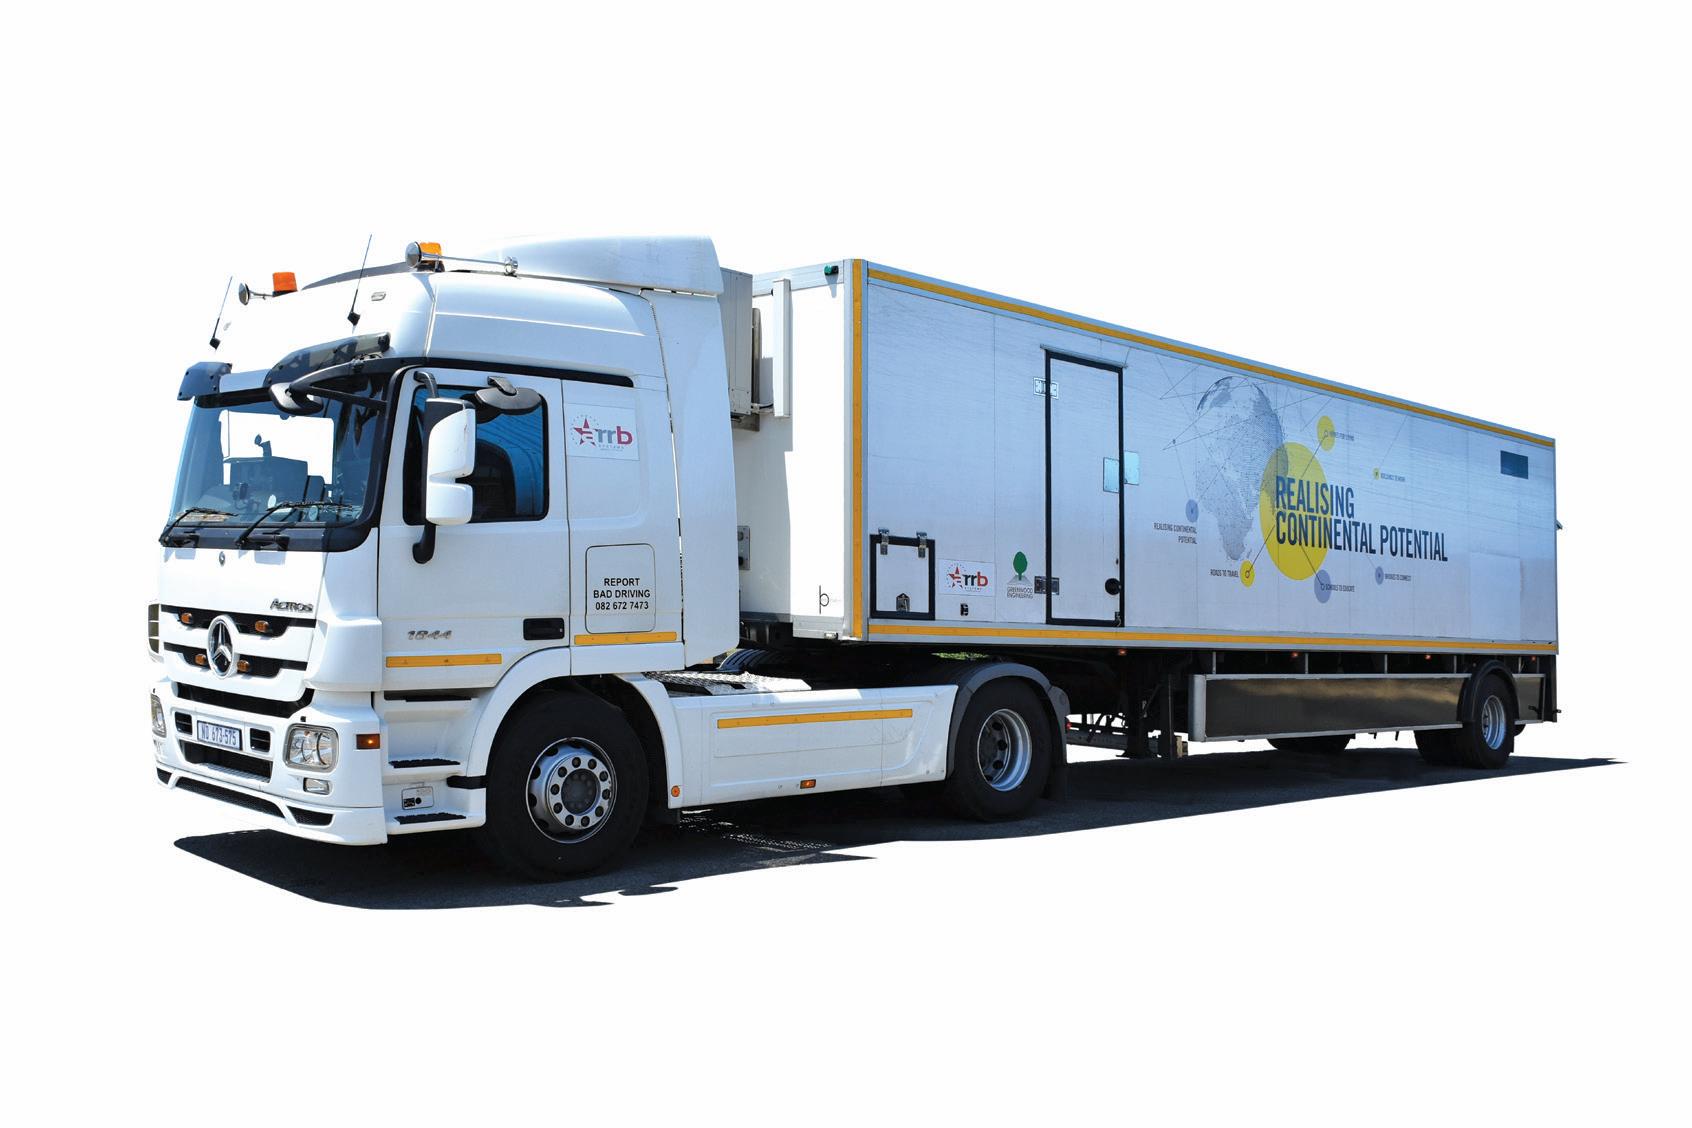
In an initiative aiming to provide a more technically appropriate and objective method of road-condition data collection, ARRB Systems Africa has been operating the intelligent Pavement Assessment Vehicle – iPAVe - in South Africa since 2017. This is considered to be a significant advancement in road asset management; the vehicle collects simultaneously surface and structural pavement condition data at road speeds of up to 80kph (see Road Surface Technology 2019, page 30).
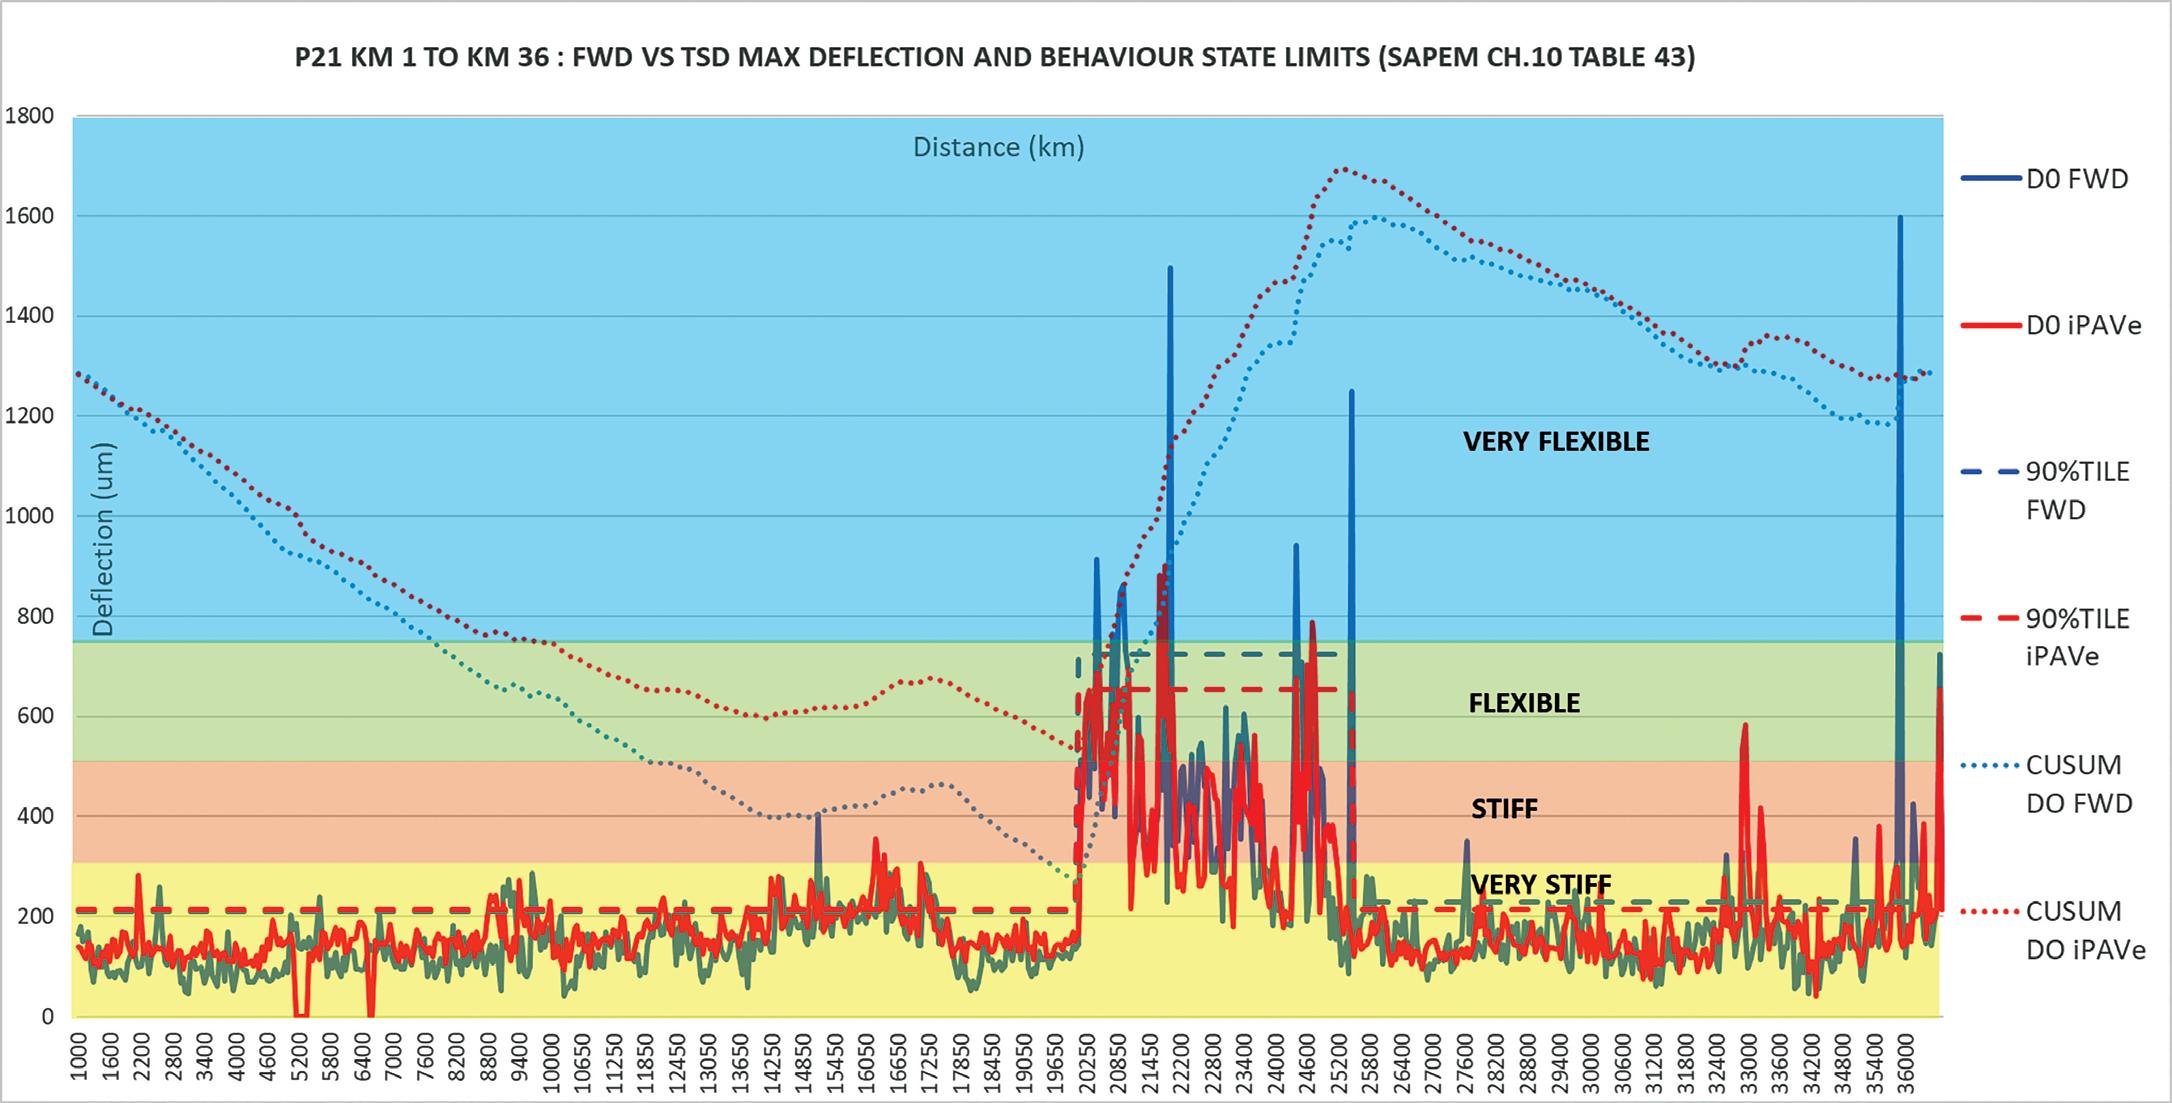
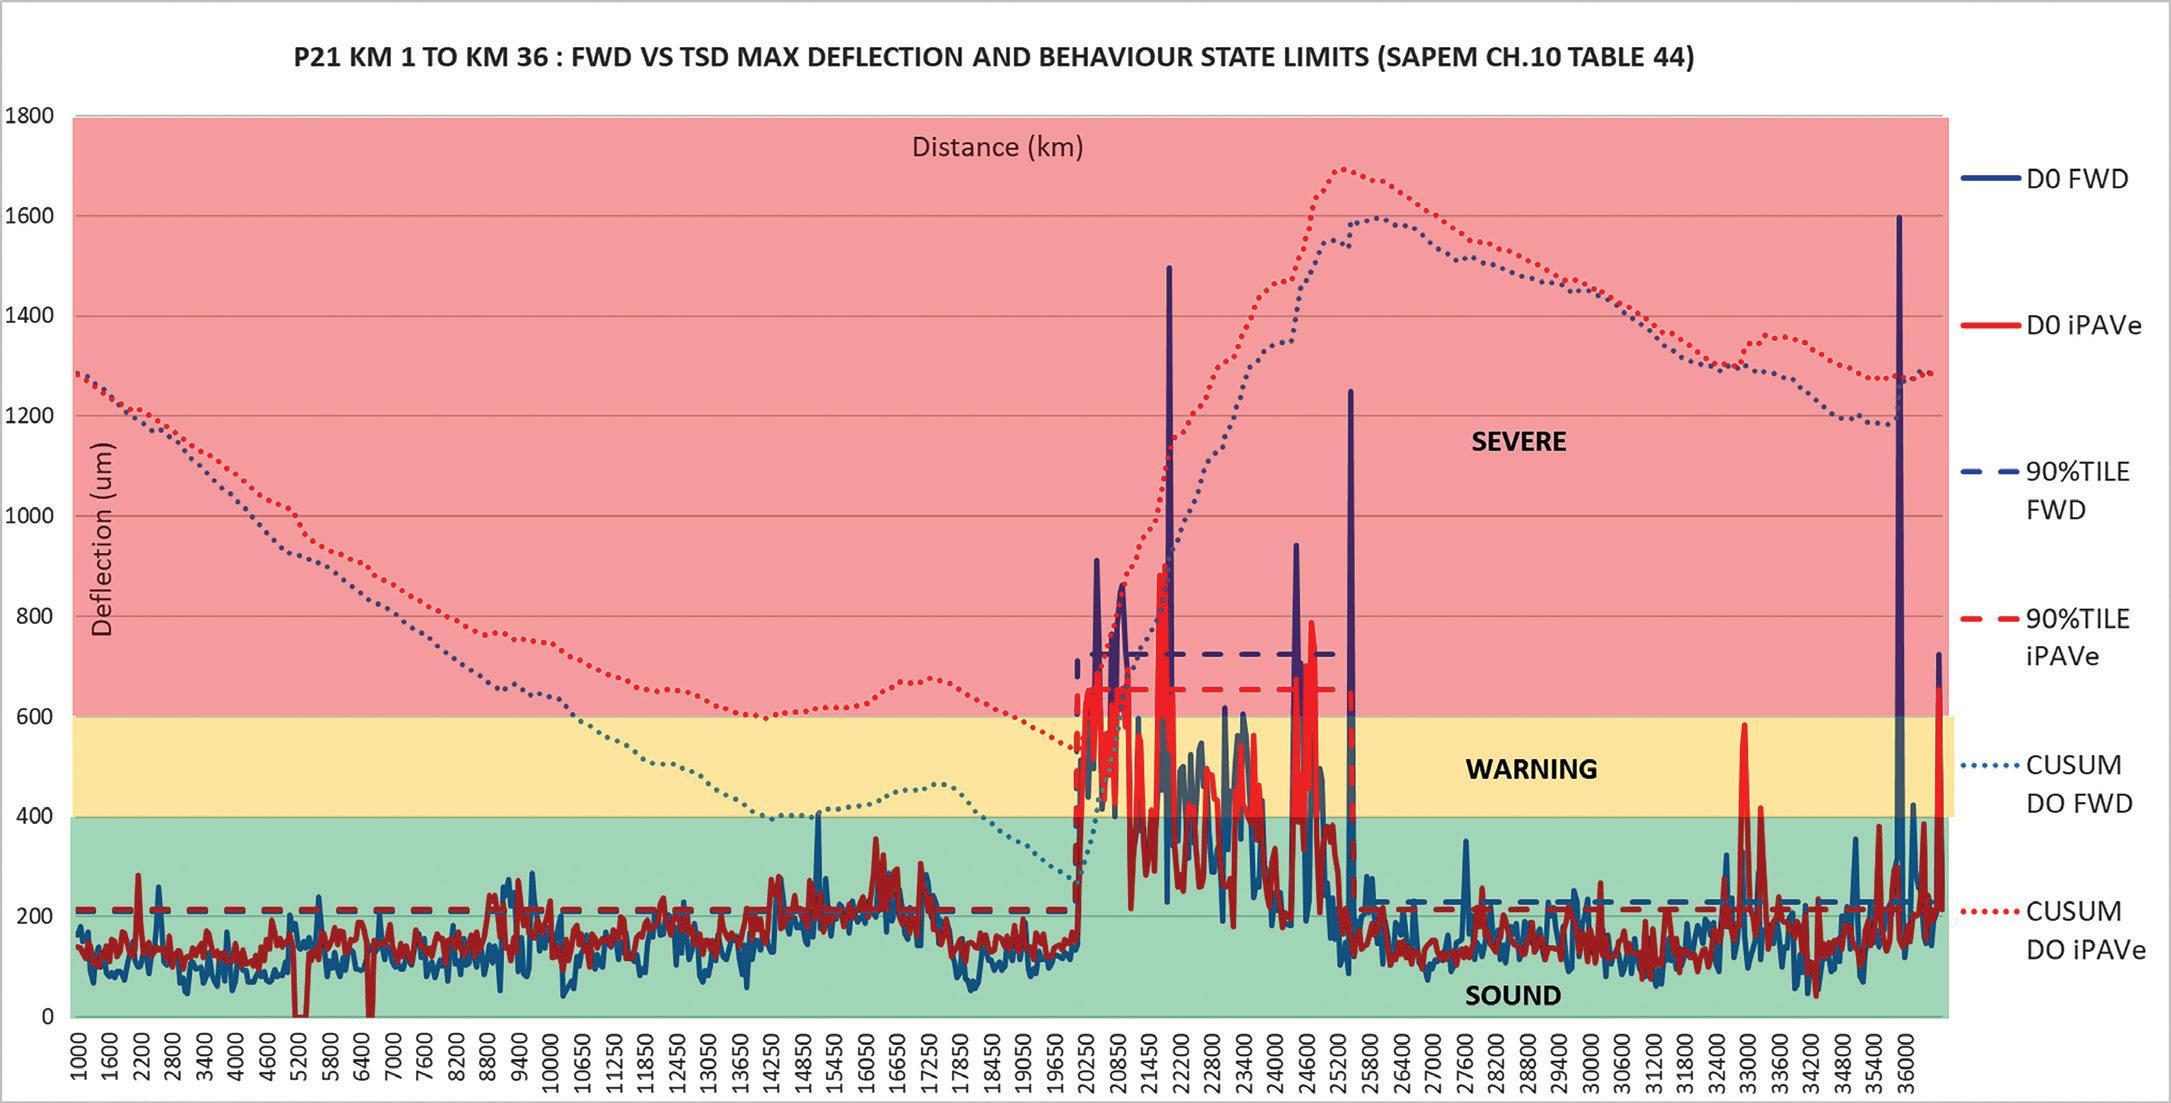
ABOVE: Figure 6 - Behavioural state comparison of falling weight deflectometer (FWD) and iPAVe maximum deflection over 36.5km
BELOW: Figure 7 - Condition-rating comparison of falling weight deflectometer (FWD) and iPAVe - maximum deflection over 36.5km
The iPAVe, as shown in Figure 5, integrates a traffic speed deflectometer developed by Greenwood Engineering with the Automated Road Rehabilitation Business (ARRB) Systems’ Hawkeye 2000 platform. There are
six such iPAVe units operating around the world.
Greenwood’s traffic speed deflectometer uses high-precision Doppler lasers to measure the pavement deflection velocity/
slope from which the deflection bowl is calculated. The Hawkeye platform measures road surface characteristics such as cracking, potholes and failures, roughness, rutting, texture and geometry, together with spatial
information and digital imaging.
The iPAVe is seen as the future of road condition assessment. It offers a continuous (down to a 1m processing interval) and fully integrated and synchronised data collection option. It generates all the information required for network-level screening at much improved production rates and at a significantly reduced risk when compared to traditional discrete methods.
The technology for fully automated road-condition data acquisition is readily available in South Africa, although this is not perhaps fully appreciated by the roads sector. The capability to undertake continuous integrated road structure and surface measurements also presents the opportunity to use the network data for project-level pavement design. An investigation has been undertaken to assess the viability of the process.
In order to simulate a real project, a 36km section of provincial main road was selected where the pavement structure and traffic loading was known. Continuous pavement structural and surfacing data was collected by the iPAVe in approximately 60 minutes. Meanwhile, a falling weight deflectometer was used to measure comparative deflections at 50m intervals –this taking four days.
Following the data-collection exercise, the testing locations of the deflectometer and iPAVe were synchronised, with the iPAVe data being processed at 50m intervals to match the individual position of the falling weight deflections.
The aim of this practical application was to undertake data analysis of the iPAVe and FWD results using pavement evaluation and mechanistic empirical design principles, as would be done in practice for project-level pavement design.
The first step was to plot and compare the maximum deflection and the respective cumulative sum for the iPAVe and falling weight deflectometer measurements. This was done by using the behavioural state limits and structural condition rating as set out in South African Pavement Design Method (SAPEM), Chapter 10, Table 43 and Table 44 respectively. This is illustrated by Figures 6 and 7.
The cumulative sum of difference segmentation for the iPAVe and falling weight deflectometer measurements resulted in three clear and correlating
uniform sections in terms of structural condition. The first, between kilometre 1 and kilometre 20.25, and the third, from kilometre 25.25 to 36.5, were, based on the benchmarking indices, in sound structural condition. The middle section, between
kilometre 20.25 and kilometre 25.25, was in a warning-to-severe distressed condition.
In addition, the 90th percentile representative limit for each uniform section was plotted, as would be done during an evaluation and design for a Class B road.

FAE GROUP is turning the page to its newest chapter. We are celebrating our past but with a clear vision towards the future by renewing our logo and corporate image. The new slogan, “Make the Difference” conveys our commitment to do our utmost to make a difference in every area and at every level extending from product quality, technology, company procedures, and in the workplace.
FAE Group S.p.A.
Zona Produttiva 18 - 38013 Fondo - Borgo d’Anaunia (TN) - Italy Ph. +39.0463.840.000 www.fae-group.com

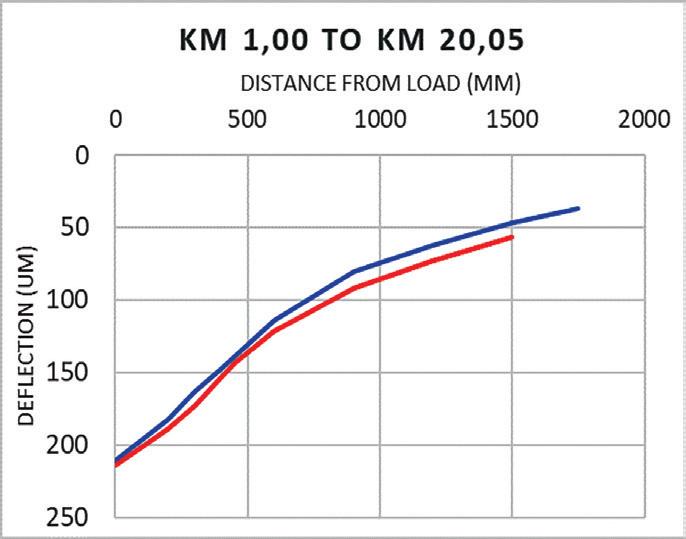
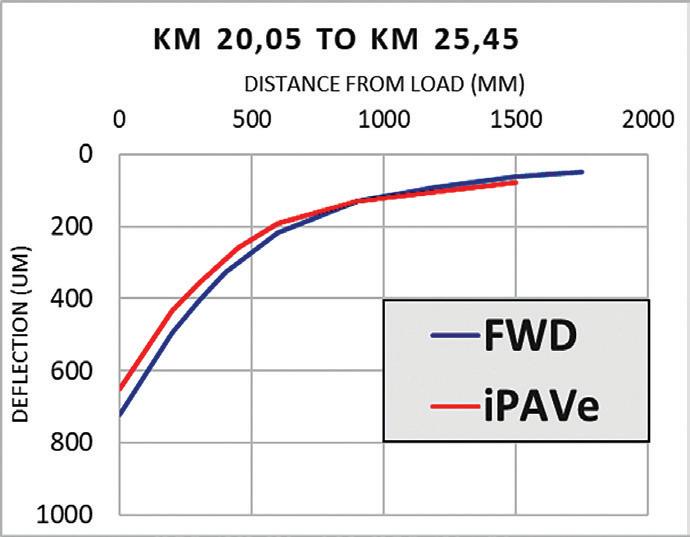
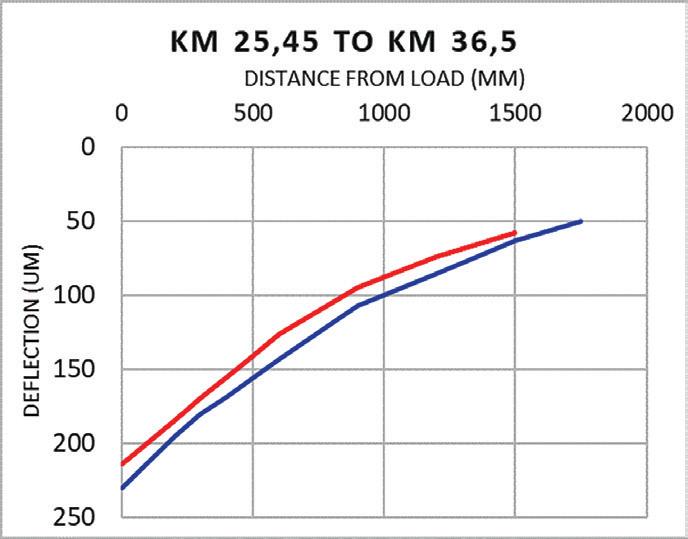
ABOVE: Comparison of the 90th percentile FWD and iPAVe deflection bowls for each uniform section
As can be seen, the individual and 90th percentile maximum deflections and the CUSUM- (cumulative sum control chart) derived uniform sections for iPAVe and FWD show good correlation. Base layer index (BLI), middle layer index (MLI) and lower layer index (LLI) values were also compared and again showed good comparative data fits.
The 90th percentile deflection bowls for each uniform section are plotted in Figures 8a, 8b and 8c to illustrate the comparison between the iPAVe and FWD measurements.
The FWD- and iPAVe-generated deflection bowls, together with the pavement profiles and traffic data, were used to back calculate representative pavement-layer-stiffness moduli and for the subsequent forward calculation of bearing capacity for each uniform section using commercial computer software developed to analyse FWD deflections. The results of the analysis are shown in Table 1.
It can be seen from Table 1 that there is very little difference between the mechanistic empirical analysis results as derived from iPAVe and FWD measurements, with this being applicable to both sound and distressed pavement sections. From this
limited study, it is therefore evident that iPAVe technology can, in fact, be used for project-level design as well as in networklevel surveys.
In addition to the deflection data, integrated rut depth, riding quality and automated crack detection and crack type, identification is also available for analysis. This gives pavement engineers a holistic insight into possible failure mechanisms and additional data with which to identify optimal remedial interventions.
The obvious technical and economic advantages of using equipment, such as iPAVe and multi-speed deflectometers, will no doubt see this technology replacing current pavement-deflection testing methods. This will happen at not only network-screening level but also, as illustrated by the above study, at project level. n
*Simon is a transportation engineer and director of ARRB Systems Africa and manages the company’s Cape Town office. With over 30 years as a consulting engineer, he specialises in the fields of pavement and materials engineering, road asset management, economic evaluation, forensic investigations and construction management of road and airport infrastructure.
Pavement management broadly covers planning, programming, budgeting, analysis, design and construction of a highway system. Within this broad term there is network-level management and project-level management. Data collected at the project-level – for example, details of a particular section of the larger highway – are often useful, when used with similar data from other sections, to help decisions that affect the entire road network, that is to say, network-level management. However, not all data needed for projectlevel decision-making is required to support network-level decisions. Generally, networklevel decisions can be made using less complete data than required for sectionspecific project-level decisions. For a fuller discussion of pavement management levels and data collection, see Pavement Management Levels and Staged Data Collection; Roger E. Smith, Department of Civil Engineering, Texas Transportation Institute at Texas A&M University College Station; paper presented at the 4th International Conference on Managing Pavements (1998).
BELOW: Table 1. Comparison of iPAVe- and FWD-derived layer-stiffness moduli and estimated structural capacity








Good data concerning stresses upon, as well as movements over and on a road surface, are essential in the battle against traf c congestion. Distributed acoustic sensing is one weapon available to city authorities, explains Stuart Large*
Smooth tra c ow is crucial for the economy of any city anywhere in the world. Meanwhile, reliable tra c tracking and data, preferably real-time data, is essential for a city to e ectively plan its transport network and optimise tra c ow. However, existing tra c tracking technology is fraught with shortcomings.
For example, point sensors and cameras have limited and xed elds of view. Invehicle sensors that track location data lack the granular detail for concise tra c- ow tracking. Floating-point data can give average waiting times at a junction, but lacks the expediency to e ectively change tra c lights in real time and directly improve vehicle ow.
Meanwhile, GPS can be a ected by disrupted signal in tunnels or rural areas, or simply because tracking technology is available within only a minority of vehicles.
What current tra c-monitoring technology lacks is real-time transparency and data feeds that can be monitored remotely and swi ly acted upon.
Distributed acoustic sensing (DAS) is a photonic sensing technology. Essentially, it upgrades a city’s existing bre-optic cable network to contain thousands of vibration sensors — akin to placing an army of microphones along a road.
DAS technology converts standard communications bre into a linear array of discrete vibration sensors. Activities such as
people hot-tapping pipelines, leaks, perimeter intrusions, moving vehicles, industrial operations, failing mechanical components, and so many more, all generate vibrations with distinct acoustic characteristics. DAS technology monitors these vibrations. If supported by the right so ware it accurately detects, classi es and reports on the vibration events – locating the position of each event to within a few metres.
Lasers shoot thousands of pulses of light down a cable every second. A minor proportion of this is re ected back to the DAS system and any disturbances will be picked up by the sensor. Each kind of disturbance has its own signature, allowing the DAS system to tell an operator in real time what happened, exactly where it happened and when it happened.
By equipping the bre cable laid alongside a road with DAS technology, it becomes possible to track vehicle movements, determine the size of vehicles using the roads, work out where congestion forms and its type, assess the state of the infrastructure and also identify unexpected works.
Armed with those insights, local authorities can improve journey times through congestion management methods, be alerted to dangerous tra c queues on slip roads, get information on infrastructure usage, where motorists are jumping red lights or trespassing, as well as protecting pipes and cables from harm.



By ‘tapping in’ to the vast bre-optic cabling infrastructure that exists in abundance in cities across the globe, DAS provides greater coverage of city infrastructure than any other technology. And there’s no need to carry out extensive construction work, dig up the streets or install new xed-point sensors or cameras.

In February this year Fotech worked with Spanish infrastructure and engineering company COMSA on an immersive eld trial. e objective was to determine how DAS could manage tra c at roundabouts and whether it could help to change the sequencing of tra c lights to improve congestion.
A trial of DAS was set up along 5kms of road passing through open countryside, a light industrial area and the Catalonian town of La Bisbal d’Empordà, near Girona, which has a population of approximately 11,000. DAS tapped into roadside bre in a micro-trench and then into bre underneath the roadside pavement in the town. e test aimed to thoroughly test DAS capabilities for a tra c management system and determine the limits of its sensitivity.
roughout the day, Fotech and COMSA measured regular tra c ows through a combination of DAS and video cameras to cross-validate the ndings at speci c points along the route. e trial also measured the movements of pedestrians, cyclists and the vibrations of an old stone bridge along the route.
At night, a 500m stretch of road between two roundabouts was closed so that the team could run a series of tests. ese ranged from tracking di erent methods of braking and accelerating, as well as running simulated tra c queues. Each of the parameters was changed one by one in order to understand how much the sensors were able to measure.
While analysis of the data is still ongoing, it is already clear that DAS can be used to track the movement of vehicles in both directions without interruption along the stretch of an entire road, as well as deliver su cient information for a sophisticated tra c management system. e test has proved the ability of DAS to determine the size of vehicles and the speed at which they travel, in addition to identifying points of congestion and the length and growth rate of queues.
Fotech is now working to build an integrated solution that can control traffic throughout a road network, with the additional benefit of reducing emissions and increasing air quality.
In addition to the trial in La Bisbal d’Empordà, Fotech is taking part in an ongoing programme in the UK called SIMULATE - Smart, Infrastructure and Mobility Urban Laboratory and Test Environment. The project involves testing DAS at a four-way junction in the English county of Staffordshire, using the system to monitor and detect the types and speed of incoming traffic in order to dynamically alter the signals to keep traffic flowing as smoothly as possible. Fotech’s DAS system is syncing with the other sensors being deployed to create an integrated solution. More detail on the results of this trial will be released in the coming months.

There are also numerous other opportunities where DAS could offer existing smart-city projects a crucial extra layer of detail. One project is NTT DATA’s “safe city” work in Las Vegas, in the US state of Nevada.
One of the project’s prime use cases so far has been wrong-way driver detection in downtown one-way roadway segments. By gathering before-and-after data it has been possible to measure the effectiveness of roadway improvements.
A stated future goal of the project is to explore additional ways to improve traffic management and signal timing. The reality is that DAS can play a massive role in the realtime dynamic management of traffic systems.
For example, if someone jumps a red light at an intersection, DAS would be able to detect this. The system could then immediately change the traffic lights in real time to hold traffic and pedestrians at other points of the intersection on a longer red light to minimise the risk of an incident caused by the car jumping the lights.
Integrating DAS with NTT Data’s “safe city” solution would quickly demonstrate the impact of various traffic management strategies. It could provide clear evidence on which to base real-time traffic management decisions at a citywide level.
In the UK, some attempts to tackle congestion have revolved around a strategy focused on what are called smart motorways
Smart motorways are most prevalent in the UK but are also found in Australia and New Zealand, as well as in Switzerland. Sometimes still called managed motorways, they use active traffic management systems to increase vehicle capacity while improving safety for drivers. Techniques can include variable speed limits and hard-shoulder running during the busiest times daily. By implementing these, other benefits accrue, such as more reliable journey times, reduced noise and fewer harmful vehicle emissions.
(see box). Although these smart motorways currently account for just 320km - or less than 9% of the UK’s 3,700km motorway network - analysis shows that capacity in the busiest of those areas has increased by up to a third. However, a recent report published by the UK Department for Transport raised concerns about the safety of smart motorways. The document suggested technology inadequacies are directly contributing to road incidents.
Again, the problem with the technical implementation of smart motorways is the reliance on point sensors. Even in a bestcase scenario where you may have loops or cameras every 400m, you won’t have full continuous monitoring. Any gaps in coverage are an open invitation for delays and errors to creep in.
In this scenario DAS could provide full continuous monitoring of its entire length, closing the gaps in the sensor infrastructure. This would increase the efficacy and accuracy of identifying incidents as well as boosting the speed of response through the real-time detection of incidents anywhere along the motorway.
More importantly, DAS fundamentally
alters the economics of smart motorways. Because it can make use of fibre that is already installed, DAS makes it commercially viable to extend smart-motorway systems, not just to more of the motorway network, but also to the UK’s other major A-class roads and B-class secondary but still busy roads, without major disruption. In this way DAS could truly enable a network of smart highways, not just smart motorways.
No single technology will be a panacea for overcoming traffic congestion and thereby boosting the efficiency of traffic management. Yet, it is clear that DAS offers city and local authorities a big step forward in doing so for transport infrastructure and along their road networks, not least because it builds upon the existing fibre-cabling infrastructure in cities.
Trials such as the one in La Bisbal d’Empordà show that DAS can make a practical difference to alleviate the strain on transport networks and provide better insight on road congestion. n
*Stuart Large is product line director and head of business development at Fotech Solutions, based in the UK with offices in Canada and the US. Its fibre-enabled asset management platforms provide a suite of dynamic and adaptable solutions for a diverse range of applications.

Recent years have seen huge gains in performance for asphalt compaction technology, explains Mike Woof, editor of World Highways
When road surfaces su er problems such as rutting, ravelling and moisture damage, these issues can o en be linked to inadequate compaction during construction. Where speci ed mat densities have not been achieved, early failures can occur and may require resurfacing before the design life of the road has been reached.
A number of factors in uence the compaction process, including ambient temperature, compaction e ect (frequency, amplitude, forces, forward speed) delivered by each roller and also the interaction between the individual compaction machines. Other factors are haulage distance, the asphalt grade and the material temperatures at production and delivery stages.
Intelligent compaction was developed in the 1980s for use in soil compaction and further developed in the 1990s for the more complex asphalt compaction. is technology was originally intended to monitor compaction operations and record data in real time, presenting information on a display for the machine operator. As the technology developed over the years, users have been able to download the data for later analysis, rst by using removable data cards and in more recent times by using wireless technology.

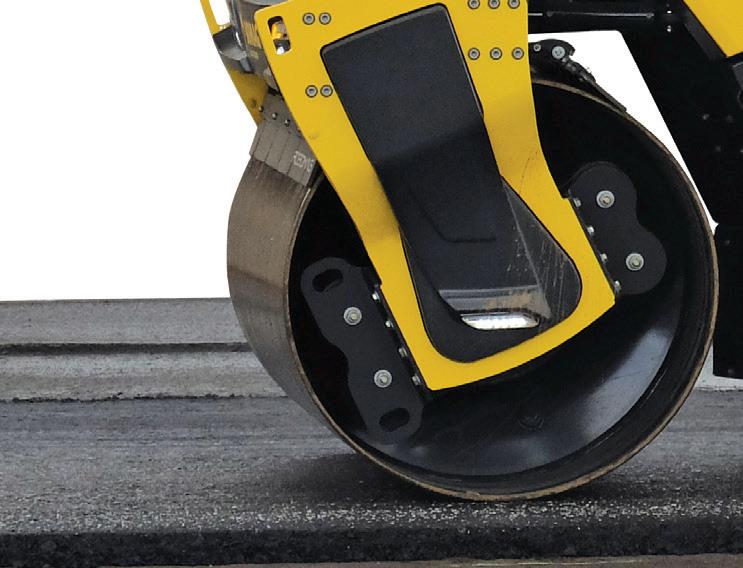





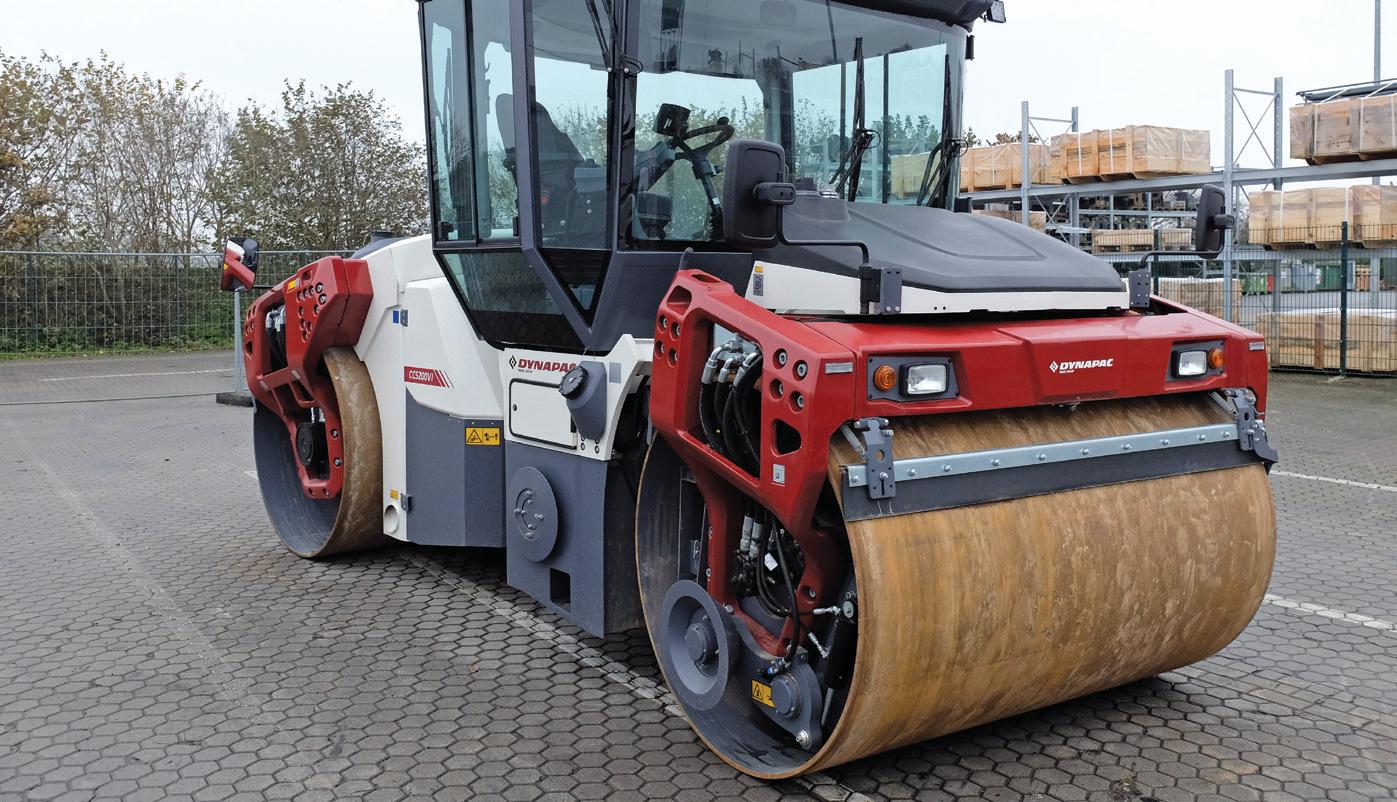
Using wireless technology means that the compaction data can be embedded into a model of the entire project as part of a building information modelling (BIM) process for later use. is compaction information can also be analysed remotely in real time to highlight any potential shortcomings and areas that may need further remediation or may be likely to su er problems before the design life of the pavement has been reached.

To deliver intelligent compaction, compactors need to be equipped
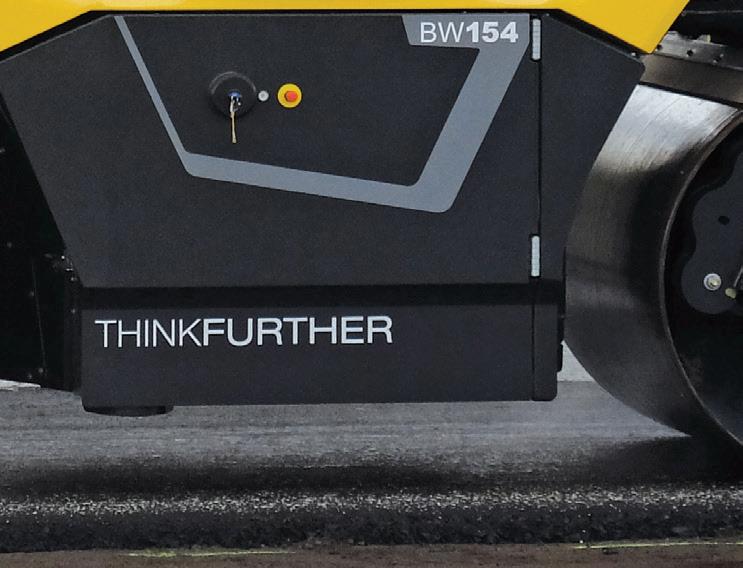


with systems that measure, record and display the compaction e ort. Di erent manufacturers use di erent technologies for measuring the compaction. However, most of these systems use accelerometers mounted on the compactor to monitor the response of the drums to the compaction e ort exerted on the asphalt surface. Another, although less common, technology uses lasers mounted on the compactor to determine the e ect exerted by the drum and the density achieved in the asphalt mat.
No direct comparisons have been carried out to determine which system delivers the more accurate measurement so it has to be assumed that the results they display are broadly the same. Some manufacturers have claimed that the accuracy of their monitoring systems for determining compaction density is within 1.5% of the gure that can be attained by coring – the analysis of core samples.
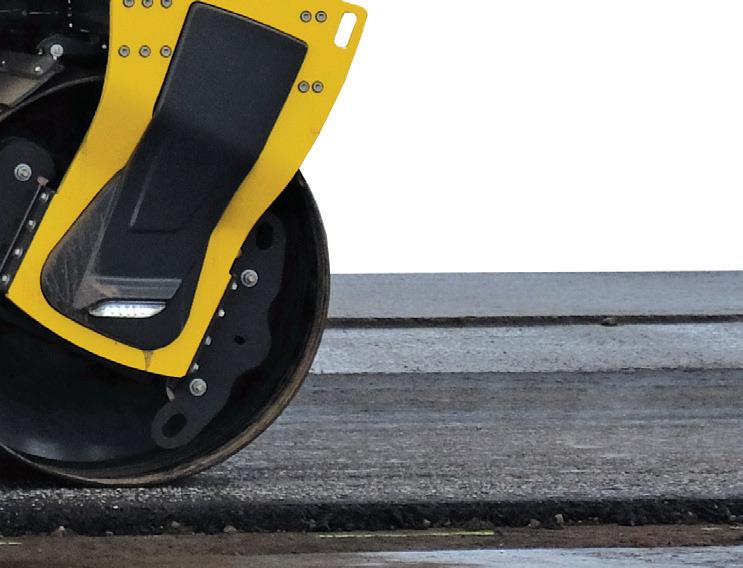
It is worth bearing in mind, though, that because hot asphalt displays many liquid properties,

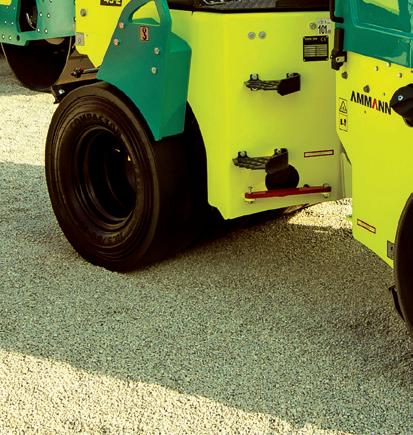
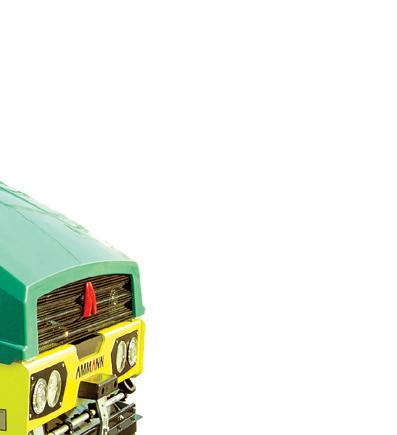
RIGHT: A number of manufacturers now o er compactors with oscillation, including Ammann, Bomag, Caterpillar, Dynapac, Hamm, Sakai, Volvo CE and XCMG BOTTOM: Amman ARX 45-2C
Light Tandem Roller-6
assessing the degree of compaction that has been achieved is less straightforward than for the much less complex soil compaction process.
In addition, an intelligent compaction system uses GPS (global positioning system) equipment to correlate location data with the information gathered about the compaction work.
Infrared temperature sensors are tted to the front and the rear of the roller chassis components. ese log and map the heat variance around the compactor, crossreferencing it with information recorded on compaction e ect and the position data. e roller operator can monitor the passes and amend compaction patterns as required. Most of the latest systems feature colour-coding maps that show the real-time surface temperature, compaction pattern and compaction measurement achieved.
Within the compaction machine, processing so ware combines the recorded information on heat, positioning and compaction e ect and displays this to the operator. e screens show the operator what areas of the asphalt surface behind the paver have been compacted so far and to what degree. ey also show what areas need to be prioritised for compaction due to dropping temperatures, allowing the machine operator to schedule the work more e ciently. e technology also allows the rollers to communicate wirelessly with each other. Operators can see on the display in the cab all the passes that have been made by all the rollers working on the asphalt mat behind the paver.
e temperature of the mix, the interaction between the rollers and the haulage distance from the asphalt plant are all important factors for e ective compaction. is is because compaction of a conventional hot mix has to be carried out in a timely fashion before the temperature drops below a critical point. Below this point, the asphalt binder will become too sti to respond to more compaction that is intended to further reduce air voids within the asphalt. Any attempt to continue compaction a er this point may crush the aggregate.
Using this type of intelligent compaction system ensures that compaction is carried out where needed and to the degree required. It prevents over-compaction which can result in the aggregate bound in the asphalt being crushed. Furthermore, it eliminates problems caused by cooling, as an operator can address

these colder spots before the temperature drops too low for e ective compaction to take place.
However, even though intelligent compaction systems provide e cient density measurement on site and correlate this information with position and temperature data, there are some potential shortcomings. e compaction forces delivered to the mat will travel deeper than the layer that is actually being compacted. But the data recorded by the system from the mat will show the response of the whole depth of the area being compacted. e measurement systems therefore need to be able to take into account the fact that they are also recording the response of these lower layers. If they are asphalt layers, they will already have been compacted. If they are base layers, their response will be di erent. is issue could be a particular problem when paving thin layered wearing courses.
With this in mind, there is still no substitute for the use of accurate measurement of mat density such as coring, nuclear gauge or non-nuclear capacitive
electromagnetic methods. ese can be employed to back up the data recovered from roller-mounted intelligent compaction equipment. Coring, though, is timeconsuming and leaves holes in the road surface, so it is carried out only periodically.
Nuclear density gauges are non-destructive and highly accurate but their use on a construction site may be limited due to restrictions on radioactive emissions. For this reason, electromagnetic equipment may o er a more convenient method for comparison with data recovered by intelligent compaction systems on rollers.

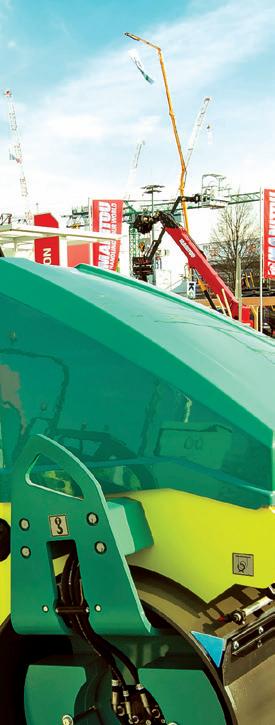
Meanwhile, visualisation of data has become much easier for operators in recent years. Not only do the displays show the working of all the rollers at the site, the recovered data is used along with information from other steps in the paving process. Every step in this process can be logged comprehensively. is starts with production of the asphalt at the plant and the type of mix employed and temperatures at discharge into the trucks, the logistics operation to transport the material to site, the times required and the material temperatures


at discharge into the trucks, the logistics operation to transport the material to site, the at delivery onsite.


It also includes the paving operation with an evaluation of material segregation, as well as density behind the screed (if a tamper bar
red scanning to show the heat distribution across the mat. Finally, it includes the compaction operation combining data recovered from the compaction systems in the roller eet.









analysed and logged into the BIM process for the entire road project. Some road machinery manufacturers, such as BOMAG or the Wirtgen Group, have their
It also includes the paving operation with an evaluation of material segregation, as well as density behind the screed (if a tamper bar type is used in this latter case) and infrared scanning to show the heat distribution across the mat. Finally, it includes the compaction operation combining temperature, position and mat density data recovered from the compaction systems in the roller eet. is information is stored at the site o ce and can be viewed remotely, analysed and logged into the BIM process for the entire road project. Some road machinery manufacturers, such as BOMAG or the Wirtgen Group, have their own packages for this data management


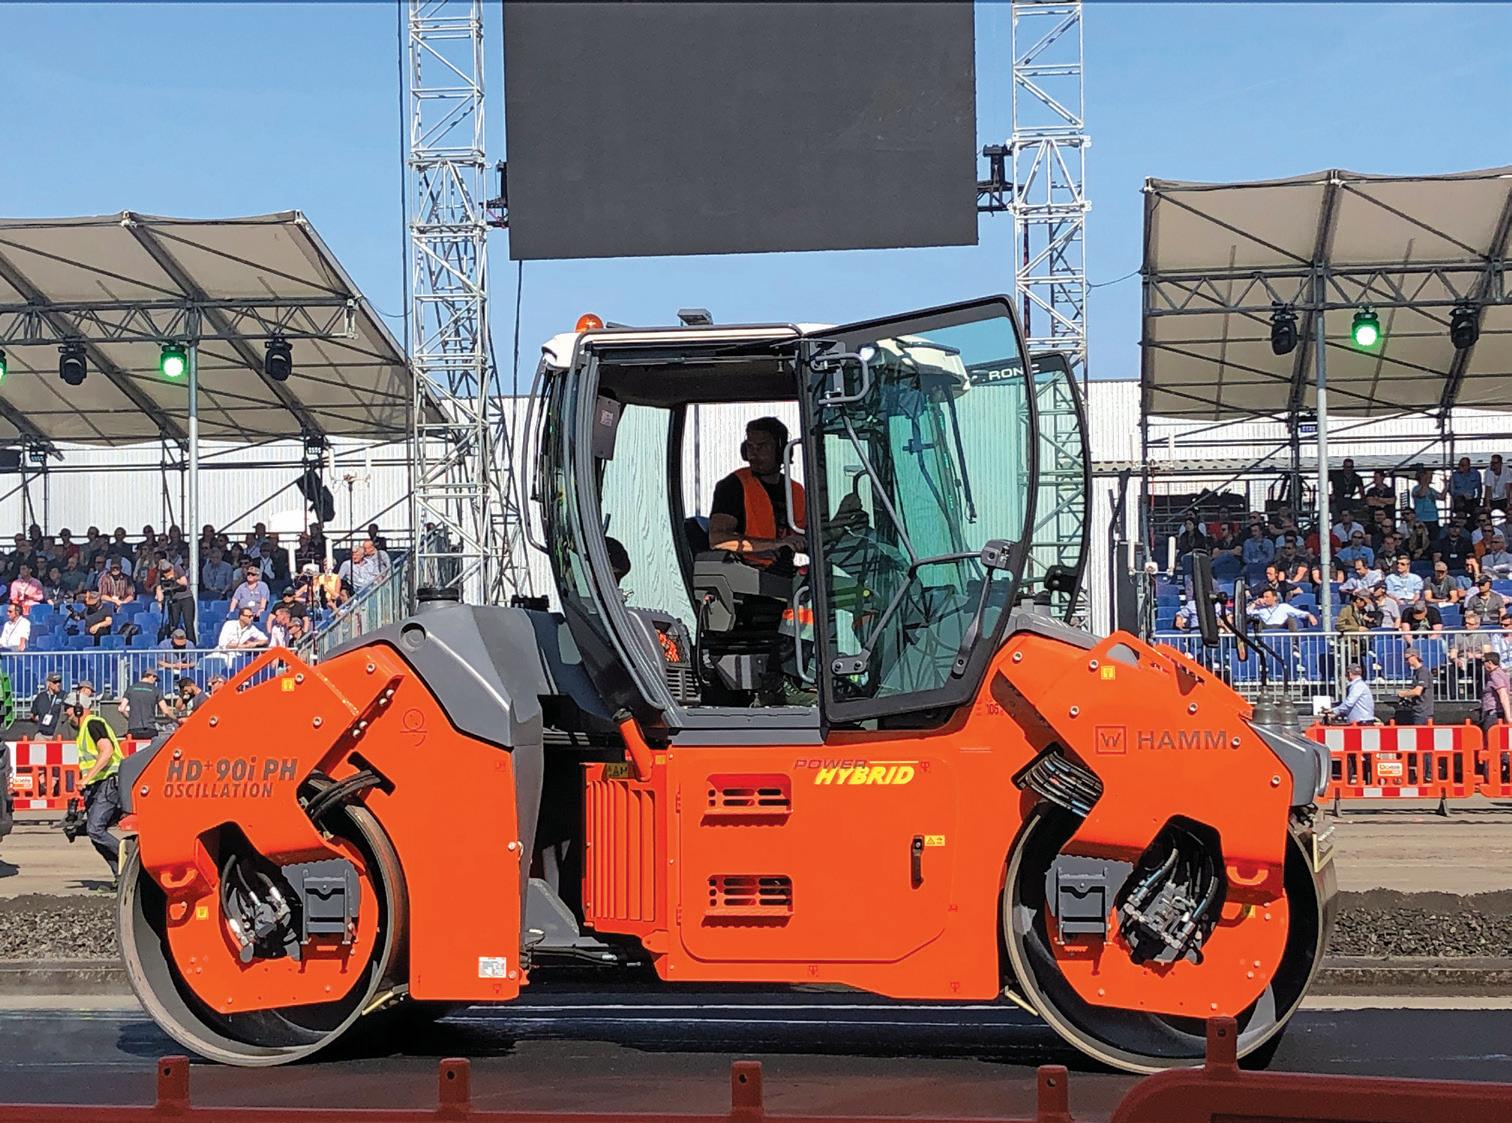
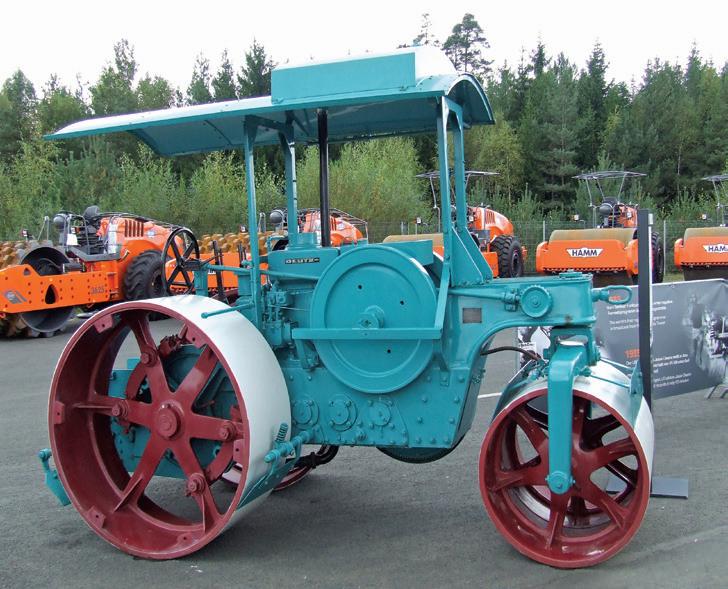
RIGHT: Hamm’s hydraulic hybrid compactor is available with oscillation BELOW: The first powered compactors were deadweight rollers
process. Machine control technology specialist companies including Leica Geosystems, Topcon and Trimble also offer software with this capability.
Looking at future advances in compaction, BOMAG and Hamm have been trialling autonomous compaction technology, although it will be some time before such technology is on the market. Regulation covering their use will have to be developed before such technology can be used on site.
Compacting the road surfacing material is crucial for ensuring its long-term performance. At first deadweight rollers were used for this purpose but in the 1930s the first vibrating rollers were developed. Using vibration to compact the road surfacing material boosted working efficiency and productivity considerably, allowing lighter compaction equipment to reach design densities more quickly and even using smaller pieces of machinery.
In the 1980s, Hamm started working on a system for compaction using oscillation instead of vibration. Oscillation compaction was intended to boost working efficiency further, while eliminating some of the shortcomings of vibration technology. Industry interest in the system was minimal and for many years Hamm was the only manufacturer to offer oscillation technology, although it continued to offer vibration technology for the majority of its models.
But over time, the benefits of compaction by oscillation started to become apparent. Instead of delivering an impact load in a vertical direction as with vibration, oscillation is a kneading action to compact a surface. While the vertical impact of a vibration system results in energy unused from each blow being transmitted through the surface, the kneading action of an oscillation system means that there is almost no wasted energy. While compactors featuring vibration cause vibrations to travel some distance, this is not the case for oscillation rollers. As a result, one of the first widespread duties for oscillation compactors was on bridge decks where there was the risk of damage to the structure because of resonances. Similarly, these machines could be used in urban areas without risk of damaging historic buildings or affecting sensitive computing equipment or electronics.
Another benefit is that it is almost impossible to over-compact a surface. With vibrating rollers, too many passes can result in over-compaction and breaking up of
the aggregates in the surface material. This cracking of aggregates simply does not occur using oscillation as a machine will achieve full density and then not have any further effect on the surface, even if it continues working. Although Hamm pioneered compaction by oscillation, BOMAG also now offers a wide range of machines. Other roller manufacturers offering compactors featuring oscillation-type compaction include Ammann, Caterpillar, Dynapac, Sakai, Volvo CE and XCMG.
With regard to hybrid rollers, it does beg the question why these were not developed earlier. The operation of a compactor, with its forward and backward motion, lends itself to the use of energy-recovery systems - perhaps more so than most types of construction machinery.
Nor is it that hybrid technology is particularly new, having been used successfully in the earthmoving equipment sector for some years. Komatsu has had particular success with its diesel-electric system, a configuration also now used by a number of other manufacturers. Caterpillar, meanwhile, opted to use a hydraulic system for recovering energy for its hybrid crawler excavator.
BOMAG first exhibited a prototype asphalt compactor featuring a diesel- electric hybrid
system some years ago. But the cost of the diesel-electric drive technology was thought prohibitive. It was not until more recent times that Hamm unveiled its pre-production hybrid compactor featuring a hydraulic system. BOMAG followed soon after using a similar technology. Now in series production, these machines use a hydraulic hybrid system to recover energy and store this in a hydraulic accumulator.
The hydraulic hybrid system recirculates stored energy from the accumulator at the point of peak energy demand from the compactor’s drive system. This peak comes as the compactor’s vibration system starts at the beginning of a roller pass.
Because the machine has the hydraulic hybrid package, it can operate with a smaller diesel engine than would otherwise be required. This provides a significant reduction in operating costs, not just because of lower fuel consumption, but also from less maintenance as it features a simpler exhaust after-treatment package. n
Ammann www.ammann.com
BOMAG www.bomag.com
Caterpillar www.cat.com
Dynapac www.dynapac.com
Hamm www.hamm.eu
Leica Geosystems www.leica-geosystems.com
Sakai www.sakaiamerica.com
Topcon Positioning www.topconpositioning.com
Trimble www.trimble.com
Volvo CE www.volvoce.com
XCMG www.xcmg.com
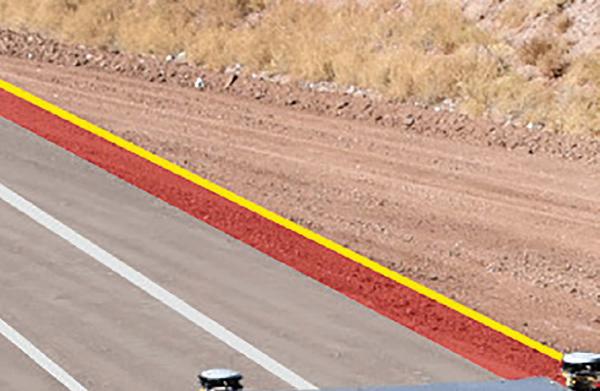
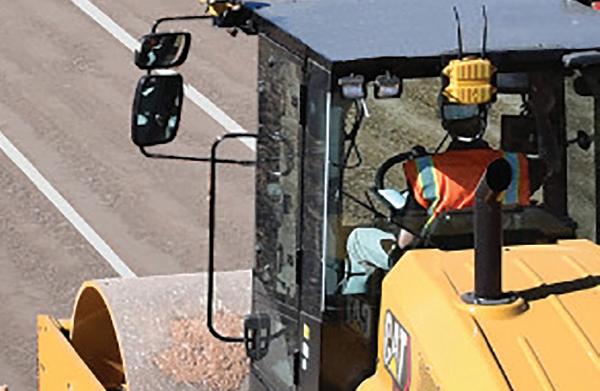
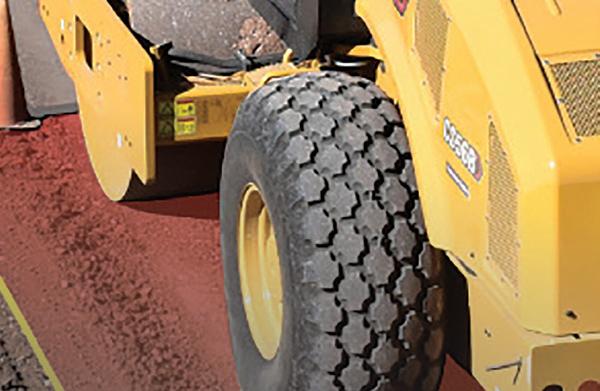
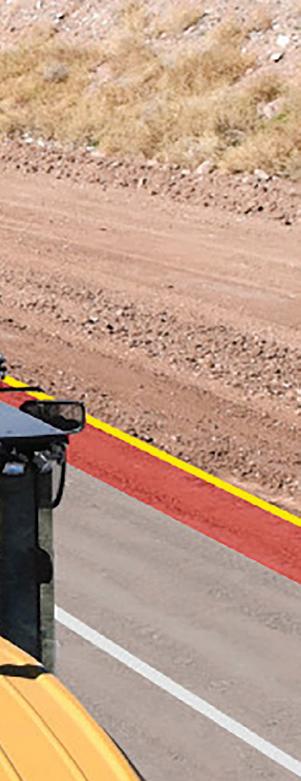

By keeping compaction parameters consistent, Command can improve compaction coverage by up to 60% compared with a novice operator
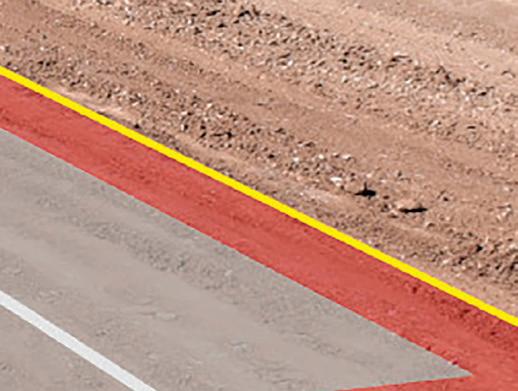

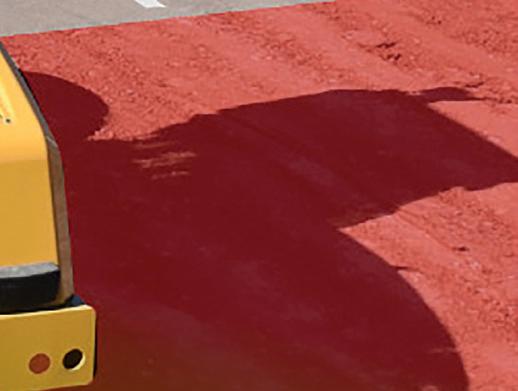

Caterpillar sets out the case for using automated compaction systems, such as its Cat Command for Compaction
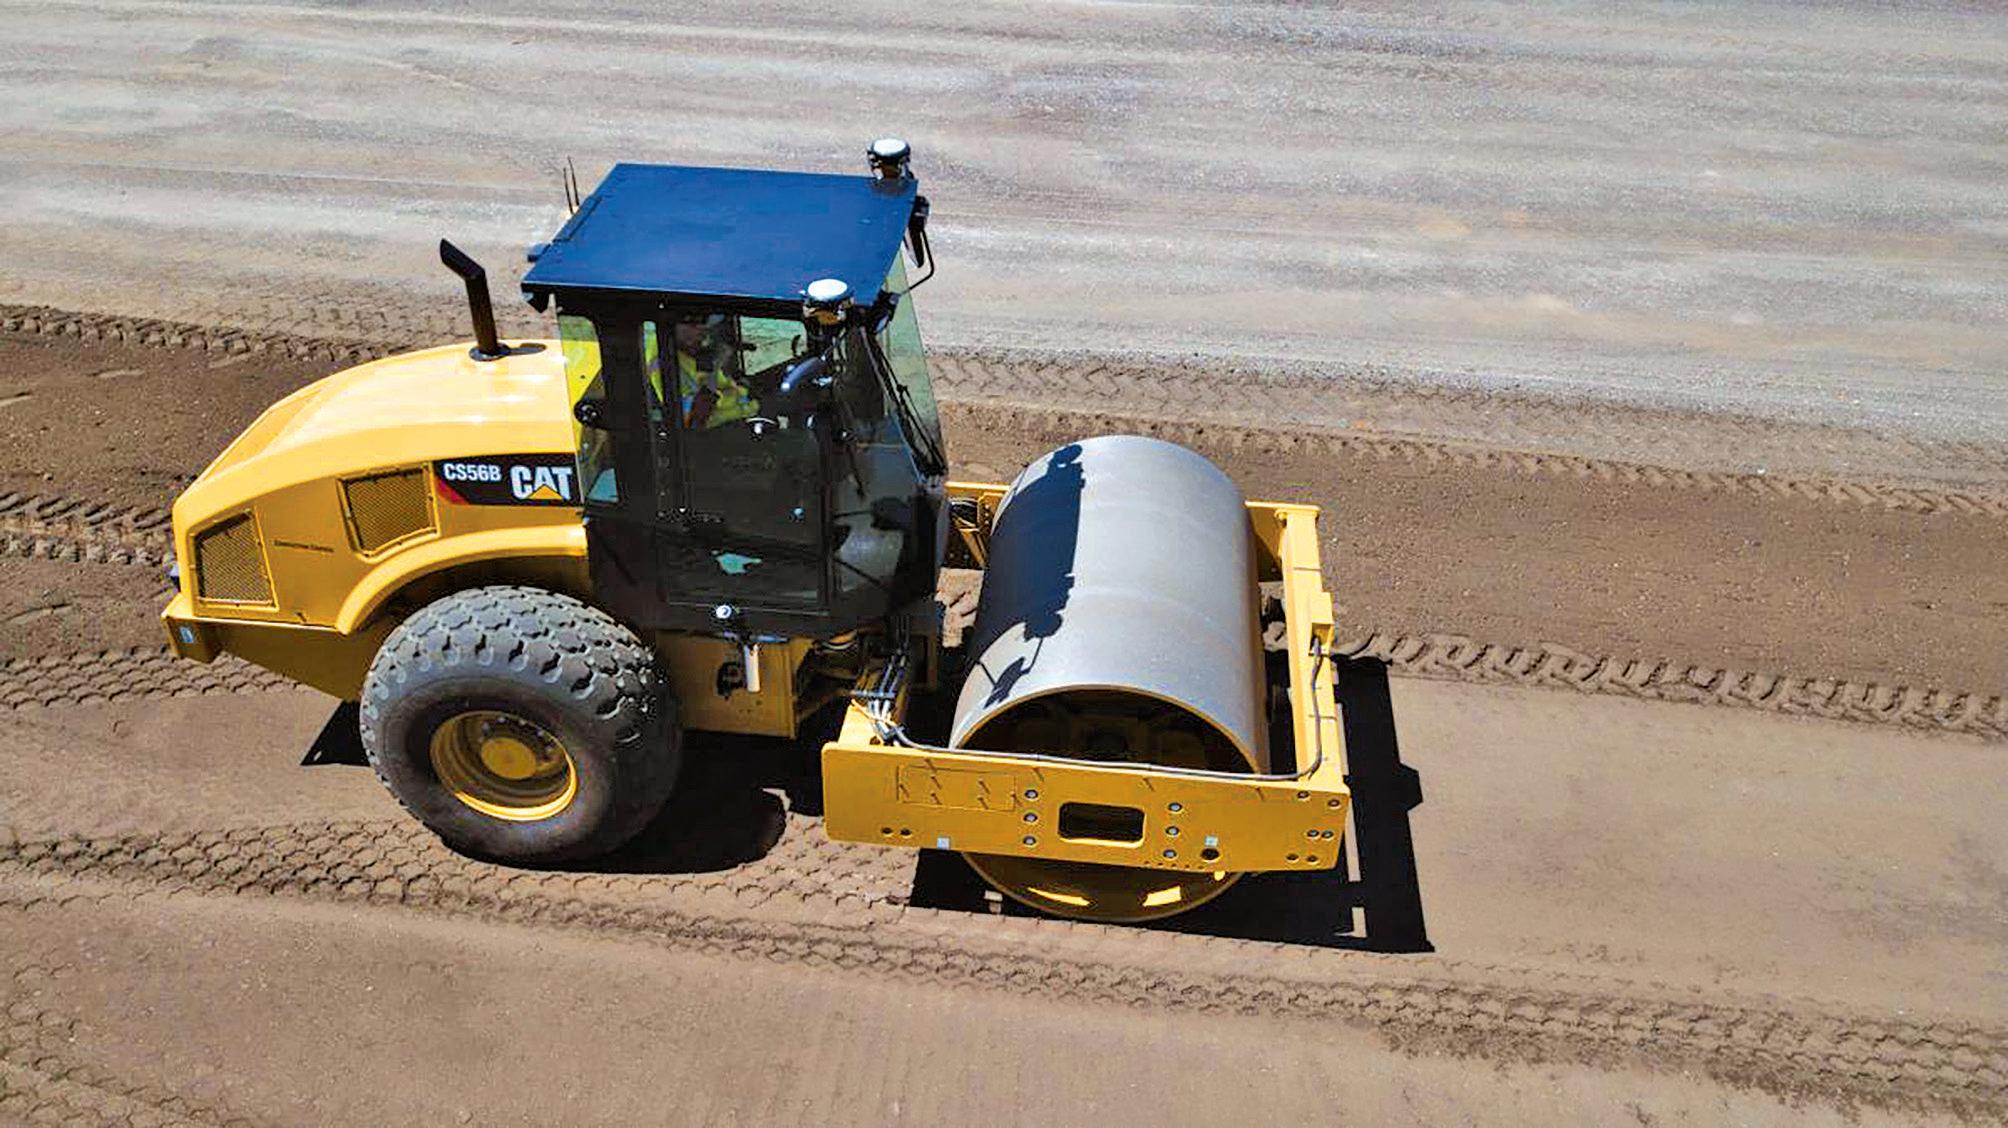
Cat Command for Compaction is an operator-assisted, semiautonomous technology that automates the compaction process based on operator inputs.
It controls the speed, direction, steering and vibration system of the vibratory soil compactor to promote consistency in compaction - one of the most important aspects of construction to ensure a good road surface.
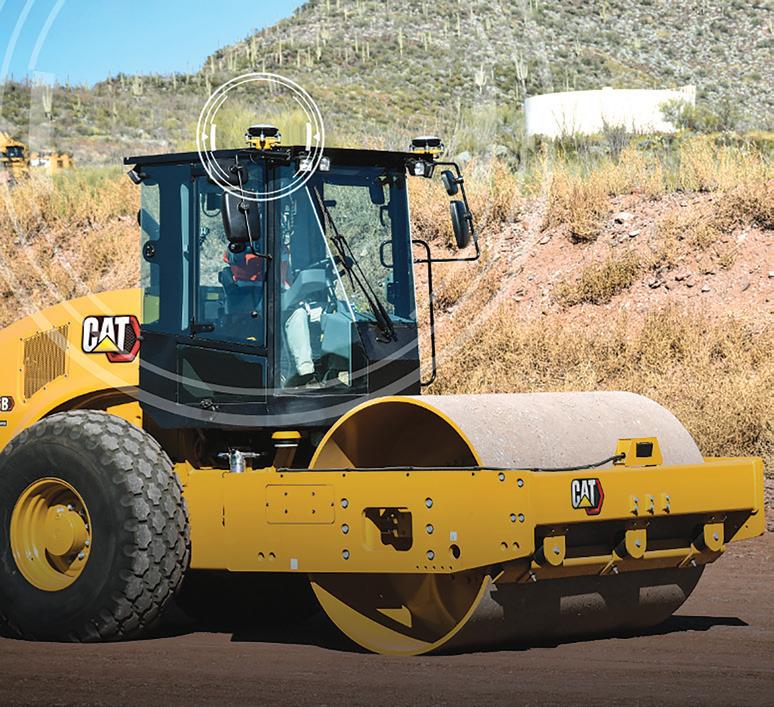
e heart of the system is dual real-time kinematic positioning (RTK) which helps to achieve up to 60% better area coverage (see box RTK positioning). e system connects
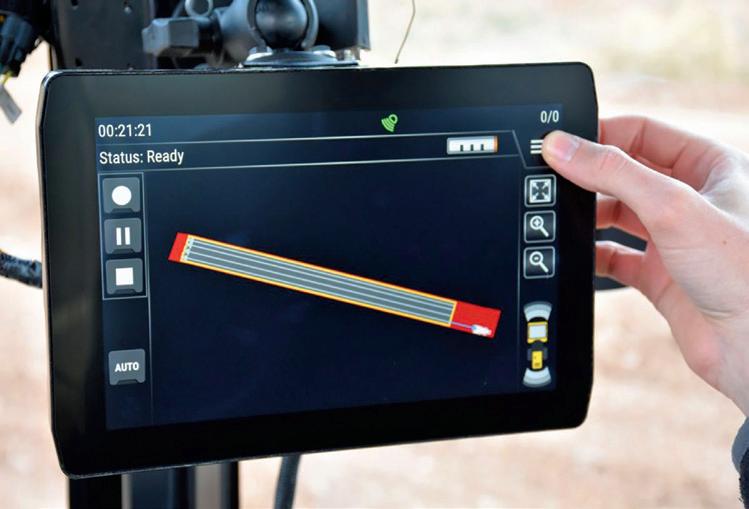
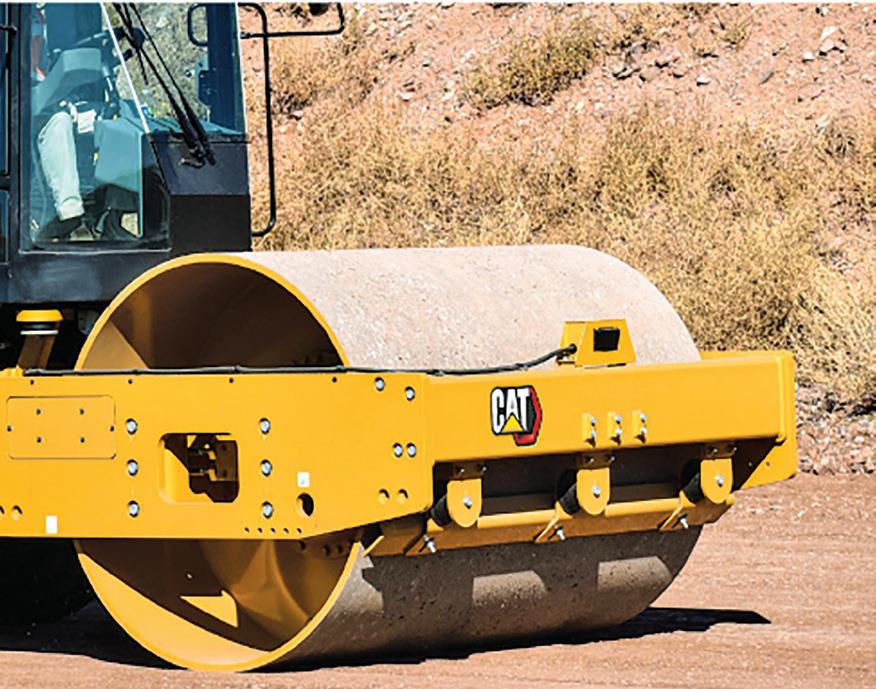

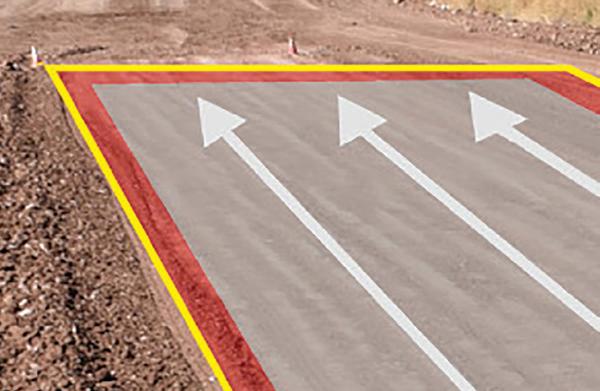
to commonly used base stations with no site design les or back-o ce work necessary. e operator tells the system where to compact by physically de ning the boundary of an area with the machine, or loads a previously recorded and saved area from the display.
e operator then tells the system how to compact through three simple inputs:
the number of passes to make at each amplitude setting;
the ground speed;
the amount of overlap.
A er verifying that the area is safe and clear, the operator engages Command and the system executes compaction. However – and
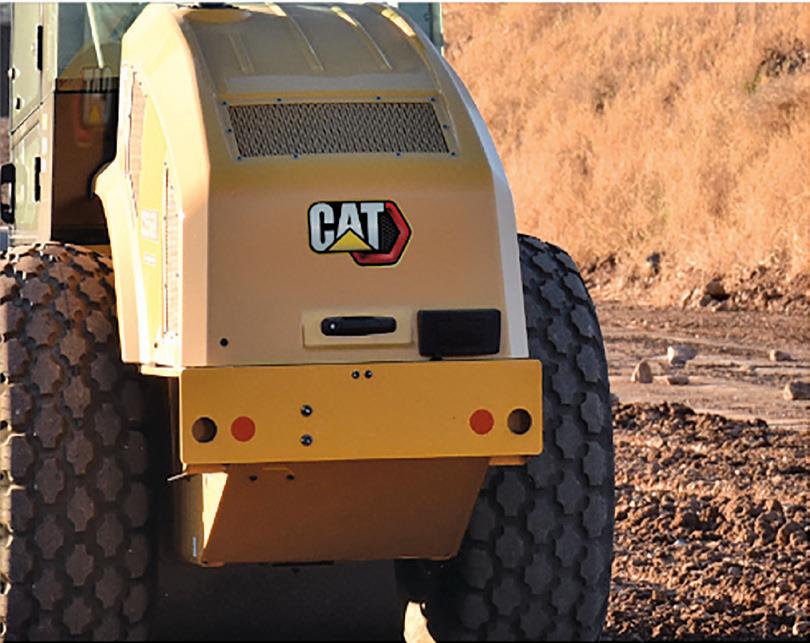
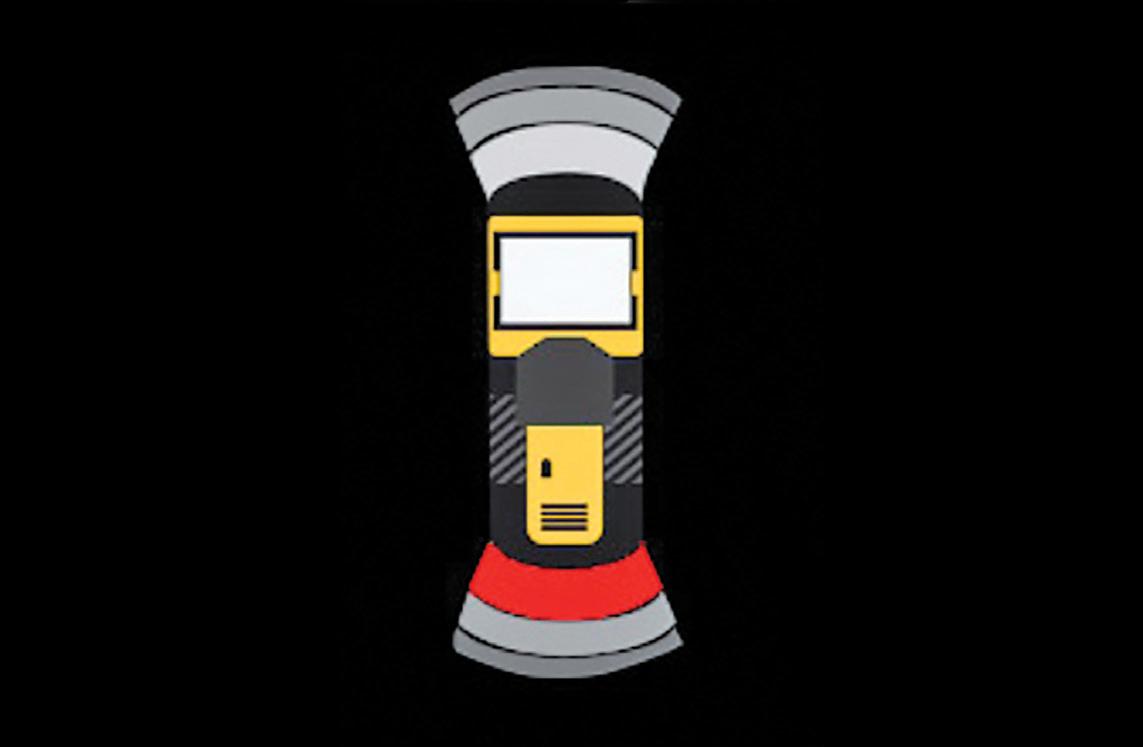
importantly - the operator can intervene at any time to control the vibration system or stop the machine.
Also, for added safety, Command includes an integrated object detection system that alerts the operator if something is in front or behind the machine.
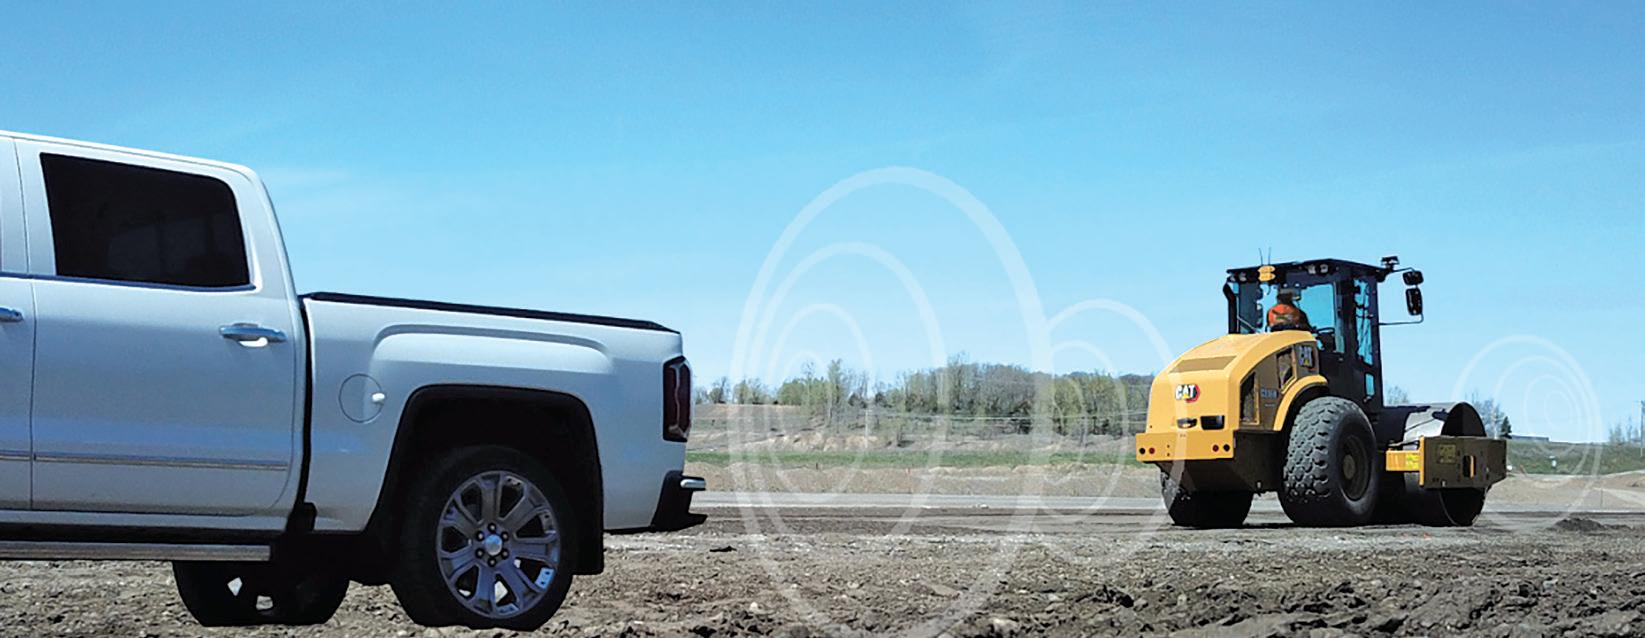
A major advantage of such systems as Cat Command is that they can eliminate a skills gap. They allow inexperienced operators to reach a high level of efficiency in both quality of workmanship and use of time.
For example, Command performs at a constant speed with the correct number of passes at the correct vibration setting and with the correct amount of overlap, no matter who is in the driver’s seat.
Command ensures a uniform compaction process even on jobsites where multiple
operators run a single machine during the day. Quality control in these situations can be maintained at the highest levels.
By keeping compaction parameters consistent, Command can improve compaction coverage by up to 60% compared with a novice operator. Increased process control and precise overlap help promote more consistent and predictable compaction results. This is especially important when attempting to hit compaction targets more frequently.
Users of such systems are commonly found to be concerned over the complexity of the
products. However, Command is simple to set up. The intuitive, touchscreen interface with its three simple inputs is all that is needed after the compaction area is defined. Recent jobs are saved in the system and can be accessed via the interface.
The jobsite safety aspect of Command cannot be overstated. As noted, the system’s integrated object detection system alerts the operator to objects in the path of the machine. This safety feature is functional whether the operator is in automatic use or manual use where he is in direct control of the machine.
Furthermore, there are several system interlocks to help promote safe operation by preventing the machine from entering auto mode. If any interlock is triggered while the machine has already been placed in auto, the system automatically stops the machine and releases it from auto operation. n
Real-time kinematic, or RTK, positioning is a satellite navigation technique used to enhance the precision of position data derived from satellite-based positioning systems, called global navigation satellite systems or GNSS. Examples of GNSS include GPS, GLONASS, Galileo, NavIC and BeiDou. With reference to GPS in particular, the system is commonly referred to as carrierphase enhancement, or CPGPS. It has applications in land survey, hydrographic survey and in unmanned aerial vehicle navigation.
The US city found major savings in time and money using an arti cial intelligence-based system for pavement condition management, explains Benjamin Schmidt, president and co-founder of RoadBotics
Condition assessments are an essential precursor to pavement rehabilitation and planning. However, there are many approaches as to how these assessments can be completed.
From manual inspections to the use of laser vans, each option has its bene ts and drawbacks in terms of time saved and costs as well as the quality and breadth of data. When evaluating pavement assessment options, municipalities and contractors must also consider centreline mileage, budget and manpower.
For years, the US city of Savannah, in the eastern state of Georgia, used a team of interns to complete a manual inspection of the road network. Frustrated by the long, costly and subjective process, city o cials adopted RoadBotics’ arti cial intelligencebased automated pavement assessment. RoadBotics’ technology gave Savannah clear, objective and actionable data which it used to develop a sustainable pavement management plan.
Savannah, on the northern coast of Georgia, is the fourth largest port in the US. It is also the largest terminal container facility in North America, processing 33.4 million tonnes of cargo annually. Located between the I-95 and I-16 interstate highway
RATING 2 Minor surface damage, no critical issues
RATING 3 Appearance of pervasive distresses
RATING 4. Signi cant damage or emerging critical failures
RATING 5 Major surface damage and/or critical fatigue issues
corridor, infrastructure is the backbone of the city. With such signi cant commercial and industrial demands on roads, proper assessment and maintenance is paramount. However, the city’s previous assessment approach of the network did not provide the level of accuracy that the city authority wanted. Each summer, the city would recruit and train a team of interns to complete pavement assessments for one-third of the 730-mile (1,175km) road network. e process involved one week of training
followed by manual assessments of the roads using the PCI Index scale*. e collected data was transferred from the interns’ paper notes into a database.
A full network assessment was incredibly resource-intensive, taking three years and around US$130,000 to complete. Due to the short training time and multiple individual assessors, the data was subjective, inconsistent and sometimes inaccurate. e city authority was making city-wide pavement planning decisions based on outdated and unreliable data.
Heath Lloyd, Savannah’s chief infrastructure and development o cer, and Joe Shearouse, assistant to the city manager, sought an alternative to the ine cient process. A er learning about RoadBotics’ automated pavement assessments, Lloyd secured city council funding to test the technology on half of the network. Satis ed with the results, they agreed to move forward with RoadBotics to complete the full assessment.
RoadBotics’ system collects data, analyses it and then displays it through a mapping so ware platform. e actual assessment begins with data collection through one of today’s most ubiquitous devices - the

smartphone. e smartphone is mounted in the windscreen of a vehicle and collects video footage of the road as a user drives the network.
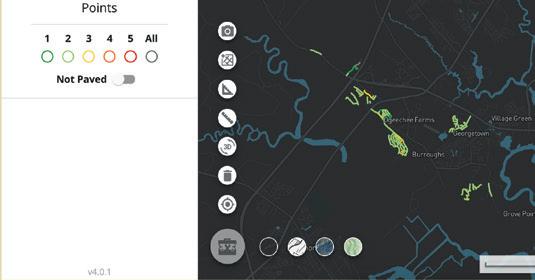
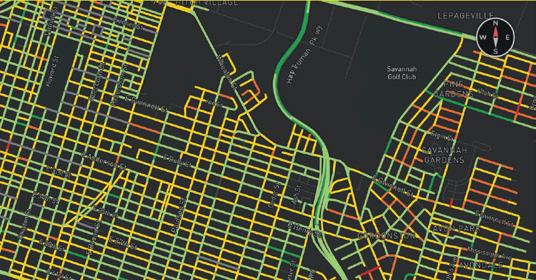
e footage is fed through a vision-based machine-learning model; an application of arti cial intelligence where the model is trained to analyse speci c patterns and present the data in a picture. RoadBotics’ model speci cally identi es road distresses and assigns condition ratings on a 1-5 scale, as shown in Figure 1. In addition, RoadBotics’ technology can locate every pothole and surface distress within the road network
RoadBotics’ so ware automatically divides road network footage into image-based data points at 3m intervals. e model analyses each image, building up from pixels to the entire image in order to identify pavement distresses. For Savannah’s road network, RoadBotics’ AI analysed almost 400,000 road images.
A er the analysis is complete, data points and their images are plotted on a colourcoded GIS-enabled map called RoadWay. Users can view, assess and analyse road conditions at an o ce desk or in the eld.
Compared to Savannah’s previous method of pavement assessments, the adoption of RoadBotics’ technology resulted in signi cant resource savings for the city. e entire process - from two data collection rounds to the nal delivery of the whole networktook six months and cost $50,000. is was a fraction of the time and money spent on previous assessments.
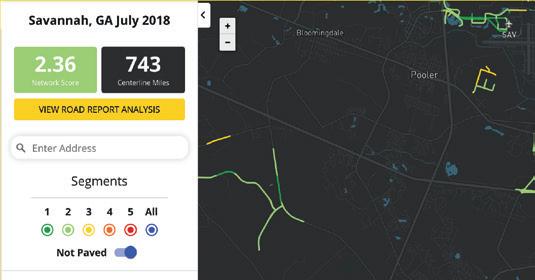
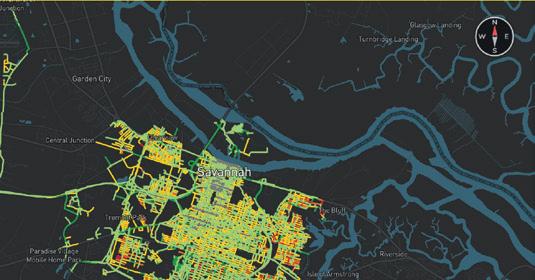
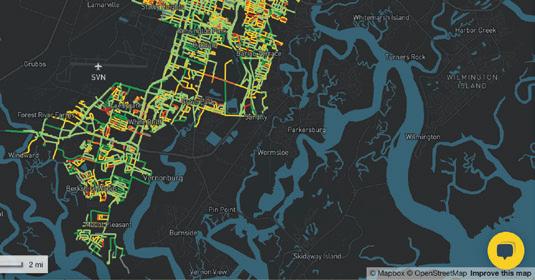
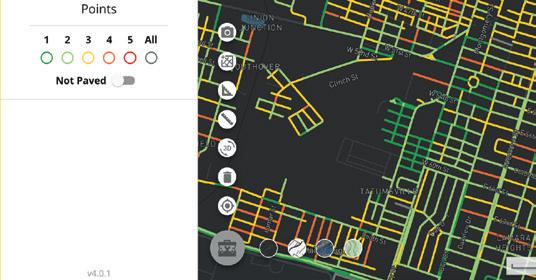
Upon delivery, Lloyd and Shearouse gained full access to Savannah’s assessment map on RoadWay, shown in Figure 2. Key features of the pavement assessment are colour-coding, point level images and ratings and the Road Report Analysis. For the rst time, they had an objective, up-to-date and holistic view of the city’s road conditions.
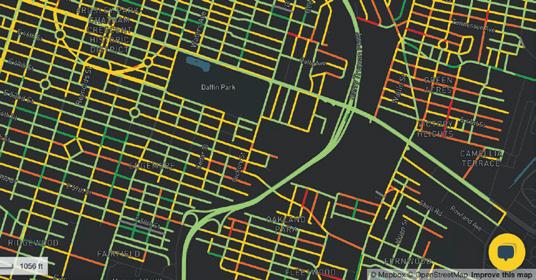
e RoadWay system is, according to Lloyd, a “simple, yet all-inclusive tool” for assessing the condition of Savannah’s roads. e colour-coding on the map, which correlates to the condition rating assigned to point level imagery, is then extrapolated
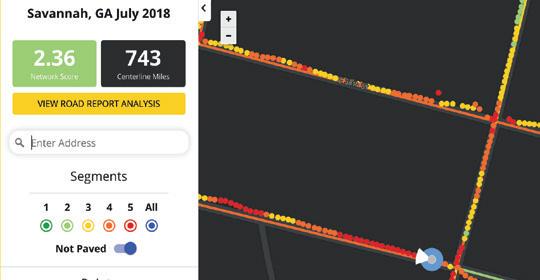
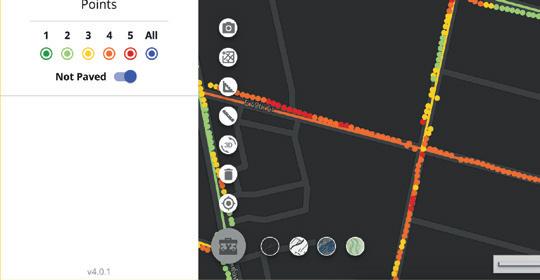
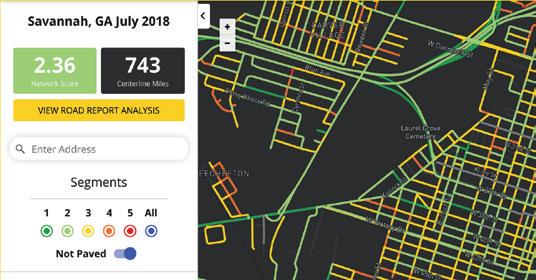
into segments. Figure 3 illustrates the road segment ratings in downtown Savannah. Green points and segments equate to good road conditions and red equates to poor conditions or pavement failure.
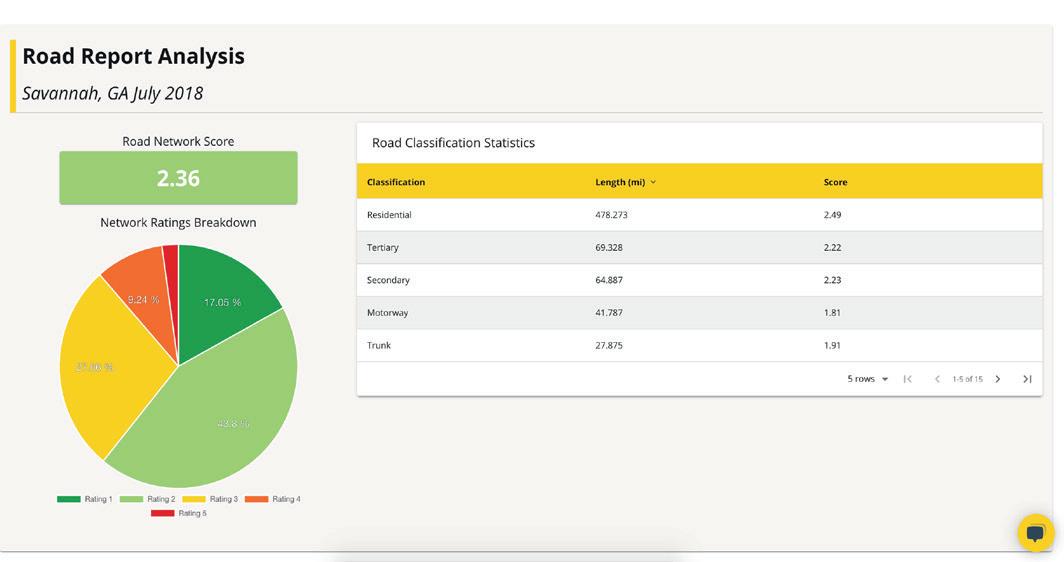
When developing pavement management plans or addressing a concern in the community, the team in Savannah rst looks at the overall system before analysing neighbourhood-speci c or point level imagery. e Road Report Analysis, shown in Figure 4, is a vital tool for understanding the overall condition of the network. Point level pavement condition rating data is aggregated to form the overall network score, road classi cation score and the percentage of roads at each rating.
With an overall network score of 2.36, Savannah’s network is in “good” condition, as noted by the RoadBotics’ rating. Over 60% of roads are rated a q1 or 233 - exhibiting no or minor surface distressing. Conversely, however, nearly 40% of the roads are in need of rehabilitation to prevent further deterioration.
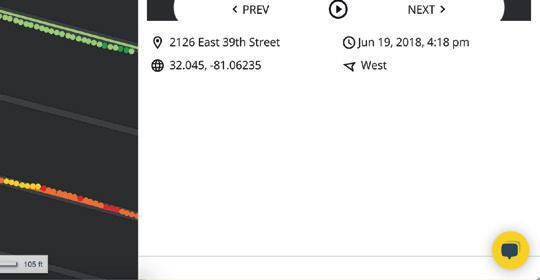
To better understand why a road is rated a 3, 4 or 5, Lloyd and his team view and assess the point level data. Point level data, as shown in Figure 5, is a powerful diagnostic tool. By understanding the prevalence and severity of pavement distresses, they can determine the rehabilitative method best suited for prolonging the life of the road.
e granularity of point level data, in combination with segment, road and overall ratings, provided Lloyd and Shearouse with the necessary information to develop a data-driven and sustainable pavement management strategy.
For Lloyd and Shearouse, the purpose of adopting RoadBotics’ automated road assessment was to use the data to develop a sustainable pavement plan for Savannah. One goal of Lloyd’s plan is developing a strategy to address not only the worst roads but, more importantly, prevent the roads with pervasive distressing from deteriorating further.
“So, what we’re looking at is certainly a mix of roads from 3, 4 and 5,” explains Lloyd. “We want to get some of the worst roads
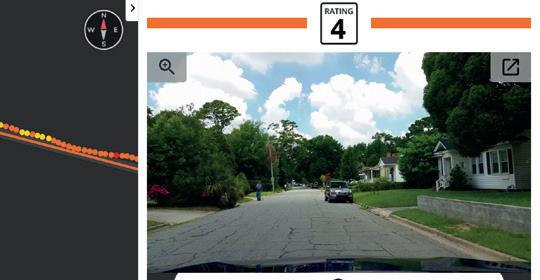


obviously, but then we want to stop roads that may be assessed at a 3 from getting worse. We don’t want them to get to a 4.”
Additionally, the city found tremendous value in using the data to determine the rate of deterioration for each roadway, notes Shearouse. “If you continue to get annual or bi-annual scans, you can predict the rate of deterioration and more accurately keep roads in good condition to extend the infrastructure investment.”
e second goal of the sustainable plan is to prioritise infrastructure spending to make the investment stretch further. Recently the city used the data to secure the funding required for road improvements. e Special Purpose Local Option Sales Tax – SPLOST – nances capital projects and requires a majority vote by county residents. By leveraging RoadBotics’ assessment data, the city received voter approval and was given $26 million to fund the plan.
Of the SPLOST funding, 80% was allocated for repairs to roads rated 3, 4 and 5, reserving the remaining 20% for unforeseen expenditures. Because the strategic focus is sustainability, Lloyd is allocating the majority of funds to preventative maintenance to extend the life of existing pavement instead of focusing on repaving the worst roads. erefore, they allotted around 20% for repaving 5-rated roads and 60% to repairing 3- and 4-rated roads.
Savannah is only in the early stages of using RoadBotics’ road assessment data. e city plans to use this and future assessment data to develop prediction models to more accurately determine the rate of pavement deterioration and forecast the use of scarce resources.
“As a government, budgets get tight and we have to really prioritise where our resources go,” Lloyd explains. “Tools like RoadBotics allow us to make data-driven decisions.”
* e Pavement Condition Index (PCI), a numerical index between 0 and 100, is used to indicate the general condition of a pavement section. It was originally developed by the US Army Corps of Engineers but was later standardised by the ASTM – American Society for Testing and Materials - for both roads and airport pavements.
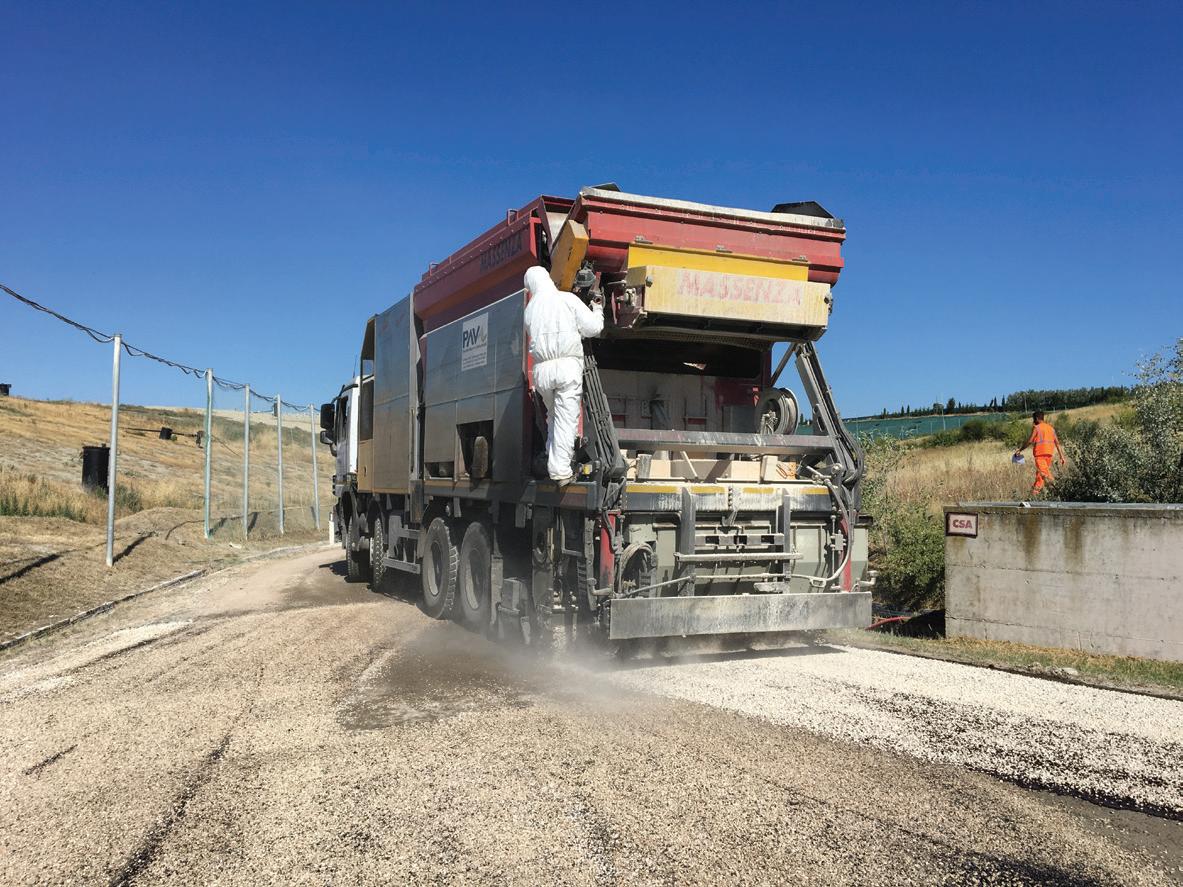
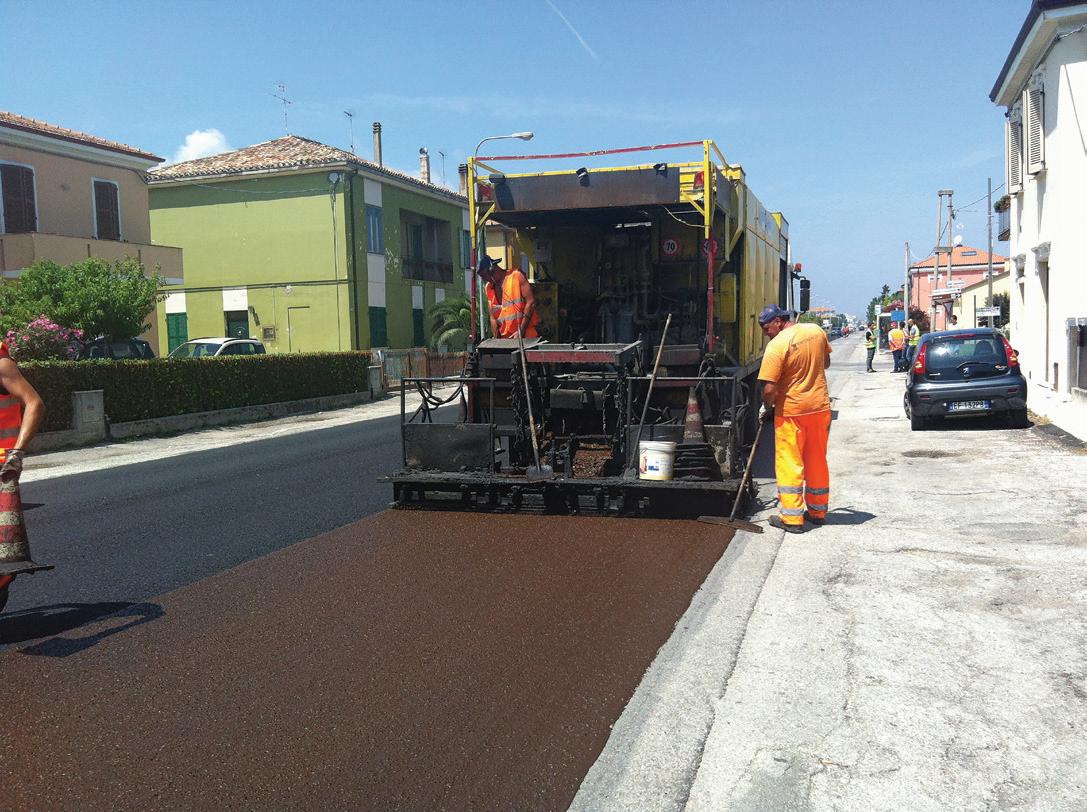
This paper - an international cooperation - focuses on the definition, description and application method for bituminous slurry surfacings, including microsurfacings*
Bitumen emulsions play a key role in the development of sustainable and durable pavements. The bitumen/water emulsification process reduces the binder viscosity, allowing production of paving mixtures at ambient temperature and, in most cases, even without aggregate drying and heating. Cold bitumen emulsion (CBE) mixtures allow important energy savings and reduction of emissions, effectively helping to reduce the impact of the road construction industry, while maintaining high standards of performance and safety of the infrastructure.
CBE technologies are used for both non‐structural (cold surface treatments such as chip seals or slurry seals) and structural (cold bituminous mixtures, cold recycled bituminous mixtures, grave emulsion) paving applications. However, the lack of fundamental knowledge on how to merge the mechanical behaviour of CBE mixtures and the in-service evidence of their long‐term performance seems to hinder the broad use of CBE technologies which are often associated with higher technical risks with respect to traditional hot‐mix or warm‐mix technologies.
In this context, the RILEM Technical Committee 280‐CBE Task Group 2 (TG2) “Multiphase characterisation of cold bitumen emulsion materials” was formed with the
aim of improving fundamental knowledge of CBE materials and suggesting worldwide harmonisation of existing standards and practices. The activities of the Task Group 2 focus on non‐structural applications of CBE technologies and specifically on bituminous slurry surfacings (BSS). A thorough literature review was initiated to collect worldwide theoretical knowledge and field experiences on BSS.
The objective of this paper is to summarise the first results of this review and propose harmonised definitions and descriptions for BSS. Typical applications of BSS are reviewed and two examples are presented to illustrate current practices.
Surface treatment is a broad term embracing several superficial application methods of bituminous binder or engineered additive with or without aggregate. Surface treatments are used to extend the pavement’s life and thus, generally, are part of the road maintenance process. They are applied on the aged and distressed pavement surface to restore its structural integrity, evenness, skid resistance and impermeability.
The most common binder used in surface treatments is bitumen emulsion, which may be modified with polymers. Recently, bitumen‐extended epoxy resins, epoxy resin or translucent synthetic binder have been used with satisfactory results in terms of setting and adhesion to most surfaces and
aesthetics.
Three main types of emulsion‐based surface treatment can be distinguished: spray‐applied seal, surface dressing (or chip seal) and BSS. In spray‐applied seals only bitumen emulsion is applied on the road surface in order to seal cracks, to reduce ravelling and to repair weathered surfaces.
Chip seals (Figure 1a) are characterised by at least one layer of bitumen emulsion and one layer of chippings (single‐size aggregate fraction). These are applied in sequence, without mixing, over the road surface to restore its surface evenness, to seal cracks, to reduce ravelling and to improve skid resistance. BSS (Figure 1b) are mixtures of aggregates, binder and additives which are applied on the road surface to improve traffic lane visibility, to seal cracks, to fill minor depressions and to provide high skid resistance.
Currently, selection of constituent materials, mix design, application and quality control procedures for BSS are based mainly on experience‐related empirical or practical rules. The comparisons of practical knowledge adopted in different countries and the gradual understanding of the mechanical properties should enable the combination of scientific and field-based approaches for a more effective and diffuse application.
Table 1 shows the list of the collected public documents such as standards, best practices and specifications. The use of an incomplete standards list and
different methods or parameters for the characterisation of the constituent materials or products have been the main difficulties in the analysis and comparison of the requirements and procedures among the participating countries.
The general definition of slurry surfacing is not univocally shared worldwide. Often, slurry surfacings are simply described by road agencies or technical associations, giving a list of constituent materials.
In the guidelines AP‐T26 from Austroads (an advisory body consisting of Australian and New Zealand transport agencies), the term “slurry” is used to indicate “stable suspension of aggregate and filler in a less dense, liquid bituminous emulsion”. In its fresh state, the liquid consistence makes BSS self‐levelling. Taking this remark as a starting point and analysing the terminology used, slurry surfacings represent a family of mixtures which generally share consistency (slurry) and applications (surfacing) with no specific indication on the binder or aggregate to be used.
A slurry surfacing can be defined as a mixture that is characterised by a slurry state, meaning free-flowing with a definite volume but no fixed shape, having higher density and consistence than a liquid. After laying, it evolves into a solid state during curing that takes generally from half an hour to 12 hours. This evolutive behaviour distinguishes slurry surfacing from other surface treatments such as spray‐applied seals and surface dressing.
As the name implies, the use of bitumen emulsion as a binder identifies BSS. Among BSS products, slurry seals and microsurfacings can be distinguished and selected for specific performance and uses based on their maximum aggregate size and the bituminous binder type.
Country National/ International Standard
Best practice/ Guideline
Construction Specification
Australia ‐ Austroads [19] Austroads [19]
Brazil DNIT [10] Instituto Pavimentar [18] ‐
Canada, USA ASTM [8] ISSA [13,14], AZAGC [15] ‐
China ‐ ‐ JTG [24]
Czech Republic CEN [7], ČSN [11] ‐ Ministerstvo Dopravy [24]
France CEN [7] CEREMA [5] ‐
Italy CEN [7] SITEB [12] CIRS [20], ANAS [21], Autostrade per l’Italia [22]
Portugal CEN [7] ‐ Estradas de Portugal [23]
Spain CEN [7] ATEB, [16,17] ‐
Switzerland CEN [7], VSS [9] ‐ ‐
Material
Typical values Recommendation
Bitumen [% by aggregate weight] 6 ‐ 16 The finer the aggregate size, the higher the bitumen dosage
Filler [% by aggregate weight] 0 ‐ 3 Depending on bituminous emulsion properties, mechanical behaviour and climate
Mixture application rate [kg/m2] 4 ‐ 30
The finer the aggregate size, the lower the application rate

and for wearing course applications requiring good surface texture”. A slurry seal, instead, is defined as a “thin layer of bituminous slurry surfacing, usually without a polymer modifier”.
pavements. In Brazil and Czech Republic, slurry seals are now limited to use by small towns on low-volume roads and for fast, temporary maintenance.
DESCRIPTION
BSS is a bituminous mixture consisting of a well‐graded aggregate blend, water, bituminous emulsion (which may be modified) and filler (which may include Portland cement, hydrated lime, limestone dust, fly ash or a combination of these). Specific additives and fibres may also be included to improve affinity with aggregates, consistency or setting time. Because different expertise and application methods exist around the world, the constituent materials of BSS can be proportioned considering a wide range of dosages (Table 2).
As stated by the Arizona Chapter, Associated General Contractors, “although microsurfacing and slurry seals are generally similar, microsurfacing is designed to facilitate a quicker return to traffic, heavier application rate, rut filling and support higher traffic volume”. Accordingly, the International Slurry Surfacing Association (ISSA) asserts that “microsurfacing is a quick‐traffic system that allows traffic to return shortly after placement”.
The Austroads guidelines AP‐T26 defines microsurfacing as a “bituminous slurry surfacing, usually containing polymer, which is capable of being spread in variably thick layers for rut filling and correction courses,
Considering the technology development over time, slurry seal can be identified as the first generation of BSS, aimed to seal old pavement surfaces. Microsurfacing can be considered as the second generation of BSS, following on from the development of more advanced construction equipment and the improvement of binder performance.
Microsurfacing is characterised by higher performance, faster setting and curing time. Therefore, it allows more durable applications, heavier traffic volume and quicker opening of the road to traffic. This is probably the reason why, in many countries such as Italy, Brazil and Czech Republic, the use of slurry seals has been replaced by microsurfacing, especially on heavily used
BSS is proportioned, mixed and uniformly laid in‐place at ambient temperature over a properly prepared surface. It is applied as a homogeneous mat, adheres firmly to the pavement and has a skid‐resistant texture throughout its service life (Figure 2). BSS may consist of one or two layers, each usually with the thickness of the largest aggregate size in the gradation.
As stated before, some differences arise when comparing the descriptions of slurry seals and microsurfacings from different countries, even if their general design is globally consistent. Microsurfacing is commonly considered different from slurry seal for the use of polymer‐modified emulsion and superior aggregate quality. Moreover, the nominal maximum size for microsurfacing is often larger than that in slurry seal. It is worth noting that
the European Norm EN 12273 makes a distinction between microsurfacing and slurry seal only on the basis of aggregate size (“slurry surfacing made with larger size aggregates is often known as microsurfacing and when made with smaller aggregates is sometimes called slurry seal”).
According to ISSA guidelines slurry seal and microsurfacing share two aggregate bands, type II (Dmax = 4.75mm) and type III (Dmax = 6.7mm), whereas type I (Dmax = 2.36mm) is used only for slurry seal (where Dmax is maximum particle size).
The Portuguese specifications adopt slurry seal and microsurfacing with the same aggregate band when applied in a single layer (Dmax = 5.6mm). On the other hand, when they are applied in a double layer, they share only the aggregate band for the first layer (Dmax = 2mm). For the second layer, microsurfacing requires larger aggregates (Dmax = 8mm) than slurry seal (Dmax = 5.6mm). Table 3 summarises the differences between slurry seal and microsurfacing based on the Brazilian experience.
BSS is used to maintain and extend the service life of existing bituminous pavements through resistance to abrasion by traffic and providing a waterproof cover over an old pavement surface. Moreover, according to the French technical guidelines, BSS can also be used in new construction when traffic levels are less than 300 vehicles/day.
Table 4 summarises the main applications of slurry seal and microsurfacing in different countries. As can be observed, they are normally adopted:
‐ to prevent surface water from penetrating underlying pavements;
Table 3. Difference between slurry seal and microsurfacing from Brazilian experiences
Smooth‐textured aggregate can be used
Slow-setting bituminous emulsion
Climatic conditions have a paramount impact on curing evolution
Mainly used for sealing and rejuvenating road pavements subjected to low or medium traffic volume
Service life of about 3‐5 years
Closing time to traffic of about 4 hours
Could require a tack coat
Average cost: 0.90 €/m2
‐ to restore or to improve skid resistance of aged pavement; ‐ to restore weathered surfaces, giving new life to oxidized and ravelled pavements;
‐ to fill surface voids and microcracking;
- to improve the aesthetics of a pavement by providing a distinctive colour to the road surface, a more uniform appearance to a patched road as well as to aid in contrasting road marking and lending a homogeneous surface appearance to help drivers select a lane or route.
Slurry seal also has the following additional specific uses (Table 4):
‐ to provide temporary cover at low cost;
‐ to provide smooth surfaces for pedestrian areas, car parking lots, school yards and bicycle tracks.
Whereas, microsurfacing is specifically chosen:
‐ to provide shape correction and reprofiling rutted wheel paths;
‐ to achieve longer durability and faster traffic opening.
Slurry seals are mainly used in urban areas or in low‐volume roads. However, in Australia and France, they are used also in airfields to restore skid resistance and to serve as
Crushed and high‐quality aggregate must be used. Generally larger in size
Modified (elastomeric) bituminous emulsion with controlled setting
Chemical process, along with climatic conditions, controls curing evolution
Mainly used for improving skid resistance and levelling road pavements subjected to any traffic level
Service life of about 5‐8 years
Closing time to traffic of about 1 hour
Good adhesion to existing pavement
Average cost: 2.00 €/m2
preventive maintenance – it helps reduce the risk of coarse aggregate being plucked out of the surface to be hit by airplane propellers or ingested into jet engines. Moreover, Austroads reports that slurry seal can be applied as an alternative to sprayed sealing, for example, within urban areas where traffic noise from a sprayed seal would not be acceptable.
Meanwhile, microsurfacing offers a wider range of possible applications. In some cases, it is considered an alternative to traditional hot or warm bituminous mixtures. For instance, in Italy, microsurfacing applications over new pavement have been carried out to provide a cost‐effective and time-saving alternative to a traditional wearing course. Similarly, in Australia, microsurfacing can be used where a non‐structural wearing course is required, where the increase of the average pavement surface level must be minimised or where a dense-graded bituminous surface is desirable at low cost.
Because of its vast territories and long hauling distances, Brazil has a strong tradition in the use of BSS and a consistent number of companies own machineries for slurries. The advantages of microsurfacing have made it prevail over slurry seals in most
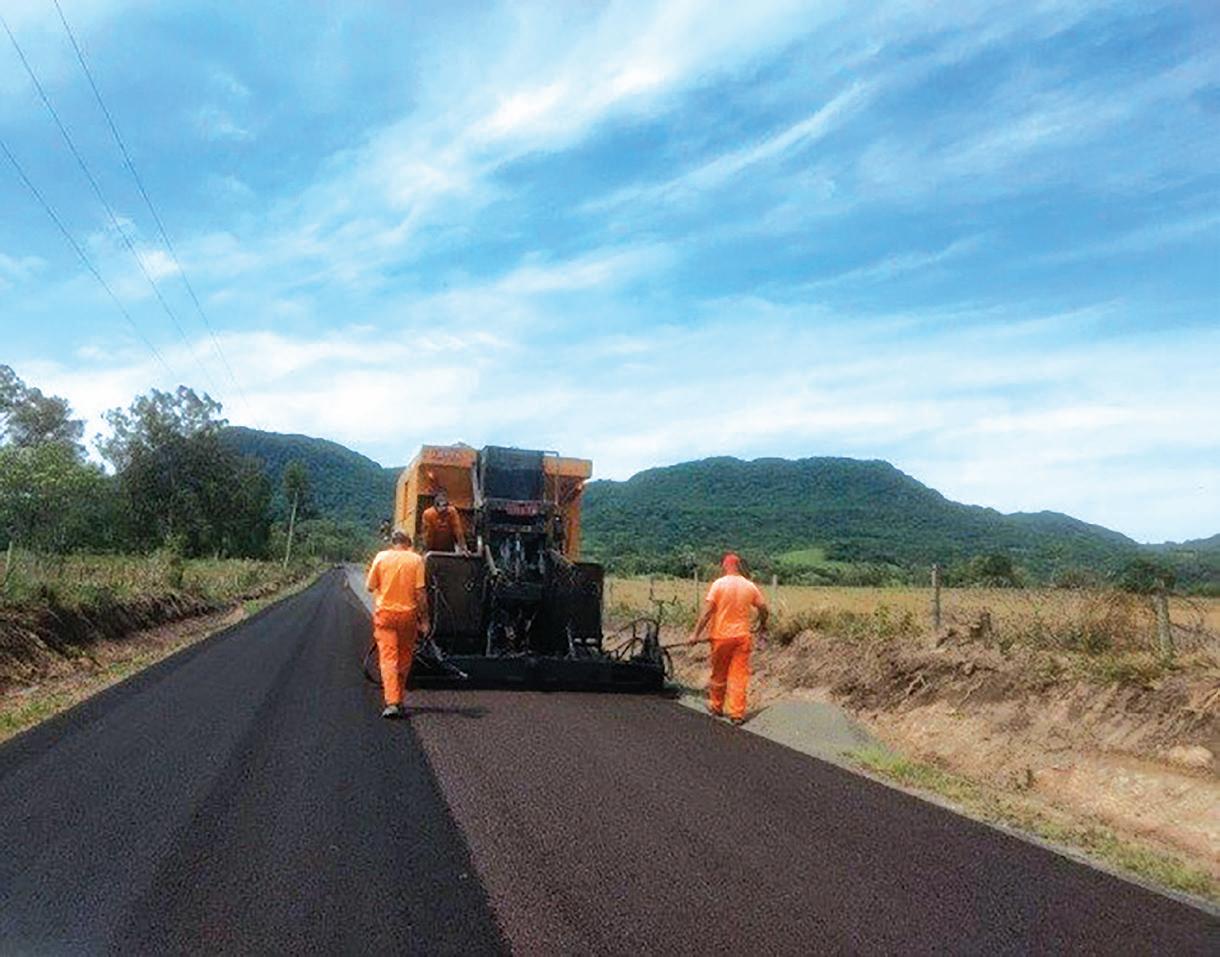
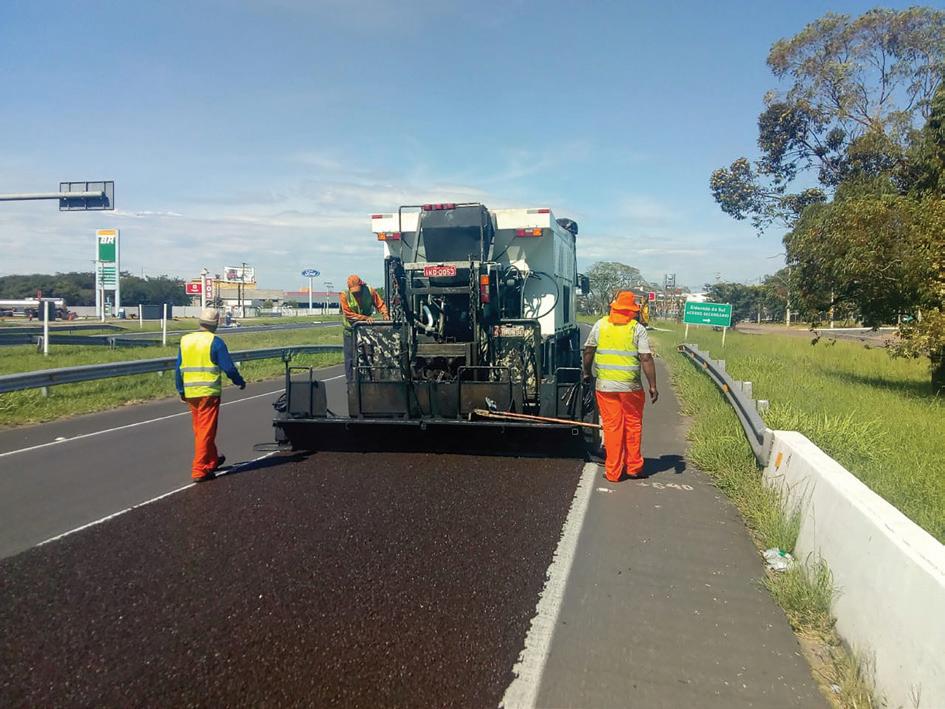
of the country. Nowadays, BSS are normally applied on rural roads, which are controlled by the government, up to highways and motorways. Microsurfacing is also used on high-traffic highways.
In Brazil, microsurfacing is used mainly when no major structural damages are visible on the pavement, while minor defects are detected such as ravelling and scuffing. In this case, microsurfacing is applied to enhance the texture, hence to improve the road safety and correct surface defects. On major highways, microsurfacing is used on a homogeneous-sections basis to refurbish the pavement surface and increase overall road safety. In general, according to the Brazilian experience, microsurfacings are considered cost‐effective and advantageous in terms of road-works duration and traffic disruptions.
Figure 4 and Figure 5 show two examples of microsurfacing application. The first is on a low-volume road, the VRS‐804 in southern Brazil, carrying 975 vehicles daily, of which 12% are trucks and buses. The second is on a high-traffic highway connecting the industrial park to the capital city of Rio Grande do Sul, the BR‐290, and carrying 14,000 vehicles per day, of which 19% are trucks and buses.
In Italy, microsurfacing has gained more and more attention in recent years, especially due to the lack of funds for traditional road maintenance and for restoring a pavement’s evenness and skid resistance. In some cases, it is seen as an aesthetic solution. Yet the number of companies that have experience of this technology remains limited. Also, the predominant use of magmatic rocks, along with the lack of consistent specifications, makes it difficult to be accepted on a regular basis.
But some attempts have been made to improve the understanding of microsurfacing and make this technology more widely used, not simply as a maintenance solution. Researchers at the University of Bologna have suggested the incorporation of recycled crumb rubber and the use of gap-graded curves for the aggregate in order to provide a pavement with skid resistance and acoustic
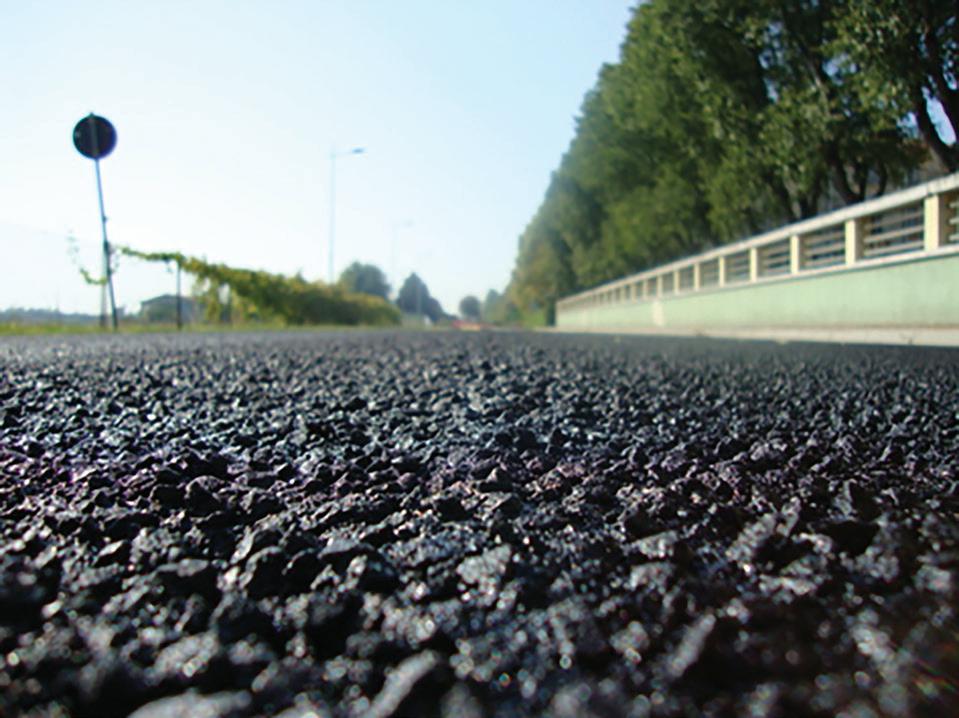
features (Figure 6).
In Canada, microsurfacing is used mostly on low- to medium-traffic roads, but has been used on some heavily used highways with good results. For example, in the eastern province of Quebec, between 2007 and 2009, several sections on heavy-traffic highwaysHighway 10, 30 and 70 - were microsurfaced with success. The use of BSS is not limited to highways; it was also used on runways and aprons at an airport in the neighbouring province of Ontario in 2007. Microsurfacings have been used since the early 1990s and they last normally between four to eight years. The use of BBS in Canada is an accepted pavement maintenance technique that extends pavement service life at lower cost than conventional rehabilitation techniques such as milling and paving.
After a critical analysis of terminology and use of BSS in 10 countries, this paper proposes a more comprehensive and harmonised definition and description of this family of products.
BSS can be defined as paving mixtures produced using bitumen emulsion and characterised by a “slurry” state. After laying, they evolve into a solid state during a curing process that takes generally from half an hour to twelve hours. Among BSS, microsurfacing and slurry seal can be distinguished. Microsurfacing has higher performance than slurry seal and allows quicker traffic opening, heavier traffic volume and thicker application layers.
BSS are composed of bitumen emulsion, well‐graded aggregate blend (including filler), water and additives (Portland cement, hydrated lime, fly ash or other). Specific additives and fibres also may be included. Microsurfacing is distinguished from slurry seal by the use of polymer‐modified emulsion and higher quality aggregate. Additionally, the nominal maximum size for microsurfacing is often larger than that for slurry seal. BSS are proportioned, mixed and uniformly laid in‐place as a homogeneous mat over a properly prepared surface at
ambient temperature. They may consist of one or more layers - usually in a thickness of the largest aggregate size in the gradation - that must adhere firmly to the underlying pavement.
BSS are used generally to prevent surface water from penetrating the underlying pavement, to restore or improve skid resistance, to plug superficial voids and microcracking, to provide a distinctive colour to the road surface. Slurry seal is also employed to provide temporary cover at low cost and smooth surfaces for pedestrian areas, parking lots, school yards and bicycle tracks. Microsurfacing is also employed to provide shape correction, to reprofile rutted wheel paths and to obtain a faster traffic opening. n
The authors are Andrea Grilli (Università della Repubblica di San Marino, San Marino), Andrea Graziani (Università Politecnica delle Marche, Ancona, Italy), Alan Carter (École de Technologie Supérieure, Monteral, Canada), Cesare Sangiorgi and Sergio Copetti Callai (Università di Bologna, Italy) and Luciano Pivoto Specht (Universidade Federal de Santa Maria, Brazil
The article is an edited version of an article that was originally published online 19 November, 2019 as a RILEM Technical Letter. It was published with open access and licensed under a Creative Commons Attribution 4.0 International Licence. Full references are given in the original article. - A. Grilli et al.“Slurry surfacing: a review of definitions, descriptions and current practices”, RILEM Technical Letters, 2019, vol. 4, 103-109. DOI: https://doi.org/10.21809/ rilemtechlett.2019.91
For correspondence about this paper, please contact Andrea Graziani at a.graziani@univpm.it Tel: +39 071 2204507