





















Citilog Automated Incident Detection leverages
Artificial Intelligence and the latest developments in Deep Learning to automatically identify incidents in real time on your roadways with ten times less false postivies:
•Wrong way driving
•Stopped vehicles
•Smoke in tunnels
•Pedestrians
•Debris
•Slow vehicles
•Congestion
Our intelligent solutions optimize operations and reduce response times for traffic operators, providing a safer road for the travellers they serve.









NEWS DIGEST
CONTRACTS & DEALS
NEWS ANALYSIS
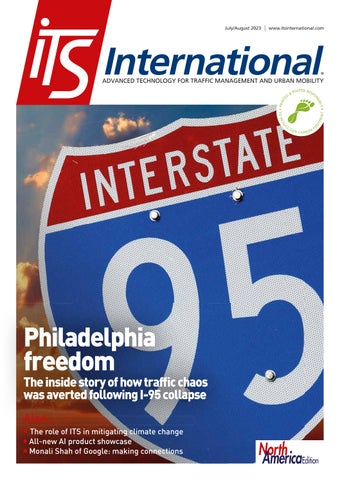
Travel chaos around the collapsed I-95 in Pennsylvania was widely predictedyet that chaos never occurred. Why?
14 INTERVIEW
“The way we move and the air we breathe is all connected,” says Monali Shah of Google
16 ASECAP SUSTAINABILITY FORUM
“I think it is fair to say sustainable road transport will mean something different in the future than it means today”: key talking points from the Vienna meeting
20 ARTIFICIAL INTELLIGENCE
Legacy traffic management infrastructure doesn’t have to be a marker of the past: software upgrades can bring it into the present in a cost-effective and timely way, says GridMatrix
24 AI PRODUCT SHOWCASE
AGD Systems, Valerann, Miovision, Teledyne Flir, Tattile and GridMatrix
cial intelligence
Jon Tarleton of Baron Weather explains how the ITS industry can help the transportation network to remain cient as the climate changes

July/August 2023
32 SOFTWARE MODELLING & SIMULATION
What’s Next? Aimsun is switching strategy from being a pure software firm to one that is focused on outcomes, says CEO Alexandre Torday
36 CYBERSECURITY
Connected vehicle safety isn’t just under threat from malicious actors exploiting code – it’s also about avoiding software faults that could harm people, says Patrick Shelly of Qt Group
38
Tools to identify and reduce unnecessary delays are here – and traffic signal performance improvement is also eligible for funding, points out Rick Schuman of Inrix
42
In a world of online platforms, rolling TV news and social media channels, does the old-fashioned book still have something to offer? Yes, it turns out...
44
New concepts around distance-based payment are brought forward every other week. But are they equitable and fair, asks Jorgen Petersen of Systra
48 PRODUCTS & INNOVATIONS
North America area only











NA 03 Transportation is rapidly moving toward vehicles equipped with automated driving system technologies. The Federal Highway Administration has put together a collaborative framework to help secure the roll-out of ADS in the US. John Harding explains the thinking…


















H“HOW’S THE WEATHER WITH YOU TODAY?”
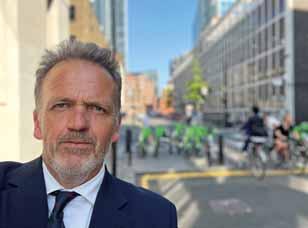


ow’s the weather with you today? Pleasant enough for most of us, hopefully. But it won’t have escaped your notice that, across the globe from Beijing to California, taking in Greece and North Africa and many other places besides, extreme heat and catastrophic flooding have brought misery – and worse –to tens of thousands of people.
Countries, regions and cities all over the world are seeing unprecedented extreme weather events causing destruction in different ways. This has a major impact on the way that people and goods get around, safely and efficiently. Jon Tarleton of Baron Weather explains how the ITS industry can help the transportation network to remain efficient as the climate changes (p28). It’s something it seems we need to get used to.
Meanwhile, back on the roads, the collapse in June of part of I-95 near Pennsylvania could have caused lengthy traffic chaos. After all, it’s the main interstate highway running down the eastern seaboard of the US. But - relatively speaking at least - it didn’t and gridlock was avoided.
Editor Adam Hill
Email: ahill@ropl.com
Tel: +44 1322 612062
Editorial Director
Geoff Hadwick
Email: ghadwick@ropl.com
Tel: +44 1322 612013
Sales Director
Dan Emmerson
Email: demmerson@ropl.com
Tel: +44 1322 612068
Sales Team
Graeme McQueen
Email: gmcqueen@ropl.com
Tel: +44 1322 612069
Production Manager
Nick Bond
Email: nbond@ropl.com
Tel: +44 1322 612066
Design Team
Simon Ward, Andy Taylder
Circulation & Database Manager
Charmaine Douglas
Office Manager
Kelly Thompson
Email: kthompson@ropl.com
Internet, IT & Data
Services Director
James Howard
Email: jhoward@ropl.com
Tel: +44 1322 612070
“
“ ITS can help transport to remain efficient as the climate changes
Why? Well, cooperation, good emergency planning and, of course, ITS provide a large part of the answer.
Along with the swift response of local and federal politicians, and the impressive work of the construction industry, several other factors prevented an epic snarl-up: excellent messaging, careful traffic management and quick provision of extra public transport services. Pennsylvania DoT and Southeastern Pennsylvania Transport Authority deserve great credit: see the inside story of how they did it on p10.
Finally, we can all do with fresh ideas from time to time: they liven up our thinking, challenge our preconceptions and help us move our work forward. One of the ways we can do this is through books – so who better to ask what they’re reading than transportation leaders?
Where do they get their inspiration? What would they recommend?
The answers are intriguing: as you might expect, there is writing which directly addresses the ITS sector and transport issues. But there is also military history, family sagas, quite a lot about technology and data – and even something on James Bond’s cars. You can find out who’s got what by their bedside on p42.
And as ever, happy reading! ITS
Adam Hill EDITOR
@ITSeditorAdam

@adamhillwriter
@itseditor_adamhill
@ITSInt

Web Manager
Sarah Biswell
Email: sbiswell@ropl.com
Tel: +44 1322 612078
Social Media Manager
Tatyana Mechkarova
Email: tmechkarova@ropl.com
Publisher/
Managing Director
Andrew Barriball
Email: abarriball@ropl.com
Tel: +44 1322 612057
CEO Roger Adshead
Email: radshead@ropl.com
Printed by Warners (Midlands) PLC
ITS International, USPS 13324, is published bimonthly by Route One Publishing Ltd, Second Floor, West Hill House, West Hill, Dartford, Kent, DA1 2EU, UK. No part of the publication may be reproduced in any form whatsoever without the express permission of the publishers. Views expressed in this journal do not necessarily reflect the opinion of the Editor or Route One Publishing Ltd.
All editorial, advertising or circulation enquiries to:
ITS International, Second Floor, West Hill House, West Hill, Dartford, Kent, DA1 2EU, UK.
Reader Enquiry Service: data@ropl.com
Tel: +44 1322 612061
Subscription Enquiries: subs@ropl.com
Global: Print ISSN 1463-6344
Digital ISSN 2057-3421
NA: Print ISSN 2399-7087
Digital ISSN 2399-7095
The US annual subscription price is US$173.00. Airfreight and mailing in the USA by agent named World Container Inc, 150-15, 183rd Street, Jamaica, NY 11413, USA.
Periodicals postage paid at Brooklyn, NY 11256.
US Postmaster: Send address changes to ITS International, Air Business Ltd, c/o World Container INC 150-15, 183rd St, Jamaica, NY 11413, USA.
Subscription records are maintained at Route One Publishing Ltd, Second Floor, West Hill House, West Hill, Dartford, Kent, DA1 2EU, UK.
Air Business Ltd is acting as our mailing agent.
Los Angeles County
Metropolitan Transportation Authority has launched fare capping using Cubic Transportation Systems’ technology. Riders can now use their Tap card to pay per ride until they hit a daily fare cap of $5 or a seven-day fare cap of $18 - it is free to use for the remainder of those respective periods when the limits are reached. Customers can preload Tap or the mobile app and pay as they go acrosss bus, rail and Metro Micro, rather than buying passes up front.
NLEX Corporation has installed 12 additional cameras on the toll roads it manages and operates in the Philippines. This means there are now 163 CCTV cameras operating on the two expressways that link Metro Manila to North and Central Luzon: NLEX and SCTEX. These cover 190km and are used by more than 200,000 motorists




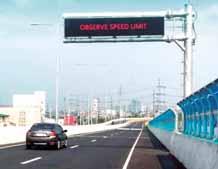
section, bringing the total number of VMS in the whole NLEX expressway network to 31.

up three more variable message signs at the newly-opened NLEX Connector Caloocan to España
Roads in cities in the south of the US tend to have the highest speeds - and are therefore the most dangerous for vulnerable road users - according to new research from StreetLight Data. It places Dallas, Charlotte, San Antonio, El Paso, Austin, Houston and Memphis in the bottom half of the Safe Speed Index: Ranking America’s Cities for Pedestrian Safety.
The data was released just after the Governors Highway Safety Association revealed that drivers killed at least 7,508 people walking in the US in 2022.
In the US, the National Association of City
Safety Administration to change how vehicles are rated for safety. "Oversized vehicles are making streets deadlier for pedestrians and bike riders," Nacto says. "Proposed federal regulations still let automakers off the hook." NHTSA is proposing the inclusion of a
"pedestrian crash worthiness test" - but Nacto suggests the test would not be included in
"so the vehicles that are most dangerous for pedestrians can still get 5-star ratings".
A one-day Global Mobility Forum will kick off the ITS Australia Global Summit in Melbourne on 28 August 2023. Sessions will include Data Analytics / Ecosystems; AI's Impact on Smart Infrastructure; and Connected Transport - C-ITS
be a Global Updates session, featuring Dr Jason Chang, director, Advanced Public Transport Research Center, National Taiwan University; Ertico CEO Joost Vantomme; Jean Ruestman, administrator, Transportation - Michigan DoT; and Michelle Batsas, executive director future mobility at Victorian Department of Transport and Planning.


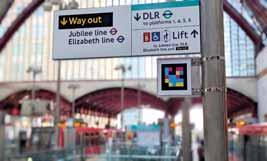
NaviLens tech trialled to help blind and partially-sighted people on DLR
An app designed to help blind or partially-sighted customers navigate public transport is being tested at light rail stations in London. As well as Transport for London, the initiative involves KeolisAmey Docklands, GoMedia and The Royal National Institute of Blind People. Technology is based on image recognition using augmented smart codes at stations and the NaviLens smartphone app that provides voice guidance for visually impaired passengers. Once the smart codes have been scanned, the app’s voice assistant helps users continue their journey.
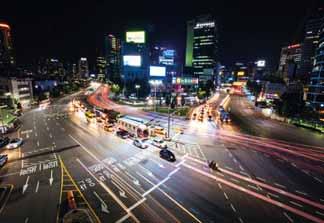
Seoul Metropolitan Government (SMG) has earmarked part of the South Korean capital as a testbed for its new smart intersection project, which will
Lidar and other technologies


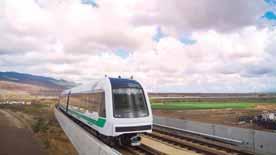
In Hawaii, Honolulu Authority for Rapid Transportation (Hart) has delivered the initial - 11mile - stretch of the Honolulu
of Transportation Services. It takes in nine stations between Kualaka`i in East Kapolei and Halawa near Aloha Stadium. Passenger services to additional stations further east are scheduled to be phased in
signal system. SMG chose Hwarang-ro, passing through the Taereung Royal Tomb in Nowongu, for the project as it has seen
volume and been experiencing
project will be up and running by the end of 2023.


AI
Drover AI are working together in Finland's capital, Helsinki.



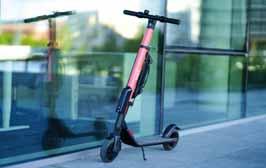
Drover's PathPilot application is installed on e-scooters in with a beep if it is ridden on the pavement or parked incorrectly. PathPilot uses AI and machine vision to see exactly where the scooter is moving, locating them more accurately than
applicability of the technology to and see how user behaviour changes with PathPilot, while collecting accurate data on scooter locations.

organisation's executive director. “This updated programme was designed to meet the needs of the marketplace, especially the needs of state departments of transportation and other infrastructure
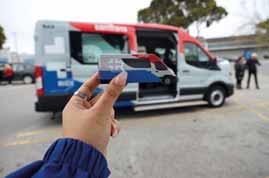
Transdev North America launched a new, kerb-to-kerb microtransit service with San
Plus is a 'turnkey' ride-share solution from Transdev, with the company providing management of the vehicles, staff, safety maintenance and the customer service call centre operations, along with the SamTrans Ride Plus app technology. It is available on demand through the app, by phone or online in East Palo Alto, with trips "as affordable as a standard bus ride" using seven vans carrying multiple passengers.







Lidar specialist Innoviz Technologies is to deploy its Bridge Collision Detection solution on highways, tunnels and bridges across Israel. The company has an agreement with toll operator Drive Group to roll out the technology, and says that around 15,000 bridge and tunnel collisions occur each year in the US, with an average cost for repair of $18,000 per incident. Its solution uses data gathered from Innoviz Lidar sensors from both sides of a highway, several kilometres ahead of the entrance to a bridge or tunnel.
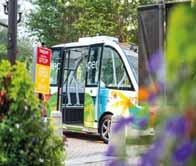
Beep autonomous shuttle launches in Atlanta
Autonomous passenger vehicle specialist Beep has launched a pilot service in Atlanta, US. The new electric, AV shuttle –the Cumberland Hopper – will operate along two routes in the city’s Cumberland Community Improvement District between The Battery, Truist Stadium and Cobb Galleria. The pilot runs until March 2024 and is part of a mobility strategy called Cumberland Sweep, which aims to improve connectivity for baseball fans, visitors, residents and businesses by introducing a three-mile corridor of dedicated pedestrian and bike lanes over the next few years.
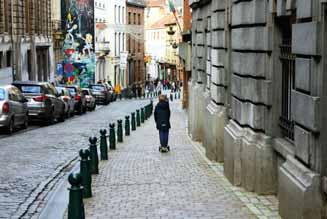
Vianova bolsters micromobility management in Brussels

make shared mobility in the
A new agreement extends the platform use to more modessuch as e-scooters, cars, bikes and ride-hailing services - as streets in the city are repurposed and new operators proliferate. Vianova says its platform was instrumental in creating 120 new geofenced slow-speed zones, no-go rules and incen-


array of columns and mounting positions, making it suitable for urban, rural and highway implementations".
Moovit aids MaaS in Montgomery County
5,000 vehicles to over 20,000.
Jenoptik signs up for Manchester camera upgrades
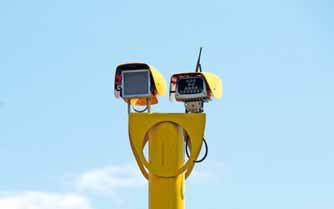
Jenoptik has signed a contract with Transport for Greater Manchester in the UK to upgrade 90 spot speed cameras with the
sensors or painted secondary check marks. It is used to capture spot speed or red light and speed-on-green offences - the manufacturer says its lightweight design means it can be installed on "a wide


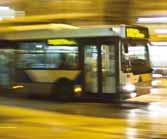
Moovit has created a white label app for the Ride On bus service in Montgomery County Department of Transportation in Maryland, US. The Ride On Trip Planner allows for trip planning across multiple modes including buses, Metrorail and Metrobuses, scooters and bike-share, along with live reports on wait times and ridership levels using a crowdsourcing information feature. It provides help for passengers directions to a selected bus when they have arrived. A webbased version of the app also is available.


driving test programme in the US. Ten electric ID. Buzz vehicles are on the streets of Austin, Texas – the start of a three-year
while it plans to "progressively expand testing operations to at least four more American cities". The vehicles - which will ini-
Vianova has bolstered its relationship with transport agency Brussels Mobility in a bid to
year maintenance agreement. The ANPR-based system allows
mous driving tech platform, which includes cameras, radar, and Lidar, developed by the global Volkswagen Group and Mobileye.




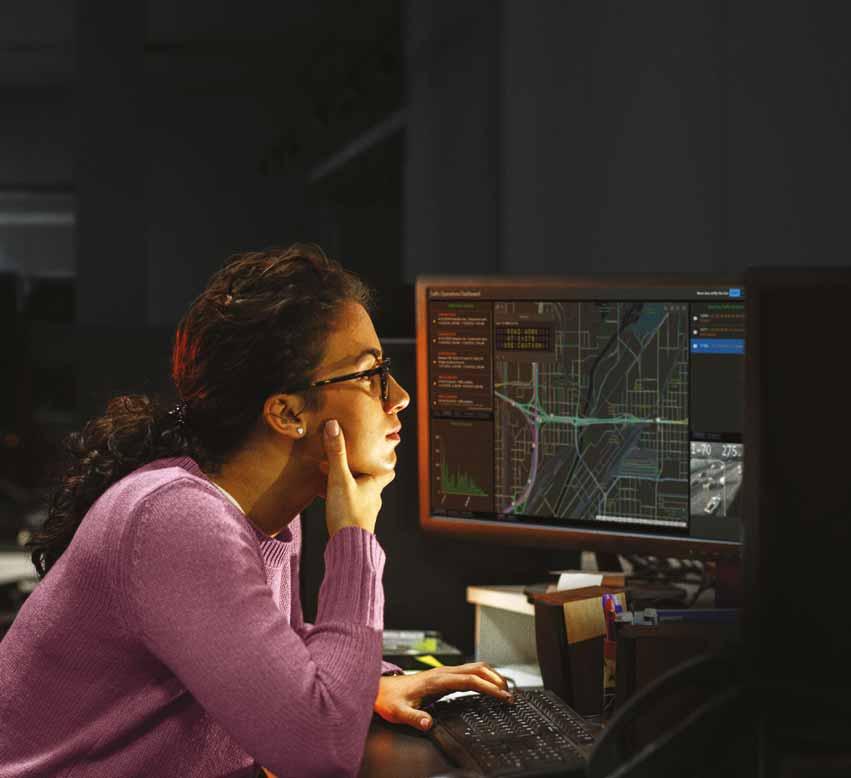
Getting the optimal performance from the network is your top priority for traffic operations. With Esri’s location intelligence solutions, bring together real-time information from disparate sources to help you keep your system operating at peak performance.
Learn how you can take operational control and tackle your mobility challenges by using Esri® technology. go.esri.com/peak-performance-with-esri

June’s collapse of major US roadway I-95 in Pennsylvania could have caused lengthy traffic chaos. But - relatively speaking at least - it didn’t and gridlock was avoided. Alan Dron finds out why




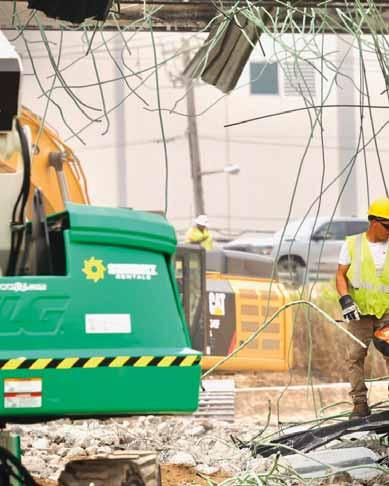
Interstate highways are the arteries of the US transport system. So, when one is suddenly put out of action, the effect is similar to an embolism: a major problem and possible lasting harm.
So why wasn’t that the case after a fuel tanker carrying 8,500 gallons of petrol crashed on an off-ramp in north-east Philadelphia under I-95, the main interstate highway running down the eastern seaboard of the US?
The incident on Sunday 11 June caused a blaze so intense that it weakened the steel supports of the elevated northbound section of the interstate above it, causing







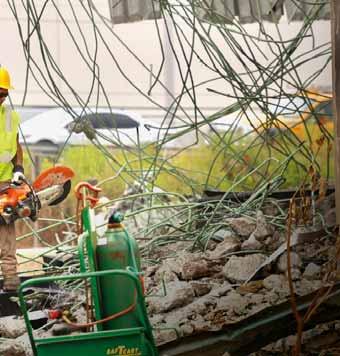
it to collapse. The adjacent southern carriageway had also to be demolished after it was determined that its structure had been compromised.
In the immediate aftermath of the accident, Governor Josh Shapiro of Pennsylvania predicted that restoring the eight-lane highway would take “some number of months”. Yet it was up and running again – albeit with six temporary lanes – in 12 days.
Travel chaos was widely predicted, as the section typically carries around 160,000 vehicles a day. Yet that chaos never occurred. Why?


Firstly, people were made aware of the problem swiftly: “This made national news – a section of one of the major corridors in the US,” said transportation analyst Bob Pishue at traffic data specialist Inrix.
The resulting publicity meant that, come the Monday morning after the crash, most people who may normally have used that stretch of I-95 were aware of the problem and avoided it, easing congestion.
Pennsylvania DoT (PennDoT) implemented primary detour routes and signage immediately and, together with local, state, and federal partners, instantly put out public messaging on the detours.
PennDoT has produced software that relies on crowdsourced incident data from
Waze and Inrix, two transportation mobile applications that provide traffic speed and incident data.
The technology pulls together the speeds and incidents from a subset of vehicles on a given segment of roadway to provide real-time information, enabling PennDoT to create travel-time messaging and increase roadway situational awareness.
This allows PennDoT to quickly and more accurately display this information on the public-facing 511PA traveller information website and it published an I-95 incident page on the site, displaying average, realtime travel times for the incident detours.
Other factors that reduced normal traffic flows were telecommuting, which has become more common post-pandemic, so at least some commuters were able to revert to that mode of working. Commuters also started to consolidate their journeys, rather than making a series of unlinked trips. Additionally, the advent of online shopping cut down ”a bunch of trips” that some people would otherwise have made, Pishue said.
“I think people were making all these individual decisions,” he added. “There was some congestion and increased travel times in the region, but it wasn’t dragging on.”
A major factor behind the relative lack of congestion was the creation of several diversions, notably along US Route 1 (US1) and US13, which both run approximately parallel to I-95. Although these two routes are relatively distant – US1 is around 30
miles to the west, while US13 lies approximately 40 miles east – they allowed long-haul north-south traffic to continue flowing while avoiding the affected city centre route.
Average road speeds dropped – in some cases considerably, from 30mph to 20mph – but traffic largely kept flowing. “Traffic did build up and travel times did increase by various amounts, depending on what road you were on or what detour,” said a PennDoT spokesperson. “But it wasn’t gridlock for the entire region. People made changes to their travel plans.”
Within a day of the collapse, Southeastern Pennsylvania Transport Authority (Septa), the transit provider for Philadelphia and the four surrounding counties, had put in place changes to its rail services, notably the Trenton, West Trenton, Warminster and Fox Chase Regional Rail Lines, by adding carriages to scheduled peak service trains.
Additional morning and afternoon rush-hour services were also loaded into the timetable. Septa reported that ridership increased by about 14% on the three lines serving the affected area. It negotiated increased staffing hours with unions to help cope with the influx of additional passengers. And to encourage commuters to let the train take the strain, Philadelphia Parking Authority made parking free at Regional Rail stations.
Septa CEO Leslie Richards noted that pre-incident ridership was still below
PennDoT spokesperson
pre-Covid levels, which gave the system some slack to cope with drivers switching from their cars. Additionally, Septa pushed the option of the city’s existing Share-ARide computerised service that matches commuters who work in south-eastern Pennsylvania with transit services, potential carpool and vanpool groups.
Other practices that PennDoT has introduced in recent years to support and improve traffic control at incidents more generally include expansion of the incident response traffic control role of transportation department freeway services patrols; implementation of active traffic management techniques, such as remote signal-timing adjustments, and alternate route planning; pre-signing or pre-staging traffic control devices; use of mobile command centres; focused planning, coordination, and cooperative efforts among responding agencies; and ongoing training for all responders.
“Traffic management has gotten easier with new technology,” noted Pishue. “PennDoT and everyone got all the information out using all their channels.” These allowed drivers and freight hauliers “to get up-to-date information and adjust on the fly; that wasn’t possible 10 to 20 years ago”.
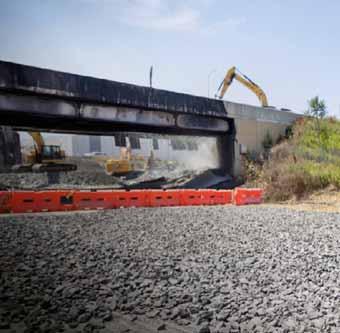
15 June saw the conclusion of the demolition stage of the I-95 renewal, several days faster than originally planned. Construction of the replacement roadway began the following day, with a base of

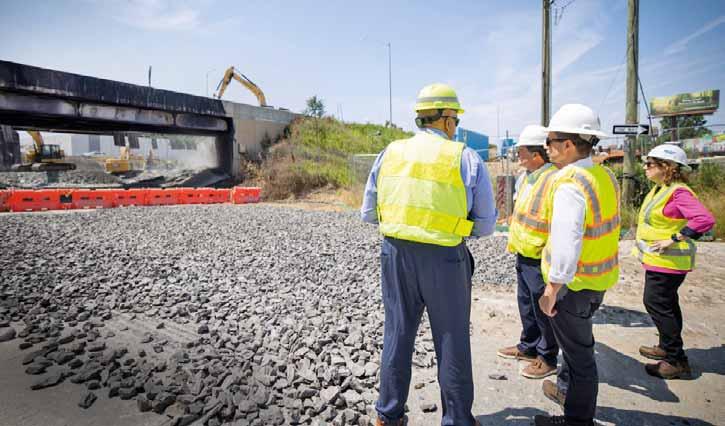
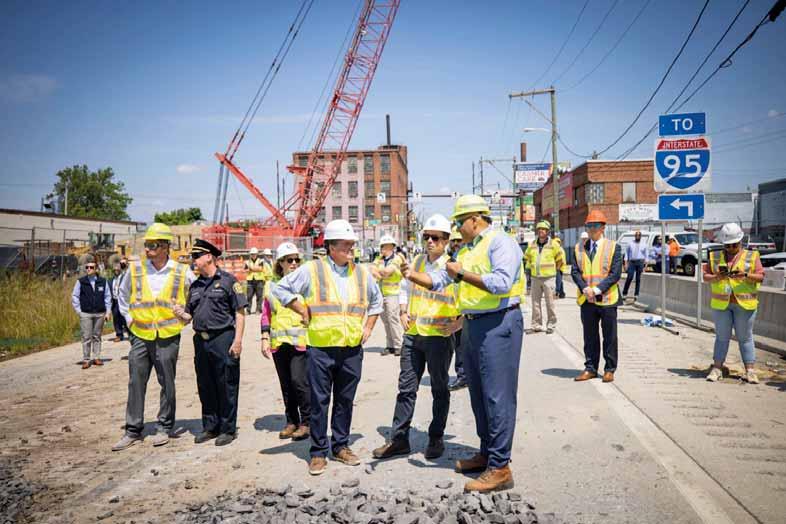
foamed glass aggregate being laid on the roadway to serve as the foundation as construction crews began to fill in the gap up to the surface level of I-95.
As construction progressed, a live feed of the work became one of the most popular streaming services in the city and surrounding area.
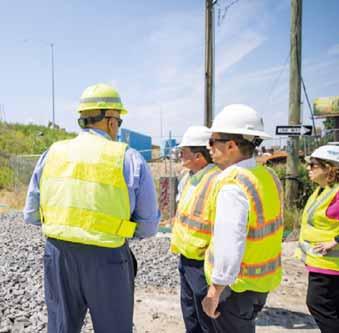
One reason behind the swift restoration of the road link was that it was recognised immediately that it was an “all hands on deck” event that brought together the state DoT, employers, transit authorities and agencies, such as the Metropolitan Planning Organization.
Mike Carroll, Pennsylvania’s secretary of transportation, said that, by chance, a specialist roads contractor was already working nearby on another project on the interstate and the equipment it had to hand was exactly the type of kit required for the reconstruction process.
The contractor making the repair was chosen on a no-bid contract basis, rather than having to go through the normal lengthy bidding and evaluation process.
One other factor that helped have the affected section of road repaired swiftly was that it had been built only around a decade ago. This meant that many of the plans were available in digital form and could be swiftly called up, consulted and used as the basis for rebuilding the missing structure.
“The ability to roll in a structure within two to three weeks is something we can do now,” noted Pishue, with prefabricating
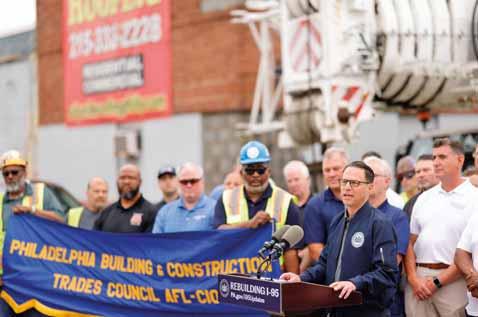
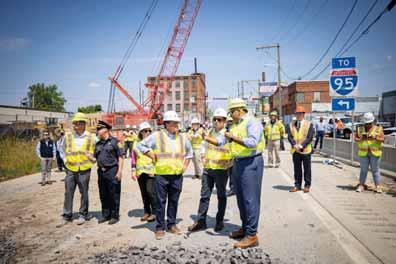
Governor Josh Shapiro of Pennsylvania had predicted that restoring the eight-lane highway would take ‘some number of months’
structures off-site becoming the norm. “It’s happened a few times now. It’s becoming incorporated into the playbook.”
According to PennDoT: “I-95 has been a masterclass in emergency management, public messaging, and the miracles of 2,000 tons of recycled foamed glass aggregate. One lesson learned is to have greater trust in new technologies that can be more durable, less expensive and quicker to assemble. Lightweight aggregate materials are just one example of how you can implement new technology and at the same time be green and sustainable.”
Another lesson, said Pishue, is a new focus on the relative lack of redundancy in the Interstate network. “When a piece of it goes down, it affects the whole area,” he said. “You don’t want to build highways just for redundancy, but I think it shows a little bit of fragility in the system.” Although
this collapse did not result from a lack of maintenance, it may lead to a greater focus on highways upkeep, to minimise such problems in future, he suggested.
Also significant was the declaration of a state of emergency around the incident. That freed up federal funds that cut out the normal budgetary bureaucracy required for a major project such as this.
“Governor Shapiro’s state emergency declaration for Philadelphia cleared the way for decisions and construction that can take months, if not years, for conventionallyplanned projects,” noted PennDoT. “The need for speed, getting money, materials, equipment, and people to work around the clock, doesn’t factor into the vast majority of American highway construction projects.”
“I think one thing we learned is that we can build fast when needed,” Pishue concluded. ITS

















Be yourself: Monali Shah of Google tells Adam Hill how showing her personality in business has enabled her to make deeper connections on a ‘non-traditional’ journey into transportation



Monali Shah, head of industry solutions for Google, can pinpoint the time she became aware of how transport and equity and climate issues were linked. As a youngster she would journey from her home in the US city of Chicago to visit family in the suburbs of Mumbai, India, where she experienced “really intense pollution”, feeling soot on her face and developing a cough which took weeks after she returned home to clear.




“And that was my first experience with environmental justice and the connection between the way we move, the air that we breathe, and how that’s all connected together,” she recalls. “And it made me realise that I can come back and detox myself, but my family lived there - that’s their environment that they were in all the time.”
Reducing pollution

She started off her career as an environmental engineer. “I really wanted to focus on eliminating or reducing pollution at its source. And so I started off working in manufacturing: let me go to where it’s created and prevent it from happening.”

This is, she admits, a “very non-traditional journey” into transportation.
“But over the years, I’ve seen that these issues are all very related. When you talk about traffic congestion, safety, emissions - all of these things are connected together. They’re such a fundamental part of what we need to move in the world and yet, it’s creating all these issues.”
Reducing emissions from transport will be important when it comes to improving air quality and mitigating climate change. “I’m excited to see now that there’s really this effort to decarbonise the transportation sector, and take that seriously





and move towards electrification and think about how we design our infrastructure in a way that is different than what we’ve done in the past,” Shah says.

Providing connectivity to communities which have not previously had access to good transport links and clean air is also key. “Even though I think in the past we’ve thought of housing, transportation, environmental issues as separate things, they’re really not,” she says. Collaboration between various governmental bodies, such as US departments of energy and transportation via the Joint Office “gives me a lot more hope towards our ability to address these issues”.
Zip-code lottery
Shah has spoken before of a “zip-code lottery” for transportation and other services.
“It’s not random,” she says. “The impacts we see today are really based on things that happened decades ago in terms of

redlining, in terms of how the infrastructure was built. These communities were left behind. And so we see the impacts of that today, and now we have the opportunity to try to reverse some of those. In the US, we’re one of the wealthiest countries in the world. We should be able to solve these things. This should not be the state that we are in still, today, after all these years. And so, I think, looking at that history and understanding that history is really important for us, so that people know this is not just a product of something recently; it happened because of decades of lack of investment, and intentional practices that left certain communities out.”
Although equity is a hot topic in parts of the transportation ‘bubble’ at present, there is some way to go in terms of getting it into the mainstream. In short, it’s one thing to talk about it, quite another to move the dial in the real world. She agrees: “I do feel like we still have work to do. I’m bringing in different voices that have not been a part of the conversations.”

these types of topics and issues.”
Yet they relatively quickly moved to front and centre. After her MBA, she began working for digital map specialist Navteq (since absorbed into Here Technologies). “At some point I was working on high-definition maps for automated vehicles,” she recalls. “And I got asked to work on a strategy project related to traffic and government. And as I got into that, I realised that these were a lot of the same issues that I’d cared about for many years, from the environmental and sustainability side, from the safety side.”
Shah saw that she could bring mapping and real-time traffic data to bear on these issues, helping the government agencies running US road networks to better understand what’s happening. “So it started from that aspect of using data to power new types of decisions or enhance decision-making. And over time, I ended up coming over to Google and looking at other types of tools and technologies - data analytics, machine learning - that we have access to.”

When
we create the space for people
to share more
of
themselves, we connect in a deeper way - and we also generate better

Community engagement, listening to the needs of those who have been impacted by these historical practices – and, above all, finding practical ways to help – are crucial. “There are community organisations who are doing really good work, and they’re grounded in the communities and the lived experiences, and knowing what those needs are,” says Shah. “And I do feel like we still need to bring more of those voices into the space. It’s starting to happen but I think we have some more work to do there.”
Shah, who is also chair of the board of directors of ITS America, went to the University of Michigan and had her curiosity sparked by a friend who was studying environmental engineering. “I have that analytical mind and so I figured learning these kinds of technical and problem-solving skills, no matter what I did, would be a good foundation. That’s what brought me into the engineering side. And then over the years, it’s evolved into many different things that I would have never anticipated,” she laughs.
One of many interesting aspects to Shah’s career is that she has not been afraid to bring her own personality to her success in business. “That’s definitely been a journey for myself too,” she says. “I think I spent probably a lot of years feeling like I needed to fit into a space and so automatically adjusting myself, you know, being a woman and a woman of colour.”
But rather than emulating whatever environment she was in, Shah shifted her mindset. A women of colour summit which included Michelle Obama was one of the catalysts for her change.
“One of the things they were sharing is that what if actually, the things that are different about us in the ideas that we bring forth are actually what’s needed to make progress? That really struck me: ‘Oh, it’s not just I’m holding something back in, I think maybe that’s what I should be doing. It’s actually the opposite: what if me sharing this is actually going to move things forward?’”
ideas of technical and no matter what I engineering side. And then over the different things that I would have never anticipated,” she laughs. Forexampleartificialintelligenceandanalytics: “Iwould and became more determined to share. “And so I started to just do more and more of that,” Shah explains. “And what I found is when we create the space for people to share more of themselves, we connect in a deeper way - and we also generate betterideasAndsoformeitjustfeelsmuchmorenaturalwhy
For example, artificial intelligence and analytics: “I would have never thought in my days of environmental engineering, early on, that this is the way I would have been approaching




In a way, that broader perspective gave her a sense of responsibility which meant “I have to actually bring more of myself”. She began to notice when she filtered her views and became more determined to share. “And so I started to just do more and more of that,” Shah explains. “And what I found is when we create the space for people to share more of themselves, we connect in a deeper way - and we also generate better ideas. And so for me it just feels much more natural - why wouldn’t I show up as more of myself? And I want other people to feel comfortable doing that as well.”




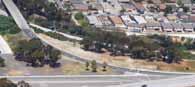




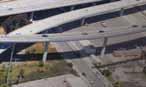
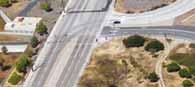
Some historical transportation choices have created divides – physical and economic - for communities

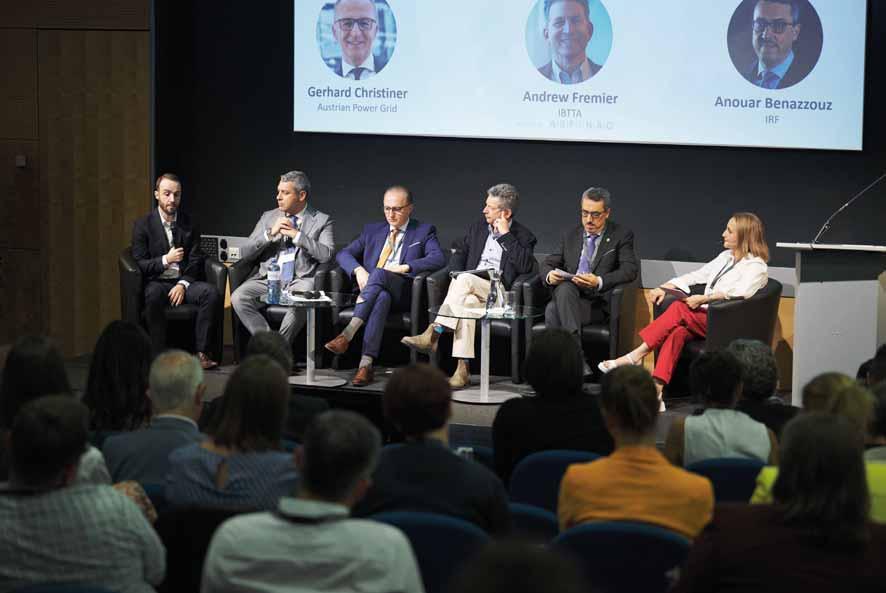
Knowing your company’s carbon footprint is one thing, but the real issue is understanding and reporting to investors Scope 3 emissions. David Arminas reports from the 2nd Asecap Sustainability Forum in Vienna
Asustainable roadway operation is complicated and is much more than just counting a carbon footprint.
It’s about ensuring the road network is resilient when environmental disasters strike, said Josef Fiala, president of Asecap, the European association of toll road operators.
In his opening presentation to Asecap’s 2nd Sustainability Forum he pointed out that, while doing all this, infrastructure must continue to be safer for road users, no matter what type of vehicle is being driven.
Fiala, who is also chief financial officer of Asfinag, Austria’s publicly-owned operator of motorways and toll roads, praised the commitment and efforts of European toll road operators to push ahead the sustainability agenda in every area - even when it might mean less revenue thanks to things like encouraging car sharing. In this way, he said, Asecap members are exemplars of social responsibility.
Similarly, Asecap members must build infrastructure to accommodate the increase in vehicles using alternate fuels such as electricity and – albeit less so at the moment – hydrogen.
But a sustainable operation can be achieved only if entire value chains are
involved. It is about the bigger picture, he emphasised, which was a dominant theme among many of the presenters.
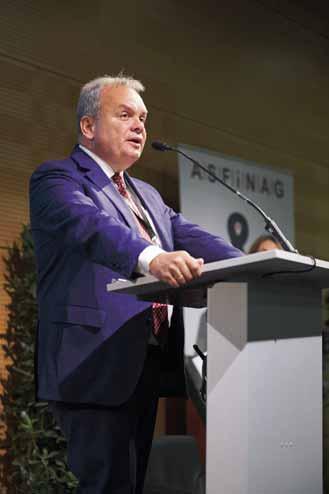
sustainable operation. “I am a bit hesitant to embrace this new, bright, shiny, green future,” said Thaler, who serves on the EU parliament’s committee on transport and tourism. Good regulations will be essential as operators reach for sustainability goals and the parliament is struggling at the moment to deliver on this.
She believes, meanwhile, that the internal combustion engine will stay, but the fuel will change. Thaler referred to the global dash for control of rare minerals that go into the production of batteries and fuel cells; the production and uptake of such energy sources will not be a smooth, linear path. This adds to the challenges faced by toll operators because they cannot predict the rates of their increased use in order to prepare infrastructure to better serve road
Also, given the impact of high energy prices on Europe as a whole, she commented: “I think it is fair to say sustainable road transport will mean something different in the future than it means today.”
Supply chain sustainability
Whatever path to sustainability is taken in whatever sector, a complete supply chain must be involved, said the keynote speaker of the day, Thomas Hoormann, managing
director of Polestar Austria – a division of Polestar, a high-end electric vehicle manufacturer owned by Swedish OEM Volvo Cars. Chinese vehicle manufacturer Geely has a majority stake in Volvo Cars and Polestar cars are manufactured at Geely’s plant in Chengdu, China, but sold globally.
Importantly, a sustainability path must have “absolute transparency” and involve the entire supply chain, a big issue for any manufacturer, said Hoormann. It will be tough for Polestar, too. In the company’s recently published Polestar 0 project, the manufacturer aims to make a “truly climate-neutral car by 2030”. Polestar wants to eliminate all greenhouse gas emissions –from cradle to factory gate to end-of-life of a vehicle. However, the challenge is immense, he said. One Polestar vehicle has 50,000 components and requires thousands of deliveries from hundreds of suppliers.

of the Trans-European Transport Network (TEN-T) continues to reduce traffic bottlenecks to ensure reliable connectivity from country to country. New TEN-T regulations will cater for the availability of alternative fuels along the entire network.
The alternative fuel infrastructure regulation recently agreed at EU level will set mandatory recharging and refuelling availability targets to reflect the increasing uptake of vehicles using such fuels. From 2025, there will be specific distances set between refuelling stations along the TEN-T network. The EU Commission has also agreed to set aside €1.5 billion in funding for motorway operators to help them reach these targets.
The life-cycle aspect of the Polestar 0 project is a good takeaway from Hoormann’s presentation, said Andrew Fremier, president of IBTTA – the International Bridge, Tunnel and Turnpike Association: “A company that is actually thinking about the entire picture, I find very exciting.” This includes sustainable disposal of depleted batteries.
However, Gerhard Christiner, chief technical officer of Austrian Power Grid, acknowledged that for sustainability strategies, the prospect of getting 100% renewable electricity, although essential, is still a long way off.
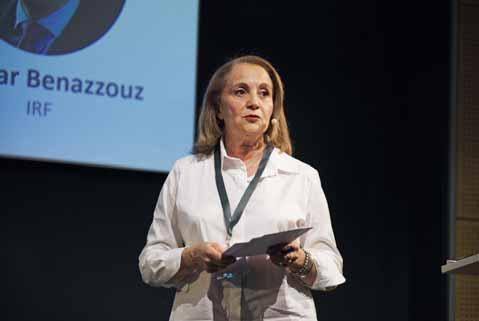
Anouar Benazzouz, president of IRF - the International Road Federation, a global, not-for-profit organisation based in Geneva, Switzerland - noted that whatever sustainable transport looks like, safety of vehicle drivers and the design of safe roads must remain paramount. “And we should not be American- or European-centric,” he insisted,


Benazzouz: whatever sustainable transport looks like, safety of vehicle drivers and the design of safe roads ‘must remain paramount’
but get everybody, everywhere around the table to talk about the issues and best examples to create concrete actions.
The European Green Deal, said Kristian Schmidt, director of land transport for the European Commission, has an intermediate objective by 2030 of a 55% reduction of GHG (greenhouse gas) levels compared to 1990s levels. He said the transport sector contributes around 5% of European GDP and employs around 10 million people. “It is the backbone of the [European] single market. At the same time it is responsible for around a quarter of total EU emissions and is one of the sectors where emissions are higher now than in the 1990s,” he said.

For the transport sector to decarbonise, Schmidt said fossil fuels must be phased out and the EU’s regulatory framework is there to help. The expansion and upgrade


Schmidt said that the cross-country Eurovignette tolling system for drivers will, from next year, be set to incentivise drivers of cleaner vehicles.
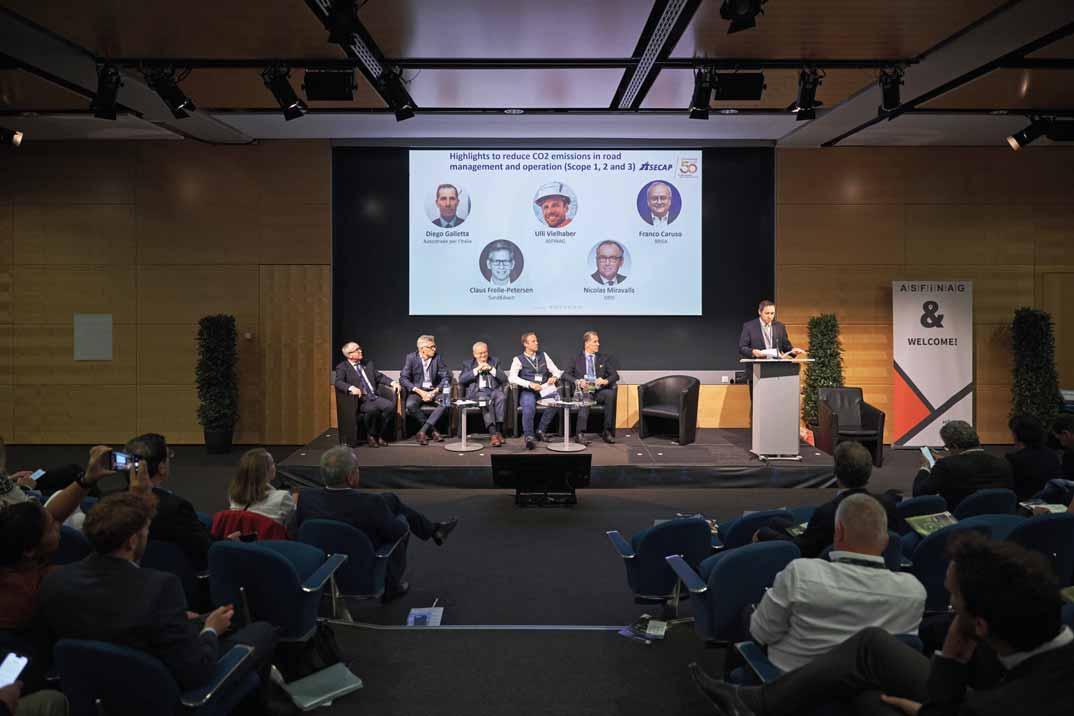
In a later panel discussion, Diego Galletta, data protection officer at concessionaire company Autostrada per l’Italia, agreed that a pollution-based toll-pricing system could change driver behaviour. He also noted that road operators should push themselves to produce detailed yearly sustainability reports, as his company has done. These reports can help bring in new investors to the company and specific projects.
Concessionaires should start as early as the procurement process to work with suppliers, said Galletta, in order to understand a product’s carbon footprint but also to discuss how to use less of a product where reductions can be achieved.

Ulli Vielhaber, sustainability manager with Asfinag, reminded the attendees of the importance of ESG reporting, the measurement and disclosure of a company’s environmental, social and governance data.
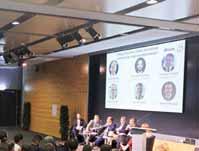



Measuring and reporting Scope 3 emissions is the big win for a concessionaire, if done properly, according to Sund & Bælt’s Claus Frelle-Petersen
ESG report is about managing that risk.
Franco Caruso, head of sustainability at Brisa, Portugal’s largest highway concessionaire, pointed out that aiming at sustainability targets is like shooting a moving target. The company’s operations include working towards a circular economy – to reduce waste, recycle and boost environmental protection. But, for example, while a company’s electricity consumption can go down, CO2 emissions can go up because of the source of the electricity. Similarly, said Caruso - for the moment at least - if traffic volumes go up, so will emission counts. No one can predict the exact uptake of less polluting emissions, which are not under the control of a concessionaire.
clear to a supplier what environmental data your company will need and – importantly –presented in what format so it is readable to the procuring company.
It might be, added Frelle-Petersen, that
as an independent entity in 2021 after incubation in Holcim's Innovation Center in Lyon, France. As noted by Frelle-Petersen, Miravalls said concessionaires must be willing to share and understand increasing complex data along the value chain. To do ciently, he said concessionaire companies should consider setting up digital twins of their operations which can include supplier-data input. In many sectors a digital twin is now imperative to maintaining up-to-data knowledge of their asset, no matter what that asset is. ITS
Measuring and reporting Scope 3 emissions remains the big win for a concessionaire, if done properly, according to Claus Frelle-Petersen, sustainability director for Denmark’s Sund & Bælt, an infrastructure operator with experience of building and maintaining some of the world’s largest bridge and tunnel links (see box). Measuring Scope 3 emissions will have to start, as several other speakers also said, at the procurement stage when engaging suppliers. At that point it must be made

• Scope 1 emissions Greenhouse gas emissions (GHG) that a company creates directly from its daily operations, for example emissions from operating a building’s boilers and fleets of vehicles.
• Scope 2 emissions
Indirect emissions from products or services that a company buys in, such as electricity it needs for heating and ventilation of the company’s buildings.
• Scope 3 emissions This is the basket into which go all the emissions associated directly and indirectly with the company and its operations, such as those produced by the organisation’s value or supply chain; this is the most complicated to manage efficiently and to report in detail.


mccain.swarco.com/tms

























USDoT FHWA has put together a collaborative framework to help secure the roll-out of automated driving systems in the US. John Harding of FHWA explains the thinking…
ver the last 100 years, the transportation industry has been developed primarily for human operators. For example, roadway signs were designed to be easily seen, read and interpreted by humans. However, as vehicle automation technologies are evolving, driving responsibilities are beginning to shift from the human operator to the automobile.
The industry is rapidly moving toward vehicles equipped with automated driving system (ADS) technologies to navigate the roadway environments without human involvement. A key concern for this inevitable mass deployment of automated vehicles is earning public confidence that ADS-driven vehicles can safely and reliably operate in a mixed environment of automated and human drivers, with the expectation that the ADS systems perform equal to or better than their human counterparts.
In this vein, developers of an ADS and infrastructure owner operators (IOOs) that manage the roadways aspire to safe and efficient operation of automated vehicles. For this to occur, significant testing must take place. The USDoT’s Federal Highway Administration’s (FWHA) Testing and Pilot
Design, Development and Evaluation Framework (“the Framework”) project for ADS-roadway interfaces is available to assist in collaboration among developers and infrastructure organisations.
The goal of this project’s research is to develop a framework that provides support in the creation of test and pilot programmes, the outcomes of which can benefit both ADS and infrastructure entities. This article outlines the aspects of the Framework.
With no standards or evaluation procedures for ADS testing and no collaboration between ADS development and infrastructure stakeholders, the widespread deployment of this technology might never be achieved.
The successful operation of ADS on our roadways is heavily dependent upon the ADS being able to interpret and navigate its surrounding environment. However, with the development of ADS technology still in its infancy, there are still many challenges to overcome, such as ADS navigating complex traffic scenarios, adapting in adverse weather, and building supportive infrastructure. Given that ADS developers and roadway stakeholders seem to own
diverse, but complementary, visions on the testing and evaluation needs, the likelihood of safe and efficient deployment is necessarily contingent on productive industry-wide collaboration.
To address these challenges, FHWA is developing a Framework for successful testing and evaluation of ADS and roadway features that emphasises collaboration among the ADS and infrastructure organisations (FHWA-HOP-21-012).
The Framework is technologyindependent and consists of a broad set of processes and examples that advise without prescribing regulations or policy. Instead, the Framework adopts the notion that validation and testing of ADS technologies and various infrastructure features are essential to paving the way for safe deployment of ADS-equipped vehicles into the road network. Aside from the sheer scope of the possible testing that may be needed, a common understanding of the capabilities that need to be implemented either in the ADS or roadway domains is required.
Collaborative testing promises to provide resolution to these issues, resulting in a safe and efficient deployment of ADS. Numerous stakeholders have recognised the need


to investigate various ADS and roadway scenarios, including specific challenges to be addressed. Overall, these efforts will further advance deployment of ADS-equipped vehicles onto roadways throughout the US, with desired outcomes benefitting both ADS and infrastructure entities.
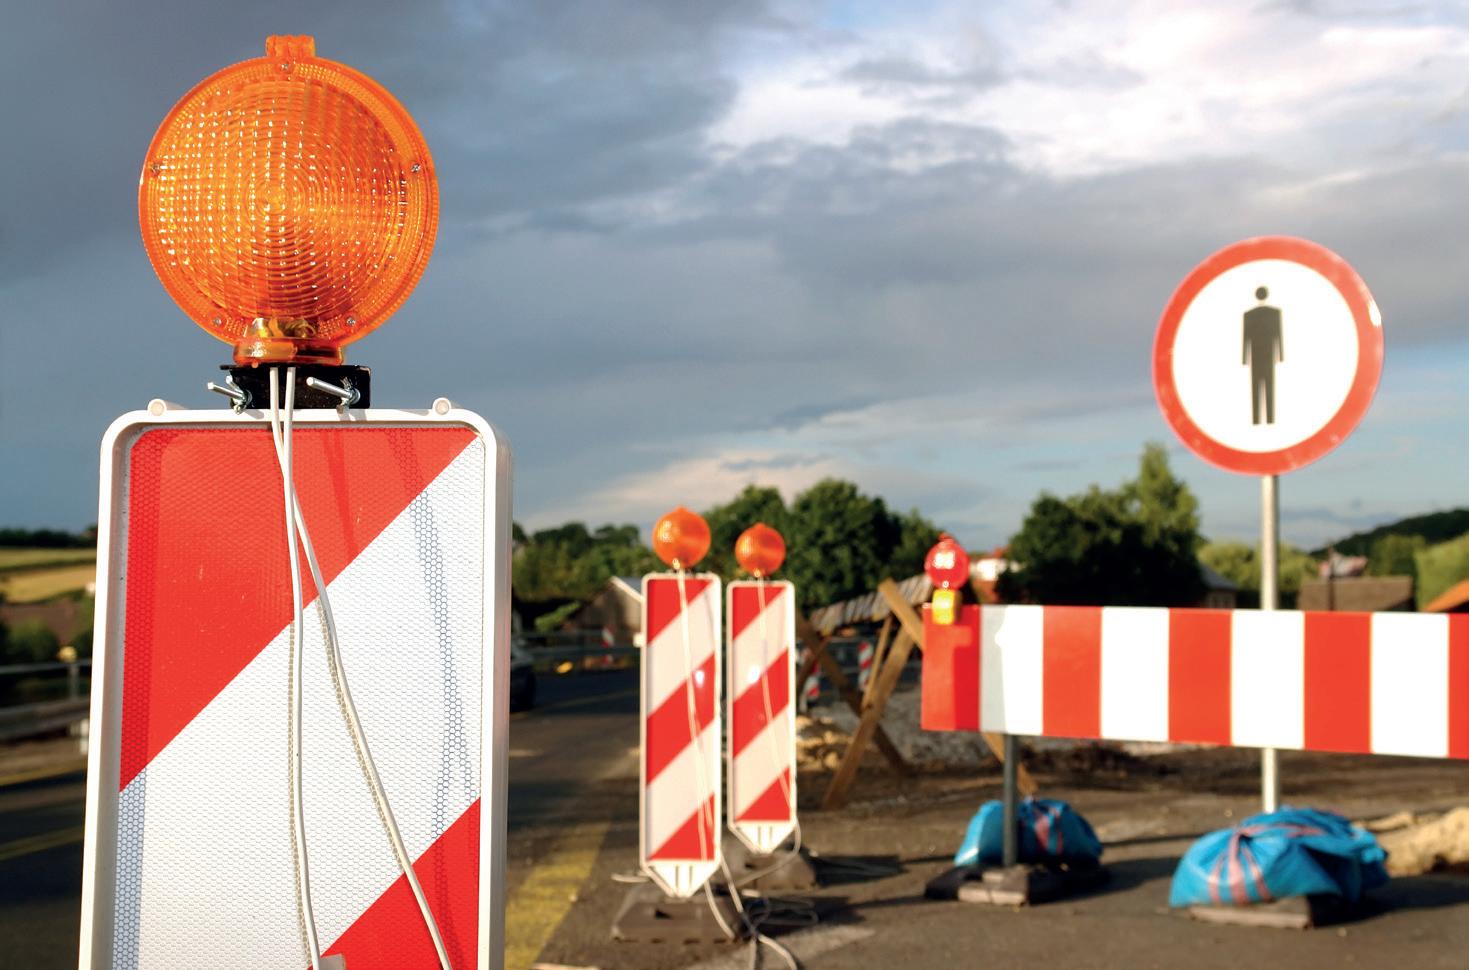
Consider a typical state DoT operations scenario where a busy highway is being resurfaced or expanded. Presently, the procedures and standards outlined by the DoT are designed to maximize the safety of the crew within the workzone, while still ensuring continual mobility for drivers.
For instance, one direction of travel is shifted from left over the centre line into a lane typically used for the opposite direction of travel (see Figure 1). This scenario is common across the US and poses some clear safety concerns.
The work crew must ensure that enough advanced warning of the lane shift exists and that visible barricades are distributed with proper spacing, while drivers must steer through the exchange without hitting or crossing the barrels, which could cause injury to workers, damage to equipment, or collision with oncoming traffic.
DoTs can expect that drivers have enough experience with workzone navigation to understand how to proceed safely. Yet, what might happen if the driver is altogether removed from the situation? Can anyone be certain that the automated vehicles of tomorrow will be able to operate safely through a workzone? The answer lies in the quality and scope of testing that will be performed for the ADS that is expected to displace human drivers over the course of the next two decades. Both the developers of the ADS and the workers within the DoT have a keen interest in how this testing is administered and evaluated.
The Framework provides a broad suite of tools, considerations and approaches intended to facilitate collaboration between the ADS developers and roadway stakeholders. As demonstrated in the workzone navigation
“
Historically, collaboration among ADS developers and IOOs has not been the norm
example provided above, both ADS developers and DoTs have vested interests in the safe deployment of ADS technology. Thus, the Framework was developed with extensive engagement and input from both ADS and roadway stakeholders, including automotive OEMs, suppliers, technology companies, and state, federal and regional government entities. It is far more likely that
their combined perspectives can accomplish these goals more rapidly, and with fewer errors, than the respective individual entities.
As shown in Figure 2, the Framework addresses nine over-arching themes, which support the four key elements and themes during various aspects of the test phases. The Framework embodies the contextual examples, real-world lessons learned, and various considerations, as they will vary across different tests and disciplines (e.g. ADS system developers, IOOs, first responders and fleet operators). All disciplines are interested in - or will be impacted by - ADS deployments on the road network. Each





































































party has a responsibility to engage in the testing and evaluation process for automated driving systems, and this Framework enables collaborative support toward the shared goals.
Themes
Collaboration between ADS and IOO stakeholders is critical for successful testing and evaluation. Stakeholder collaboration allows for early detection and resolution of ADS issues related to technical, organisational and strategic test implementations. Collaboration allows testing participants from diverse organisations, backgrounds and skillsets to solve specific ADS/roadway challenges. Open and frequent interactions lead to improved test outcomes. The quality of the testing is also enhanced because input from a stakeholder from another point of view can be collected.
As an example, Pennsylvania DoT (PennDOT) has already recognised the need to prepare for the mass deployment of ADS across the state. Therefore, PennDoT assembled nine partners (Blazina, 2019 and Paez, 2019) to work on changing infrastructure to support ADS in workzones by using distinctive coats for lane markings and barrels to aid in detection by the ADS.
In addition, the project will develop advanced mapping and communications
systems for safe ADS navigation at and around 17 different workzones across urban, suburban and rural areas. Prior to testing in active workzones, the partnership will conduct validation in virtual environments, then at a track at the Pennsylvania State University. By engaging automation development teams and creating a comprehensive plan for testing, PennDoT will have a better understanding of how ADS systems operate in certain conditions, and thus will
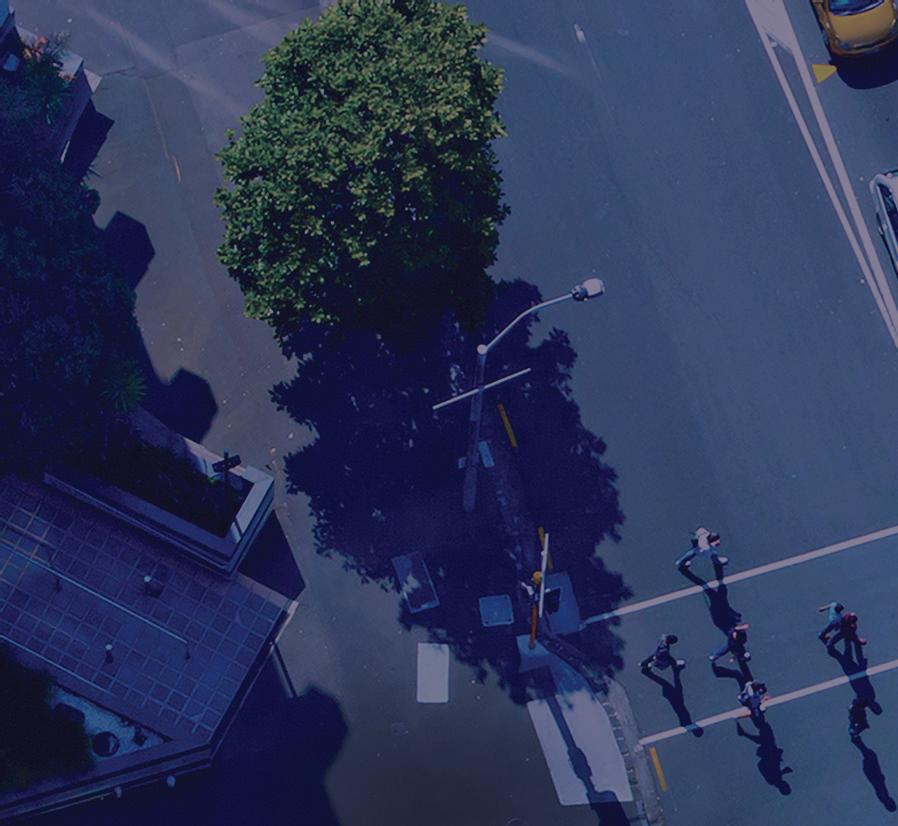

Keeping road workers safe could be a key application for automated driving
be better-equipped to fulfill its mandate for keeping state drivers safe and informed.
Another example of collaboration to achieve roadway safety goals is the Michigan DoT (MDoT)/3M Connected Roads I-75 Test Corridor. MDoT collaborated with 3M to deploy a 100-day test of 3M connected roads prototype solutions in a 3.3 mile construction workzone. The collaboration took place between 3M, MDoT, and a variety of automotive OEMs and sensor suppliers.











Common Ground refers to creating a common or shared working environment so that ADS and IOO stakeholders fully understand each other, which is critical for tests to be successful. When executing ADS/roadway tests, all parties will have clearly defined expectations, outcomes, and success criteria. There are three key components of Common Ground: 1) common goals and benefits; 2)common ter minology; and 3) common metrics and measures.
Test Logistics refers to what to test, how to test, and where to test. This includes development of test scenarios, testing methodologies, and test environment. Test logistics is tailored to specific test scenarios and what aspect of ADS and roadway is being tested.
Having organisational experts from both the ADS and IOO organisations participate early and throughout the test phases will greatly aid in navigating any challenges. The Framework adopts the premise that for ADS/roadway testing and evaluation, safety of all road users is the greatest priority. Within this premise, state and local regulatory policies must be developed, which requires that policymakers be well-informed on relevant topics and are kept up to date


“
“ With no standards or evaluation procedures for ADS testing and no collaboration…the widespread deployment of this technology might never be achieved





on developments. The Framework aids in navigating challenges that IOO and ADS representatives encounter when conducting tests, evaluations and pilots.
In the process of ADS/roadway testing and evaluation it is important to identify who from the various organisations needs to participate, what roles within the organisations are needed, and when (i.e. which phases)


they need to participate. Some participants may only be involved in one phase while others may be essential to all phases.
For a collaborative environment to exist, stakeholders’ participation as part of the test design plan, data collection plan and evaluation plan can be beneficial. For instance, ADS/roadway test and evaluation needs to account for roadway adaptations, which can

be incorporated through collaboration with IOO.
One example is Waymo’s First Responder Engagement Plan. The objective of this plan is to provide first responders with the knowledge they need to safely identify, approach, and interact with a vehicle equipped with ADS in an emergency scenario.
Data is a key issue that requires thorough discussions from IOO and ADS stakeholders to avoid challenges (e.g. proprietary data/ information, use of data). Data is critical to evaluate the outcome of tests and data is key to effective road network operations. It is possible that ADS and IOO stakeholders can share a variety of resources. Resource sharing includes sharing of skills and expertise in addition to sharing of information and existing data.
An example is Arizona IAM Consortium Collaborative Data Sharing. Arizona’s IAM consortium is leveraging existing infrastructure to collect performance data on public roads. The research relies on a low data ask from collaborating partners. This may encourage greater openness and participation from ADS stakeholders.
With ADS, the new driver of tomorrow will be the vehicle. This Framework is an instrument that provides examples and scenarios to those conducting tests and pilots to prepare for a safe and functional road network with, at first, both types of drivers (i.e. human and ADS) sharing the road, and then aid in transitioning the network into the new normal.
Many factors influence the success of ADS and roadway testing and evaluation. The most critical success factors include enhancement of technical maturity, comprehension of ADS, roadway test elements, the process, stakeholder engagement and collaboration, and ongoing public communications. The Framework aids in assisting the ADS and IOO participants in defining test success factors within each test phase.
The activities for successful collaborative testing and evaluation can be categorised into four phases as shown in Figure 4.
The output of the pre-test phase is a clearlyidentified problem statement that is based both on the internal needs of the ADS developers and the industry. A clearly-defined problem statement supports collaboration with IOO and others to then work on a test definition (the next step). Programme risks,
*Automated driving systems
Test program may require multiple iterations to meet designed goals
“ “ As vehicle automation technologies are evolving, driving responsibilities are beginning to shift from the human operator to the automobile
including operational, technical, data, legal and financial, should be identified during this phase. Overall, this collaborative effort is designed to expand the scope of those impacted by the testing effort in order to minimise longer-term issues and delay.
The objective of the Test Definition phase is to conduct activities, which help define the technical and data facets of a collaborative test programme. The completion of the Test Definition phase produces a Test Plan, a Data Management Plan (DMP), and a Quality Plan, which facilitates subsequent test execution. Critically, the success factors, both technical and organisational, are defined for the programme. Having clearly-defined success criteria ensures an overall higher test quality.
In the Test Execution phase, both technical and data facets of the collaborative ADS and roadway testing proceed as defined in the Test Plan. The focus is on efficient collection of performance data. The phase includes operational collaboration, ongoing communications among stakeholders, and monitoring and adjustments to the test. After
completion of this phase, ADS performance data is gathered and reviewed to determine if the system is ready to advance to the next phase. For example, if the performance failure at night is considered critical by the stakeholders, then it is likely new tests will be scheduled after updates are made.
In the Post-Test phase, stakeholders aim to close the collaborative testing and evaluation activity. They review data insights, store data, and discuss lessons learned. Equally important is the evaluation of the processes used, which drives future programmes. Overall, this collaborative effort directly leads to a higher level of confidence by the stakeholders, and by extension the public, that the ADS-equipped vehicles will be safely deployed among existing drivers.
Historically, collaboration among ADS developers and IOOs has not been the norm, nor has testing of ADS-equipped vehicles with varying transportation infrastructure components. ADS technologies have been developed and tested, traditionally, with little or no discussion with roadway stakeholders. Communication between IOO and ADS stakeholders has focused mainly on gaining approval to test on the road network. Proprietary data concerns have been identified as a roadblock to the willingness of ADS developers to work collaboratively with IOOs.
However, the Collaborative Framework for Automated Driving Systems/Roadway Testing addresses collaboration from multiple perspectives throughout the test lifespan. It provides examples where collaboration has yielded successful outcomes, the benefits of collaboration, and information on how and when to collaborate.
Successful collaboration among stakeholders will allow for early detection and resolution of ADS and infrastructure issues related to technical, organisation and strategic test implementations. Ultimately, this helps focus the efforts of both the ADS development teams and IOO stakeholders working toward the common goal of safe and efficient deployment of autonomous vehicles. ITS
ABOUT THE AUTHOR:
John Harding is USDoT/FHWA Office of Transportation Management, Connected/ Automated Vehicles and Emerging Technologies team leader

















Jenoptik provides innovative and sustainable smart mobility technology and services.
As an end-to-end solution provider, we support our customers with the provision of roadside equipment and software, including integration and installation through to full-service operation. Our strong global presence and installation base is supported by a reliable partner network.
With innovation as our driving force, Jenoptik is a world-leading enabler for smart mobility, making roads, journeys and communities safer around the globe.
jenoptik.com/markets/public-safety










Legacy traffic management infrastructure doesn’t have to be a marker of the past: software upgrades can bring it into the present in a cost-effective and timely way, says Gordon Feller
Adoption of new technology when it comes to US traffic planning has historically proceeded slowly. Often, new traffic innovations are introduced during cycles of capital investment, with the expectation no changes are needed for decades until the next investment cycle. Financial and political capital are exhausted with each upgrade, and technology is placed with the understanding that a generation may pass before a replacement. Against this backdrop, a wave of innovation has taken place in the software field. Artificial intelligence (AI) and machine learning have made no shortage of headlines in the past few years, with some of the larger market players such as ChatGPT posing macro-level questions about the future of entire industries. It’s into this market that the Software as a Service (SaaS) transportation analytics company GridMatrix launched in 2021. GridMatrix was conceived when the founders, including CEO and co-founder Nicholas D’Andre, were spending time

abroad working in the global supply chain for his former employer, Apple. “At the time, our founding team talked a lot about how responsive the transportation systems we saw abroad were, and we started talking about how someone needed to do something to improve traffic flows in the US. We kept talking about it until ‘someone needs to do something’ became ‘let’s do something’.”
Since mid-April, GridMatrix has won multiple state and national contracts, including with Georgia Department of Transportation, Arizona DoT and the Purchasing Cooperative of America - an assembly of over 1,300 member governments. The company has concurrently launched or is bringing up deployments in new locations, including Peoria, Illinois; Morrisville, North Carolina; and California State University, Sacramento. GridMatrix was selected as CoMotion Miami’s M2 Challenge winner from six leading mobility technology startups, had its ongoing work in New York City recognised at Smart Cities Connect’s Spring conference with a Smart50 award, and
launched a host of predictive safety metrics at conferences on both coasts.
“It’s been a busy spring,” says D’Andre with a smile. In addition to the new projects, the company has been focused on delivering enhanced results for existing customers, such as the Port Authority of New York and New Jersey. D’Andre, along with the company’s vice president of data science David Von Dollen and director of government affairs Kyle Pickett, recently spoke on a panel at Smart Cities Connect in Denver about the deployment – as did the Partnership for New York City’s vice president of innovation, Stacey Matlen.
GridMatrix has been working with the Port Authority since April 2022, when its software platform was selected from over 150 start-ups globally for a proof-of-concept deployment in America’s biggest city. The company proposed to overlay its SaaS platform to provide transportation analytics on congestion, emissions, signal performance and safety based on the Port Authority’s existing public traffic video feeds.
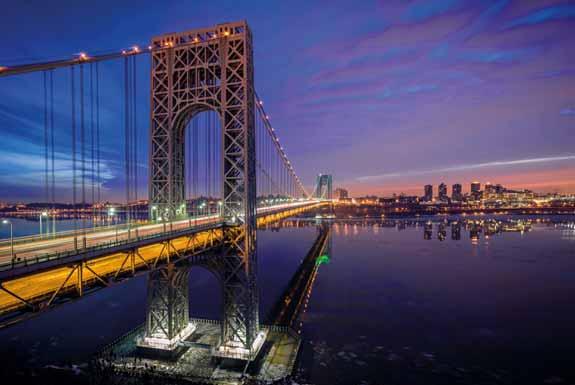
The project was overseen by the Transit Innovation Partnership’s Transit Tech Lab, run by a public-private partnership between the Partnership for New York City and the Metropolitan Transportation Authority. Initially deploying its technology on the George Washington Bridge, the Port Authority subsequently invited GridMatrix to deploy its technology on additional facilities in the agency’s portfolio, including the Lincoln and Holland Tunnels for a year-long pilot that continues today. Collectively, these locations are the world’s busiest bridges and tunnels, and carry more than 180 million trips annually.
The tech stack begins with the sensor footage, which could be a camera feed, a Lidar point-cloud, or other input methods. The raw footage is uploaded from its IP address via fibre or 5G to the AWS cloud using RTSP or similar protocols. AI and machine-learning algorithms are layered over frame-by-frame on this feed to provide initial object detection. This algorithm then classifies road users into categories based on their appearance, delineating objects such as pedestrians, trucks and cars. These objects’ trajectories are calculated, and once the process is complete, the original video frame is discarded. The software retains the metadata, which then gets turned into metrics on road usage, such as post-encroachment time visualisations, carbon outputs and turn counts.
The metrics are then communicated via a user dashboard. The dashboard has two modes, one which displays a map view of the city, and which provides time-series information about an individual intersection. The city view and the intersection view are












further broken down into metric classes, such as emissions, and historical versus real-time information. Each of the classes in turn contains a variety of metrics - within congestion, for example, are graphs and charts on object







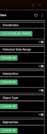

volume, idle time, total travel time, and average queue length, among other statistics. These can be further filtered by time, object class, movement type and approach.
All of these pieces of information offer a granular, detailed and data-rich view of each intersection in question. GridMatrix users typically analyse the data in the dashboard, but for public-facing or internal reports, users can generate .csv files, .pdfs, or use an application programming interface (API).
We started talking about how someone needed to do something to improve traffic flows in the US
“ “
Nicholas D’Andre CEO & co-founder,GridMatrix
“We’ve been surprised by the number of governments we’ve spoken to who have specifically mentioned that they love the platform’s ability to easily generate reports,” said Pickett. “It’s a straightforward aspect of the technology, by design. But if you're used to older cameras without much in the way of software support, getting a day or a month’s worth of data in a one-click, downloadable PDF is a big leap forward.”
The first on-the-ground example of these ndings in action came during an early deployment in which GridMatrix’s system calculated emissions at an intersection to be 50% higher by volume than the average local intersection. The culprit was a left-hand turn which was running simultaneously with a crosswalk in a heavily trafficked pedestrian zone. Left-hand turning cars often had to wait for foot traffic to reduce before they could proceed, causing emissions from idling cars to jump. After GridMatrix brought the intersection to the attention of the operations team, the light reconfiguration was able to reduce idling time by 20% and improve the traffic flow.
“GridMatrix has demonstrated how its technology is uniquely positioned to provide critical insights to adapt to a changing mobility landscape,” said Matlen. “Agencies should be empowered to use new technologies to reduce staff time to collect data and improve data quality to ensure our roads are as safe,

clean, and efficient as possible.”
In tandem with the Port Authority deployment, the analytics platform was updated earlier this year to grow the system’s safety features. After the algorithm calculates post-encroachment time and time-to-collision data, GridMatrix’s software creates a heat map for near-misses, which can help traffic engineers identify particularly dangerous hot spots. Similarly, GridMatrix developed real-time alerts for a range of unusual road activities. These can be pre-set scenarios, such as an auto-alert for accidents, or customised, such as alerting for pedestrian incursion into a vehicle-only area, or congestion levels surpassing a defined value.
GridMatrix’s work with some of its customers has faced technical challenges. Foremost among them was the layering of detection software onto very low resolution video feeds, some as low as 240P resolution. GridMatrix’s engineering team confronted the challenge head-on, improving the initial accuracy of metrics derived from these low-resolution sensors to levels approaching 90%. To understand how technically challenging these accuracy levels are to achieve, consider that a 720P camera feed has more than 10x the number of pixels as a 240P camera, while a 1080P HD camera has more than 24x the number of pixels. By achieving high accuracy levels approaching those derived from higher quality feeds, GridMatrix created a new approach to the traffic analytics market. It's here - in the utilisation of existing, low-fidelity sensorswhere GridMatrix is attempting to change


of the past, old and under-utilised cameras, radar, and inductive loops can be as much a part of the future of transportation innovation as newly-purchased and -installed sensors. Indeed, in a world where any sensor is a potential input source, even modern camera technology can find itself taking on an unexpected second life. Camera software is typically siloed by brand and hardware type, limiting communication. By consolidating metrics from different generations, brands, and types of sensors, GridMatrix aims to offer traffic engineers a cross-sensor view of the city.
The strategy of integrating existing sensors into the ITS ecosystem has already started to pay dividends for GridMatrix. “Hardware procurement has a long timeline, a high cost and requires shutting down pieces of infrastructure temporarily,” said Pickett. “For a lot of cities, adding another sensor at the same intersection is too redundant and costly to justify. Conversely, almost every city we talk to has ageing infrastructure deployed somewhere that they’re not quite sure what to do with.”
Almost every city we talk to has ageing infrastructure deployed somewhere that they’re not quite sure what to do with
Kyle Pickett, director of government affairs, GridMatrix “ “
the rules of the ITS market.
“It’s easy to recognise the value of data generated by modern, 1080P cameras or cutting-edge sensors like Lidar,” said D’Andre. “But most cities don’t have the budgets to stay on top of new hardware releases or an appetite to deploy and maintain them at scale. Cities make do with what they have, which is critical especially when you consider the useful life of some of these systems.”
As an example of legacy infrastructure, D’Andre cited downtown Atlanta, which he noted still has cameras running that were installed to manage traffic for the 1996 Olympics. He said that the use of sensors like these as ITS inputs provides a path for cities to see faster returns on investment. “In the process of capturing data and processing data generated from already-installed, legacy sensors, we were able to show that useful transportation data can be immediately activated for cities that thought collecting this kind of information would require an enormous amount of time and capital investment,” he says.
Therefore, rather than being markers
Pickett believes that the data from these sensors has largely been an undervalued resource in the ITS market. “Turning older assets into smart hardware, at a low price point, and on a positively turnkey timeline compared to the alternatives, has generated a lot of interest among the governments with whom we’ve spoken.”
The potential for software-based infrastructure upgrades is particularly high because of its ability to iterate quickly. “GridMatrix’s software is constantly being updated with new features,” said D’Andre. “As our deployments grow in scale to cover cities and regions, we’ll be targeting an increase in our predictive capabilities to help large-scale traffic management.”
D’Andre expects that software’s ability to adapt quickly will ultimately prove the key to hastening the pace of ITS implementation across the US. “Upgrades are integrated for users as part of their subscription,” he explains, meaning that while GridMatrix “offers an immediate boost in capabilities for users, it also provides cities with a fast-track to new capabilities outside of the decadeslong upgrade cycle”. ITS









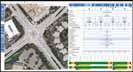



Integrate Centracs® signal timings directly with Vistro for quick analyses. In Vistro, study and send new optimized timing patterns back to Centracs for field deployment. Keep your traffic signal data synchronized between your management and modeling software – and make decisions with the latest information.
To learn more, visit www.econolite.com/solutions/systems/software


www.cross-traffic.com Moreeffectivewintermaintenance,saferroads, comprehensiveoverviewandcostsavings. Thankstoourroadweathertechnologies, youcankeeproadssafeandclear.

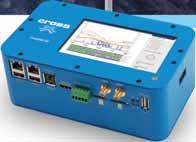


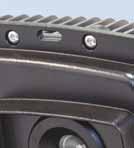
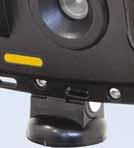




It has become abundantly clear that AI is set to play a role in every part of modern life – with transport technology being no exception. That’s why AGD Systems, which has been manufacturing ITS solutions in the UK for 32 years, set about designing a detector which incorporated AI technology – allowing for more enhanced data streams going forward, once the receiving systems on the market have advanced to the same level. An extensive research and development phase brought about the creation of the AGD650, a dual-zone, stop-line detector which is now in full production having been trialled successfully by local authorities across England, Scotland and Wales. Currently, a
detection of buses for bus priority schemes. Complementing the 650’s AI capabilities are its high-grade optics and deep-learning image recognition which detect both stationary and moving targets, two independent user-adjustable detection zones and simple installation using WiFi AGD Touch-setup. Given all this, it’s clear AGD has not only created a solution which is forwardthinking for 2023, but more importantly one which will continue to evolve and increase in capability going forward, keeping it at the forefront of advancements in ITS technology. It’s already having been given the green light by the local authorities involved in the trials ahead of the full production roll-out. One such authority was Cardiff Council, which installed an AGD650 at a
issues with existing technology which wasn’t effectively detecting waiting cyclists, and had no function to cancel demand if a cyclist moved away from the crossing before the green light triggered. Contact from cyclists who felt they weren’t being detected by the previous solution greatly reduced once the 650 was in place, and council representatives said they had been extremely happy with AGD’s communication, installation and pro-activeness. For more information about the AGD650, visit www.agd-systems.com or call AGD on 01452 854212.
accurate and timely data-driven decisions. The advanced analytics seamlessly integrates with existing road infrastructure and process data streams of any scale or structure to deliver 100% situation analysis. This includes:
• alerting of events and incidents

• Content produced in association with AGD Systems

• current and forecast weather conditions
• resource monitoring, such as patrol locations using GPS tracking
contributing risk factors well as by delivering 100% road monitoring coverage and holistic operators to provide accurate incident response, while reducing response time, increasing road safety and optimising operational expenses.
instant latest software updates and up-to-date security patching.
critical environments.







Miovision is a leading provider of integrated solutions that
recent acquisitions and advancements in road safety models and technology-leveraging AI, Miovision offers comprehensive,
addition to the Miovision portfolio is the integration of Miovision technology and Computer Vision to measure near-misses, vehicle
than historical crash data, including a proactive understanding


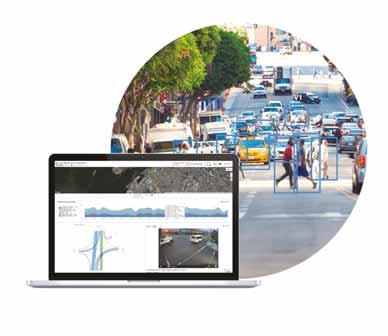




more successful in detecting different vehicle and other





on vehicle parameters such as speed and direction, they can easily detect position, speed and heading even if, after having
means that it is not necessary to send camera data over the

















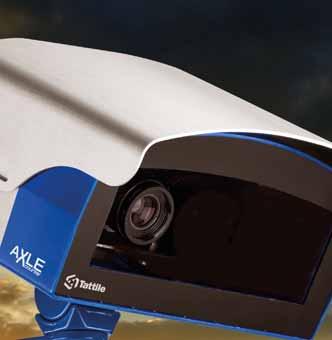
The realm of ITS is on the cusp of a groundbreaking advancement as Tattile gears up to launch its Smart+ camera. Engineered with cutting-edge technology, this revolutionary camera boasts a Dual AI Accelerator that promises to transform
At the heart of the Smart+ camera lies its dedicated hardware for AI algorithms. Unlike conventional cameras relying on general-purpose processors, Tattile's creation is purpose-built to excel in neural detection and optical character recognition
the camera can achieve unparalleled levels of performance and accuracy, thus optimising the entire tolling process. The integration of the Dual AI Accelerator is a game-changer. Designed with two independent channels, the camera can simultaneously process data streams, making it ideal for multi-lane tolling applications. This breakthrough innovation translates to maximum transit detection performance, boasting an impressive accuracy
camera guarantees real-time and reliable detection, ensuring seamless toll collection and reduced congestion. Equally
delivering outstanding plate-reading performance exceeding licence-plate format or language, the Smart+ camera can rapidly and accurately capture vehicle information. This feature is indispensable for tolling authorities and law enforcement agencies alike, enabling precise tracking of vehicles and streamlined toll management. Additionally, the camera's architecture is future-proof, allowing for seamless updates and customisation to accommodate evolving tolling requirements. As technologies and standards evolve, the Smart+ camera can effortlessly adapt, safeguarding investments and prolonging its lifespan in the ever-changing ITS landscape. As it hits the market, the Smart+ camera is set to revolutionise the tolling industry and contribute to a smarter, more connected, and sustainable transportation ecosystem.

data collection and analytics is revolutionising transportation planning and decision-making across the US. Powered by cloud computing, machine learning and advanced sensing, departments of transportation, and in a fast-growing number the power of existing infrastructure with no new hardware, platform integrates feeds from a variety of edge sensors, such on congestion, emissions, safety and signal performance. All data is delivered 24/7/365 and in real time with less than one platform will even work with multiple different sensor types at once, and from different manufacturers. Deployments take 1-2 includes data for multiple classes of vehicle and pedestrian in performance measures. The Emissions module displays Safety module includes data on near misses using surrogate
is proudly an American company founded and headquartered

www.gridmatrix.com or reach out to vice president of business
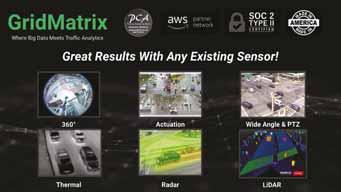










Countries, regions and cities all over the world are seeing unprecedented extreme weather events causing destruction in different ways: from heat and wildfires to snow and floods and much else in between. Jon Tarleton of Baron Weather explains how the ITS industry can help the transportation network to remain efficient as the climate changes

As you might expect, our global transportation network’s success is highly dependent on our planet’s weather. The profession of meteorology began in parallel to the world of aviation because airplanes are clearly influenced by the atmosphere at every step of the way.

However, our other transportation networks, especially our surface transportation system, are no less impacted by weather. We have seen a significant change in the past 50 to 60 years in the demands we place on this network to remain reliable. As an example, all those years ago in the US, the road authority would place a large drum filled with sand and a shovel, in winter, at the base of an incline. Then when it snowed, drivers





were expected to use the sand to help them climb the hill. How would a process such as that work in today’s world? Obviously not well. Not only would users not be excited about the idea, but more importantly, this method would be incredibly inefficient for our modern-day road networks.


Another example of how our network has changed can be seen in the delivery of products in the retail industry. Fifty years ago, many retail stores had a significant amount of storage on the premises because deliveries were infrequent and sometimes less reliable.
Therefore, to ensure a store always had products available to sell they maintained a larger on-site storage. However, since that time, the industry realised this was incredibly inefficient, and thus reduced the time products sat




in local warehouses. A large percentage of the time the delivery system is reliable enough to achieve this goal.
Today, the retail industry has dramatically cut the time the products go from truck to consumer, with their delivery fleet being their warehouse on wheels. This became a significant cost saving for the stores; however, the entire process only works well when the network is reliable. During extreme weather events, the surface transportation system typically becomes very unreliable and slow.



We also saw how sensitive our supply chain transportation network was during the recent pandemic. Although not weather-related, even short delays in the process can cause massive delays and disruptions, so making sure we have a resilient transportation network with respect to extreme and delay-causing weather conditions is critical.







‘Extreme weather can happen anywhere’

What we have learned through increased personal coverage of extreme weather events and through the changes we are witnessing in our global climate is that extreme weather can happen anywhere. The rest of the world is learning what meteorologists have known from watching the weather continuously for over a hundred years. No country, region, city, or community is immune to extreme weather events.



to survive it must be flexible to change with the changing environment.

This is all because despite our best efforts to create normal (or seasonal averages) and climate zones, at any point the conditions can come together to create extreme and damaging weather anyway. In fact, in areas that rarely receive a certain condition, the impact is even greater. For example, a flood in a desert climate typically causes more damage and can be deadlier than a flood in a tropical zone.

Now we can focus on the world of ITS, which was conceived to improve the surface transportation network to avoid simply adding more lanes on the freeway. We must add to that original goal: “How can ITS aid the transportation network to remain efficient as the climate changes?” The good news is there are some direct steps that can be taken to achieve this goal.





To add to this uncertainty, we have observed climate change, whether caused by humans or natural fluctuations, which means we are seeing extreme weather occurring in locations that did not previously see those extremes. All of this creates a lot of ambiguity. So, the real thing we are fighting against is change and the change of the environment. We have designed our transportation networks based on the weather conditions of the last 75 to 100 years, and for that system


The first vital step when dealing with decision-making involving weather is gathering accurate near real-time weather information. This is because weather conditions are constantly changing, and to know what is going to happen to a road network you must first know what is going on right now. To improve on this, the ITS industry must continue to recognise weather sensors as key elements of an ITS network.
The other challenge is most road weather sensor networks are thought of




as only useful during winter weather, so milder climates do not have these systems. However, these weather networks can provide critical information during any type of weather that can impact transportation. Creating inexpensive yet reliable weather sensors or creative ways to infer weather conditions from moving vehicles is another important step. Even crowdsourced data from social media apps could be an effective data source if properly quality-controlled. The key though is data, and lots of it! Measuring the weather in real time is the first step in making the surface transportation network responsive to changing weather.
Where the rubber really meets the road is in a weather forecast. Over the last 30 years, weather forecasts have been quietly becoming more and more accurate. Even though we still joke about the accuracy of a meteorologist, in reality, in certain parts of the world, weather forecasts have been getting significantly better and better. And while


During extreme weather events, the surface transportation system typically becomes very unreliable and slow











our attentionhas turned to the longer-term outlook of the climate viewed in decades, real change and resilience can be made in the short term. These accurate forecasts are not to be confused with free forecasts delivered via apps: the improvements have come from private forecast companies and government meteorological agencies that have made real strides.
In the simplest terms, every day, you use a forecast to decide on many decision points in your day. What you will wear, will you go for a run, what transportation will you use, and even will you cook outside or in? A weather forecast helps everyone in the developed world to plan.
Intelligent transportation networks need to have weather forecasts as part of their architecture and decision process. Almost every weather condition except for a ‘nice day’ has some sort of impact on the transportation network. Even conditions such as fog, gusty winds, and excessive heat or cold can cause impacts on the transportation network. The challenge is we see too many organisations that rely on free forecasts. To improve the quality of the planning we are referring to, a paid service from a weather forecasting provider is needed. We have to move past the thinking that when extreme weather impacts us there is nothing we can do.
A final consideration that has become more and more efficient is that a successful transportation network is a diverse one. Weather conditions can impact public transportation, private vehicles and rail differently. Thus, a diverse network ensures that if the impact is only felt by one mode or one system, the entire region is less impacted. To ensure a resilient network, intelligent transportation

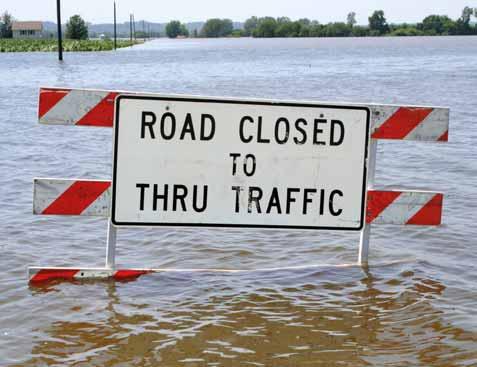


networks must be diverse and able to accommodate changing weather conditions.
A smart transportation network is all about deciphering data, formulating a solid plan, and the final piece – communicating it to the users of the network. Communicating what users can expect when weather impacts them is a critical piece of the puzzle that must be working in concert with the rest of the system.
This means not just telling people what the weather will be, but what the impact will be on them. Would someone ever go to the airport and board a flight if they knew it was going to take 18 hours longer than planned? Of course, it depends on their individual situation. However, if the airline could tell you the real delay instead of “check with your airline often for updated flight information,” how much better would our collective flying experience be?

The same can be said of the surface network. If we could tell users what their
change their departure time or change their method of travel? By using real-time transportation weather data and a high-quality custom weather forecast this can be achieved. The ITS industry is great at providing information during ‘normal’ weather conditions, but a communication plan in extreme weather of simply ‘stay at home’ is not good enough to convince users to change their behaviour - nor is it efficient for the network. ITS

Weather



“ “ We have to move past the thinking that when extreme weather impacts us there is nothing we can do


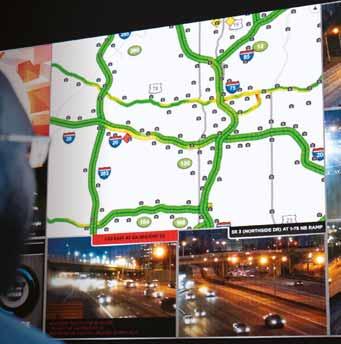








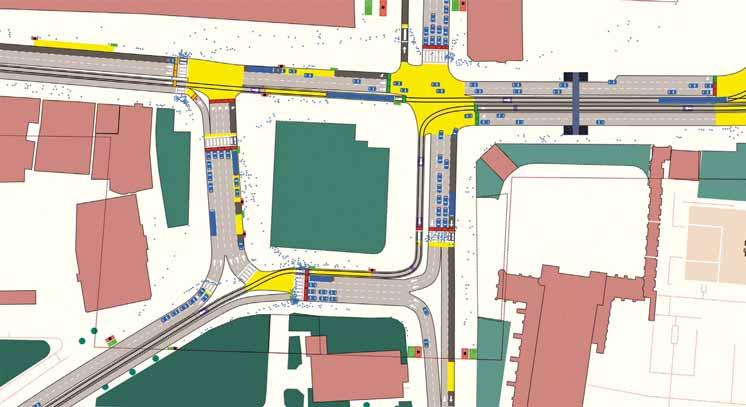
Aimsun is switching strategy from being a pure software firm to one that is focused on outcomes. The company’s CEO Alexandre Torday talks to Adam Hill and explains why
Earlier this year, tech firm Aimsun announced a switch in strategy. The company says it is "transitioning its focus from software delivery to outcome-based solutions". It’s a big change in emphasis – so why take the step? “I think it's a mix,” explains Aimsun CEO Alexandre Torday in a call with ITS International “First, our own feeling on what we can offer to the industry; but I think we have accelerated this transition once we observed that quite a few of our key clients were fully in agreement with this vision. So there is a feeling of ‘this is what we could do’ and the client is, like: ‘Oh my God, that's what we want’. So that's the direction: we have to invest, accelerate, prepare this and go out to the market. The reality is that we have been in the software industry forever and we continue to be a software company. It's just the fact that, to put it very bluntly, there are people who still think that by buying software, you have solved the problem. Very often we say: ‘Guys, once you have a USB dongle and you plug it in the laptop, you still don't have the answer to your question which is: What will be the impact of the new light rail in Barcelona? This is not what you want’.”
So what do clients want? “Very often people say: ‘I want a simulation. I want a model. I want the microsimulator, I want…’ No, that's not what you want - tell us the truth – what do you really want? And when you go back to a client in the end, they say: ‘What we want is answers’. Okay, so let's reverseengineer from there. How would you like the answer to come to you? [The client says:] ‘Oh, ideally, I would like a platform where I can show the results to different stakeholders, where different consultants can use the same platform for consistency, to be able to answer questions’.”
As Torday points out, if you work backwards from the desired outcome, then the way you get there – microsimulation, a data-driven approach or whatever – will fall into place. “Don't talk to me about the tools, talk about what you want at the end,” he says. “And this is how the process has come about. People just want a digital mobility solution to interact with the specialists that can work on all the assumptions with the back-end team –the consultants, the commercial and political stakeholders. They just want to know: did we do the testing to be sure that the model is accurate? Have we checked these KPIs? And
show me the results.”
And then they want to see quick results in a way that is easily understandable, rather than on a mass of impenetrable spreadsheets. Torday is not surprised that Aimsun’s new approach has had a receptive response – although he admits it was even more positive then he expected. “I thought it would take more effort to convince them because we thought a lot of people will be stuck on: ‘Well, we always did that - why would you do it differently?’ So we were afraid that some people would just say: ‘No, we buy licences from you; we have a bunch of local modellers; then we do tenders; we have consultants buying their licence from you, building models that are project specific; and then, essentially, when it's done, potentially the model will die and we just start again.’”
This new approach requires clients to ‘own’ more of the solution and manage different stakeholders. So even though Aimsun says it will save money and time, it does increase complexity. “It requires that they have to take ownership of the management of the solution and we were afraid that some clients would say; ‘It is too complicated for me’; but quite a lot of them were just like, ‘Great - that's what I want’.”
This could be because of a more general shift in the way that transportation is being viewed by governments, authorities, agencies, and also companies themselves. “There are way more stakeholders now that want answers to questions related to people's mobility than 1015 years ago,” Torday muses. “Then, people would say: ‘This is just the road administration's question, period’. Nobody cares.” A new freeway, a new tunnel or a new traffic signal were seen perhaps as sitting in their own silo, not affecting anything else. This has changed, he believes: “Now I think there is an implication at all levels: energy consumption, air quality, energy analysis, accessibility, planning. It’s not anymore [the question]: ‘We will build a new neighbourhood in 40 years - how many lanes do we need to serve that?’ Mobility is changing super-fast: people with scooters are doing that. This is not just how many lanes on a motorway I need. I cannot just say: 5,000 people, increase the capacity of the motorway by 20% – done! So the problem is very complex, which is leading to a challenge we are facing every day, which is to convince these different stakeholders that they can use – for most of the cases - the same digital mobility solution or platform to ask the question; they don't have to buy and build their own.”
selling point for Aimsun. “That's correct,” says Torday. “That being said, to respect our dear colleagues who are transportation engineers, they still have the responsibility to make sure that the back end of the solution is properly configured and that the results make sense. For complicated questions, you will have to go to experts that will set up some of the elements so that you can get your answer properly, but the interface will allow you to access the answer in a very easy way.”
Accelerating communication
It is web- and cloud-based, open to multiple people who can log in if they have permission. “It just accelerates the communication chain,” says Torday.

This is a cost-saving – particularly in the public sector when working for a local or city authority, for example. “I mean, we are happy to sell the same solution 15 times to different departments!” Torday jokes. “But that wouldn't be fair, especially for the taxpayers. But more importantly, this is not just about money - it's about consistency of the results. If one department is saying: ‘We should invest more in public transport, because I have done Model A that says that we will save 20% on energy’. And then you have another department that says: ‘Thanks to Model B, we think that public transport investment is a disaster and we should invest in Uber.’”
Torday laughs: “When that arrives on the desk of the minister, he would say: ‘What do I do with that? This is all over the place - fire everyone!’ Obviously we are biased because we are a strong believer that the quality of this platform is enough so that people don't have to set up a lot of other platforms. We don't think that we are amazingly better with our core algorithms - we have been fighting with different competitors across the industry. What differentiates us now, in our opinion, is usability – this is where we think that we are cutting-edge with our offering.”
Since the stakeholders who are interested in transportation issues now are wider than purely roads engineers these days – recognising that the way people live and move is fundamental – this usability will be a key
Within Aimsun has there been internal resistance to this change in philosophy?
Torday pauses. “Well, I'm very enthusiastic. Maybe people are shy to talk to me! My first feeling is people really think that it makes total sense and it's a natural transition. It's still difficult on a daily basis - especially for people that have been working in the company for 10, 15, 20 years, who are always mentally trained to organise the best software.”
The new message to some extent pushes the software itself into the background: Aimsun is focusing on the ‘why’ rather than the ‘how’. Even so, the company is very clear that software – in this case its flagship Aimsun Next product – remains at the heart of its process and is fundamental to what it’s doing.
The company has launched five mobility solutions, all prefixed with ‘Aimsun’: Insight (historical data analysis); Predict (real-time data analysis); Start (rapid assessments and pre-feasibility studies); Plus (full planning and operations); and

Live (real-time decision support system for transport management). These package what Aimsun calls its "classic transport simulation software with data management and analytics, artificial intelligence and services".
Aimsun Next
“We wanted to be sure people didn't get confused,” explains Torday. “We wanted to say that Aimsun Next remains the core engine behind most of our solutions –Aimsun Plus, Aimsun Start, Aimsun Live, the ones that have a simulation component. But the way it's set up, bundled, the way you digest the data, the way people can interact with it, depends on what you need as a client and we have different solutions for you. But the very, very back-end engine and the algorithms are from Aimsun Next.”
Torday says there were ‘awkward’ conversations with some consultants about the new approach because they saw Aimsun would be setting up models and thus taking work away from them. “They said: ‘This was part of our business’. And we said: “Yeah, but that was the very painful part of the business where usually you lose money. And you were doing it because then you will gain money by doing scenario analysis where you provide your intelligence by saying: ‘Hey, I have a new solution why the light rail is taking the A route instead of the B route’. That's what you're good at. We are very
To
there
Alex Torday Aimsun “ “
put it very bluntly,
are
people who still think that by buying software, you have solved the problem

good at setting up models, so we will set them up and maintain them and this will be more cost-effective for the end users. Way more people will have the feeling that they can ask questions and guess to who they will ask questions? To you! So leave us alone for a little moment. We will set this up and you will see that it's rewarding for both you and me. And you will continue to be able to use Aimsun Next to configure any of your light-rail itinerary solutions in the platform to answer the questions of your client. So, no panic guys. It's about increasing the size of the cake instead of fighting for a small cake. That's really what it is.”
Simulation and modelling projects at times can be perceived by clients – perhaps unfairly – to be exercises in reinventing the wheel, with the client picking up the tab multiple times. What they might really like instead is a single digital twin with forecasting capabilities, which will be kept up to date. This is the ‘service’ rather than ‘software’ element which Aimsun wants to embrace.
“There are a lot of trendy words out there,” Torday says. “But it's essentially something where you say we are creating a representation of the mobility in your city or region. We are maintaining it with more and more data that will allow us to do it faster, more consistently, with more accuracy. And then you - the consultants and the stakeholdersuse this platform to exchange ideas and test scenarios. But you don't pay again and again for the same intersection.”
But surely there is a danger – in this ‘service’ scenario - that the software becomes a commodity?
Torday considers this carefully. “We have to have an educated conversation with our clients,” he says. “What is the value you put on having this platform or solution available for you? How much did it help you


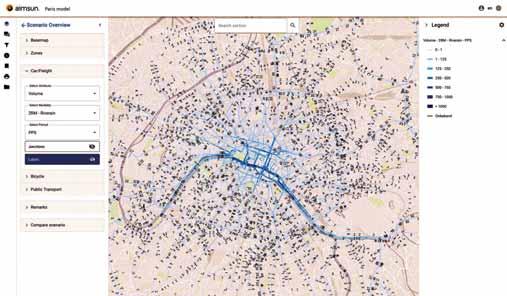
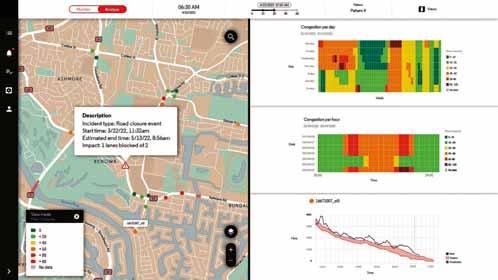
Usability is one of the platform’s key selling points
to save money - not just on the studies – but how much did that help you to save money in your real-life investment? If you can have a tool that allows you - well backed-up with the right KPIs – to say I want to invest more in this and that, there are millions
There are way more stakeholders now that want answers to questions related to people's mobility than 10-15 years ago “ “

that can be saved. Also, what is the other opportunity? Do you want to go back to Excel spreadsheets? Do you want to go back to the old way of doing consulting? We are very convinced that people will see the real value.” ITS



























Connected vehicle safety isn’t just under threat from malicious actors exploiting code – it’s also about avoiding software faults that could result in harm to people, says Patrick Shelly of Qt Group
Software developers will soon be the new car mechanics as the automotive software market explodes - expected to balloon up to roughly $80bn by 2030. Like many other industries, the automotive industry is experiencing unprecedented levels of innovation, technological advancement, and competition. Infotainment, connectivity, and third-party companion apps and devices will soon become commonplace in our vehicles. And what that means is that the battle for car manufacturers to stay profitable will be won, not over mechanical parts, but over lines of code.
You can get a sense of this seismic shift from the ever-increasing involvement of big tech players Google, Amazon, Apple and Microsoft in the automotive industry in the last few years. Even though most of us in the 2010s probably thought we’d be travelling in autonomous cars by now, lots of progress has still been made in the space, as evident by driverless ride-hailing tech in major US cities from Google-owned Waymo. The UK Government even asserts that by 2025, AVs will be commonplace on UK roads.
While the quality of that code is obviously going to impact the usability of car features, you can’t talk about any software today without talking about security. And the security implications for the connected vehicles of the future are enormous - both in terms of how bad actors could exploit code

vulnerabilities but also how bad code could result in unintended breakdown of critical functions.
Just how safe are AVs from bad actors?
Questions have already started to emerge about the safety of AVs. However, this is really just a taster of what future concerns might look like as cars become increasingly connected. Being software-driven (no pun intended) means code security is going to receive extremely close scrutiny under the microscope.

Just a few years ago, security researchers stunned the automotive industry by hacking into an insecure Jeep being operated by (consenting) Wired reporter Andy Greenberg. It was a warning shot to the industry that led Jeep’s parent company Fiat Chrysler to recall 1.4 million vehicles. The National Highway Traffic and Safety Administration even issued a fine of $105 million.
Did this scare, cancel or slow down development of AVs? Of course not. Development of AVs will accelerate. But without a clearly defined regulatory
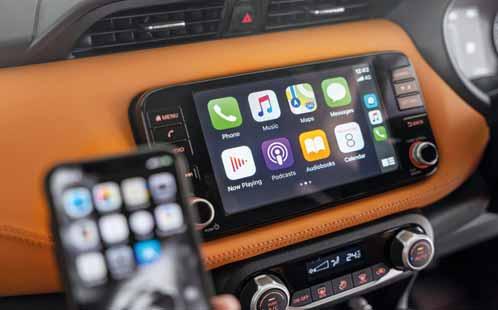
landscape, coupled with exceedingly strong pressures from consumers and competitors alike to deliver to market, there’s inevitably a risk that we’re going to see human error lead to deployment of unhealthy code.
The potential cost to human lives alone is one thing, but as the Jeep incident shows, there are financial losses too: data breaches cost businesses an average of $4.35 million in 2022. And with that comes reputational damage, not to mention slowed delivery of products and services as issues get rectified.
The attack surface is getting wider too. We’ve seen with the rise of attacks in open-source software how even the critical vulnerability exploitation of the Apache Log4j library, found in innumerable software products, could affect devices or properties found in or used for cars. These include chargers, in-vehicle infotainment systems and ‘digital remotes’ for opening cars.
Car safety isn’t just under threat from malicious actors exploiting code. Code quality and its reliability matter just as much when it comes to avoiding software faults that could result in unacceptable harm to people. We call this functional safety.
Consider that a single car built today can have as many as 150 electronic control units (ECUs). In other words, the ECU is a small computer that controls a particular function in a car. Before ECUs, mechanical systems used ignition timing, fuel, air and engine rotation to control the vehicle, but now it’s all programmed inside the ECU.
Of course, the last thing you want when driving is for a bug to cause your car’s dashboards, navigation and safety systems, or worse - the brakes and engines - to fail in the middle of a highway. And if we’re going to avoid these nightmarish situations, in addition to ensuring the best functionality and usability, car manufacturers must treat

Software needs to be designed with safety in mind from the beginning “ “


The security implications for the connected vehicles of the future are enormous “ “
software testing with the same rigour they apply to testing mechanical parts and systems.
Now, traditional automotive testing of parts has typically been costly, time consuming, and not exactly easily repeatable, but on the software front, things are a little different. In fact, there are some great solutions developers use in the sector: namely Software in the Loop (SIL) and Hardware in the Loop (HIL) testing. And these are being incorporated into the modernised approaches to software development that are seen with the new software-defined vehicle (SDV) initiatives.
SIL is an approach through which code can be tested periodically as each segment of a program is completed, rather than waiting for the final build. It separates software from hardware development so software developers can continue to innovate beyond the hardware industry’s pace. Tests can be automated, even run simultaneously, and it’s easily scalable and far faster than manual testing.
HIL, on the other hand, is a method of testing and validation related to the pieces of hardware in a vehicle. It more or less simulates models of the final product, to then be thoroughly tested before connecting the real ECU to the test system. HIL test benches emulate actual car engine and vehicle dynamics through real-time execution of mathematical models, using data input from devices like cameras and radars. This is generally done after SIL testing because HIL is more costly and time consuming.
Each product’s function in any vehicle (safety critical, mechanical, aesthetic, etc.)




will require bespoke amounts of safety testing. For example, OEMs producing braking systems may need complex HIL testing, whereas, infotainment or navigation systems may only require SIL testing. But regardless of which function it is, developers are absolutely going to have to make sure they’re keeping up with best practices in software testing, no matter the product.
More to the point, manufacturers will have to enforce more repeatable, consistent ways of doing things. You don’t create safe software if you’re a cowboy coder, and regulations around testing on both hardware and software components of a vehicle have become much more rigorous of late. See for example, the main legislative requirement for automotive safety: ISO 26262: Road vehicles — Functional safety, which applies to mass-produced passenger cars, as well as provides guidance on E/E systems in buses, trucks, trailers and semi-trailers. But equally, there’s ISO 21434, which focuses on cybersecurity in the design and development of automotive software and subsystems.
At the end of the day, software needs to be designed with safety in mind from the beginning. It’s not only extremely difficult, but no longer acceptable in today’s age, to try to build a truly safe system by addressing safety as an afterthought. Ahead of the connected car revolution, manufacturers must tackle safety requirements at the architectural and design stage, not at the end of the product lifecycle. ITS

ABOUT THE AUTHOR:
Patrick Shelly is Qt Group senior director, solutions engineering and design











The tools to identify and reduce unnecessary delays at intersections are here – and traffic signal performance improvement is also eligible for US government funding, points out Rick Schuman of Inrix

Intersections are both a blessing and a curse when it comes to transportation. Without intersections, we wouldn’t be able to navigate between our origin and destination across the network. But intersections are, by design, sources of conflict. Who gets to cross? Which ways? When? How fast? Who has to wait? Which mode(s) get preference? Which mode(s) don’t?


managed and shared.

In this increasingly complex network, transportation engineers and planners are being challenged to optimise a growing number of interrelated and sometimes competing factors – delay, safety, mode shift, transit vulnerable road users, air quality and equity, to name a few.
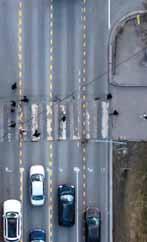
Planning, designing and managing intersections is a key role of transportation professionals, and the various forces at play at transportation network intersections have never been more complex than they are today. Engineers must deal with an ever-expanding array of modes of transport, including walking, scooters, bicycles, transit of all sorts, ride-sharing vehicles (soon to be increasingly autonomous), passenger vehicles, delivery vehicles and heavy goods vehicles. Sidewalks, kerb space and roadways are all in use and must be considered,
Now, we have yet another factor to consider – climate change. Fortunately, like many air quality issues, impacting climate change aligns with efforts to reduce delay at intersections. And increasingly, due to connected vehicles, Big Data, analytics and the like, the tools are now available to identify and reduce unnecessary delay.


Carbon reduction and signals – a new mission with new funding
In February of 2021, the US officially rejoined the Paris Agreement, an international treaty on climate change, committing to reducing greenhouse gases (GHG) by 50% below 2005 levels over the next decade.

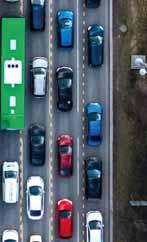
To hit these targets, the country needs to continue to reduce emissions 5% every year through 2030. Transportation accounted for 29% of greenhouse gas emissions in the US in 2021, 81% of which came from vehicle emissions. Thus, any solutions must include transportation GHG reductions.
In November 2021, President Biden signed the Infrastructure Investment and Jobs Act (IIJA), which included several provisions to target GHG reduction such as a new $6.4 billion Carbon Reduction Program (CRP), formed with the simple intent of “reducing transportation emissions”. Differing from many other new IIJA programmes that are competitive grants, CRP is a formula programme. This means that funding is distributed to each and every state department of transportation in the US annually over the five-year life of IIJA based on apportionment formula.
• Carbon Dioxide Equivalent (CO2e): 7.433346 lbs

Between fiscal years 2022 and 2026, each state will receive between $25m (District of Columbia) and $600m (Texas) in total CRP funding, with the average state receiving roughly $125m, for the express purpose of reducing transportation-related carbon emissions.
The funding must be expended within three years of the fiscal year allocated, meaning all funds must be expended by the fall of 2030. Several types of projects are explicitly eligible for CRP funding, and while one suspects much of the funding will be allocated to electrification, there are many other programmes and funding focused on electric vehicles, charging, et cetera. One area eligible – in fact, the first bullet listed under eligible projects – is “Establishing or operating a traffic monitoring, management, and control facility or program.”
Simply put, improving traffic signal performance is eligible for CRP funding, as Congress understood reducing unnecessary delay (delay at intersections is inevitable, but needless delay where no other system user benefits is not) decreases idling, which creates all sorts of byproduct emissions. And with less than 1% of the US vehicle fleet electrified,1 it will be many years - if not decades - before the combustion engines belch their last gasp on US highways.
Quantifying intersection emissions
Inrix has completed several research efforts in recent years to determine the impact of signalised intersection delay on emissions, and the potential benefits of reducing delay. Inrix has created a Green Signals Calculator to allow signal system operators and planners to calculate the benefits of improving signal performance to instantly see what kinds of green savings they can expect.
The FHWA Congestion Mitigation and Air Quality Improvement (CMAQ) Program released an Emissions Calculator Toolkit for use by agencies to estimate air quality
Like many air quality
impacting climate change aligns with efforts to reduce delay at intersections “ “
benefits. As part of that toolkit, an intersection improvements module was created that uses the emissions rates from national level runs of the EPA Motor Vehicle Emission Simulator (Moves). Leveraging the intersections module within the CMAQ toolkit, the Green Signals Calculator,2 estimates the amount of fuel, CO2 equivalents, and other emissions produced at signalized intersections due to idling3
In total, a collective hour of vehicle idling generates 0.37 gallons of fuel burned, which in turn generates the following emissions:
• Carbon Monoxide (CO): 0.01366 lbs
• Nitrogen Oxide (NOx): 0.00554 lbs
• Volatile Organic Compounds (VOC): 0.003426 lbs
• Particulate Matter <2.5 μm (PM2.5): 0.000272 lbs
• Particulate Matter <10 μm (PM10): 0.000249 lbs
Early this year, we also published the Inrix US Signals Scorecard 2022 Annual Summary,4 which for the first time provides network-wide estimates for intersection volumes and signal performance, by assessing the individual performance of more than 242,000 intersections over several weeks in different months and seasons. This is made possible through Inrix Signal Analytics, which summarises the movements of over 10 million connected vehicles as they interact with known signalised intersections.
Key findings related to emissions include:
• Average signalised intersection daily volume: ~23,300 vehicles
• Average delay/vehicle each crossing: 18.1 seconds
• Total daily delay, average signal: 117.4 hours
According to our findings, the average signal generates 117.4 hours of idling daily. If average delay is reduced by 1 second, total delay/idling would be reduced by 6.49 hours daily. Using a conservative assumption of 300,000 total traffic signals in the US, the annual environmental toll of signal delay for both the average signal, and nationwide, is shown in the table below.
Every hour of delay reduced has direct impacts on emissions, not next year or a decade in the future, but today. The good news is that tools are now available for signal managers to cost-effectively monitor any or all signalised intersections so they can proactively spot temporary or permanent issues creating unnecessary delay.
Connected vehicles, Big Data analytics and years of foundational research, including the Pooled Fund Study on Signal Performance Measures, 5 now enable solutions, including Inrix Signal Analytics, that sample and summarise vehicle movements and interactions with traffic signals. Agencies in more than 20 states are now using these tools in the main to spot and reduce unnecessary delay. There are multiple ways these tools are making a difference:
- Identifying broken or malfunctioning equipment, such as detectors
- Corridor progression not occurring as planned
- Signals and timeframes where current day/time signal plans don’t match actual demand
- Imbalanced performance of opposing movements, indicating opportunity for reallocating green times
- Intersections with design issues, such as persistent turn-lane spillbacks
- Determining signals with variable and volatile demand that could be candidates for adaptive signal control
As part of the 2022 Annual Performance Report of its Mobility Management Center (MMC),6 the City of Austin and Kimley-Horn documented the impact of their ongoing, proactive use of Big Data to monitor the city’s 1,100 traffic signals. Weekly summaries to spot increases in stops and delays at signals trigger staff investigation to remedy issues, usually before even noticed by the public.
The MMC identified 120 distinct issues in 2022 - many of these being broken equipment or changes in traffic patterns that resulted in unnecessary delay. The MMC then adjusted signal timing to improve the “target” movements that were struggling the most and tracked the improvement using the same tools. On average, the MMC improved the target movement delay by 35% and

References
2 https://inrix.com/green-calculator/
Transportation accounted for 29% of greenhouse gas emissions in the US in 2021, 81% of which came from vehicle emissions














Intersections are, by design, sources of conflict “ “
improved the overall intersection by 23%.
MMC staff estimated that proactive detection and improvements yielded delay reductions 30 days sooner on average than reactive approaches that typically rely on public complaints. The sum of all these changes impacted 14 million trips and saved Austin drivers more than 24,000 hours of collective delay in 2022. These improvements reduced the signal systems carbon footprint by nearly 90 tons of CO2 equivalents in 2022, tied purely to quicker identification and resolution of these issues.
Transportation professionals do not just manage vehicle movements, they rather aim to optimise the performance of the network to support all users, encourage a thriving


community and reduce negative impacts as much as possible. Reducing vehicle delay is not always the top priority.
That said, there are no societal losers in reducing unnecessary delays. In both the short- and long-term, vehicle operators benefit - but so do other system users with cleaner air and safer streets (and less frustration). ITS

1 https://www.jdpower.com/cars/shopping-guides/what-percent-of-us-car-sales-are-electric#:~:text=Electric%20vehicles%20account%20for%20less,as%20the%20government%20is%20concerned.
3 The methodology underpinning the Green Signals Calculator is here: https://inrix.com/signals-scorecard/?section=methodology#methodology-section-2
4 https://inrix.com/signals-scorecard/
5 https://ops.fhwa.dot.gov/arterial_mgmt/pdfs/EDC-4-Factsheet_ATSPMs.pdf
6 https://www.austintexas.gov/sites/default/files/files/ATD%20PIO/Austin%20MMC%202022%20Annual%20Report_DIGITAL.pdf





salescongress@mail.ertico.com


There’s never been more information available to us via online platforms, rolling TV news and social media channels. In this environment, does the old-fashioned book still have something to offer? We asked a few transportation leaders what they were reading…
Chris Tomlinson, MD, Deloitte Consulting
I'm just about to start reading Autonorama: The Illusory Promise of High-Tech Driving by Peter Norton from the University of Virginia. Peter is one of my favourite speakers on transportation and the history of transportation. I'm interested to read his take on the future of autonomous mobility and its impact on other mobility choices. I think it’s important to learn from our past and even more important to take into consideration multiple viewpoints on topics: he is usually good at hitting on both. One of my favourite transportation books is The Power Broker by Robert Caro. It is the story of Robert Moses whose transportation and political policies and actions literally and figuratively reshaped New York. The book won the
Pulitzer Prize (and may be one of the only transportation-related books that can claim that accolade). To be clear, I'm a fan of the book and not necessarily Robert Moses' actions. But it is a fascinating story, albeit a very long (over 1,100 pages!) read.
Crissy Ditmore, head of strategy & policy, Optibus
I’m reading a new book by Veronica O. Davis, Inclusive Transportation Nspiregreen, the LLC she co-founded, is one of the first and longest-running to develop programmes for DC’s Vision Zero campaign. This is an important read to both repairing past harm in our built environment and to understand how to avoid similar decisions in current and future projects.
Fred Kalt, MD, Yunex Traffic Asia-Pacific
ITS International is my main reading for our industry. Good layout, interesting technical, business and policy topics and always there when it comes to innovation.
Bonnie Crawford, general manager, Umo Mobility, Cubic Corporation I love to travel so right now I’m reading Around the World in 80 Trains by Monisha Rajesh. So many of the greatest cities in the world have awesome and accessible travel by train (often high-speed rail) which I’m envious of as a West Coaster where we could really benefit from it. I’m also heading to the UK to celebrate my 25th wedding anniversary and I’m researching amazing scenic train journeys we can take. The book




































I’d recommend is Marty Cagan’s Inspired It’s about creating tech products people love. It’s super-relevant to the challenge I believe many agencies are facing. How do you ensure your riders love the tools and products you’re giving them so it’s easier for them to ride - not harder?
Joost Vantomme, CEO, ErticoITS Europe & vice president, The MaaS Alliance
I strongly recommend The World is Round by Jo Caudron. It gives a nice view on new challenges in mobility and urbanisation. Also this is an interesting one and opens your eyes - The Four: The Hidden DNA of Amazon, Apple, Facebook and Google by Scott Galloway.
Ferzan Ahmed, executive director, Ohio Turnpike & Infrastructure Commission
I love sagas, especially the ones that are around someone going off and starting something new. Charting uncharted territory, making mistakes, going in the wrong direction, making peace... My favourite author is Wilbur Smith. I have read most of his books twice. I read fiction, life stories, as I have found them to be the best teachers when it comes to leadership, management and compromise - I find them better than text books on these subjects. The lessons are the same, but in the words of a master, the message is more interesting and vivid. ITS engineering is different from standard civil engineering. I find a lot of parallels between solving a traffic/safety problem using ITS and a novel: the destination is often unknown.
Susan Harris, CEO, ITS Australia
I have some interesting reading on my desk at the moment – a draft report Accessibility Guidelines for LZEV Charging Infrastructure, looking to apply inclusive design principles to support accessibility by the widest possible range of drivers. I have been re-reading the findings from the Cooperative and Highly Automated Driving Safety study, undertaken by CarrsQ
in Queensland, exploring driver behaviour in a highly-automated vehicle. This highlighted the general positive experience from participants in the AVs and interesting data on the range of times for drivers to take back control when prompted. I have also been having some fun with ChatGPT to get a glimpse of what future transport might be – I am told the future is bright with lots of great technology to solve all our problems!
Peter Koonce, international board of directors, ITE
As well as Veronica O. Davis' Inclusive Transportation, the other books on my reading list are: Roadways for People: Rethinking Transportation Planning and Engineering by Lynn Peterson and Street Smart: The Rise of Cities and the Fall of Cars by Samuel I. Schwartz. On the ITS side, I am considering reading Smart Cities: Big Data, Civic Hackers, and theQuest for a New Utopia by Anthony M. Townsend, but I am guessing it didn't hold up that well.
Rosa Rountree, national operations director, Atkins
Professional subscriptions: ITS International, staying current with the latest trends and innovations in intelligent transportation systems; Customer Think, exploring insightful articles on customer-centric strategies and experiences; Tech Target News, keeping tabs on the tech industry's latest developments and breakthroughs; TollRoad News, deepening my understanding of the tolling industry and its evolving landscape; Tech Target daily coverage, getting my daily dose of tech news and industry analyses; Nice CXone, discovering cutting-edge solutions and best practices for customer experience excellence; IBTTA Smart Brief, staying informed with concise updates on the tolling and transportation sector; ICMI Contact Center Insider, gaining valuable insights into contact centre management and customer service; Surface Transportation Innovation, exploring advancements and innovations in surface transportation; and Gallup at Work, learning about effective workplace strategies and leadership insights.
For pleasure reading: Think Again by Adam Grant. Delving into this captivating read on challenging conventional thinking and embracing new perspectives. I owe a special thanks to Wayne Reed for introducing me to it during an enriching IBTTA Book Club review discussion. It's always rewarding to engage in meaningful discussions that broaden our horizons.
Jim Misener, Qualcomm global V2X ecosystem lead
I am reading Sven Beiker's The Mobility Diaries. One of my past favourites has been Larry Burns' Autonomy: The Quest to Build the Driverless Car - And How it Will Reshape our World. Another of my past favourites is Jason Barlow's Bond Cars: The Definitive History. And of course there's Millimeter Wave Technology in Wireless PAN, LAN, MAN, wherein I co-authored a chapter in 2008. It's a go-to when trying to nod off to sleep.
Pat Jones, executive director & CEO, IBTTA
I have two books in progress right now which I’m reading on Kindle. One is a new history of World War II called Stalin’s War by Sean McMeekin. As I’m sure you know, there are many transportation-related challenges involved in conducting world war. I’m also reading In Cold Blood by Truman Capote. It’s not really a transportation yarn but interesting nonetheless. I just started listening to the Audible version of An Empire of Wealth: The Epic History of American Economic Power by John Steele Gordon - on the recommendation of Jannine Miller, executive director of the State Road & Tollway Authority in Atlanta, Georgia, who was a recent Café IBTTA guest. As far as books in the transportation genre, I highly recommend Peter Norton’s Autonorama. This book is important reading for anyone who is concerned about the cost, accessibility, safety, and climate impacts of our reliance on the automobile over all other forms of transportation, including active (walking, cycling) and public transportation, including buses, trains, etc. ITS



























Thinking around road user charging, distance-based payments, and even mileage rationing is everwidening with new concepts and suggestions being aired and brought forward every other week. Yet, as Jorgen Petersen of Systra explains, there are already many solutions in place throughout the world which promote modal shift, reduce traffic and improve air quality…
So why discuss alternative ways of road user charging (RUC)? Is it to decarbonise? Is it to try to use the current infrastructure more efficiently? Is it to be more ecologically aware? To promote behavioural change? To provide a safer infrastructure to manage the strategic road network (SRN) and the major road network (MRN)? Is it simply to generate revenue? Perhaps we want to be fairer and more equitable, particularly as more battery-powered electric vehicles (BEVs) are using our roads that don’t currently pay road tax or fuel duty? To me, it must be a combination of all of the above.

The government thinks the public are against such schemes. But when asked, public perception is that change is necessary, and that the government is being too slow to implement some of these measures for political reasons.
This article aims to address three core questions:

been steadily increasing. There is now an understanding, a realisation, and growing acceptance that it would be virtually impossible to build sufficient infrastructure to continue to meet future demand. This requires a deep dive into the perceptions and requirements placed on our road network and how their use can be better managed.
For decades, fuel duty and vehicle licence duty have been the two main mechanisms to charge for car use and ownership respectively. Why change? Surely the current vehicle taxes and fuel duty are sufficient, equitable and fair? Well, not really. After scouring many official and government reports I was able to deduce that around 13% of vehicles account for about 54% of all vehicle miles travelled.

1. Are the RUC schemes that are being promoted equitable and fair?
2. Why should RUC replace the current fuel and road tax duty?
3. Does the technology exist to provide a fairer and more equitable approach to charging for road use?
With the exception of the pandemic years, traffic and congestion on our road network has continued to rise year-on-year since the end of World War II. The cost of road infrastructure and its maintenance has also


This figure may not be absolutely accurate, but it does indicate that a small proportion of us account for the greatest amount of wear and tear on our nation’s roads. We must also consider that zero-emission vehicles currently do not pay vehicle tax nor fuel duty and weigh on average about 30% more than their internal combustion engine siblings.
now believed to be equally as damaging to our environment. In parallel, more efficient engines have meant less duty paid for more vehicle miles travelled, leaving successive chancellors of the exchequer out of pocket.
If the current vehicle tax and fuel duty system isn’t fair and equitable, what is? The main contenders are:
Road tolls are not new and have been in place in the UK since the 17th century, where parishes set up levies on road users to pay for road and bridge administration and maintenance. Over the years this has developed into electronic road tolling (ERT) systems requiring electronic payments, where a vehicle is no longer required to stop.

For EVs, we need to consider the carbon required to generate the electricity to power them, and the additional tyre and brake particulates that heavier EVs emit, which are



While this could be deemed equitable and fair, depending on your perspective, it doesn’t take emissions into account. It can also lead to additional vehicle miles travelled when drivers take more circuitous routes to avoid the toll charge. It also only provides funding for that specific piece of road, not necessarily the rest of the road network. These systems are common around the world, but do require gantries, cameras, radio frequency identification readers (RFID) and ANPR software to collect vehicle and driver information to charge the driver from a pre-existing account. All of which are expensive to implement, manage and maintain.





While electronic road tolling systems can be distance-based, and charge a variable price based on where one gets on and off the road network, they still only charge for a specific segment of a road, and in some cases can be avoided by those electing to take a more circuitous route. In New Zealand, for example, drivers are charged based on the vehicle they are driving for every 1,000km travelled, verified at the time of their annual MOT (or equivalent).
Even trailers incur a charge depending on the number of axles and maximum permitted weight. The cost for your 1,000km is also heavily dependent on where you live and your reliance upon a car. For example, in London with its fully-integrated public transport network and with little reason to own a car, should a person be expected to pay the same as someone living in rural Scotland, where the private car is the only option to travel to work, get groceries, take the children to school or even visit the not-so-local GP? That said, this does seem at first to be a fairer and equitable approach which is easy to understand and implement.
The first congestion charging scheme was implemented in Singapore in 1994, then Durham, UK, in 2002, closely followed by the far greater and much more involved London Congestion Charging Scheme which went live in February 2003. Since then, we have introduced workplace parking levies (WPL), clean air zones and ultra clean air zones, all of which use the same basic technologies to reduce traffic along a specific corridor or region.
The most evolved congestion charging scheme is in Singapore, where charges are variable - based on the time of day, levels of congestion and vehicle type. Yet I would ask: is it really fair? For example, to charge one person the same amount to drive one mile into London as someone else who enters in the morning, drives all day, clocks-up 172 miles and then departs at night? Probably not.
At this point we must clarify the distinction between localised threshold payment systems - such as localised congestion charging, low-emission zone (LEZ), ultra-low emission zone (ULEZ), workplace parking levy (WPL) - and the general use of the SRN, the MRN and the local road network.
While threshold payment solutions have been in existence for decades, the threshold is based around the introduction of a cordon of cameras to identify when a vehicle crosses a threshold. As the threshold size increases, more and more vehicles could potentially travel within the zone without going through a camera check and therefore without being captured.
This is overcome by introducing roving camera platforms within the zone to capture vehicles that haven’t crossed any part of the camera cordon, but which still need to pay for the privilege of driving within the zone. As the region increases in size, it either requires additional camera-cordoned zones or an exponential increase in roving camera platforms, both of which are expensive, and neither of which provide long-term viability. So, the challenge is how to develop a system that can be expanded to incorporate a country-wide deployment which is equitable, fair, maintainable and affordable.
What should a national road user charging scheme address? The best example is in New Zealand, it is simple to implement, doesn’t necessarily need a great deal of technology and takes into account the area where a
is, for some, perceived as an invasion of privacy - particularly if the date and time are captured. But in reality, is this so different from how open-loop payments are undertaken on public transport? Doesn’t Transport for London (TfL) get the same information about a customer’s movements when they use the tap-on tap-off system in London? TfL already has the ability to identify that a person entered the gate at a particular station and exited at another. The difference is that this information would be specific to a vehicle, person or account. However, it isn’t dissimilar to the data we regularly provide to insurance companies - or even provide each time we use mapping apps.
In my view the best approach would be to start simple, through implementing something similar to the New Zealand charging model. This would be based on a yearly declaration of mileage or odometer check and the car owner’s access to alternative
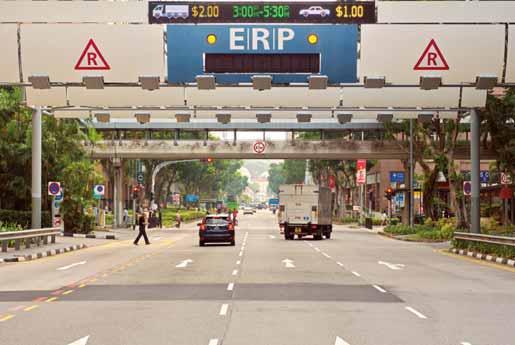
modal alternatives for the journey, the roads that are being used by the driver, the time of day of the trip, or air quality.
If we want to be more environmentally conscious and equitable, we need to provide a mechanism for variable-priced models that can take account of availability of modal alternatives, traffic requirements, congestion, air quality, and an easily understood pricing model which can gradually start to change travel habits and trends of non-urgent vehicle use. But, variable pricing does become exponentially more complex, and more difficult to understand.
The questions that remain are, does the technology exist to implement a fair and equitable solution in the UK, and what would such a system look like if we were to start to plan for it?
Through vehicle-tracking technology, which is simple to implement, identifying which roads a particular vehicle was using
equitability and environmental credentials of the scheme as public perception improves. Variable priced options could then apply to the SRN, MRN and even when entering or leaving a large city such as London, Birmingham and Manchester. At the same time, a change management campaign can be undertaken to help explain why it is necessary.
The charging model could later be expanded to accommodate variable-priced options, that could be integrated with air quality monitors, reduced speeds - and at the same time charging more based on poor air quality. This would need to be integrated with existing ANPR technologies or ERT transponderbased technologies to indicate variable speed thresholds and which vehicles have entered into those zones.
Tolls have been in existence since the 17th century, when travellers were required to pay to enter London, for example
Tracking the number of miles undertaken and the routes used would require some form of road-use tracing. An option could be a variable-priced approach, tracked via a GPS-enabled in-vehicle app which is already used by the driver. The app would carefully and accurately log the number of miles driven on the SRN, MRN or local threshold charging model, and be charged for actual vehicle miles travelled. If drivers don’t wish to sign up to this GPS approach, an alternative could be for drivers to pay a fixed fee per day, set according to vehicle type.
There are options available, some fairer and more equitable than others.

Transport for London has lots of information about a customer’s movements when they use the tap-on tap-off system

Variable-priced solutions will require more infrastructure and the ability to identify where the vehicle is travelling to and from. My recommendation is that the current fuel duty and tax system is neither fair nor equitable and does not provide effective incentives for ecological and environmentally sustainable travel, even after the conventional road-fund licence is applied to BEVs in 2025.
To promote the wellbeing of our planet it is essential that we start simple and then implement variable-priced options as and when it is sensible to do so. This requires very little additional infrastructure and builds upon a tried and tested approach.


Does the technology exist to implement a fair and equitable solution? “ “
Are we being overly cautious in our approach to trying to reduce vehicle miles travelled with an intent of reducing traffic and congestion while improving air quality? Get in touch and offer your perspective… ITS

ABOUT THE AUTHOR:
Jorgen Petersen is Systra’s director of new technology. jpedersen@systra.com



– 19 APR 2024


THE WORLD’S LEADING PLATFORM FOR MOBILITY SOLUTIONS & KNOWLEDGE SHARING
ACCELERATING TOWARDS SMART, SAFE AND SUSTAINABLE MOBILITY FOR ALL















INTERTRAFFIC EVENTS & SUMMITS
SHANGHAI / CN 24 - 26 JUL 2023
MEXICO CITY / MX 14 - 16 NOV 2023
AMSTERDAM / NL 16 - 19 APR 2024
24/7 NEWS, VIEWS & INSIGHTS
INTERTRAFFIC WORLD MAGAZINE INTERTRAFFIC NEWSLETTER

Q-Free has released a new processor for use in advanced transportation controllers (ATCs). Velocity is an AI-enabled ARM processor which, Q-Free says, is "designed to shift the industry paradigm away from
exclusively on a modern ARM-based architecture and, thanks to the neuralchanger,” said Patrick Marnell, Q-Free’s director of product management.

single-purpose device. It will become the smartphone of the municipal environment providing an edge-computing node at every signalised intersection.” The multi-core processors provide more power compared to the typical PowerPC found in most ATC controllers, Q-Free says, along with expanded storage and memory on the boards, enabling more complex computing and data uses.





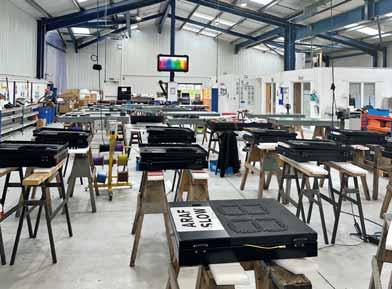
Swarco has signed an agreement with the Welsh city of Swansea to design and install signage to support the country’s new 32km/h (20mph) urban speed limit. The agreement will see Swarco install 120 bespoke vehicle-activated signs (VAS), which feature Swarco’s EPIX lens technology system to ensure the lowest power consumption. From September, the default speed limit in Wales will be reduced from 30mph (50km/h) to 20mph. To support the upcoming changes to the speed limit, local authorities in Wales are working to make the necessary alterations to existing highway signage to ensure drivers are aware of the changes. Swarco’s electronic sign units dynamically display the approaching vehicle’s actual speed. These signs will display the vehicle speed in ‘green’ if the vehicle is complying with the new default speed limit and in ‘red’ if not. This new contract is designed to work in co-ordination with an existing service and maintenance contract which was already in place.

Theia’s 4K lenses are designed for use in high-detail imaging tasks
robotics, and video surveillance applications. The 4K lenses come in 4-10mm, 6-10mm and 12-50mm focal ranges, provide 12 megapixel, 300 lp/mm resolution and are IR-corrected from 435 – 940nm to maintain their high-resolution performance in the near IR spectrum. The lenses are offered in manual, DC Auto, or P-iris versions, in CS, C mount and D25 board mount depending on the model. The lenses cover 2/3”, 1/1.7” and 1/2.3” image sensor formats or smaller. Fully-motorised versions are also available, with motorised zoom and focus and combinations with optional

designed to control the P-iris lens versions. To assist in lens selection, Theia offers an image-resolution simulator and lens calculator


Content produced in association with Theia Technologies

stops. The motorised lenses allow for remote set-up and occasional zooming and re-focus. Theia also offers motor control boards


Commsignia has released a lightweight Vehicle to Everything as electric bikes and e-scooters. The OBU Lite is primarily aimed
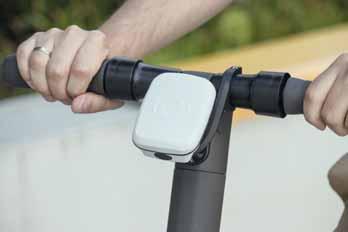
between bicycles and motorised vehicles to prevent the most common crashes.
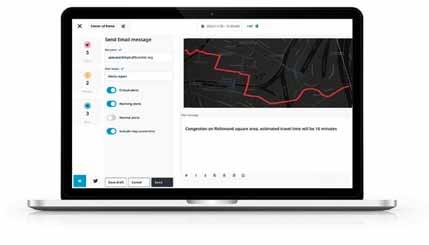

























































We are looking for distributors or licensees worldwide!
Dynamic truck scale with legal verification for checking overloaded vehicles - up to 50 tons - with automatic determination of total mass and axle load during the crossing at a speed of up to 35 km/h. Collected data, vehicle type and license plate can be transmitted in real time into data collection.
We develop individual systems according your requirements and consider legal country specific regulations. up to 35 km/h Passage speed Accuracy








Clearview Intelligence OBC www.clearview-intelligence.com
Cross Zlin p23 www.cross-traffic.com
Cubic p13 http://transportation.cubic.com
Daktronics p31 www.daktronics.com/tmc
Dynaweigh p50 www.dynaweigh.com
Econolite p23 www.econolite.com
ESRI p9 http://go.esri.com/peak-performancewith-esri
IBTTA p27 www.ibtta.org/events
Intercomp p31 www.intercomp.com
Intertraffic p47 www.intertraffic.com
ITS World Congress p41 www.itsworldcongress.com
Jenoptik p19 www.jenoptik.com TagMaster IFC www.citilog.com Tattile p4 www.tattile.com Iteris NA6 www.iteris.com ITS America NA2 www.itsa.org Swarco McCain NA1 http://mccain.swarco.com/tms Synapse NA5 www.synapse-its.com Q-Free NA7 www.q-free.com
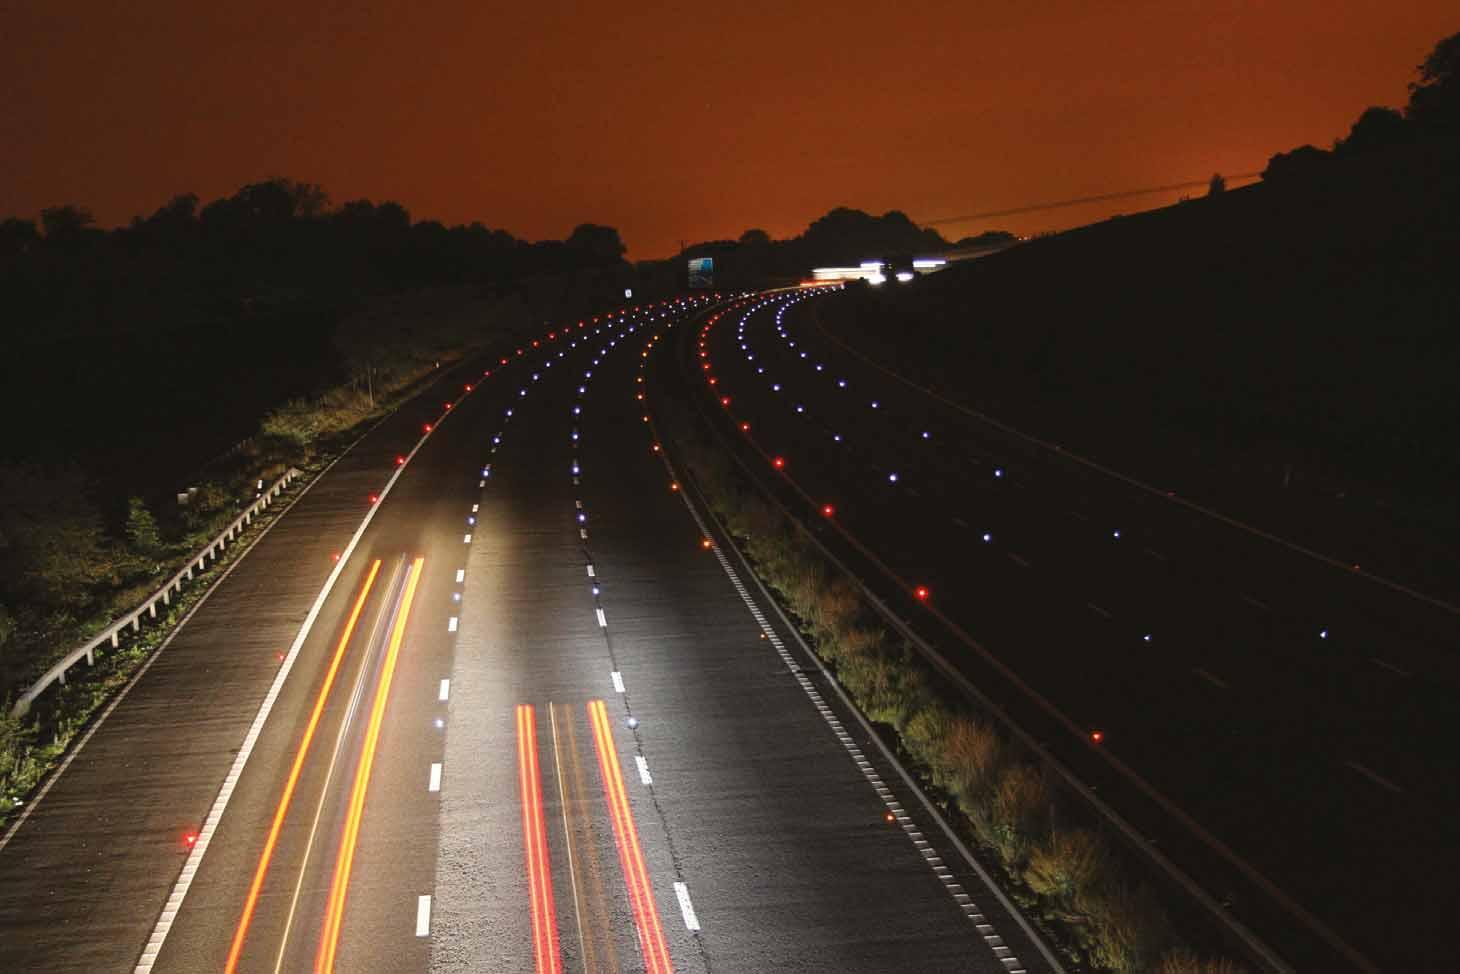




www.clearview-intelligence.com