
Tumut Market Update 2nd Half 2025

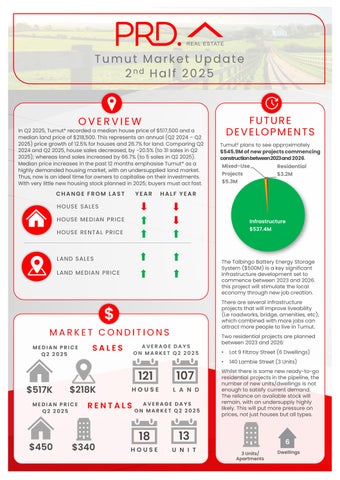
In Q2 2025, Tumut* recorded a median house price of $517,500and a median land price of $218,500.This represents an annual (Q2 2024 – Q2 2025)price growth of 12.5%for houses and 26.7% for land. Comparing Q2 2024and Q2 2025,house sales decreased, by -20.5% (to 31 sales in Q2 2025); whereas land sales increased by 66.7% (to 5sales in Q2 2025).
Median price increases in the past 12 months emphasise Tumut* as a highly demanded housing market, with anundersupplied land market Thus,now is anideal time for owners to capitalise on their investments. With very little new housing stock planned in 2025; buyers must act fast.
CHANGE FROM LAST


Tumut£ plans to see approximately $545.9Mofnewprojectscommencing constructionbetween2023and2026
YEAR HALF YEAR
HOUSE SALES
HOUSE MEDIAN PRICE
HOUSE RENTAL PRICE
LAND SALES
LAND MEDIAN PRICE

MEDIAN PRICE Q2 2025

AVERAGE DAYS ON MARKET Q2 2025
121 $517K $218K
MEDIAN PRICE Q2 2025

The Talbingo Battery Energy Storage System ($500M)is a key significant infrastructure development set to commence between 2023and 2026. this project will stimulate the local economy through new job creation. There are several infrastructure projects that will improve liveability (i.e roadworks, bridge, amenities, etc); which combined with more jobs can attract more people to live in Tumut.
Two residential projects are planned between 2023and 2026:
• Lot 9 Fitzroy Street (6 Dwellings)
• 140Lambie Street (3 Units)
Whilst there is some new ready-to-go residential projects in the pipeline, the number of new units/dwellings is not enough to satisfy current demand. The reliance on available stock will remain, with an undersupply highly likely. This will put more pressure on prices, notjust houses but all types.


AVERAGE VENDOR DISCOUNT*
Average vendor discount reflects the average percentage difference between the first list price and final sold price. A lower percentage difference (closer to 0.0%) suggests that buyers are willing to purchase close to the first asking price of a property.


Average house vendor discounts between Q2 2024and Q2 2025have swung to a premium of 5.9%. This is the first occurrence for Tumut* in the past two years, indicating a clear shift towards sellers. Buyers must now offer higher than the first list price. Average vacant land discount has tightened to a discount of -5.9% in Q2 2025from -8.5% in Q2 2024.With houses being highly demanded and very little new stock coming to market, this may not continue for muchlonger. Thus, buyers should act quickly.
The suburb of Tumut has outperformed the wider Snowy Valleys Local Government Area (LGA) in median house and land prices for the past 5 years. This continued tobe the case in 2025# for houses; however, land prices have tapered to be on par with Snowy Valley LGA.
Most of the homes sold in Tumut* across 2024/25#were in the more affordable price bracket of $350,000to $449,999 (24.0%),with a strong amount (23.8%)sold in the middleprice range of $450,000to $549,999.Vacant land also had most sales (72.1%) in the lower-price range price bracket, of $150,000to $199,999.This suggests that Tumut* is an affordable market for buyers looking topurchase.
MARKET COMPARISON
The market comparison graph provides a comparative trend for median price of houses and land over the past 5 years. The main LGA chosen was based on their proximity to the main suburb analysed, which is Tumut.


Less than$149,999
$150,000to $199,999
$200,000to $249,999
$250,000to $299,999
$300,000 and above
Tumut House Snowy Valleys LGA House Tumut Vacant Land Snowy Valleys LGA Vacant Land
RENTAL GROWTH 2025€
House rental yields in Tumut¥ was 4.0% as of June 2025,on par with the Snowy Valley LGA (4.0%) and above Sydney Metro (2.7%) rental yields. Further, median house rental prices increased by 12.5%in the past 12months toQ2 2025, at $450per week; whilst the number of houses rented declined, by -18.2% (to 18 houses in Q2 2025). This suggests an undersupply in the house rental market, which is beneficial toinvestors looking for an affordable alternative to Sydney Metro.
4+ bedroom houses have provided investors with +8.7% rental growth annually, achieving a median rent of $500per week.
Tumut¥ recorded a vacancy rate of 0.6%in June 2025,well below the Snowy Valley LGA average of 2.0%and Sydney Metro’s 1.6%. Vacancy rates have fluctuated in the past 12 months, but overall showed a declining pattern, which indicates an even tighter rental market. Further, a 0.6%vacancy rate is well below the Real Estate Institution of Australia’s healthy benchmark of 3.0%, indicating quicker occupancy of rental homes in Tumut¥. This suggests a conducive and sustainable investment condition, even with a higher house price in the past 12months.
RENTAL VACANCY RATES 2025


RENTAL YIELD 2025§

Tumut (2720)¥
Tumut (2720)
Snowy Valleys LGA
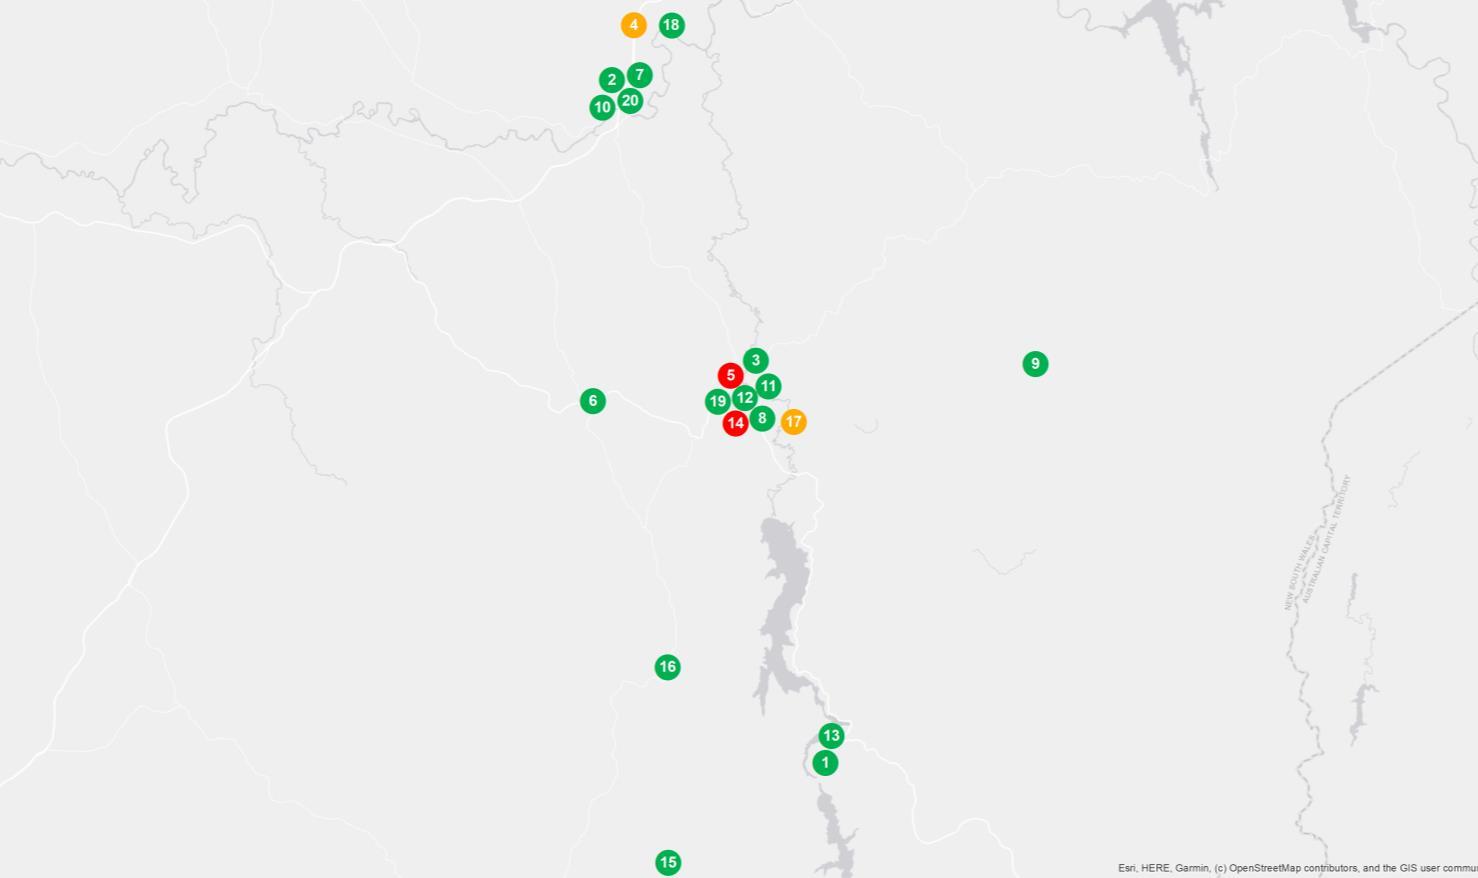
PROJECT DEVELOPMENT MAP 2023-2026 ₳
TUMUT


RESEARCH SERVICES
Our research services span over every suburb, LGA,and state within Australia; captured in a variety of standard and customised products, andinclude:
• Advisory and consultancy
• Market analysis including profiling and trends
• Primary qualitative and quantitative research
• Demographic and target market analysis
• Geographic information mapping
• Project analysis including product and pricing recommendations
• Rental and investment return analysis


OUR KNOWLEDGE
Access to accurate and objective research is the foundation of all good property decisions.
OUR PEOPLE
Our research team is made up of highly qualified researchers who focus solely on propertyanalysis.


REFERENCES
* Tumut sales market data and key indicators encapsulates aggregate property market conditions within the suburbs of Adelong, Batlow, Tumut, Gundagai and Talbingo.
** Estimated values are based on construction value provided by the relevant data authority and does not reflect commercial and/or re-sale value.
# 2024/25encapsulates sales transactions for the 2024 full year (01/01/2024 – 31/12/2024)and 1st half 2025 (01/01/2025 – 30/06/2025).
€ Annual rental growth is a comparison between 1H 2024 (01/01/2024 – 30/06/2024)and 1H 2025 (01/01/2025 – 30/06/2025) house median rent figures.
¥ Tumut rental market data encapsulates aggregate property conditions within the postcode of 2720.
§ Rental yields shown are as reported as of June 2025.
₳ Project development map showcases a sample of upcoming projects only, due to accuracy of addresses provided by the data provider for geocoding purposes.
£ Projects refers to the top developments within the suburb of Adelong, Batlow, Tumut, Gundagai and Talbingo.
µ Estimated value is the value of construction costs provided by relevant data authority, it does not reflect the project’s sale/commercial value.
ψ Commencement date quoted for each project is an approximate only, as provided by the relevant data authority, PRD does not hold any liability to the exact date.
Source: APM Pricefinder, Cordell Connect database, SQM Research, Esri ArcGIS.
Disclaimer: PRD does not give any warranty in relation to the accuracy of the information contained in this report. If you intend to rely upon the information contained herein, you must take note that the information, figures and projections have been provided by various sources and have not been verified by us. We have no belief one way or the other in relation to the accuracy of such information, figures and projections. PRD will not be liable for any loss or damage resulting from any statement, figure, calculation or any other information that you rely upon that is contained in the material.
Prepared by PRD Research. © All medians and volumes are calculated by PRD Research. Use with written permission only. All other responsibilities disclaimed. © Copyright PRD 2025.