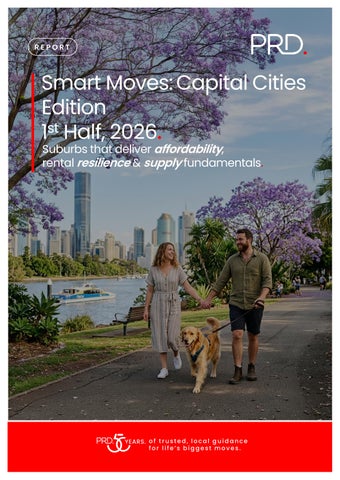

Smart Moves: Capital Cities Edition
1st Half, 2026.
Suburbs that deliver affordability , rental resilience& supplyfundamentals.

of trusted, local guidance for life’s biggest moves.

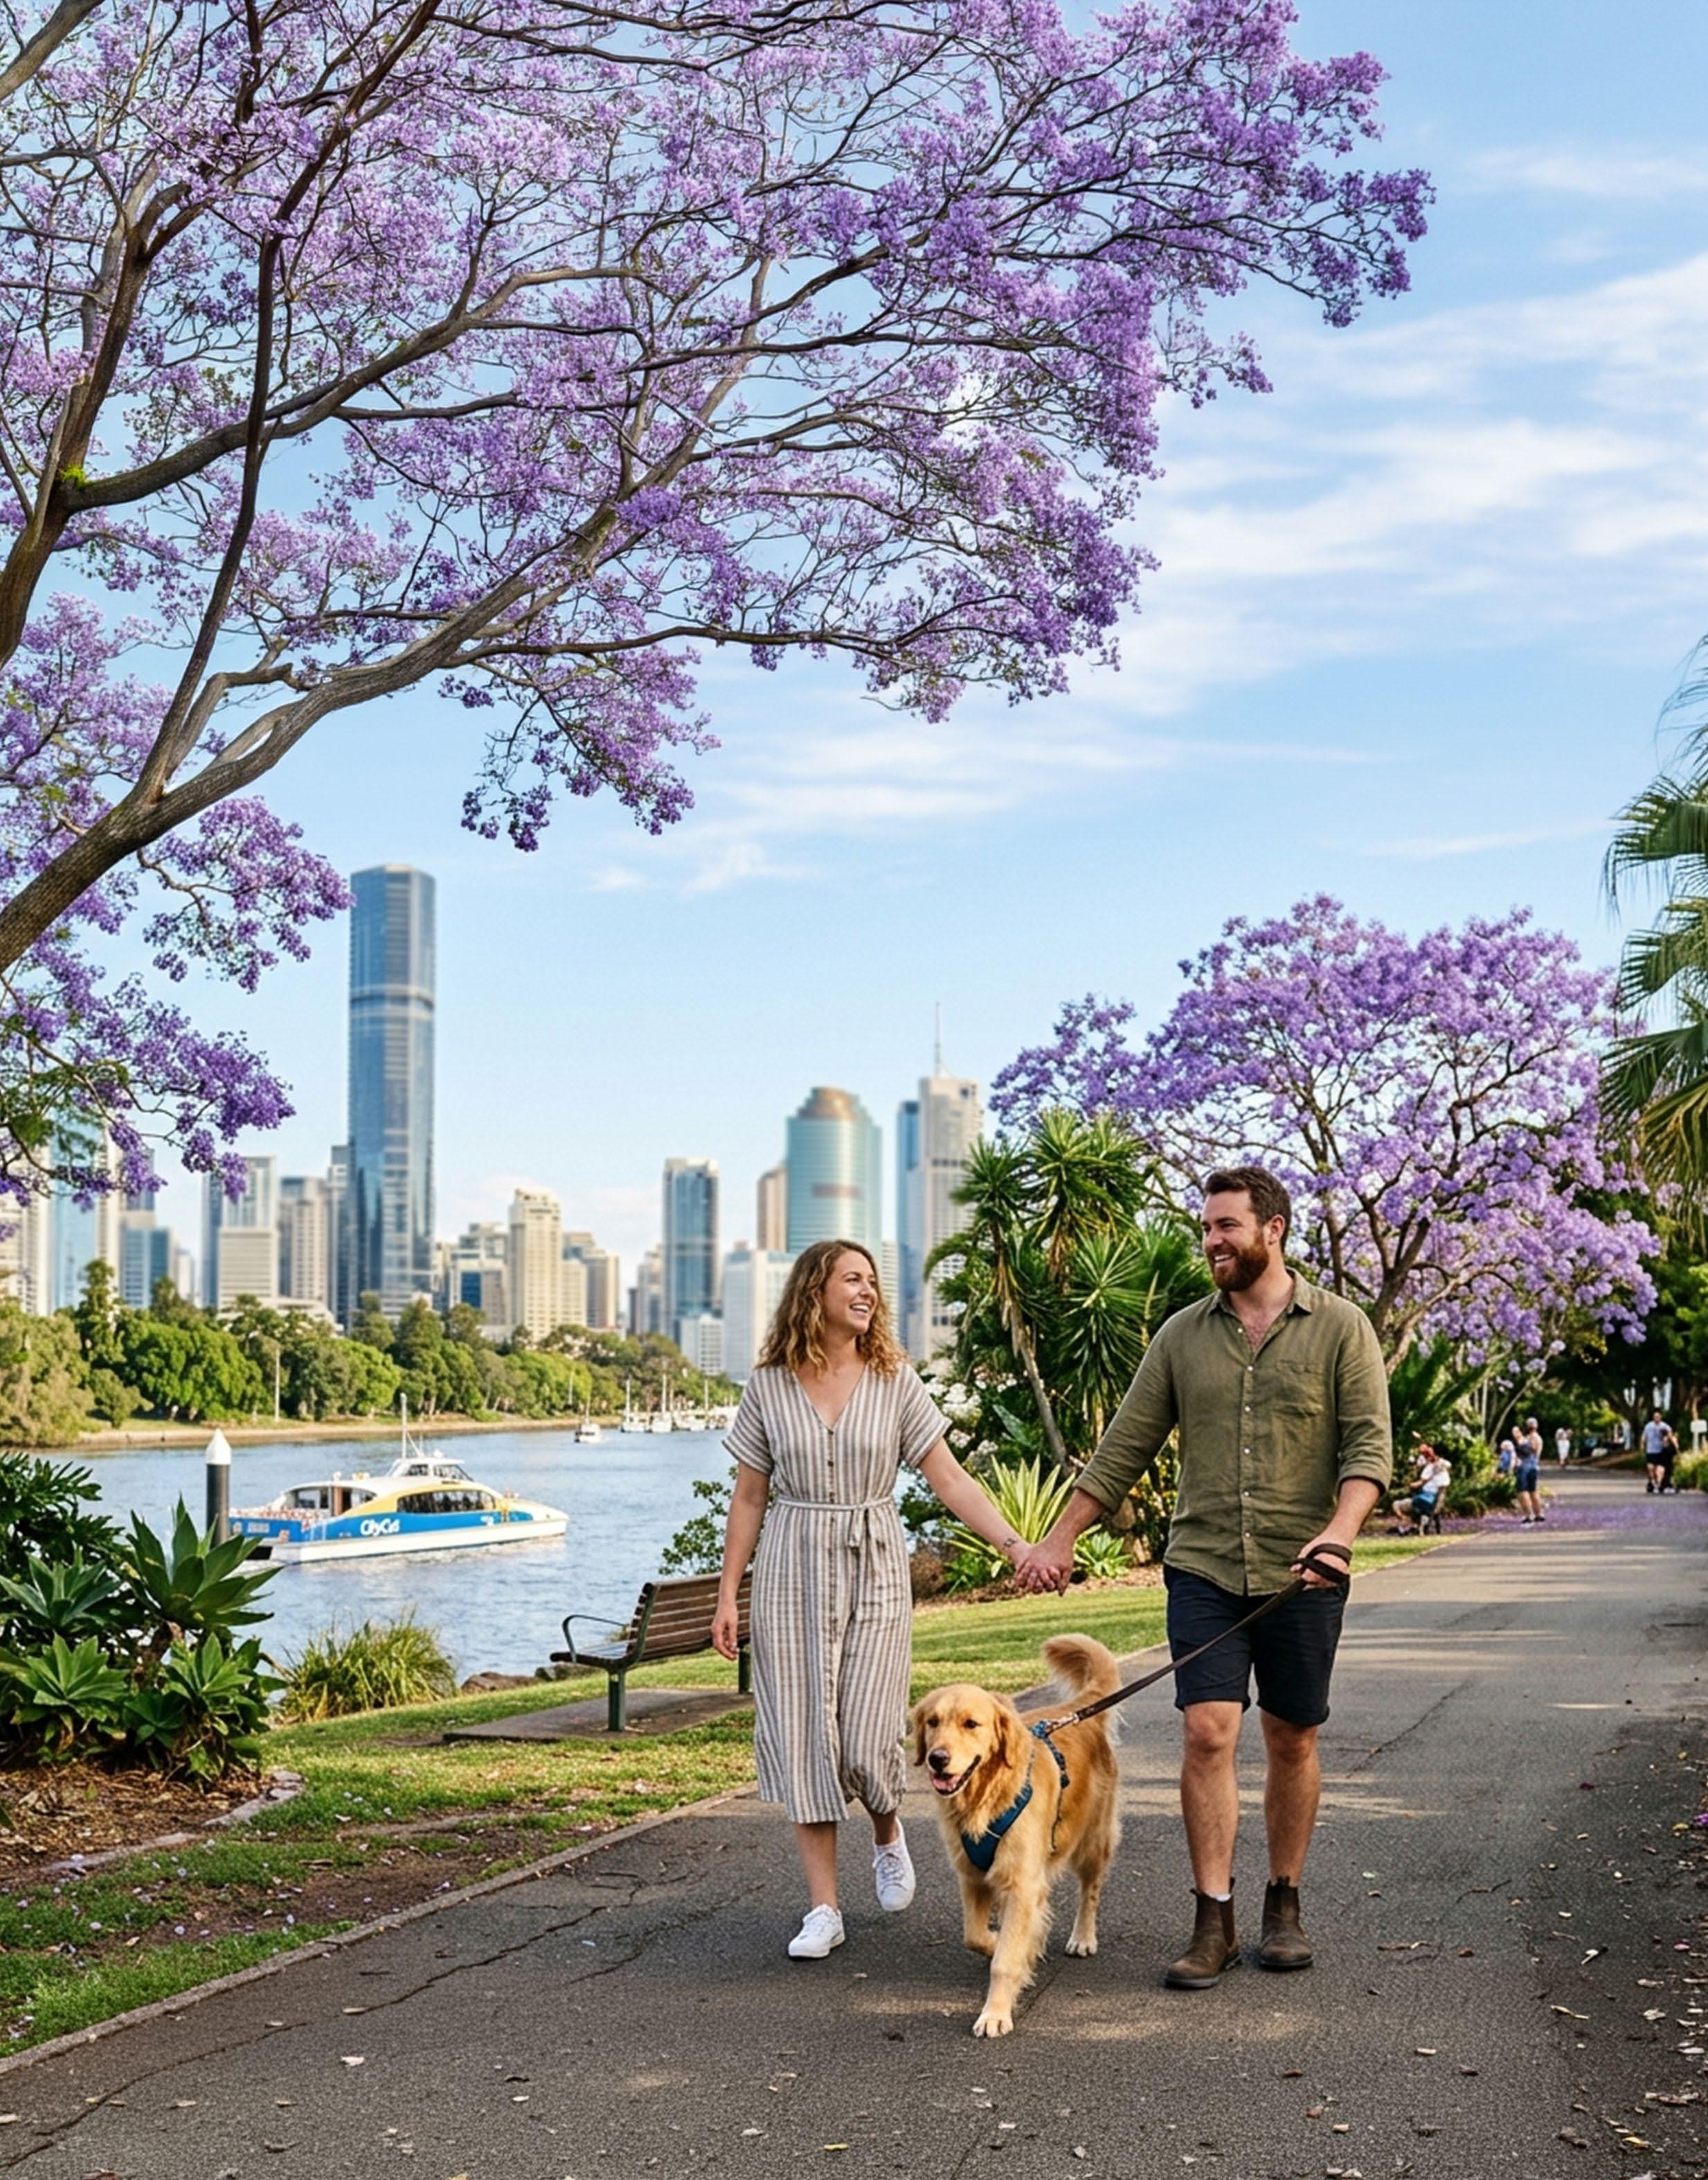
Brisbane.
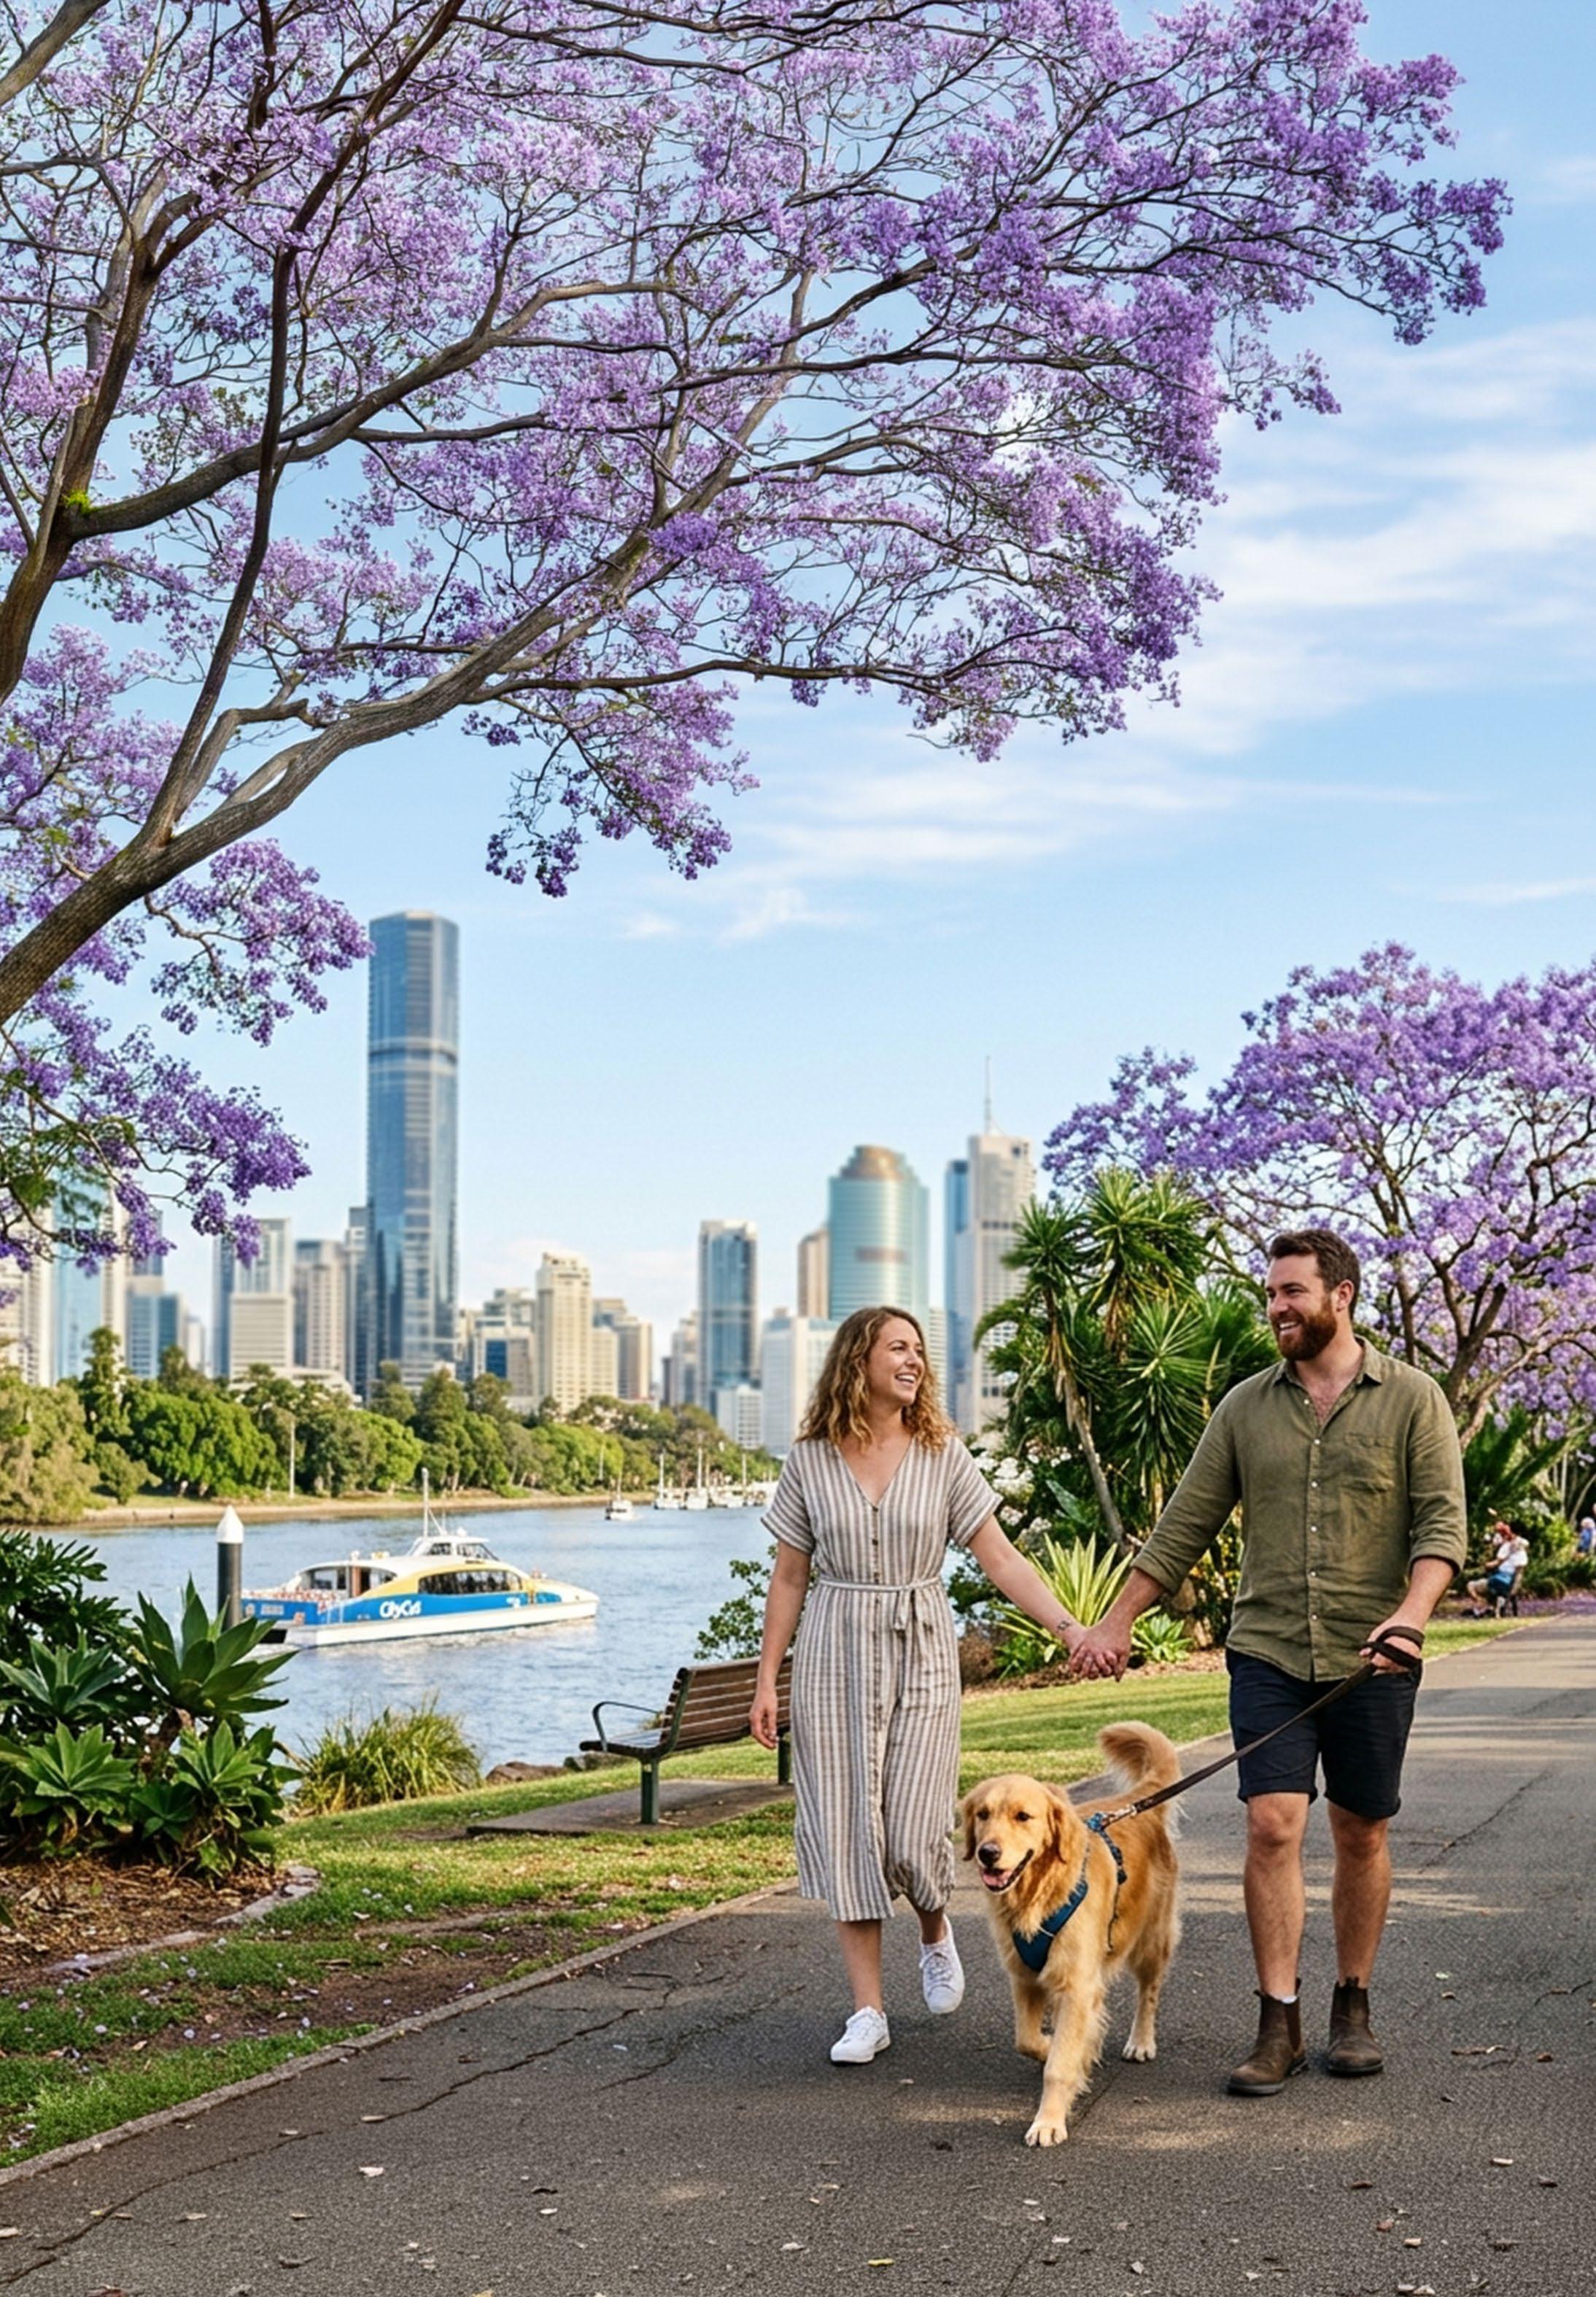

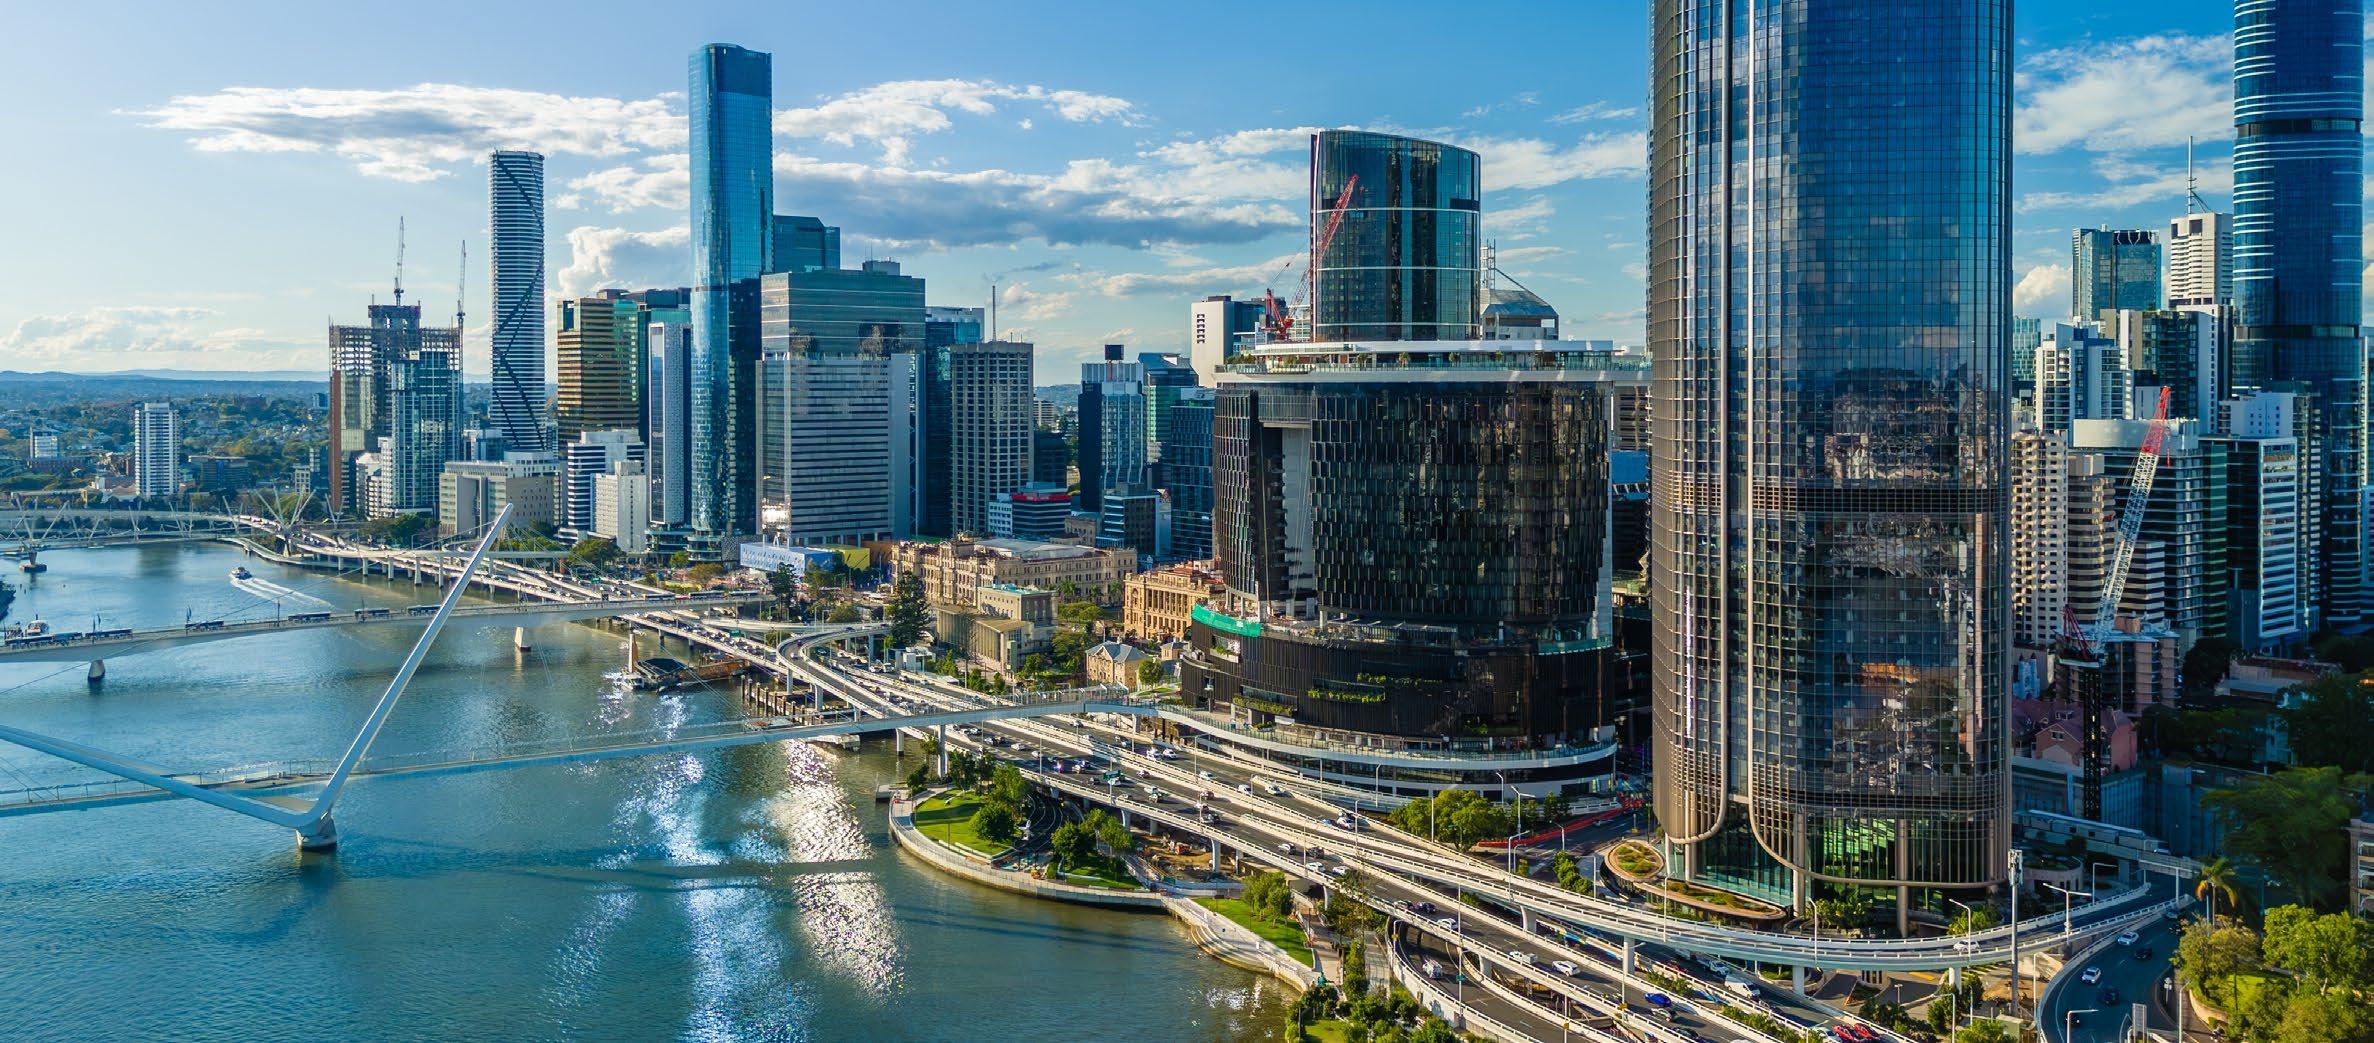
Brisbane’s property market is rapidly evolving, with surging prices, strong buyer demand, and a tightening supply reshaping opportunities across the city
Yet within this competitive landscape, there remain pockets that balance affordability with lifestyle appeal offering buyers and investors a chance to secure value while the market continues to grow and transform.
Who this report is for.
First Home Buyers: Looking for more affordable entry points into Brisbane’s rising property market.
Investors: Seeking suburbs with solid rental yields, low vacancy rates and growth potential.
Upgraders/Owner-Occupiers: Those looking for liveable locations with strong amenities, infrastructure and long-term appeal.
Leveraging PRD’s proprietary research methodology, this report cuts through the noise, delivering clear insights into Brisbane’s fast-moving market and spotlighting suburbs where affordability, lifestyle, and growth potential align, helping you uncover real opportunities with confidence.
Brisbane’s market is surging, with house prices up 14% and units jumping 23% in just a year. Strong demand is driving house sales higher, while limited unit supply pushes prices even faster.
With $22.7B in new developments, but very few new houses, supply is struggling to keep up, making competition fierce and timing critical for buyers and sellers alike.


Brisbane’s property market is increasingly defined by a widening supply gap, with demand for houses far outpacing what’s being built Where just 275 new houses are planned against more than 25,000 annual sales, there’s a clear mismatch between demand and available stock
While development is heavily skewed, with 14,000+ new units and over 16,000 residential lots, intense buyer demand and a tight vacancy rate of 0.8% are keeping competition high and availability low
At the same time, rental yields of around 2.9% for houses and 3.7% for units highlight steady returns despite rising prices. This imbalance is driving sustained price growth, creating urgency for buyers while offering investors and existing owners a compelling opportunity to benefit from ongoing undersupply and a resilient rental market.










Less than $599,999
$600,000 to $699,999
$700,000 to $799,999
$800,000 to $899,999
$900,000 and above
Average Vendor Discount.





Average vendor discounts for houses have swung from a discount to a premium between Q1 2025 and Q1 2026, now at 2.0%. The average vendor discount for units has remained in the premium, but to a higher level of 4.1% in Q1 2026. Q1 2026 marks the highest premiums recorded for both property types.
Market conditions in Brisbane Metro favour sellers, as buyers are increasingly having to offer above the initial listing prices.
Most of the homes sold in Brisbane Metro in 2025/26# were in the most affordable price brackets of less than $999,999 (47.3%) for houses and less than $599,999 (29.7%) for units. Despite a more expensive property market in Q1 2026, this is an encouraging opportunity for first home buyers.
On the other hand, 30.2% of houses were sold at a premium of $1.3M and above and 16.4% of units were sold at $900,000 and above, which will benefit owners in this price point. Overall, there is still an opportunity for all budgets in Brisbane Metro.
$200,000 $400,000 $600,000 $800,000 $1,000,000 $1,200,000 $1,400,000


Rental Growth.
House rental yield in Brisbane Metro was 2.9% as of March 2026, outperforming Sydney Metro (2.8%) but slightly lower than Melbourne Metro (3.1%). This was paired with a 6.6% increase in median house rental price in the past 12 months to Q1 2026, at $725 per week, along with a 4.9% decline in the number of houses rented (to 6,887 rentals in Q1 2026)
A similar trend can be seen in the unit market, reflecting undersupply and high competition across both property types. This creates a favourable environment for investors to re-enter the market, with a lower entry price than Sydney Metro.
3-bedroom houses and 1-bedroom units have provided investors with the highest annual rental growth of +3.8% and +10.6%, to achieve $675 and $520 per week, respectively. Most rental property types have increased in value.
In March 2026, Brisbane Metro recorded a low vacancy rate of 0.8%, below Sydney Metro (1.1%) and Melbourne Metro (1.4%). Despite minor fluctuations in the past 12 months, Brisbane Metro’s vacancy rates have declined, which suggests a tighter rental market
Brisbane is consistently recording vacancy rates significantly below the Real Estate Institute of Australia's healthy benchmark of 3.0%, signalling quicker occupancy of rental homes. This suggests a conducive and sustainable environment for investors, even if the house and unit sale price (and therefore, entry price) has increased in Q1 2026.
Rental
Rental Vacancy Rates 2026.
Roma Street Parkland. SouthBrisbane, QLD.
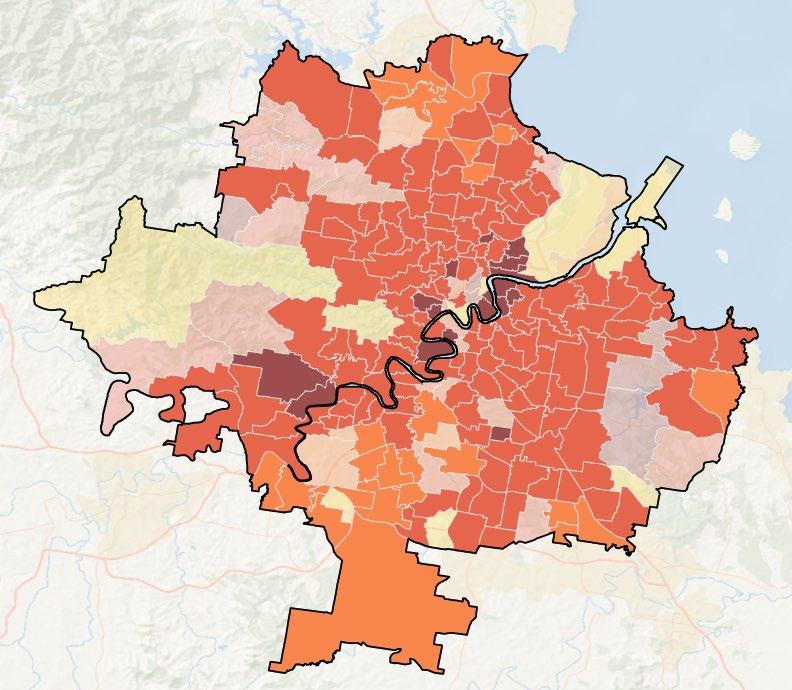
Median House Prices.
20KM FROM THE BRISBANE CBD | 2026*

LEGEND .
Data not available
$0 - $500,000
$500,000 - $800,000
$800,000 - $1,000,000
$1,000,000 - $2,000,000
$2,000,000+
20km from CBD
Translucent colours for <20 sales

Brisbane Smart Move Suburbs Rental Yield .
BRISBANE
Market Cycle Indicators.
Our easy-to-read clock format indicators show where Brisbane’s house and unit markets currently sit in the market cycle, from peak through to recovery. They highlight whether conditions are strengthening or softening, helping buyers and investors understand timing, momentum, and where opportunities may be emerging across the city.
The 4 key market indicators:
Peak.
When prices are at or near their highest point, demand is strong, and growth starts to stabilise.
Downswing.
When the market begins to cool, buyer demand eases, and prices may plateau or decline.
Bottom.
When the market reaches its lowest point, conditions stabilise, and the groundwork is set for the next period of growth
Upswing.
When the market is gaining momentum, buyer confidence is rising, and property prices are beginning to increase.
The hands on the clocks indicate the current position of each property type in the market cycle.
HOUSE
(MARKET GROWTH)

(MARKET COOLING)
Brisbane’s house market has not yet reached it’s peak.
GROWTH)
COOLING)
Brisbane’s unit market also has not yet reached it’s peak with further growth expected and continued demand.

Smart Suburb Moves Near Brisbane for Houses .
Richlands.
Griffin.
Taigum.


Tinchi Tamba Wetlands Reserve BaldHills, Brisbane LGA,QLD. 12 km south of Griffith.
Smart Suburb Moves Near Brisbane for Units
Spring Hill. 4000

Bowen Hills.

Project Development Map 2026*.

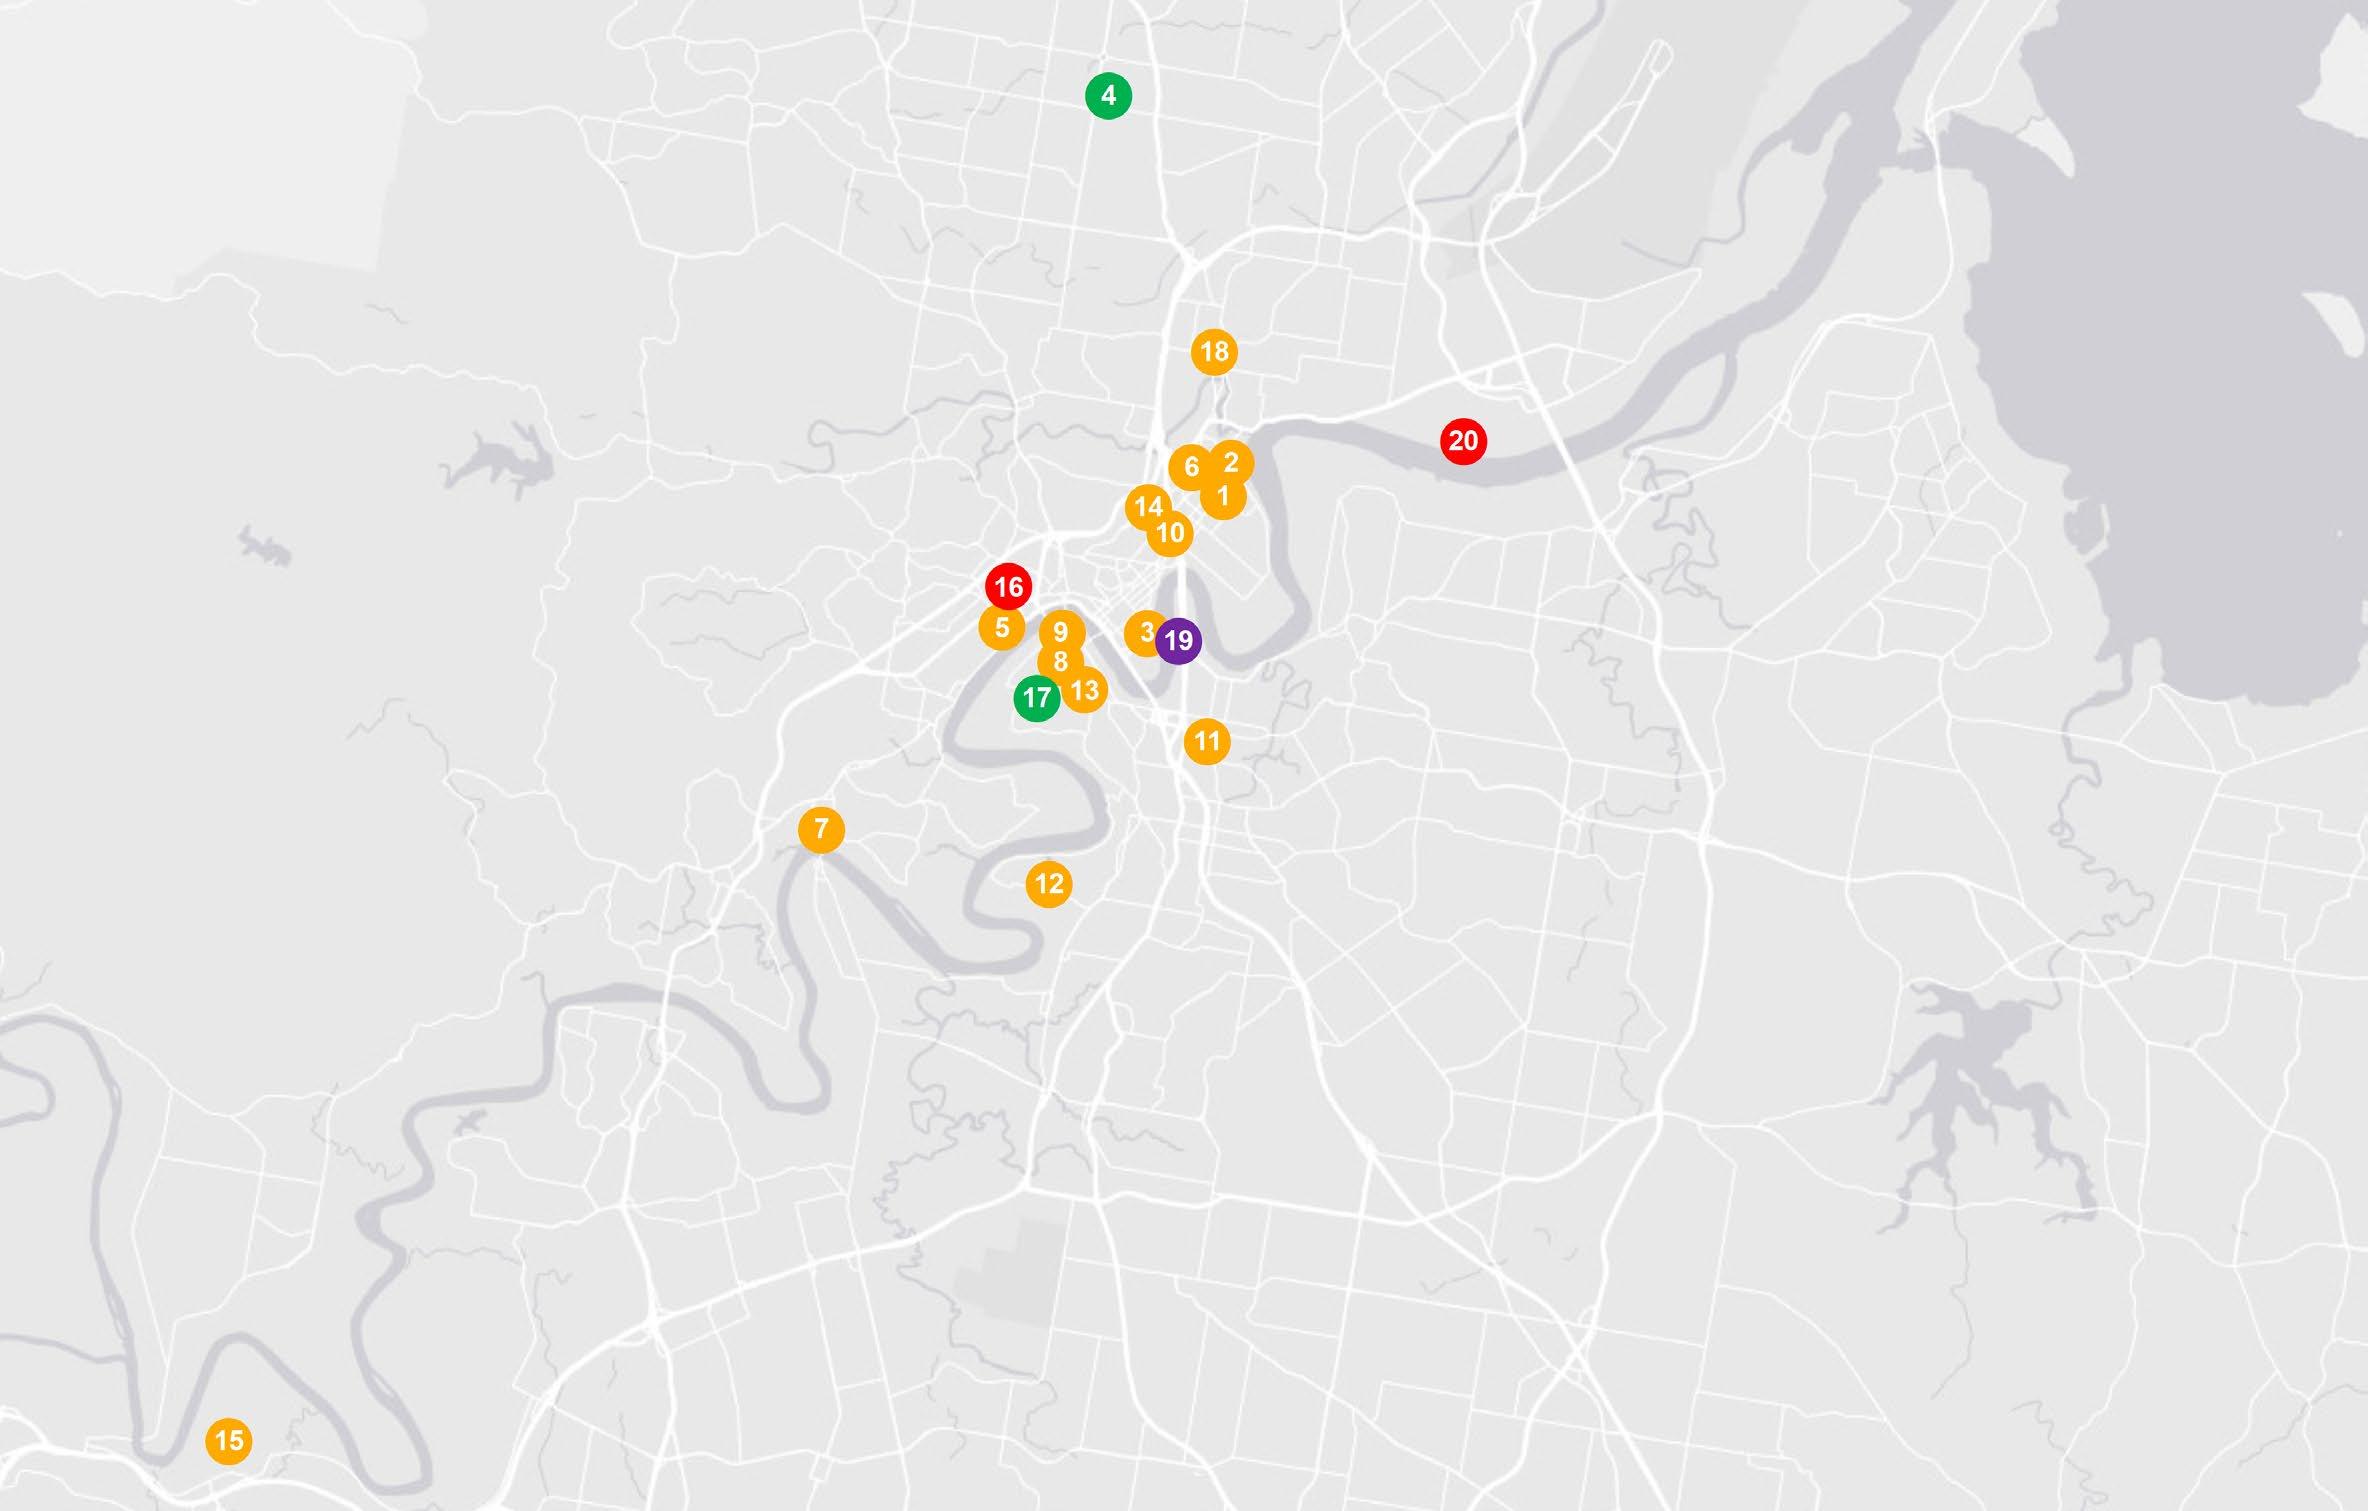








Little Italy Newstead Mixed Use Development Stages 13 (Residential – 1,001 units + Commercial – Office & Retail)
Newstead Green Mixed-Use Development (Residential + Commercial)
204 Alice Street Mixed Use Development (Residential –737 Units + Commercial – Retail & 258 Short Term Accommodation Units)
The Prince Charles Hospital Expansion (State Government)
Kings Row Urban Village (Residential – 1,032 Units + Commercial)
19-27 Campbell Street Mixed Use Development (Residential – 380 Apartments + Commercial)
Indooroopilly Build To Rent Development (Residential –478 Apartments + Commercial)
163, 164-170 & 190 Melbourne
University Brisbane Campus & Student Accommodation Stages 1 & 1A (Various Tenants)
Woolloongabba Mixed Use Development Stages 1 & 2 (Residential –540 Apartments + Commercial)
Additional Smart Suburb Moves Near Brisbane Metro.
To give buyers more choice and uncover additional value-packed opportunities, the tables below highlight a further seven suburbs beyond the top ten. These build on the house and unit locations featured earlier in the report.
Using the same rigorous selection methodology, these suburbs have been identified as strong alternatives, particularly for buyers looking to enter the market below Brisbane Metro’s median house and/or unit prices. While they may not meet the benchmark required to rank as ‘key suburbs’ they still present compelling options for those seeking affordability, growth potential or a strategic entry point into the market.
Houses.
How We Selected The Top 10.
The Smart Moves: Capital Cities Edition for Brisbane Metro report takes a deep dive into every suburb within a 20km radius of the Brisbane CBD, uncovering where opportunities lie for today’s buyers. Each suburb was carefully assessed against a robust set of criteria to ensure it offers not just value, but long-term appeal.
Property performance.
To ensure reliable insights suburbs must demonstrate reliable market activity, with a minimum of 20 sales transactions for statistical accuracy. They are selected based on positive, or close to stable, price growth over the 12 months to Q1 2026*, reflecting resilience in changing market conditions and helping buyers target locations with resilience and stability.
Investment appeal.
For investors looking to maximise returns, shortlisted suburbs (as of March 2026) offer rental yields at or above metro averages, alongside vacancy rates at or below their respective capital city benchmarks, making the suburbs selected an attractive combination for investors seeking steady returns.
Liveability factors.
Beyond numbers, lifestyle matters. Each suburb offers low crime rates, access to essential amenities within 5km (including schools, transport, green spaces, shopping and healthcare), and unemployment levels at or below the Queensland average. Together, these factors create vibrant, well-rounded communities that buyers can feel confident calling home.
Affordability advantage.
Affordability remains front of mind. To ensure real value, selected suburbs have median prices below their capital city averages and within a defined affordability threshold. This threshold is benchmarked against the average home loan per state ** , ensuring buyers require a smaller premium compared to purchasing in the broader metro area. In short, these suburbs open the door for first home buyers and budget-conscious movers without compromising on lifestyle.
Growth and development outlook.
Future growth is a key driver. All selected suburbs are seeing new developments commence in 2026, with strong pipelines of commercial and infrastructure projects supporting local economies. Importantly, there is also a healthy level of new housing supply planned, giving buyers more choice and confidence in the market.
The result?
A curated selection of Brisbane suburbs that strike the balance between affordability, growth potential, and everyday liveability, helping buyers make smarter, more confident property decisions.
Sydney.

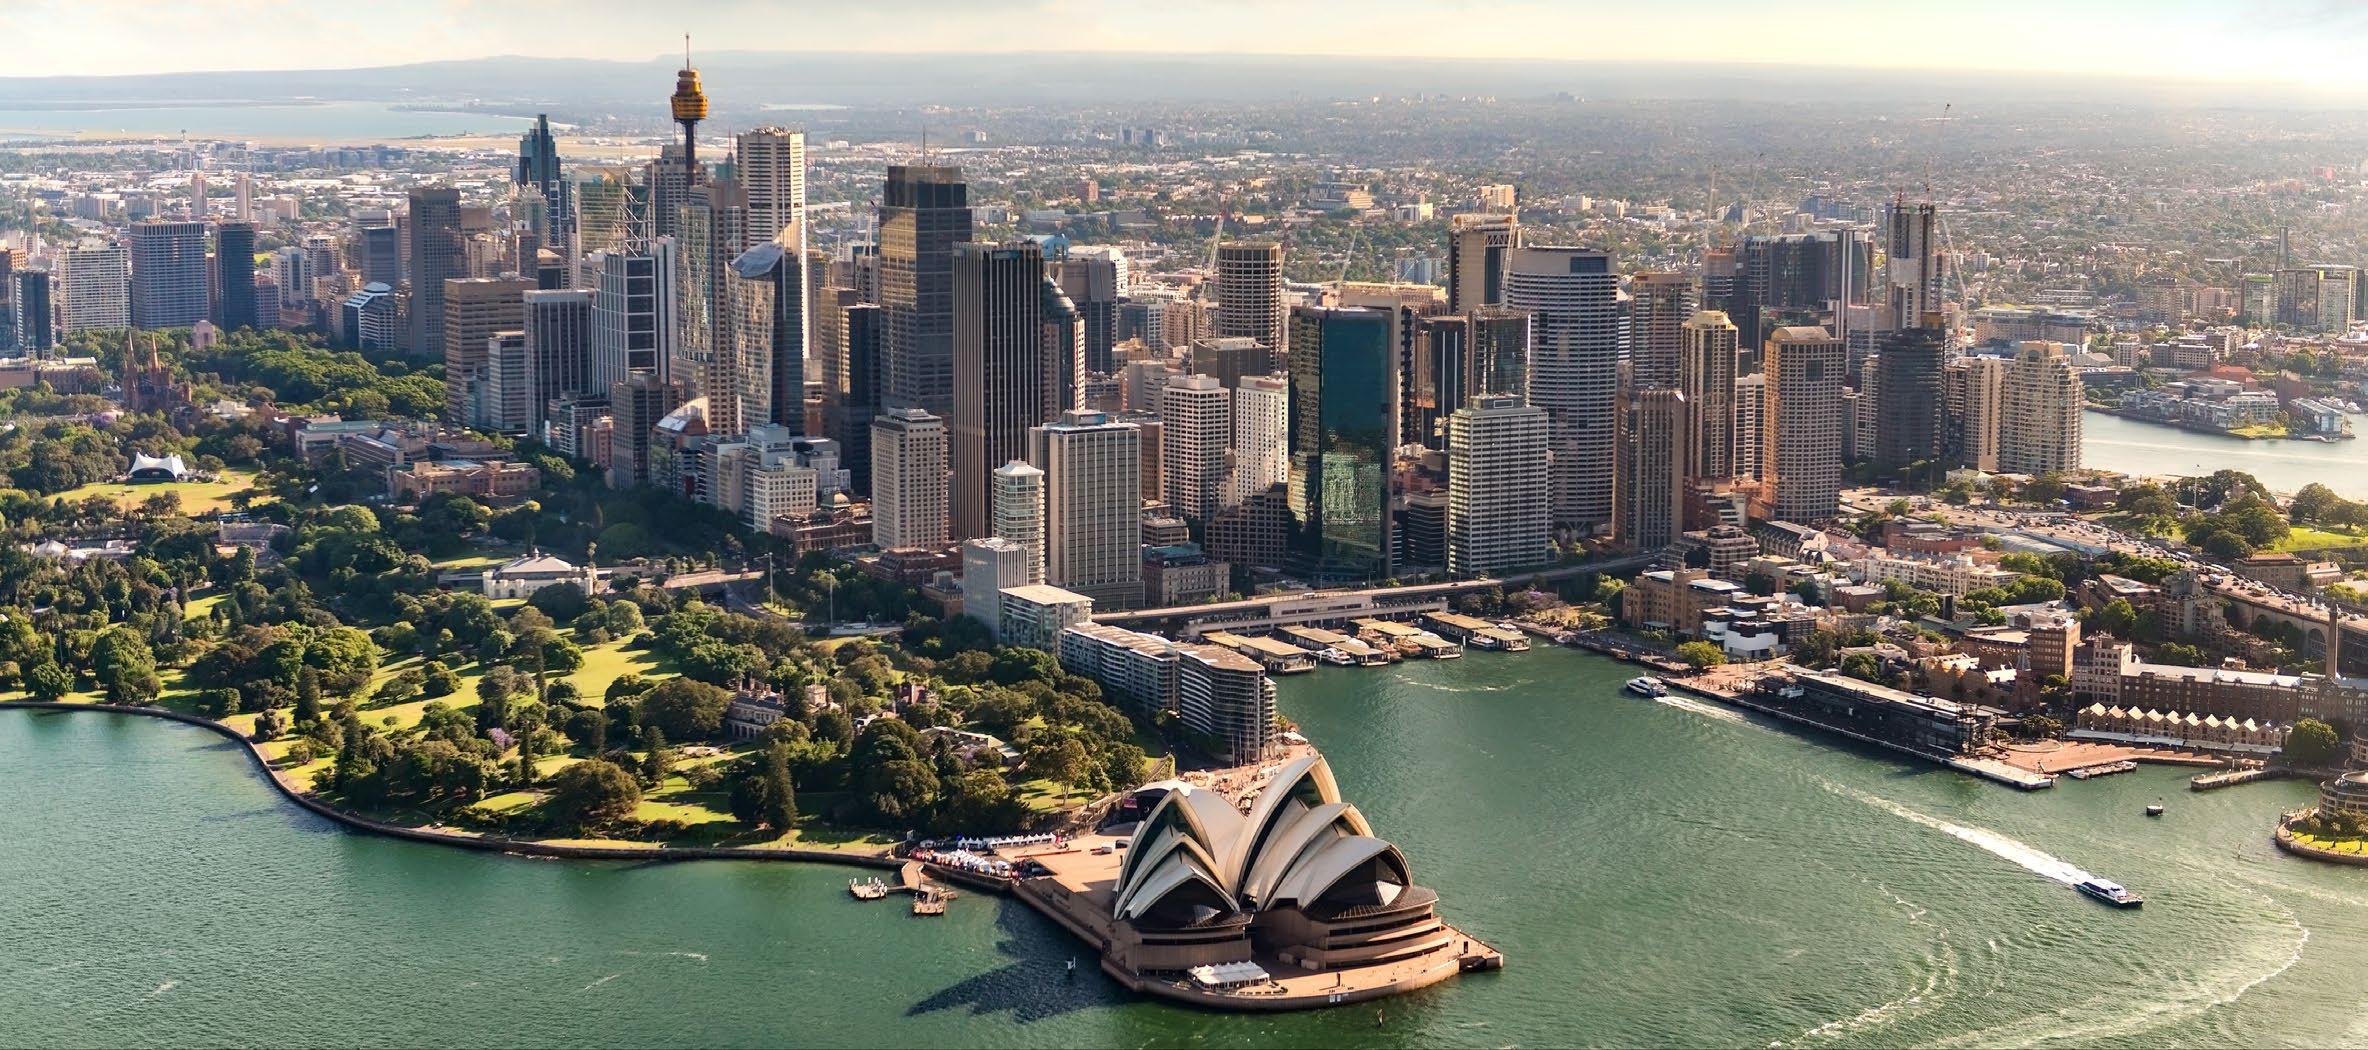
Sydney’s property market is entering a new phase, where softening house prices, surging unit demand, and limited supply are reshaping how and where buyers compete.
Yet within this evolving landscape, opportunity remains with pockets of the metro area continuing to balance affordability with lifestyle appeal
This balance gives buyers and investors a chance to secure value before future development and demand push prices higher.
Who this report is for.
First Home Buyers: Looking for more affordable entry points into Sydney’s shifting property market.
Investors: Seeking suburbs with solid rental yields, low vacancy rates and growth potential.
Upgraders/ Owner-Occupiers: Those looking for locations with strong amenities, infrastructure and long-term appeal.
Leveraging PRD’s proprietary research methodology, this report delivers a sharp, data-led snapshot of Sydney’s current market, pinpointing affordable, high growthpotential suburbs and giving buyers and investors a clear path
landscape.
Sydney is a market in transition, with house prices falling by 2.0% to $2.35M over the past 12 months, while unit prices rose by 2.9% to $880,000, reflecting a clear shift toward more affordable housing.
Demand remains strong, particularly for units, with sales surging by 35.4% compared to a 6.4% decline in house sales, as buyers adjust to higher price points
At the same time, tight rental conditions persist, with vacancy rates at just 1.1%. The data points to a growing supply imbalance, reinforcing that affordability pressures are reshaping where and how people buy across Sydney.
A clear supply gap is emerging in Sydney, creating notable opportunity for buyers. While $41.5B worth of developments are planned for 2026, most of the new stock is concentrated in units (21,088) compared to just 748 standalone houses, reinforcing a shortage of detached housing.
At the same time, demand remains high, particularly as buyers shift toward more affordable options, placing upward pressure on both prices and rents
This imbalance between limited house supply and rising demand highlights a key window for buyers to act now, before ongoing population growth and constrained stock push values higher in the future.

House Sales by Price Bracket . Unit Sales by Price Bracket .




$2,000,000 to $2,199,999
$2,200,000 to $2,399,999
$2,400,000 to $2,599,999
$2,600,000 and above





Less than $799,999
$800,000 to $849,999
$850,000 to $899,999
$900,000 to $949,999
$950,000 and above
Average Vendor Discount.



Average house vendor discounts between Q1 2025 and Q1 2026 have remained at a premium, sitting at 3.8%. The average unit vendor discount has swung from a discount to a slight premium of 0.9%. Sydney market conditions favour sellers, as buyers must offer higher than the first listing price. Thus, buyers must act fast to enter the unit market, before premiums rise further.
Most of the houses sold in Sydney Metro& across 2026# were in the premium price point of $2,600,000 and above (40.5%). Most of the units sold were also in the premium price point, of $950,000 and above (43.8%).
In good news for buyers, 32.8% of house sales were in the most affordable price point of less than $1,999,999 and 38.8% of units sold were also in the most affordable point of less than $799,999.
This suggests buyers and investors of all budgets have a wide array of options in the Sydney Metro& market. However, buyers must act fast to secure their ideal purchase or investment.
$0 $500,000 $1,000,000 $1,500,000 $2,000,000 $2,500,000 $3,000,000


Rental Growth 2026.
House rental yields in Sydney Metro were 2.8% as of March 2026, slightly lower than Melbourne Metro (3.1%) and Brisbane Metro (2.9%). That said, the median house rental price increased by 10.6% in the past 12 months to Q1 2026, at $1,100 per week; along with a 11.2% decrease in the number of rentals obtained (to 5,073 rentals in Q1 2026).
Average days on the market decreased by 11.7% to 21 days, reinforcing a higher demand for house rentals. The unit rental market is undersupplied, as median unit rental price increased by 5.3% to $800 per week, while the number of units rented decreased by 13.4% (to 25,351 units rented in Q1 2026). Overall, there is strong rental demand for both houses and units, presenting an attractive investment opportunity, especially whilst the Sydney Metro sales market is experiencing a slower pace of price growth.
3-bedroom houses and 3+ bedroom units provided investors with the highest annual rental growth of 8.9% and 20.2%, achieving $980 and $1,190 per week, respectively. All rental property types have increased in median rental prices.
In March 2026, Sydney Metro recorded a vacancy rate of 1.1%, below Melbourne Metro (1.4%) but higher than Brisbane Metro of 0.8%. Despite minor fluctuations over the past 12 months, Sydney Metro’s vacancy rate has declined, indicating tighter rental demand. Furthermore, it remains well below the Real Estate Institute of Australia’s benchmark of 3.0%. This indicates quicker occupancy of rental homes in Sydney Metro, creating a favourable environment for investors.
HOUSES

Bronte Beach and Baths Bondi,Sydney,NSW.

Rental Yield Comparison: 2026§ .
Rental Vacancy Rates 2026.
Median House Prices.
20KM FROM THE SYDNEY CBD | 2026*
LEGEND .
Data not available
$0 - $500,000
$500,000 - $800,000
$800,000 - $1,000,000
$1,000,000 - $2,000,000
$2,000,000+
20km from CBD
Translucent colours for <20 sales
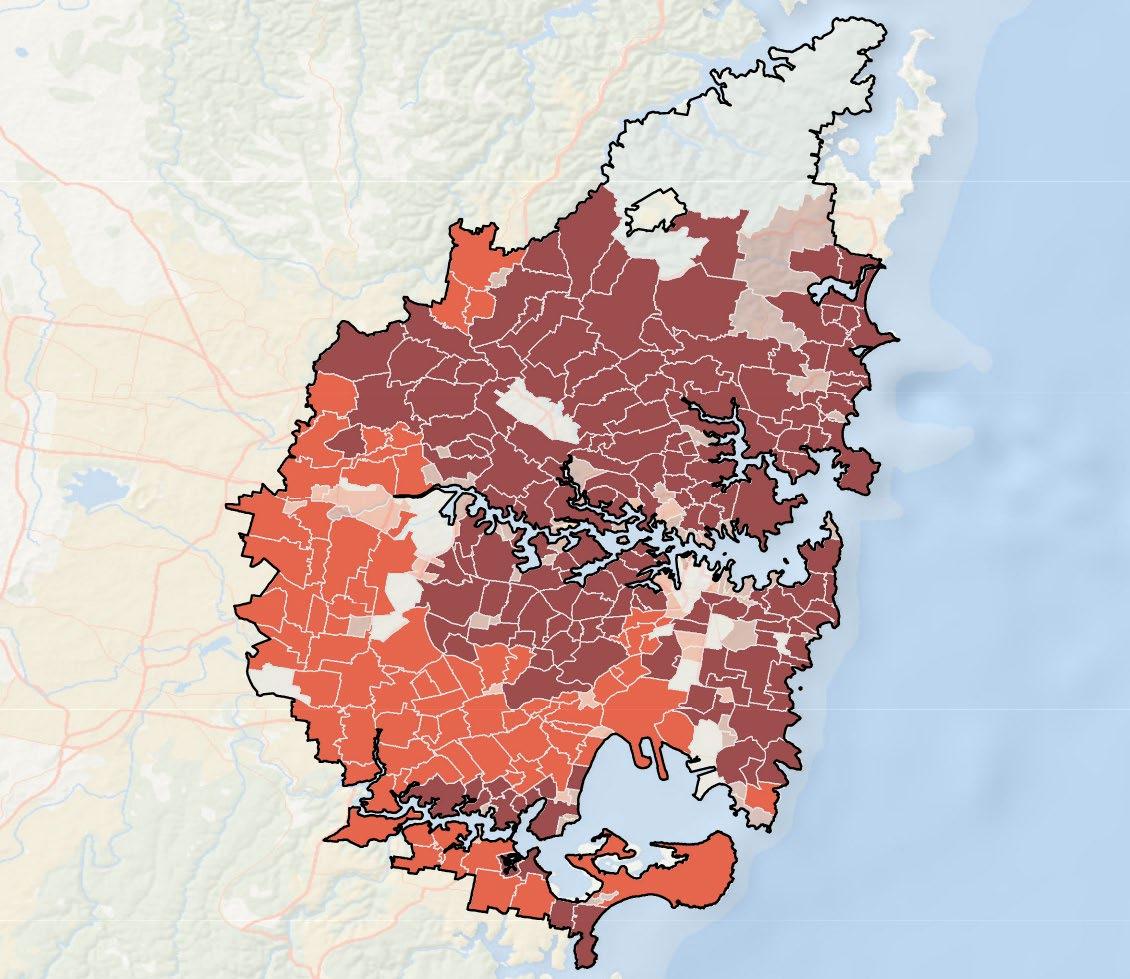
Sydney Smart Move Suburbs Rental Yield
SYDNEY
Market Cycle Indicators.
Our easy-to-read clock format indicators show where Sydney’s house and unit markets currently sit in the market cycle, from peak through to recovery. They highlight whether conditions are strengthening or softening, helping buyers and investors understand timing, momentum, and where opportunities may be emerging across the city.
The 4 key market indicators:
Peak.
When prices are at or near their highest point, demand is strong, and growth starts to stabilise.
Downswing.
When the market begins to cool, buyer demand eases, and prices may plateau or decline.
Bottom.
When the market reaches its lowest point, conditions stabilise, and the groundwork is set for the next period of growth
Upswing.
When the market is gaining momentum, buyer confidence is rising, and property prices are beginning to increase.
The hands on the clocks indicate the current position of each property type in the market cycle.
SYDNEY MARKET
HOUSE
(MARKET GROWTH)
(MARKET COOLING)
Sydney’s house market is entering a downswing phase.
UNIT
GROWTH)
COOLING)
Sydney’s unit market is further along in the downswing phase, compared to the house market.

Merrylands. Smart Suburb Moves Near Sydney for Houses

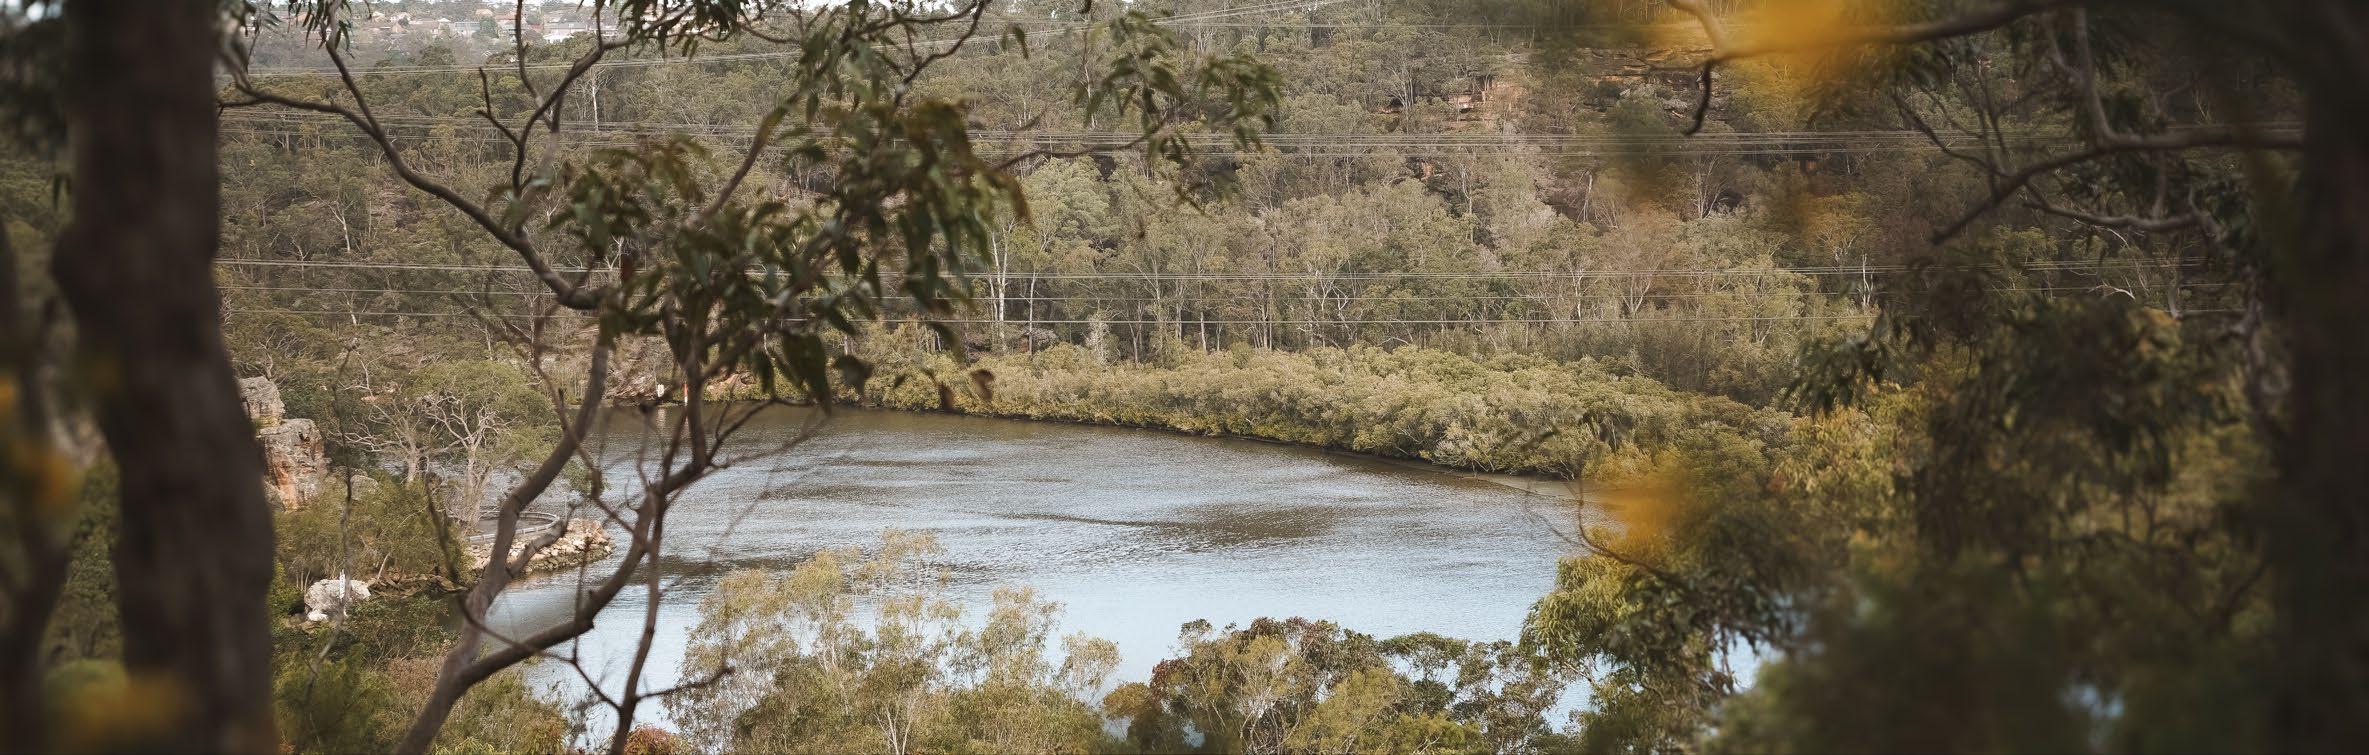
2142 Located 18.3km from the Sydney CBD.
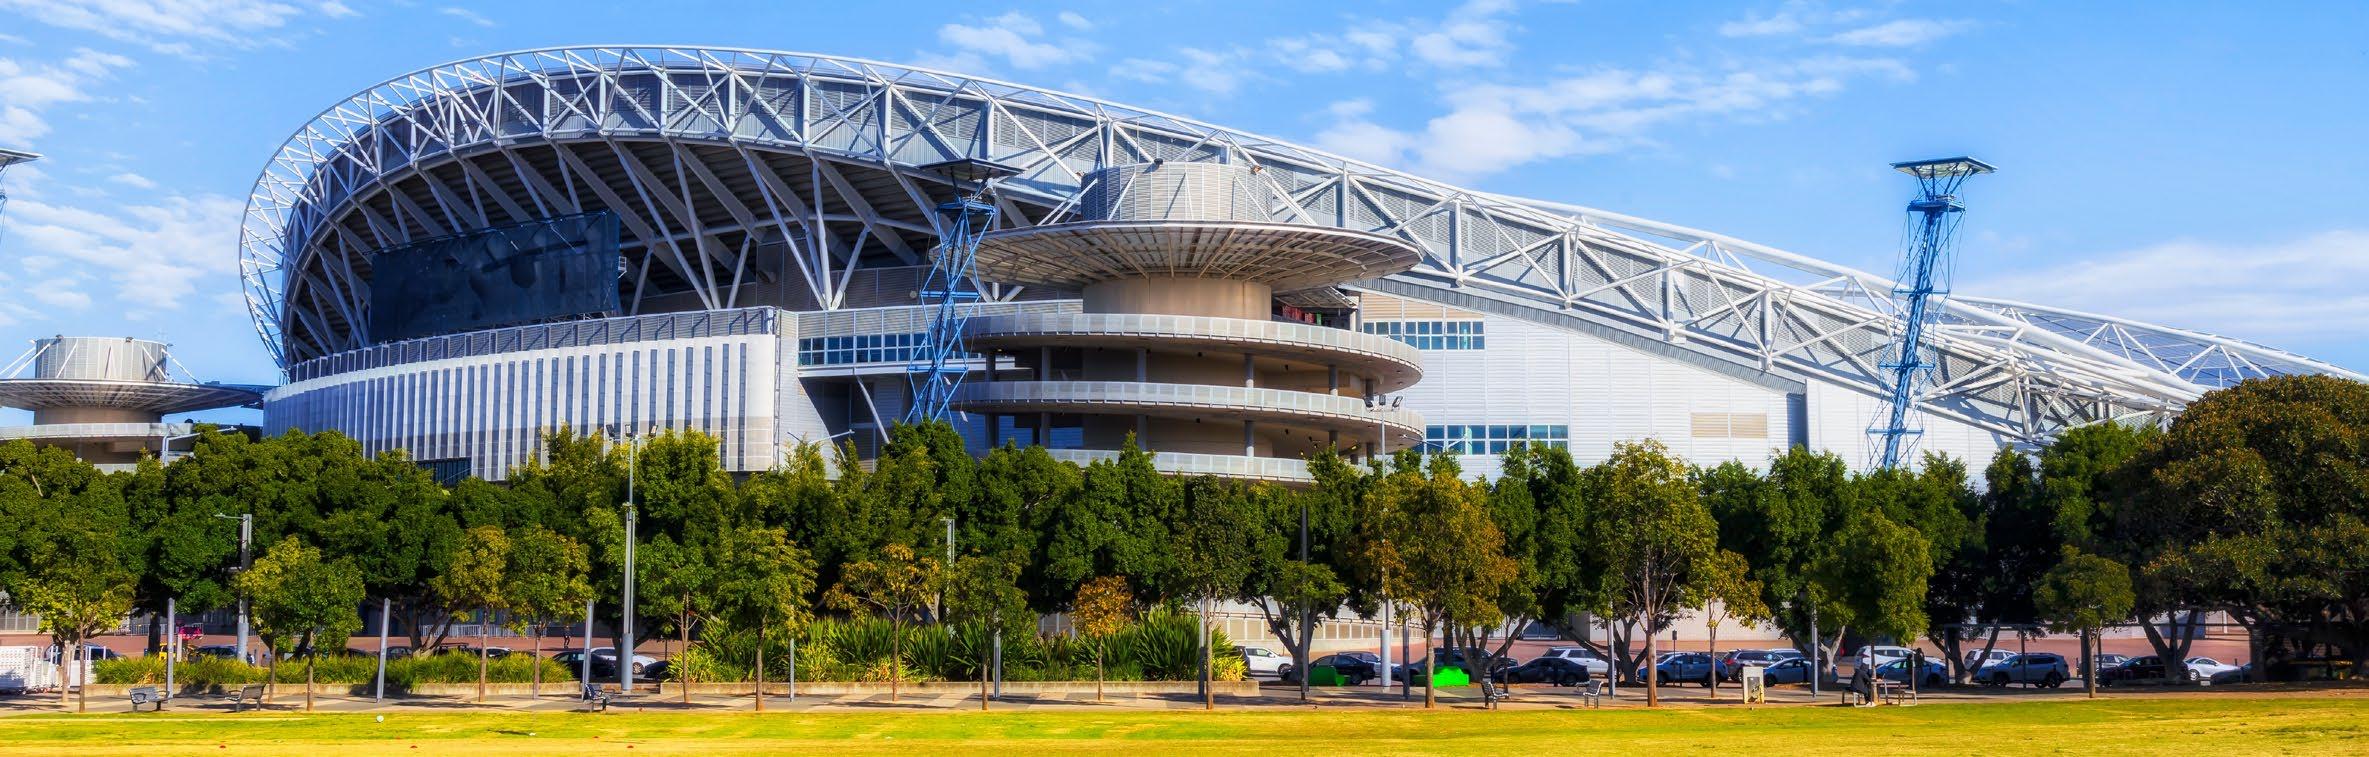
Smart Suburb Moves Near Sydney for Units
Bankstown.
2200
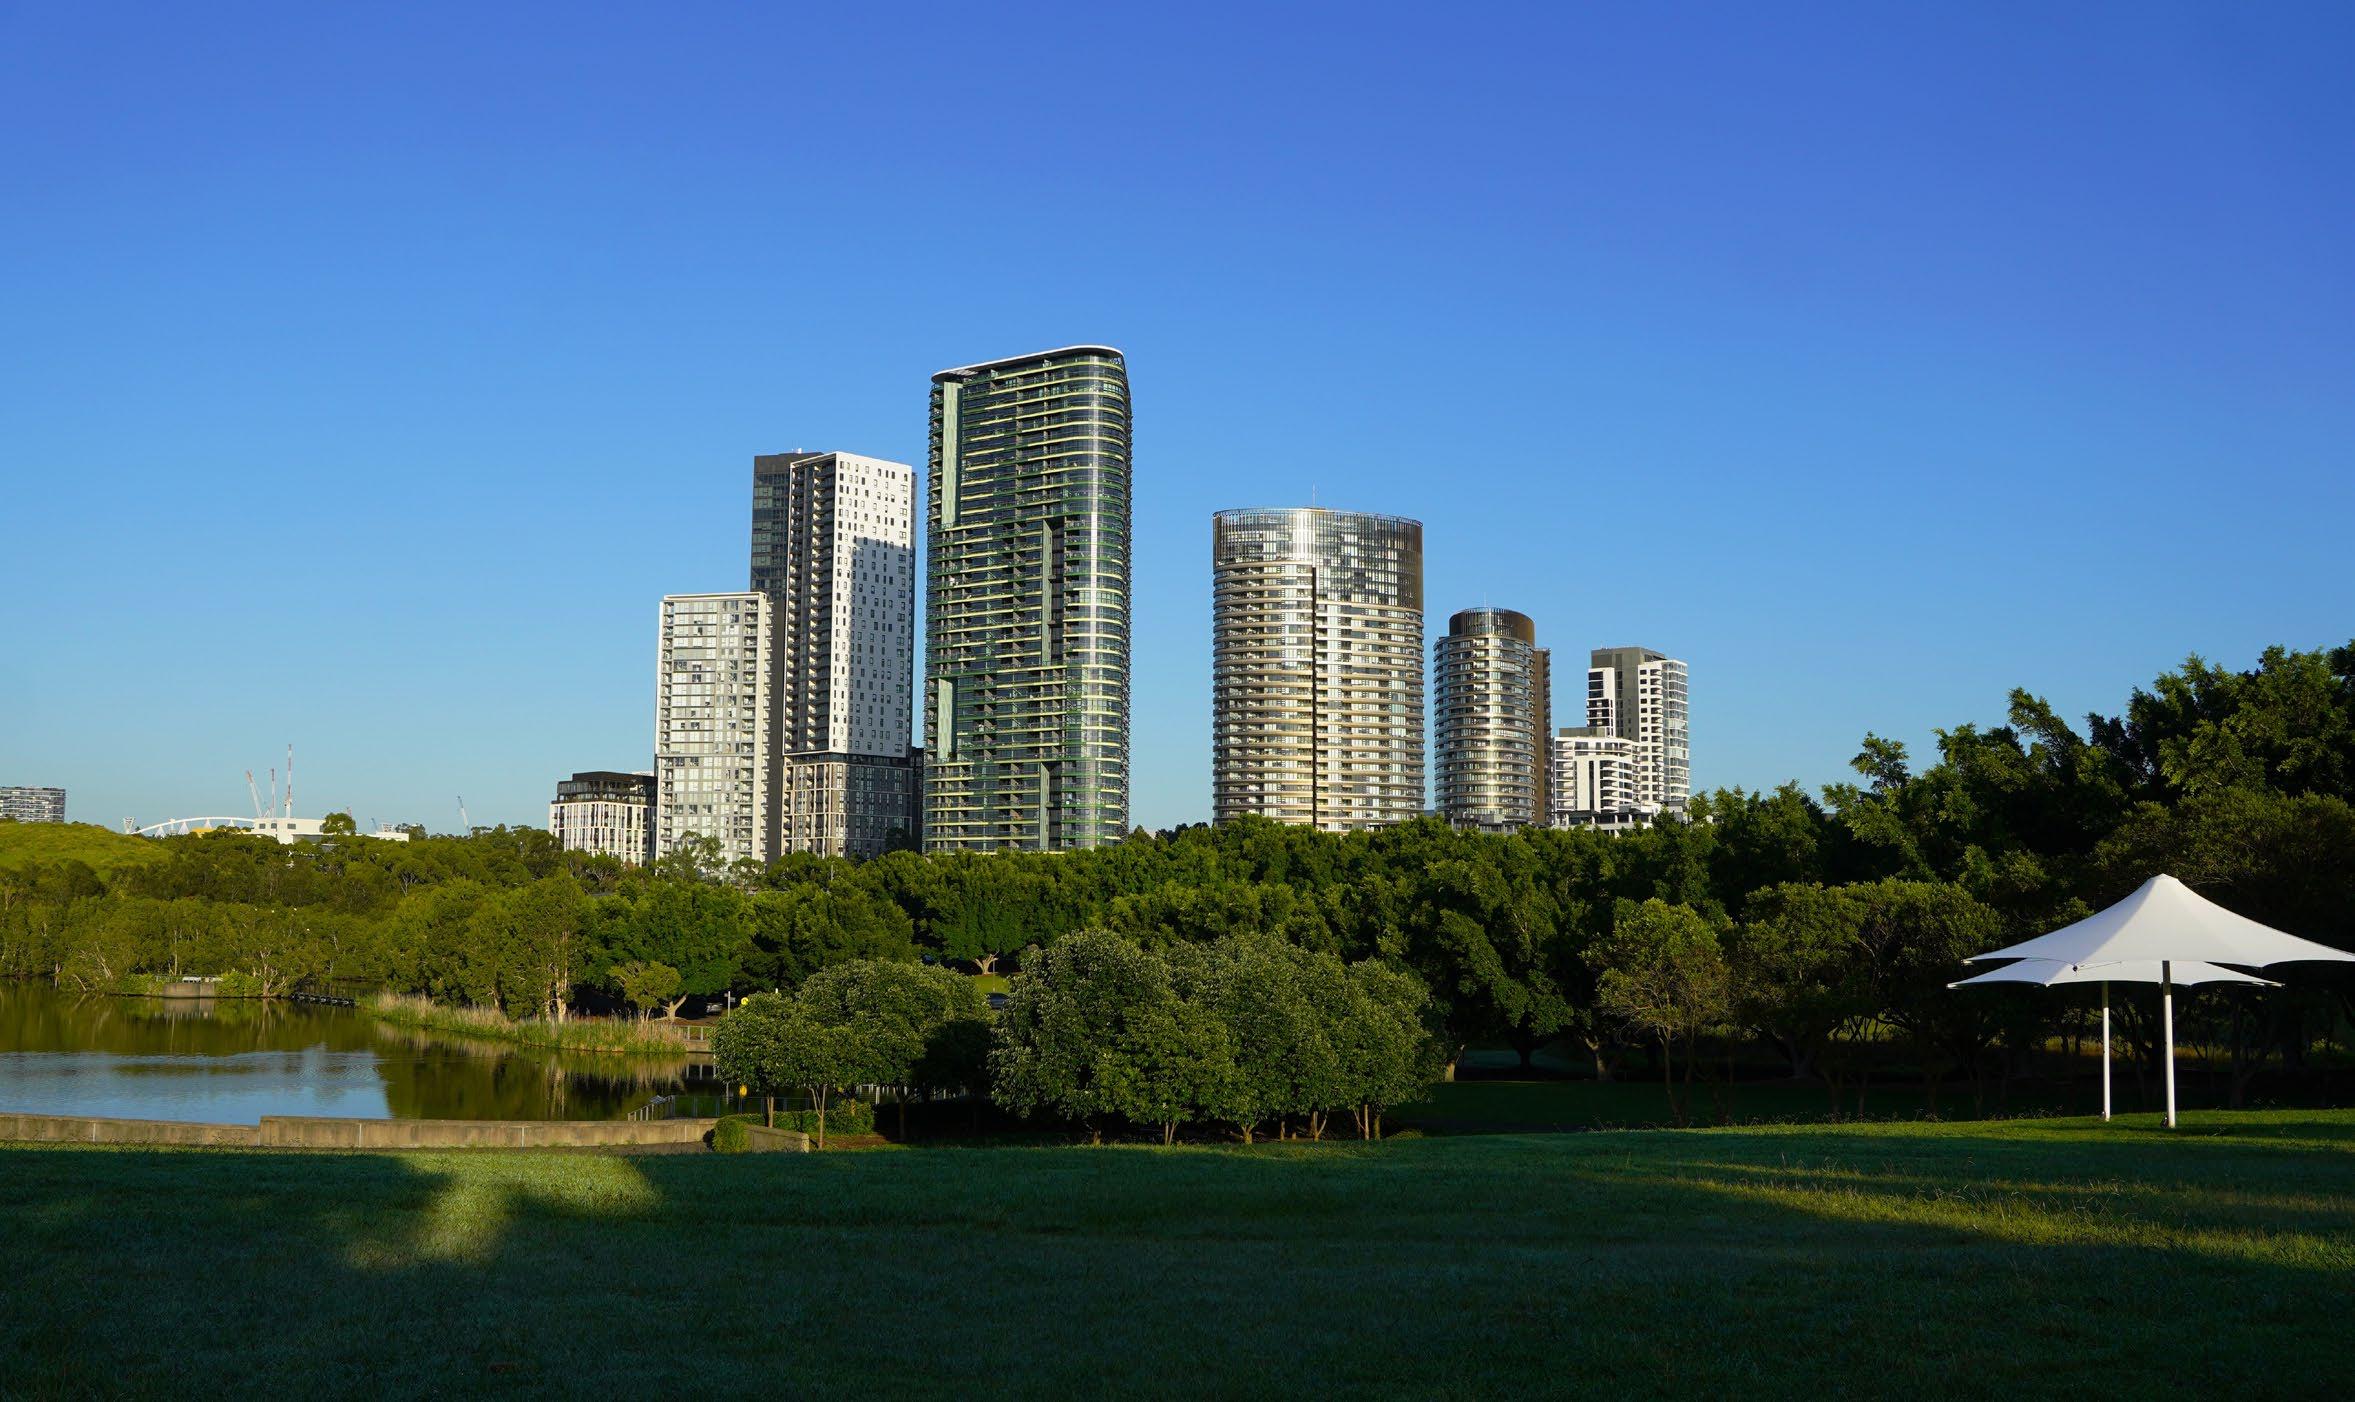

Project Development Map 2026*.
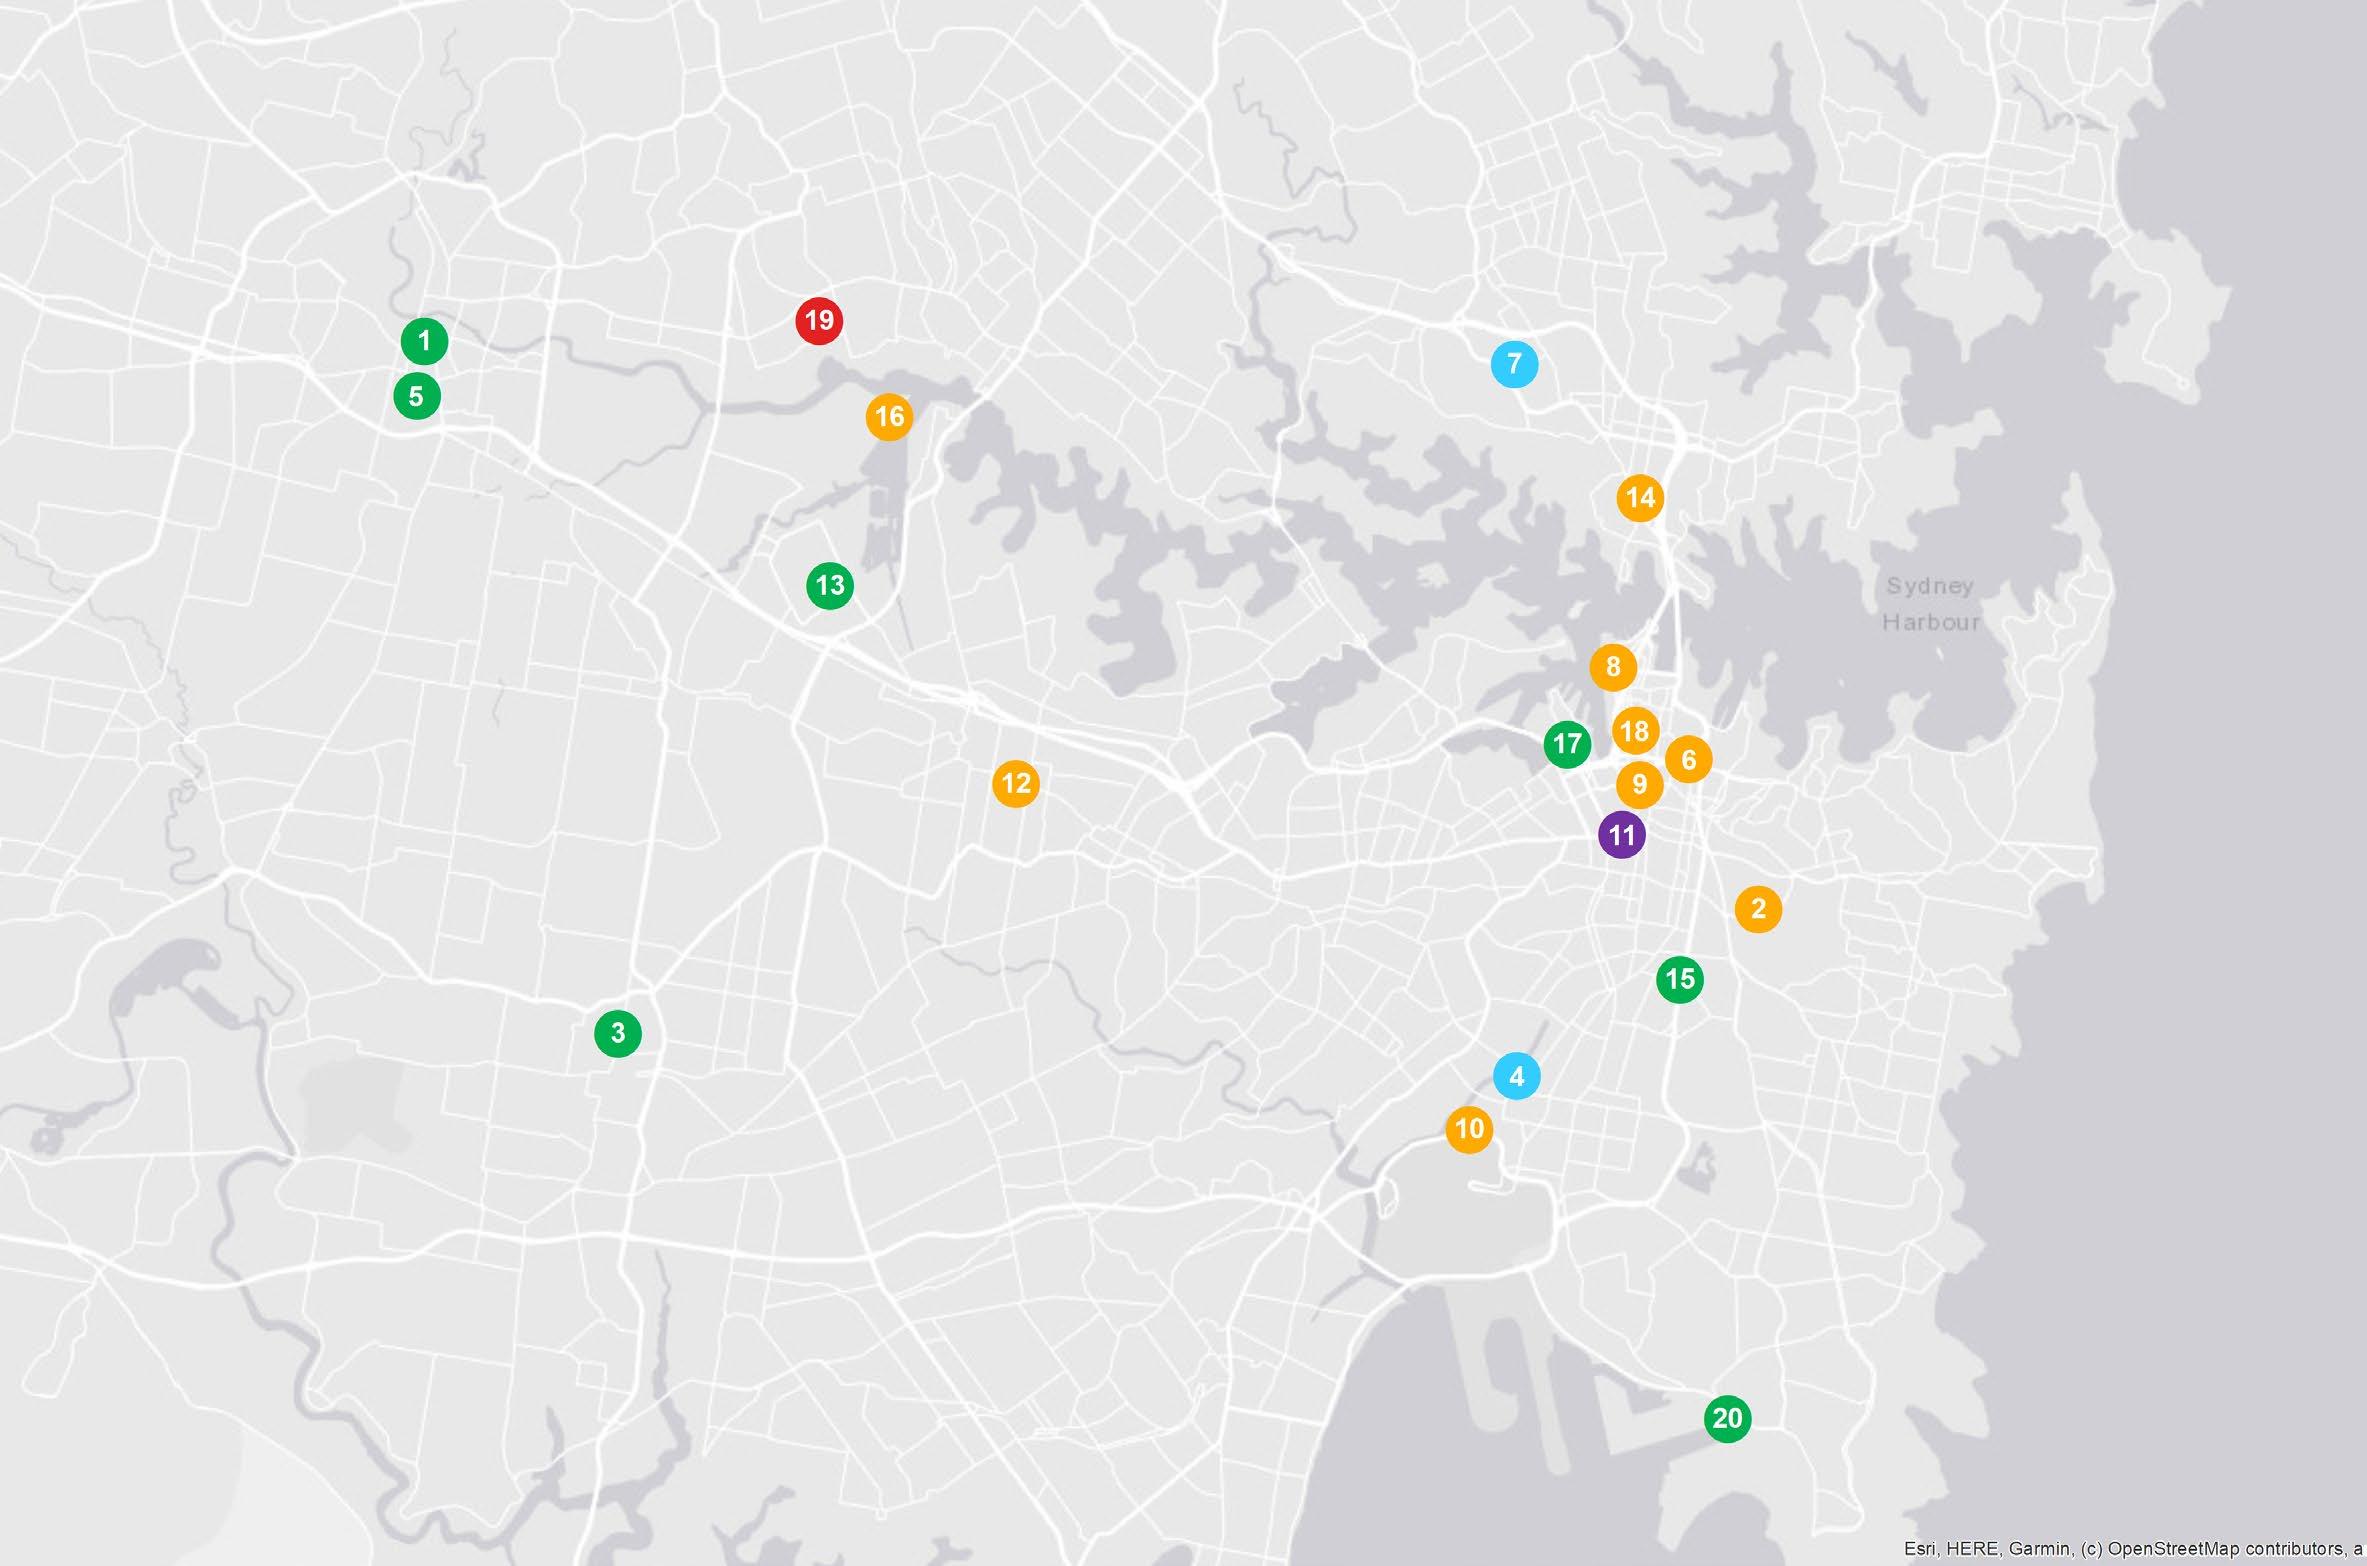






Apartments/ Retail/ Community/ Child Care/ Cinema)
& QF2 Multi-storey Mascot (2 Warehouses/ Office/ Café)
Additional Smart Suburb Moves Near Sydney Metro.
To give buyers more choice and uncover additional value-packed opportunities, the tables below highlight a further seven suburbs beyond the top ten. These build on the house and unit locations featured earlier in the report.
Using the same rigorous selection methodology, these suburbs have been identified as strong alternatives, particularly for buyers looking to enter the market below Sydney Metro’s median house and/or unit prices. While they may not meet the benchmark required to rank as ‘key suburbs’ they still present compelling options for those seeking affordability, growth potential or a strategic entry point into the market.
Houses.
Units.
How We Selected The Top 10.
The Smart Moves: Capital Cities Edition for Sydney Metro report takes a deep dive into every suburb within a 20km radius of the Sydney CBD, uncovering where opportunities lie for today’s buyers. Each suburb was carefully assessed against a robust set of criteria to ensure it offers not just value, but long-term appeal.
Property performance.
To ensure reliable insights suburbs must demonstrate reliable market activity, with a minimum of 20 sales transactions for statistical accuracy.
They are selected based on positive, or close to stable, price growth over the 12 months to Q1 2026*, reflecting resilience in changing market conditions and helping buyers target locations with resilience and stability.
Investment appeal.
For investors looking to maximise returns, shortlisted suburbs (as of March 2026) offer rental yields at or above metro averages, alongside vacancy rates at or below their respective capital city benchmarks, making the suburbs selected an attractive combination for investors seeking steady returns.
Liveability factors.
Beyond numbers, lifestyle matters. Each suburb offers low crime rates, access to essential amenities within 5km (including schools, transport, green spaces, shopping and healthcare), and unemployment levels at or below the New South Wales average.
Together, these factors create vibrant, well-rounded communities that buyers can feel confident calling home.
Affordability advantage.
Affordability remains front of mind. To ensure real value, selected suburbs have median prices below their capital city averages and within a defined affordability threshold. This threshold is benchmarked against the average home loan per state**, ensuring buyers require a smaller premium compared to purchasing in the broader metro area.
In short, these suburbs open the door for first home buyers and budget-conscious movers without compromising on lifestyle.
Growth and development outlook.
Future growth is a key driver. All selected suburbs are seeing new developments commence in 2026, with strong pipelines of commercial and infrastructure projects supporting local economies. Importantly, there is also a healthy level of new housing supply planned, giving buyers more choice and confidence in the market.
The result?
A curated selection of Sydney suburbs that strike the balance between affordability, growth potential, and everyday liveability, helping buyers make smarter, more confident property decisions.

Melbourne.
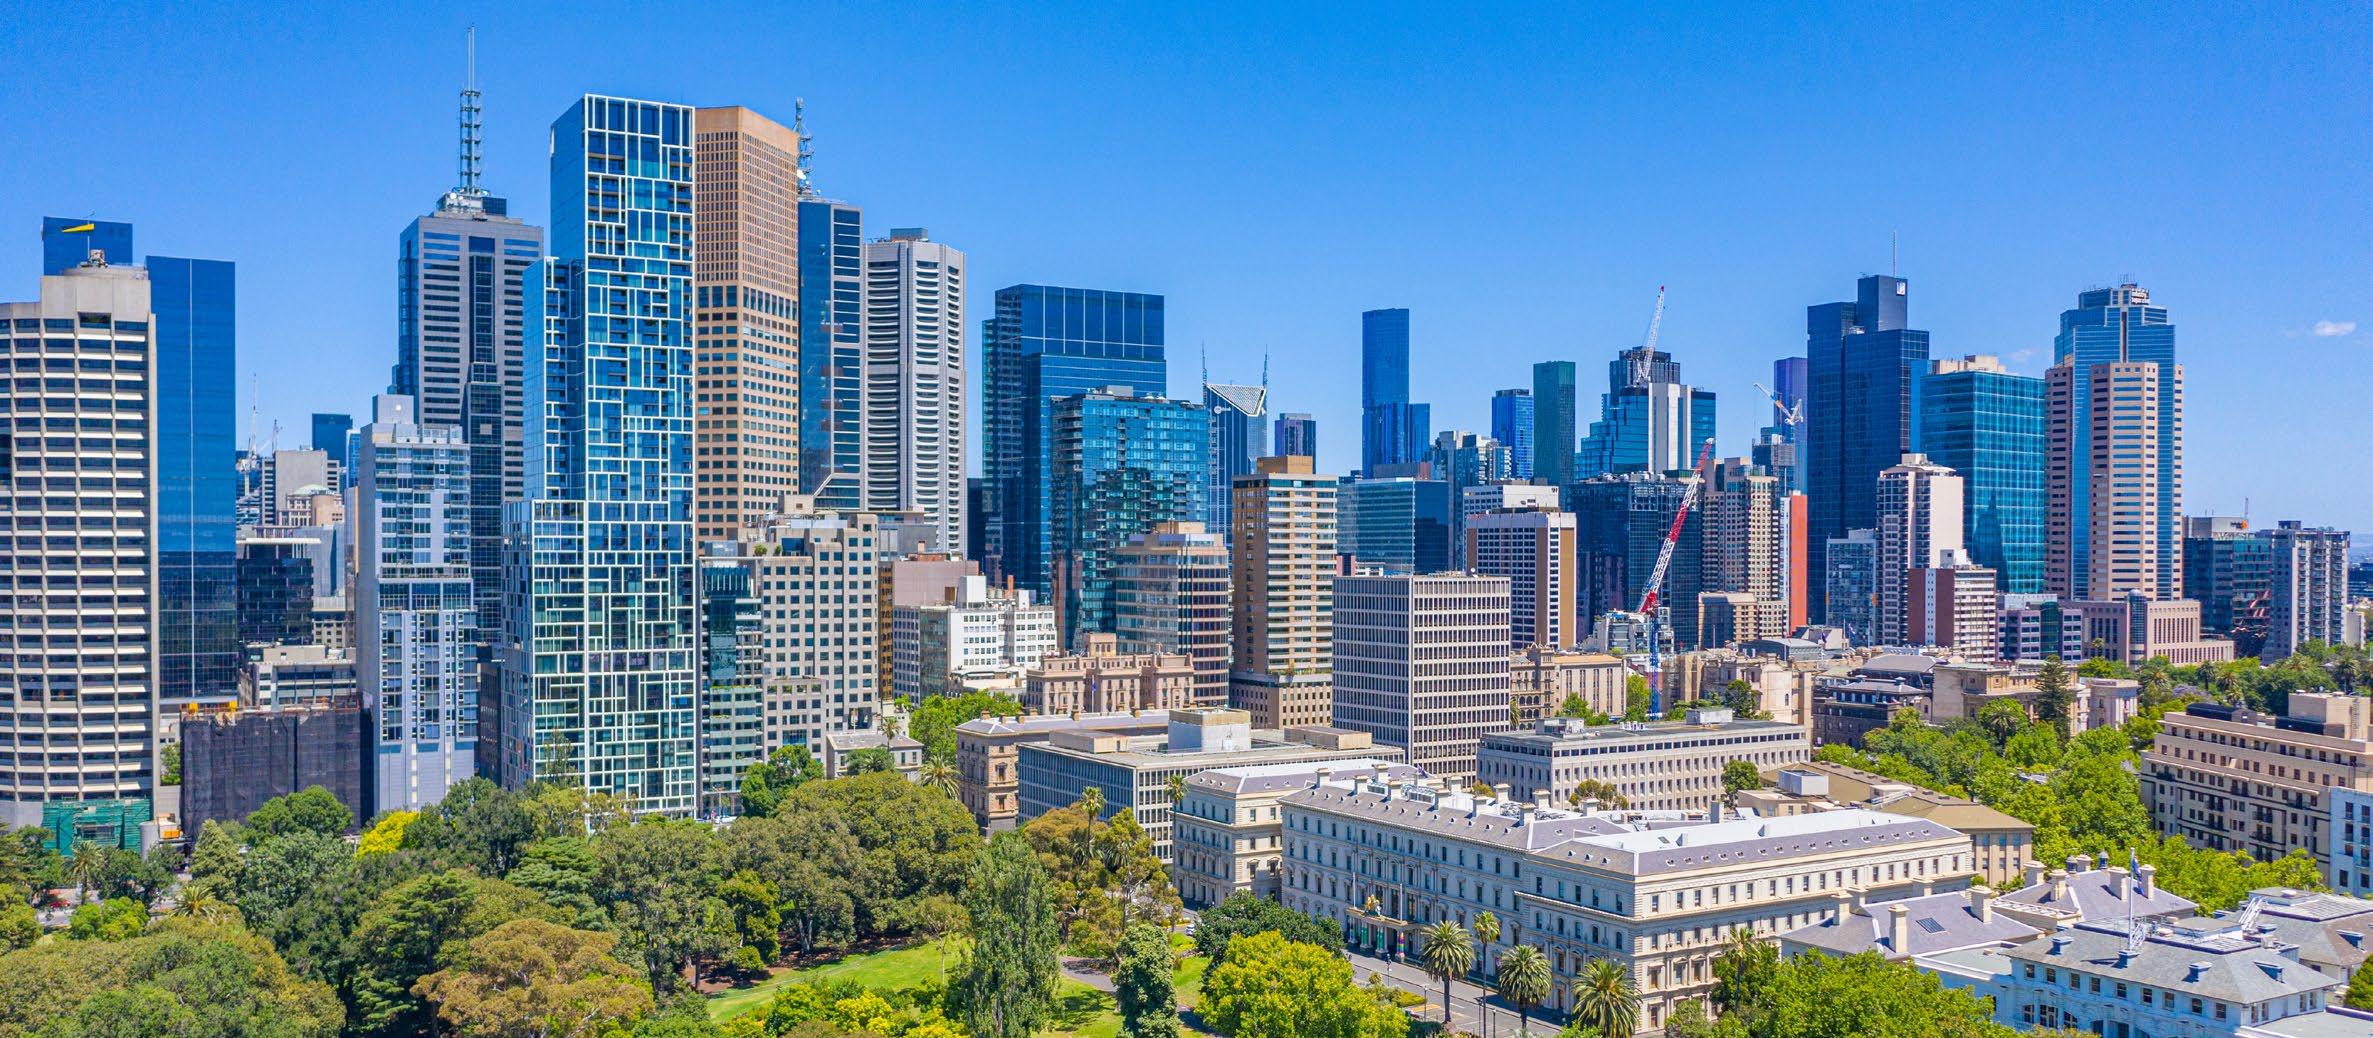
Melbourne’s next property hotspots are already taking shape. Prices are rising, supply is tight, and opportunity is emerging in the right places
This guide uncovers the suburbs that strike the perfect balance between affordability, liveability, and long-term growth helping buyers and investors act with confidence in 2026.
Who this report is for.
First Home Buyers: Looking for more affordable entry points into Melbourne’s changing property market.
Investors: Seeking suburbs with solid rental yields, low vacancy rates and growth potential.
Upgraders/ Owner-Occupiers: Those looking for liveable locations with strong amenities, infrastructure and long-term appeal.
Leveraging PRD’s proprietary research methodology, this report cuts through the noise, delivering clear insights into Melbourne’s fast-moving market and spotlighting suburbs where affordability, lifestyle, and growth potential align, helping you uncover real
with confidence.
Market Overview.
Melbourne’s property market is proving both resilient and increasingly competitive, with house prices rising 2.5% to $956,000 and units up 1.0% to $625,000, even as interest rates climb. This growth is underpinned by a significant undersupply of housing, with house sales falling 6.4% and only 1,710 new houses planned compared to over 6,700 sales, pushing buyers to act quickly in a tightening market. As affordability pressures build, demand is shifting unit sales have surged 12.0%.
The data paints a clear picture of a market defined by tight supply, strong demand, and shifting affordability, where opportunity lies in identifying the right suburbs ahead of the curve.
Melbourne’s property market is facing a clear and widening supply gap, particularly in the housing sector, creating strong conditions for future price growth and opportunity. While more than 6,700 houses were sold in Q1 2026, only 1,710 new houses are planned for construction, highlighting a significant shortfall that is unable to keep pace with demand.
In contrast, new supply is heavily skewed toward higherdensity living. This imbalance is influencing market behaviour, pushing buyers toward units and more affordable dwellings, while intensifying competition for detached houses.
For buyers and investors, this presents a clear opportunity: limited house supply is likely to support ongoing price growth, while increased development, backed by $41 billion in projects, will continue to transform key suburbs.
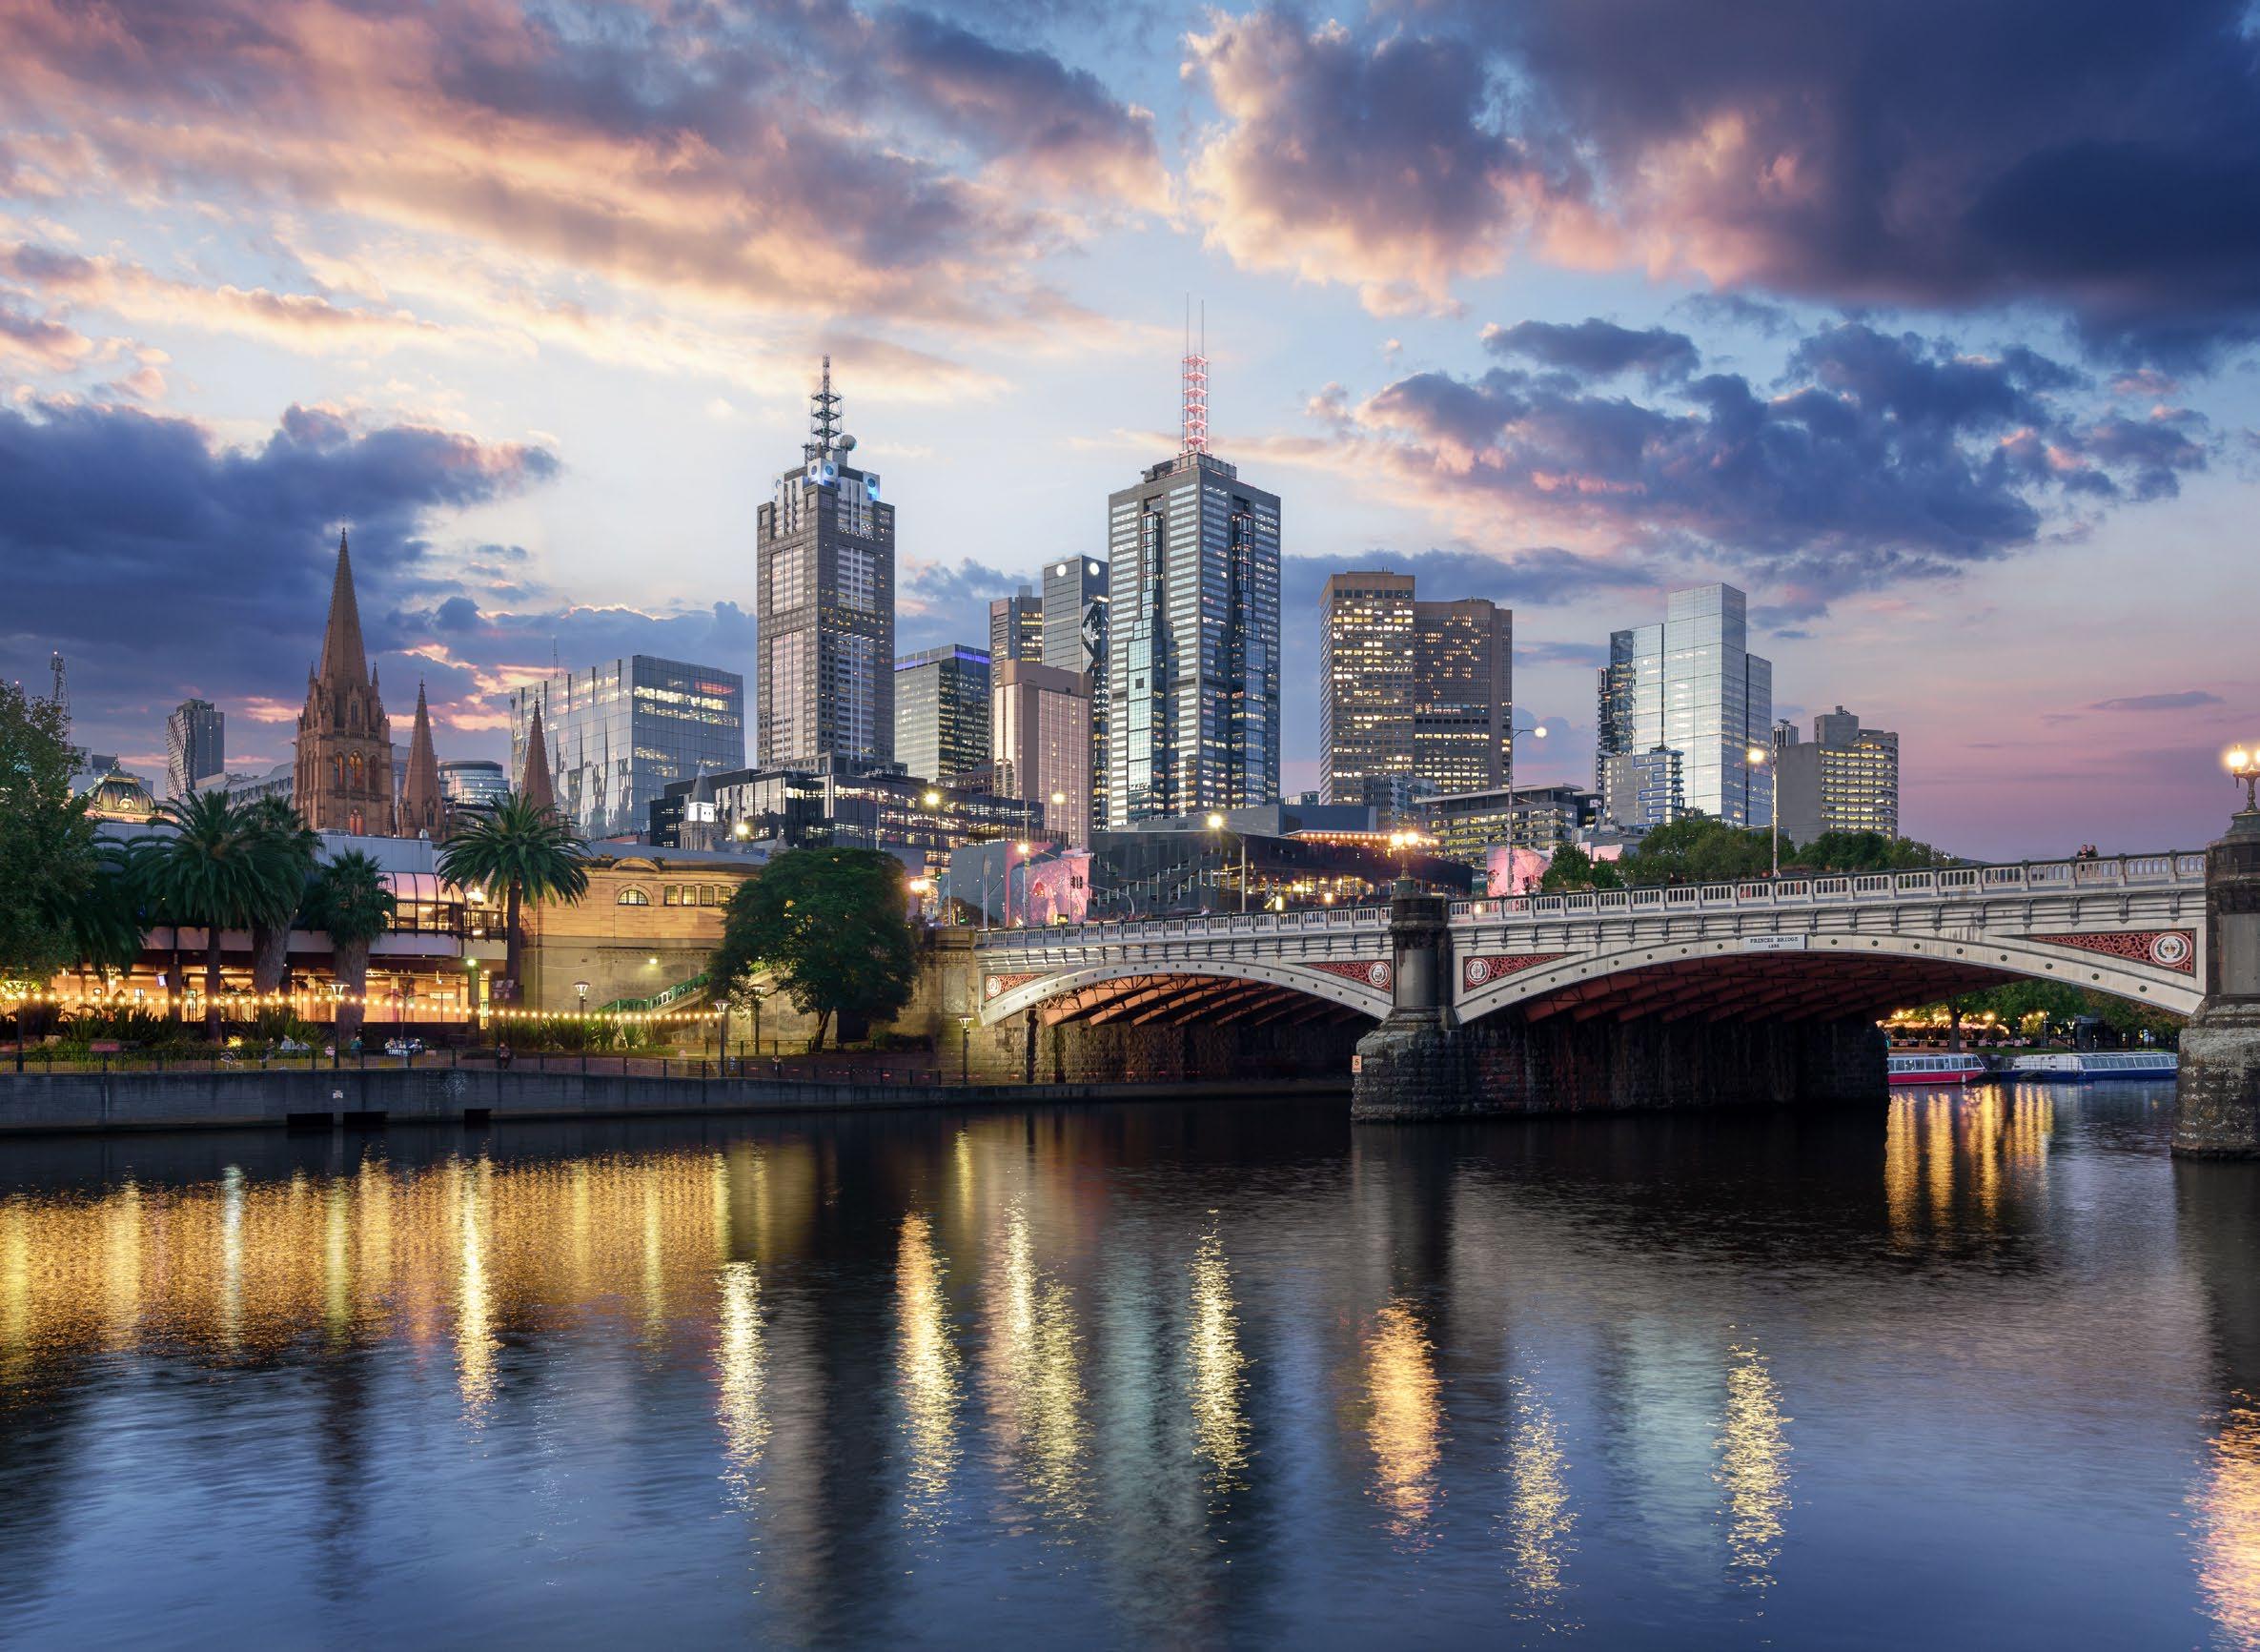
What Buyers Are Paying.
House Sales by Price Bracket . Unit Sales by Price Bracket .





$650,000
$850,000





than $499,999
$500,000 to $599,999
$600,000 to $699,999
$700,000 to $799,999
$800,000 and above
Average Vendor Discount.




The average vendor discounts between Q1 2025 and Q1 2026 have slightly widened to -0.5% for houses but tightened to -2.4% for units.
The market favours buyers, as owners are still willing to accept below the initial listing prices. House average vendor discounts in Q1 2026 are at a peak, making now an ideal time for buyers to act, especially with limited new supply in 2026
The dominant proportion of houses sold in Melbourne Metro across 2025/2026# were in the premium price point of $1,250,000 and above (42.8%), which benefits owners. The most affordable price bracket is still available, with 4.5% of houses sold below $649,999.
On the other hand, most of the units sold were in the most affordable price point of less than $499,999 (32.4%), in good news for first home buyers. At the same time, strong sales were also evident in the premium price point, with 26.7% of units sold above $800,000. Overall, Melbourne offers opportunities across all price points.


Rental Growth 2026.
House rental yield in Melbourne Metro was 3.1% as of March 2026, outperforming Sydney Metro (2.8%) and Brisbane Metro (2.9%). This was paired with a 13.8% increase in median house rental price in the past 12 months to Q1 2026, at $660 per week, along with an 81.6% surge in the number of houses rented (to 7,736 rentals in Q1 2026)
The same pattern can also be seen in the unit market. This reflects a highly demanded and competitive rental market in Melbourne Metro, creating an attractive environment for investors to re-enter, especially with a lower entry price than Sydney Metro.
4+ bedroom houses and 1-bedroom units have provided investors with the highest annual rental growth of 14.7% and 21.4%, achieving $780 and $510 per week, respectively. All rental property types have increased in value.
In March 2026, Melbourne Metro recorded a vacancy rate of 1.4%, above Sydney Metro (1.1%) and Brisbane Metro (0.8%). Vacancy rates have shown a decreasing trend over the past 6 months, indicating an even tighter rental market Melbourne Metro’s vacancy rate remains well below the Real Estate Institute of Australia‘s benchmark of 3.0%.
This indicates quicker occupancy of rental properties in Melbourne Metro, creating a favourable investment environment for investors seeking stable returns; even with a higher sales price (thus, entry price) in the past 12 months to Q1 2026.
Rental Yield Comparison: 2026§ .
Rental Vacancy Rates 2026.
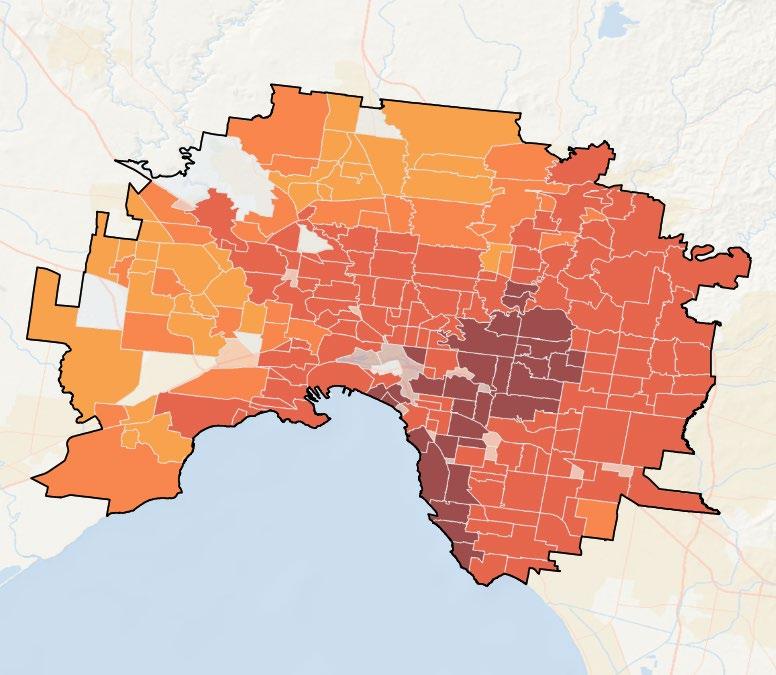
Median House Prices.
LEGEND
Data not available
$0 - $500,000
$500,000 - $800,000
$800,000 - $1,000,000
$1,000,000 - $2,000,000
$2,000,000+
20km from CBD
Translucent colours for <20 sales
MELBOURNE
Market Cycle Indicators.
Our easy-to-read clock format indicators show where Melbourne’s house and unit markets currently sit in the market cycle, from peak through to recovery. They highlight whether conditions are strengthening or softening, helping buyers and investors understand timing, momentum, and where opportunities may be emerging across the city.
The 4 key market indicators:
Peak.
When prices are at or near their highest point, demand is strong, and growth starts to stabilise.
Downswing.
When the market begins to cool, buyer demand eases, and prices may plateau or decline.
Bottom.
When the market reaches its lowest point, conditions stabilise, and the groundwork is set for the next period of growth
Upswing.
When the market is gaining momentum, buyer confidence is rising, and property prices are beginning to increase.
The hands on the clocks indicate the current position of each property type in the market cycle.
HOUSE
MELBOURNE MARKET
UPSWING (MARKET GROWTH)
BOTTOM
DOWNSWING (MARKET COOLING)
The Melbourne house market is just below the downswing meaning that the market is solidly in the cooling phase.
UNIT
MELBOURNE MARKET
UPSWING (MARKET GROWTH)
DOWNSWING (MARKET COOLING) PEAK
BOTTOM
Ccomparatively the Melbourne unit market is slightly above a downswing showing the market is only just starting to enter the cooling phase.

Smart Suburb Moves Near Melbourne for Houses .
St Albans.
Smart Suburb Moves Near Melbourne for Units
St Kilda.

Project Development Map 2026*.
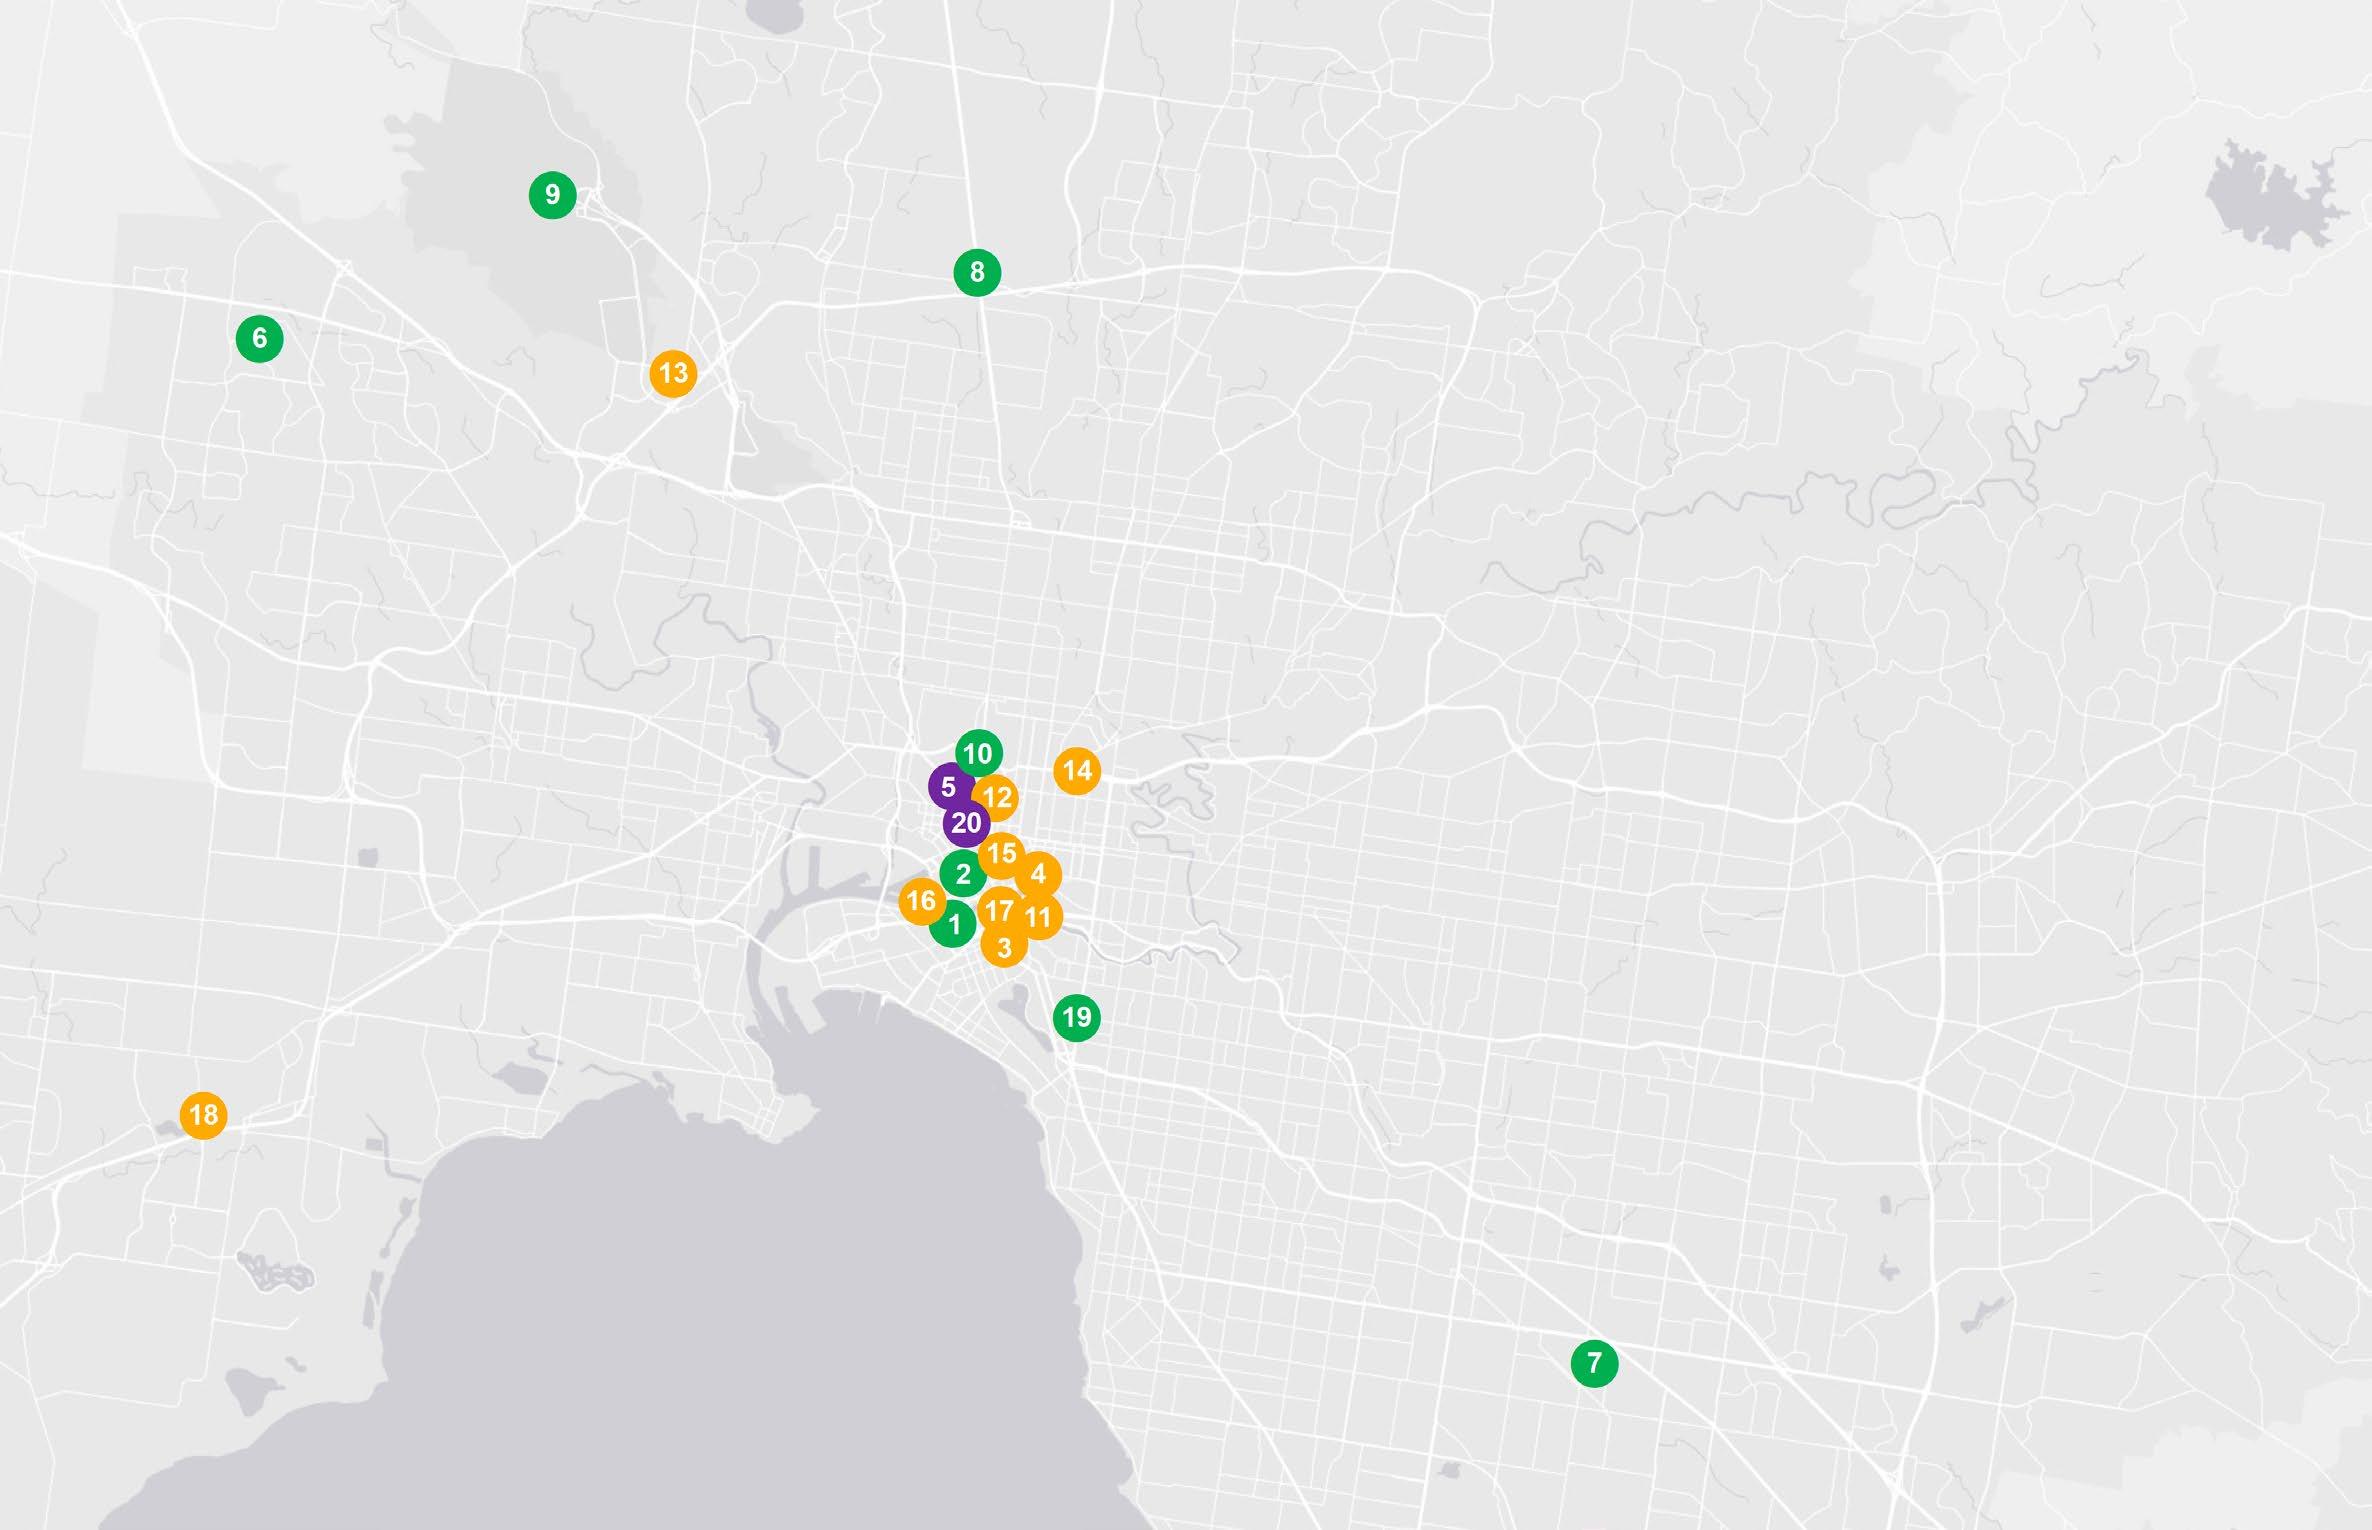






Melbourne Airport Rail Link - Railway Works - Southern Cross Station To Tullamarine (State Government)
Melbourne To Geelong Fast Rail Stage 1 (State Government)
STH BNK By Beulah (Residential – 789 Apartments + Commercial)
Square Mixed-Use Development (Residential + Commercial)
Parkville Biomedical Precinct - Australian Institute Of Infectious Disease (AIID)
Western Renewables Link (Formerly Western Victoria Transmission Network Project) (State Government)
Medical Centre Tower Expansion (State Government)
Sydney Road Upgrade Brunswick To Coburg (State Government)
Melbourne Airport Runway Development Program/Third Runway (State Government)
Parkville Precinct Hospital Redevelopment (State Government)
Mixed Use Development (Various Tenants)
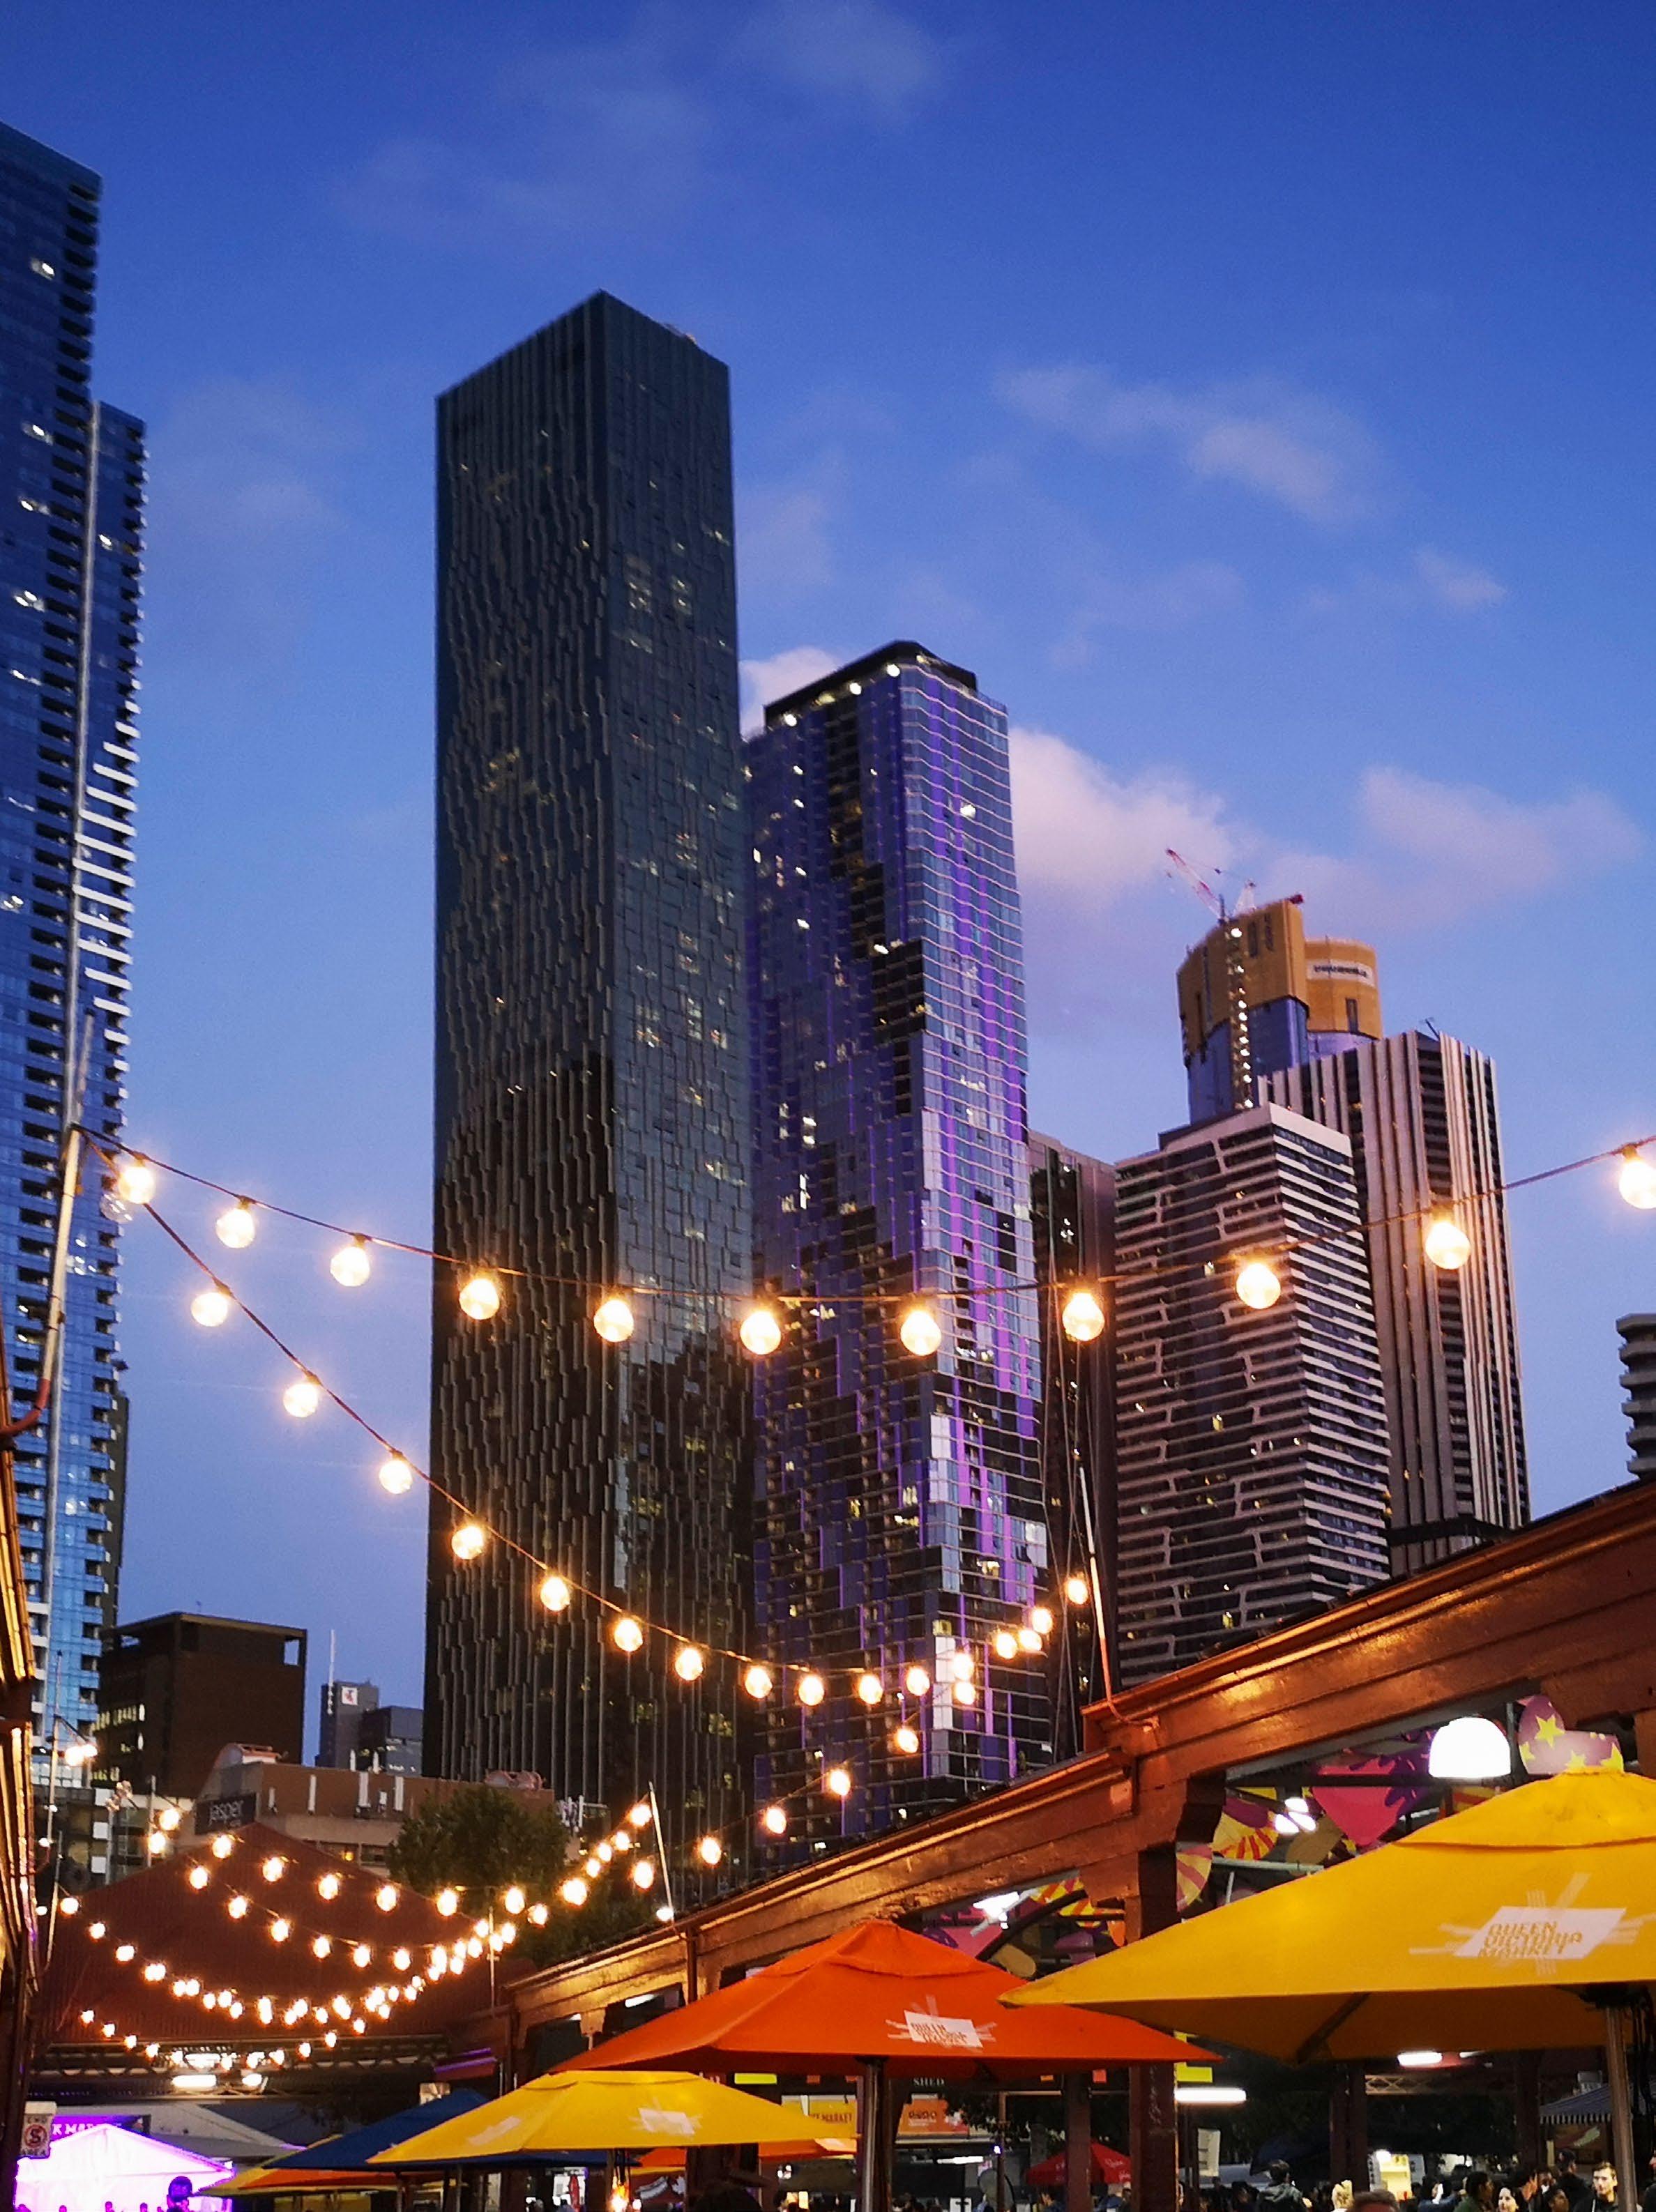
Queen Victoria Market Precinct Southern Site (Tower 1 & Tower 2) - Gurrowa Place (Residential – 569 Apartments + Commercial)
Nextdc M2 Data Centre Tullamarine Stages 9-11 (Various Tenants)
Fitzroy Gasworks Parcels B & C Mixed Use Development (Residential – 1,052 Apartments + Commercial)
12 Riverside Quay Southbank - Esso House Redevelopment
694-704 Collins Street Mixed Use Development (Residential – 265 Units + Commercial)
21-35 Power Street Office & Retail (Various Tenants)
2 Overton Road Williams Landing - Mixed Use Development Development (Residential – 435 Apartments + Commercial)
The Alfred Hospital - Infrastructure And Wards Upgrade (State Government)
Scape Student Accommodation Queen Victoria Market - Gurrowa Place (55 stories, 1,154 beds with prefabricated pod bathrooms).
Additional Smart Suburb Moves Near Melbourne
Metro.
To give buyers more choice and uncover additional value-packed opportunities, the tables below highlight a further seven suburbs beyond the top ten. These build on the house and unit locations featured earlier in the report.
Using the same rigorous selection methodology, these suburbs have been identified as strong alternatives, particularly for buyers looking to enter the market below Melbourne Metro’s median house and/or unit prices. While they may not meet the benchmark required to rank as ‘key suburbs’ they still present compelling options for those seeking affordability, growth potential or a strategic entry point into the market.
Houses.
How We Selected The Top 10.
The Smart Moves: Capital Cities Edition for Melbourne Metro report takes a deep dive into every suburb within a 20km radius of the Melbourne CBD, uncovering where opportunities lie for today’s buyers. Each suburb was carefully assessed against a robust set of criteria to ensure it offers not just value, but long-term appeal.
Property performance.
To ensure reliable insights suburbs must demonstrate reliable market activity, with a minimum of 20 sales transactions for statistical accuracy.
They are selected based on positive, or close to stable, price growth over the 12 months to Q1 2026, reflecting resilience in changing market conditions and helping buyers target locations with resilience and stability.
Investment appeal.
For investors looking to maximise returns, shortlisted suburbs (as of March 2026) offer rental yields at or above metro averages, alongside vacancy rates at or below their respective capital city benchmarks, making the suburbs selected an attractive combination for investors seeking steady returns.
Liveability factors.
Beyond numbers, lifestyle matters. Each suburb offers low crime rates, access to essential amenities within 5km (including schools, transport, green spaces, shopping and healthcare), and unemployment levels at or below the Victorian average.
Together, these factors create vibrant, well-rounded communities that buyers can feel confident calling home.
Affordability advantage.
Affordability remains front of mind. To ensure real value, selected suburbs have median prices below their capital city averages and within a defined affordability threshold. This threshold is benchmarked against the average home loan per state3, ensuring buyers require a smaller premium compared to purchasing in the broader metro area.
In short, these suburbs open the door for first home buyers and budget-conscious movers without compromising on lifestyle.
Growth and development outlook.
Future growth is a key driver. All selected suburbs are seeing new developments commence in 2026, with strong pipelines of commercial and infrastructure projects supporting local economies.
Importantly, there is also a healthy level of new housing supply planned, giving buyers more choice and confidence in the market.
The result?
A curated selection of Melbourne suburbs that strike the balance between affordability, growth potential, and everyday liveability, helping buyers make smarter, more confident property decisions.
Hobart.

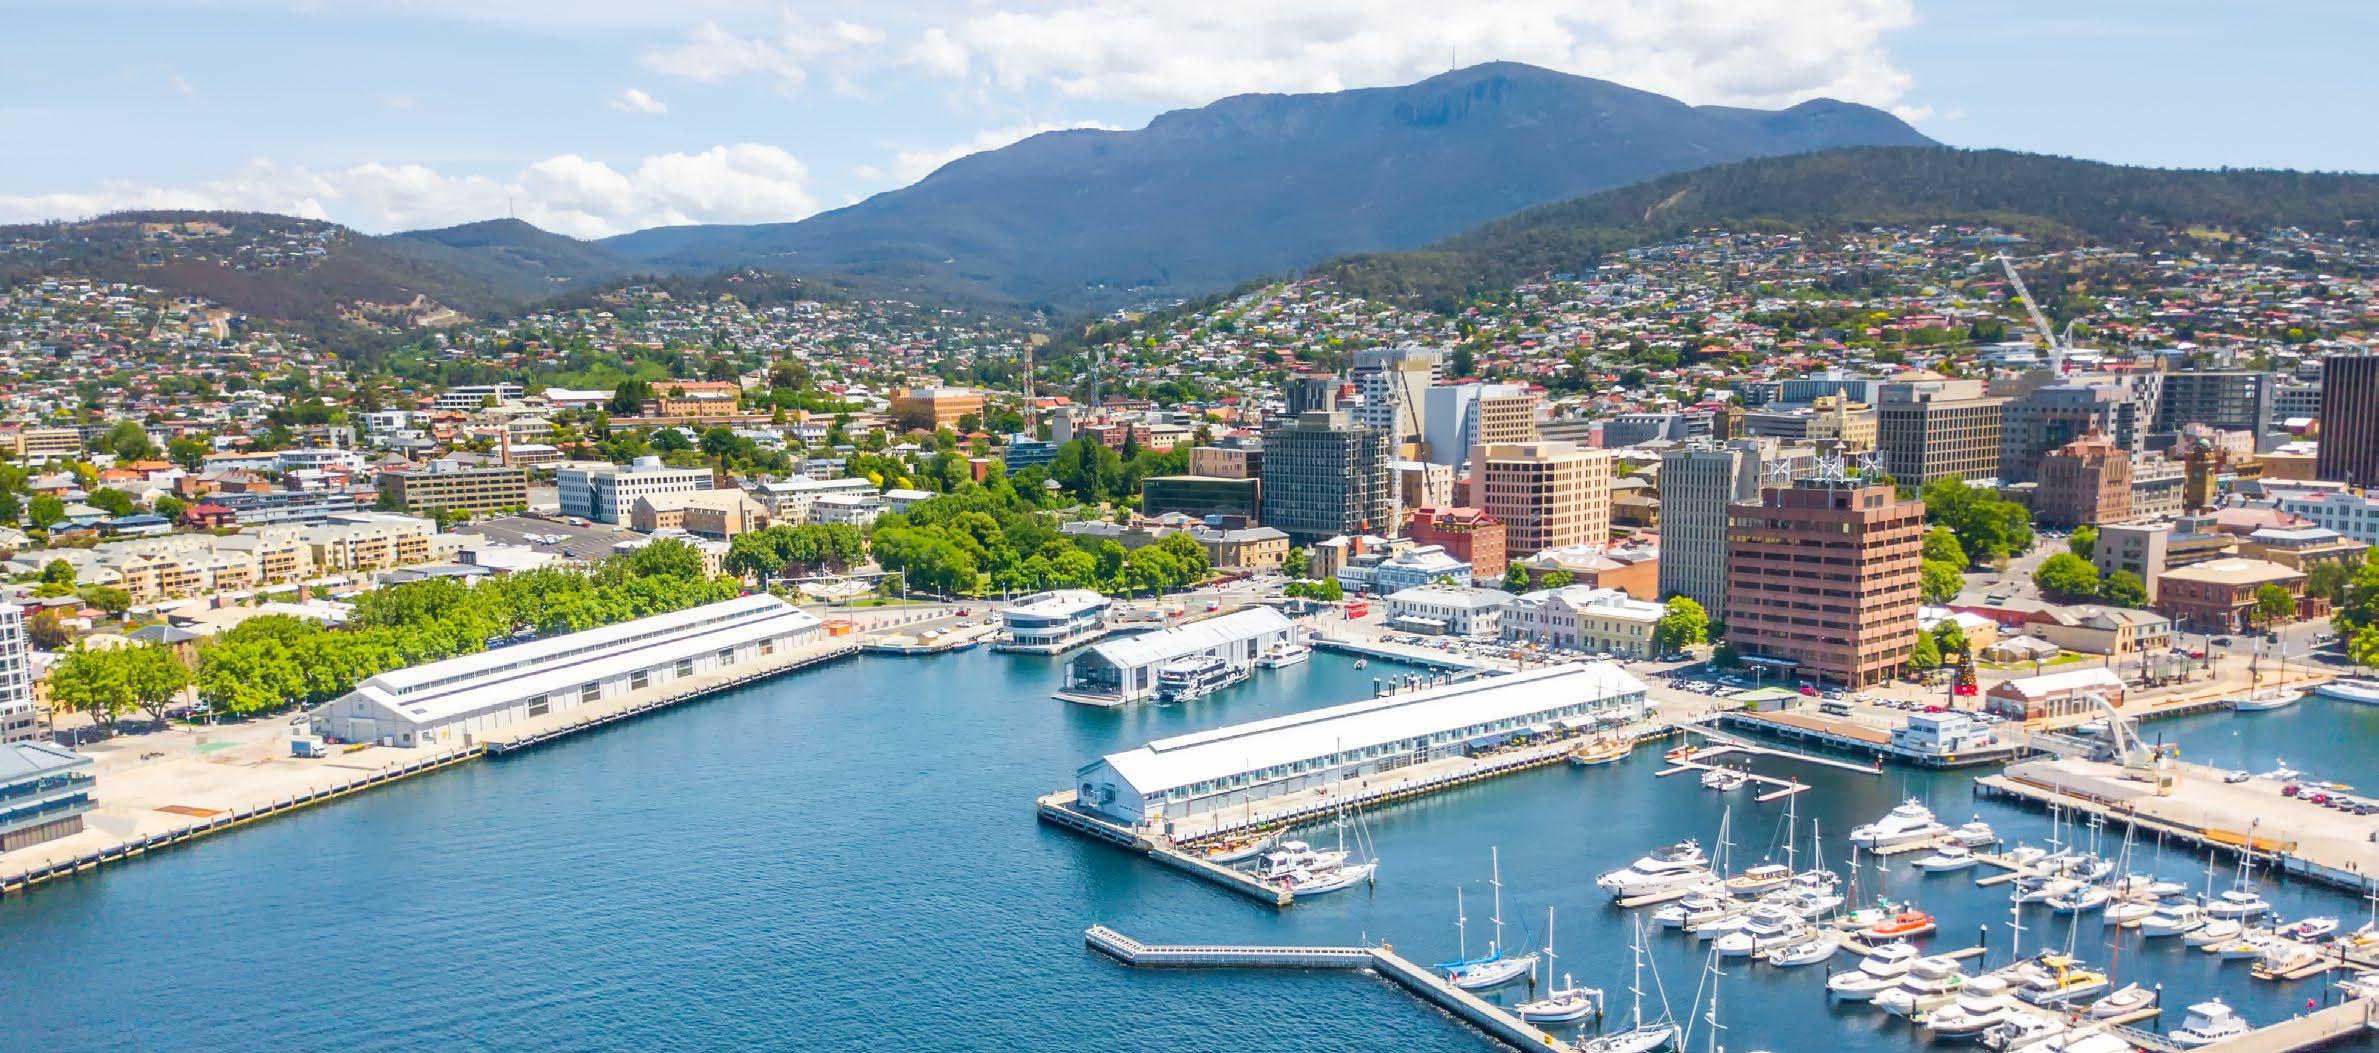
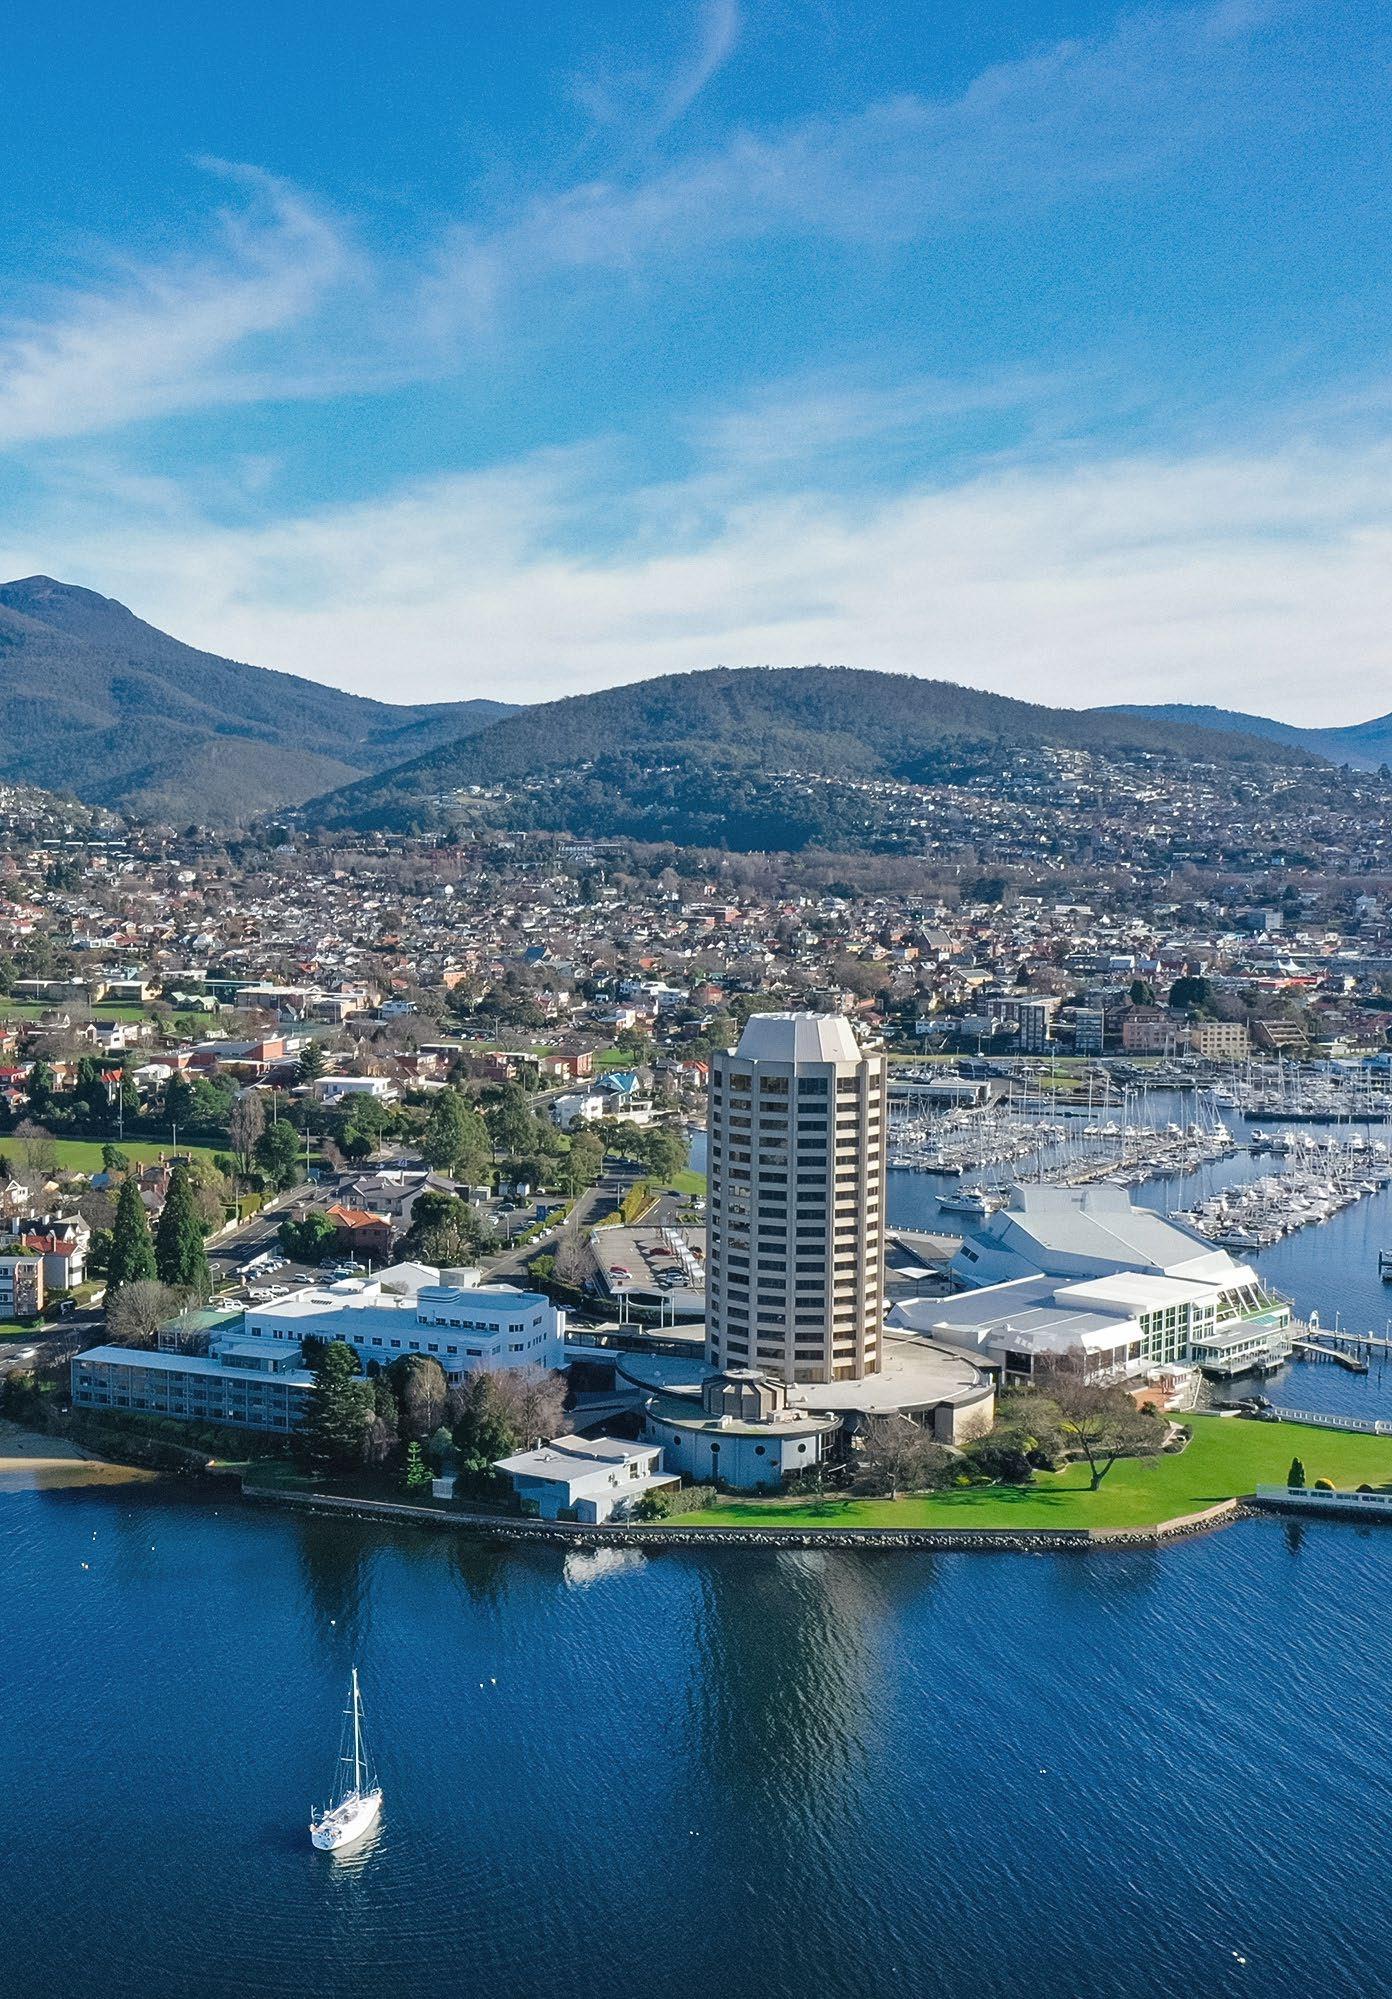
Hobart’s property market is quietly but powerfully shifting, creating a window of opportunity for buyers and investors alike. Beneath the surface of steady price rises lies a more compelling story: a city where opportunity is quietly shifting toward a new wave of affordable, well-connected suburbs.
This guide reveals where lifestyle meets value, pinpointing the hidden pockets within 10km of the Hobart CBD that are primed for growth.
With strong demand, ultra-tight rental conditions, and billions in new infrastructure on the horizon, Hobart’s next property hotspots aren’t coming, they’re already here.
Who this report is for.
First Home Buyers: Looking for more affordable entry points into
Investors: Seeking suburbs with solid rental yields, low vacancy rates and growth potential.
Upgraders/Owner-Occupiers: Those looking for liveable locations with strong amenities, infrastructure and long-term appeal.
Leveraging PRD’s proprietary research methodology, this report cuts through the noise, delivering clear insights into Hobart’s market and spotlighting suburbs where affordability, lifestyle, and growth potential align, helping you uncover real opportunities with confidence.
Market Overview.
Hobart’s property market is quietly entering a highgrowth phase, driven by strong demand, tight supply, and rising rents. Over the past 12 months to Q1 2026, median house prices increased by 2.0% to $755,000 and unit prices rose by 2.6% to $600,000, confirming steady long-term growth.
However, in the most recent quarter, prices have pulled back slightly houses down 6.0% and units down 2.5%, indicating a temporary cooling period.
Both houses and units are still increasing in value overall, but the recent dip suggests a brief pause in momentum, creating a short-term opportunity before the broader upward trend continues.
Hobart’s property market is experiencing a pronounced supply gap, creating strong conditions for future price growth. Demand continues to rise, highlighted by an 18.7% increase in house sales, yet new housing supply (596 dwellings and 81 units planned) remains insufficient to meet buyer needs. This imbalance is further intensified by an extremely tight 0.4% vacancy rate, well below the 3.0% healthy benchmark, meaning properties are being absorbed almost immediately.
At the same time, more than $2.5 billion in infrastructure and development projects are underway across Hobart, enhancing liveability and driving future demand.
Together, these factors point to ongoing upward pressure on prices, positioning the current market as a key opportunity for buyers and investors to enter before competition intensifies further.

House Sales by Price Bracket . Unit Sales by Price Bracket .





$600,000
$700,000
$800,000





than $449,999
$450,000 to $549,999
$550,000 to $649,999
$650,000 to $749,999
$750,000 and above
Average Vendor Discount.





Average vendor discounts between Q1 2025 and Q1 2026 have swung significantly, from a discount to a premium of 3.6% for houses and 1.9% for units.
The Hobart Metro& market now favours sellers, as houses are selling above the first list price. This is the third consecutive premium vendor discount for both houses and units in the past 12 months, suggesting time is of the essence. With very low new housing supply planned for construction in 2026, buyers must act fast before higher premiums occur.
The dominant proportion of houses sold in Hobart Metro in 2025/2026# was in the mid-price bracket $700,000 to $799,999 (25.5%). That said, 24.0% of houses were sold in the premium price bracket of $900,000 and above.
On the other hand, units recorded most sales in the premium price point of $750,000 and above (23.2%). More affordable prices are still available, with 21.9% of houses sold at $600,000 - $699,999. This trend suggests there is a home for every budget in Hobart Metro.


Rental Growth 2026.
House rental yields in Hobart Metro were 3.5% as of March 2026, outperforming Sydney and Melbourne Metros (2.8% and 3.1%, respectively). This was paired with a 5.1% increase in median house rental price in the past 12 months to Q1 2026, at $620 per week, along with an 8.0% increase in the number of houses rented (to 621 rentals in Q1 2026).
The median unit rental price also increased, by 4.0% in the 12 months to Q1 2026, to $520 per week, and the number of units rented has remained stable (at 366 rentals). Overall, this suggests a highly demanded house and unit rental market, which creates a favourable investment alternative to Sydney and Melbourne Metro.
2-bedroom houses and 3+ bedroom units provided investors with the highest annual rental growth possible, of +12.5% and +10.2%, at $540 and $650 per week, respectively. All rental property types have increased in median rental prices.
In March 2026, Hobart Metro recorded a vacancy rate of 0.4%, well below Sydney Metro (1.1%) and Melbourne Metro (1.4%). In the past 12 months, vacancy rates have held relatively stable with a slightly declining pattern, which indicates a tighter rental market.
Furthermore, Hobart Metro’s vacancy rate of 0.4% is significantly below the Real Estate Institute of Australia's healthy benchmark of 3.0%. This vacancy rate indicates quicker occupancy of rental homes, which benefits investors, even if the median house and unit sales price (thus, entry price) has increased in the past 12 months to Q1 2026.

Rental Yield Comparison: 2026§ .
Rental Vacancy Rates 2026.
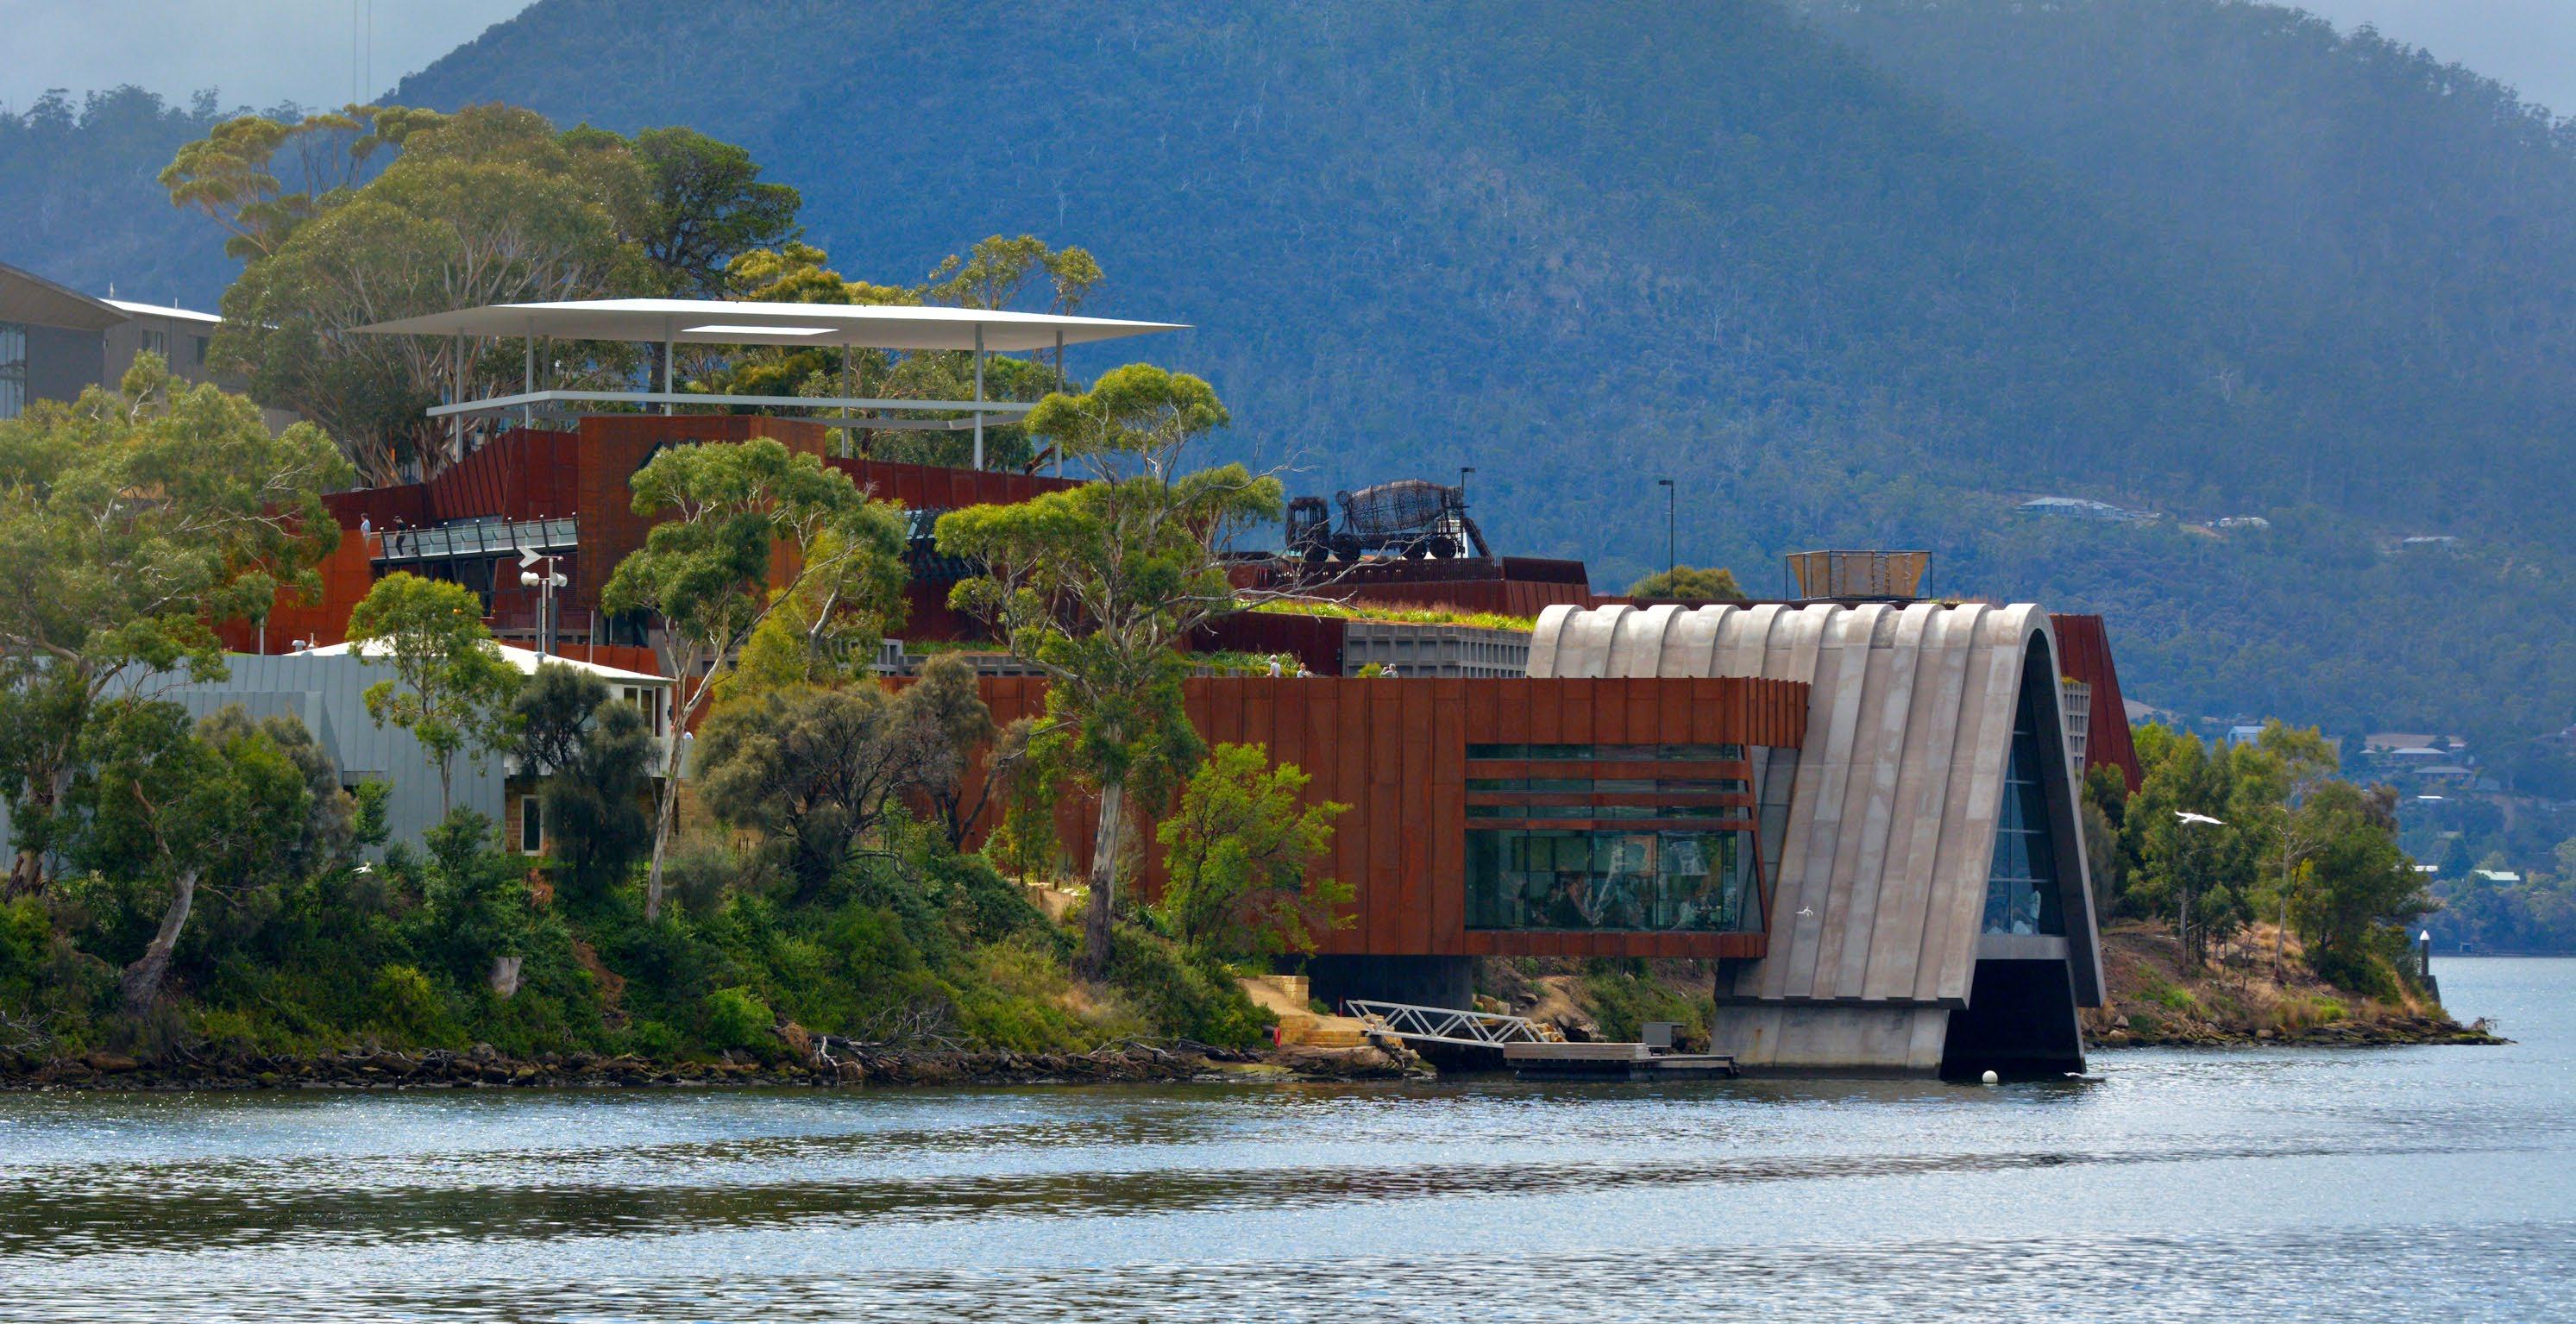
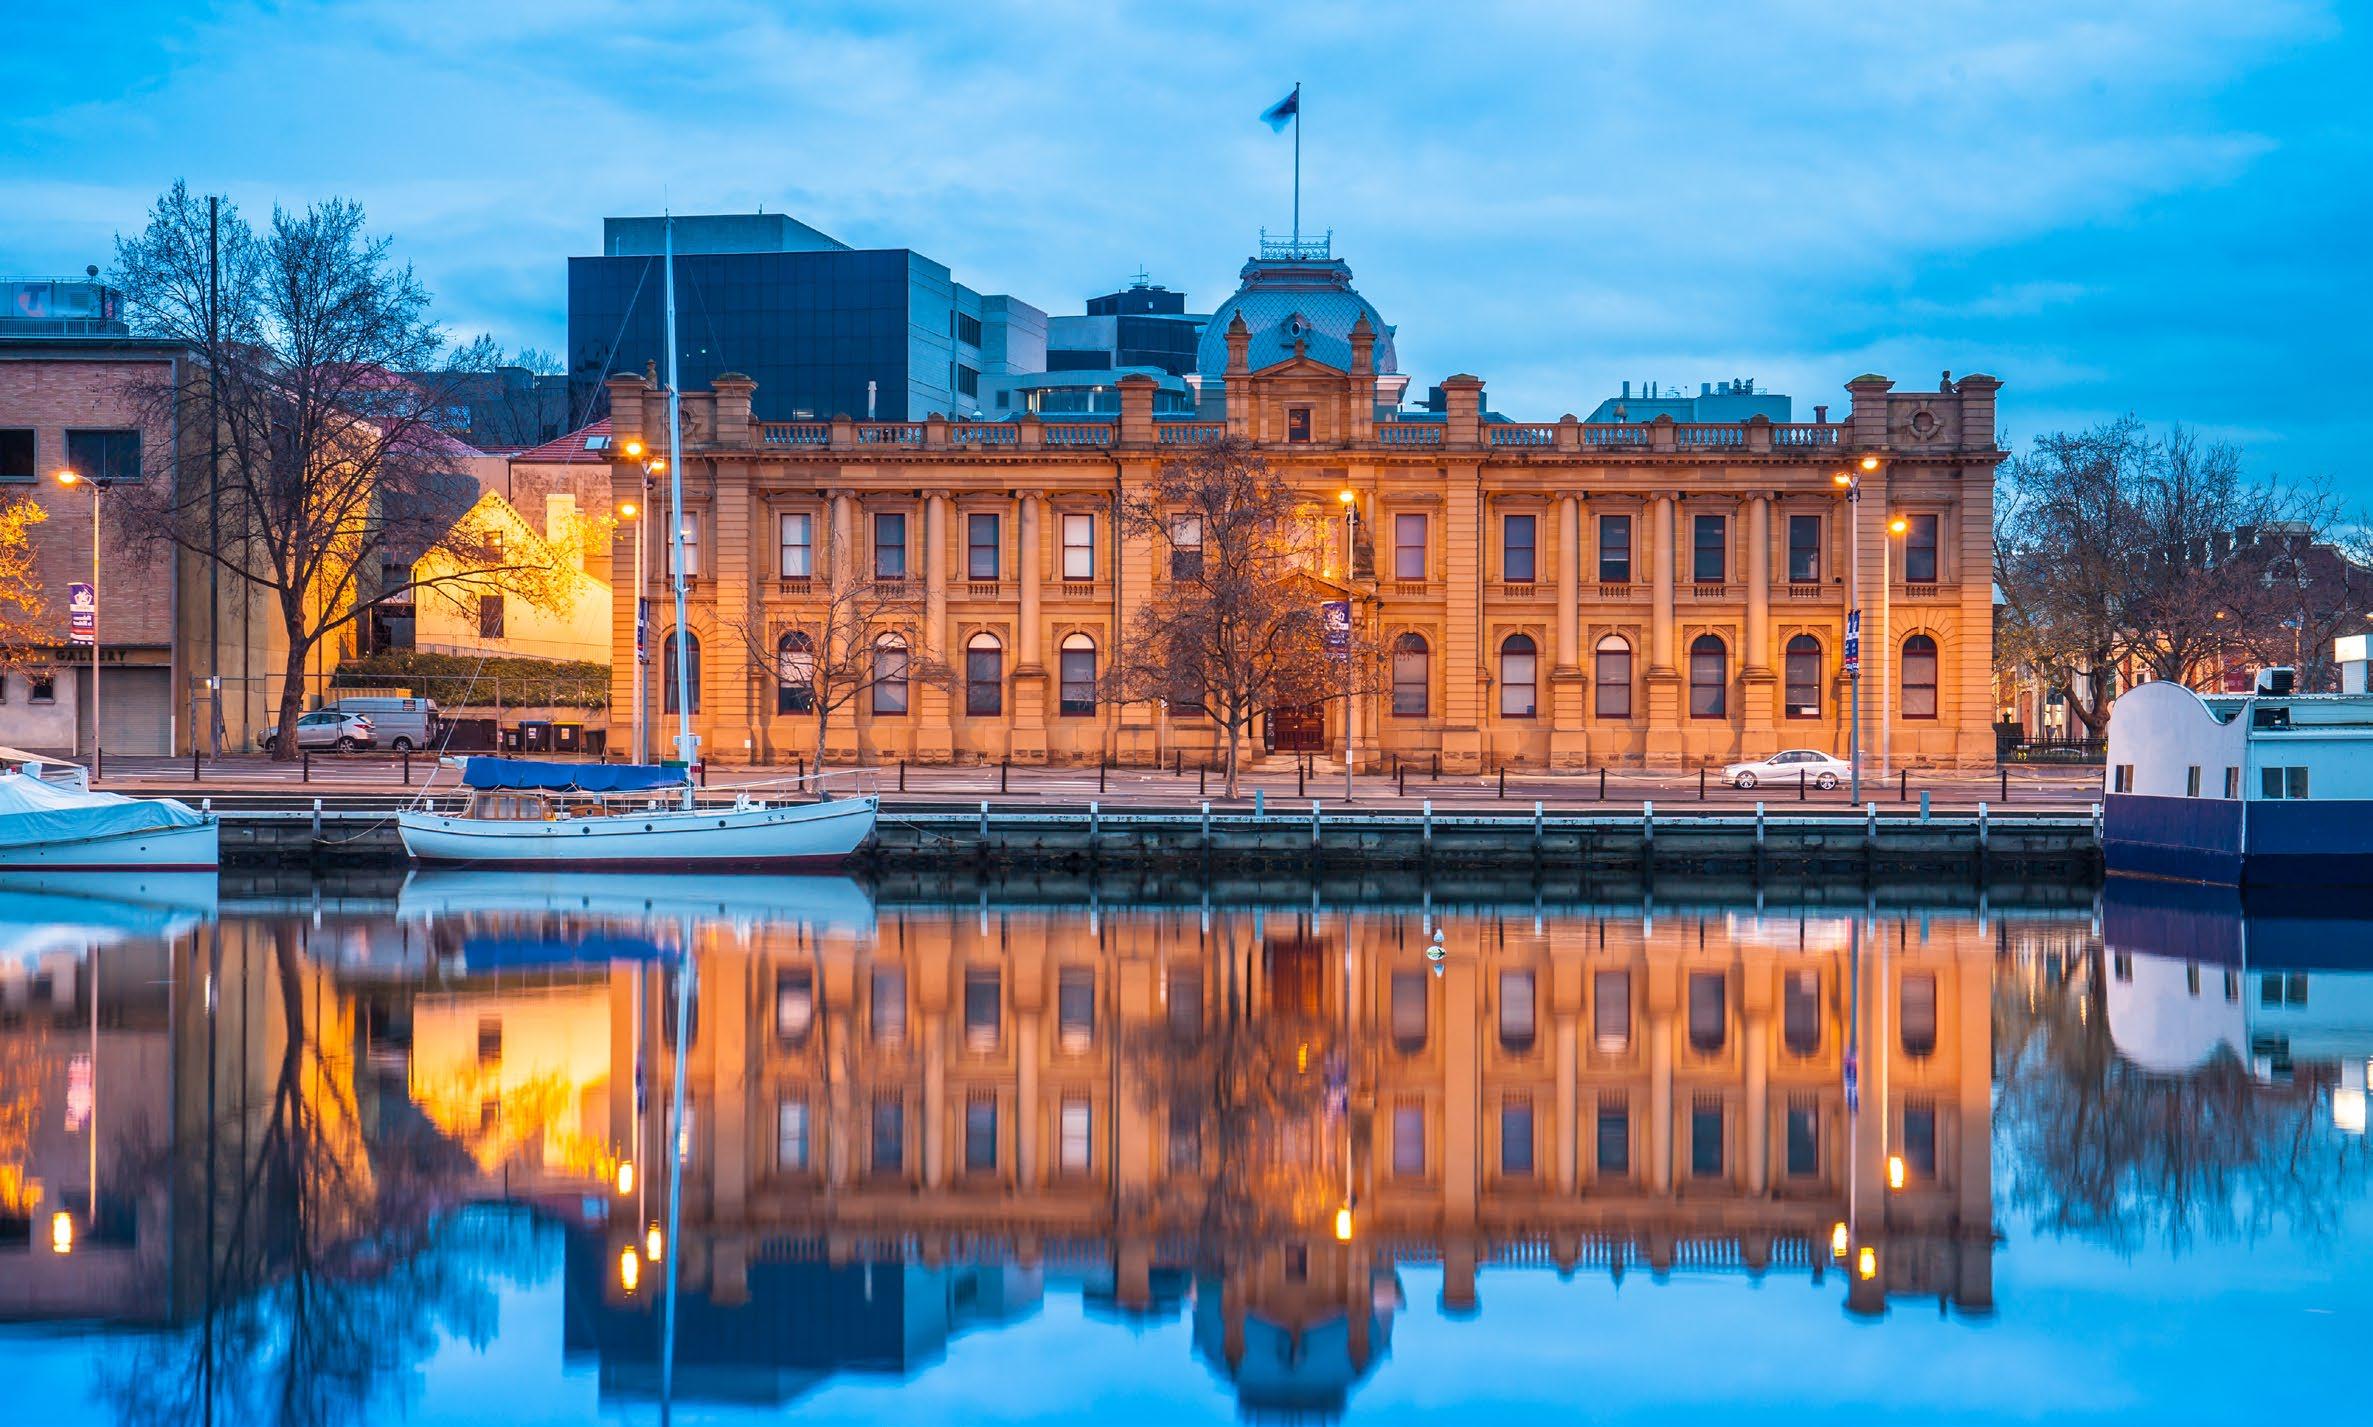
Berriedale, Hobart LGA,TAS.
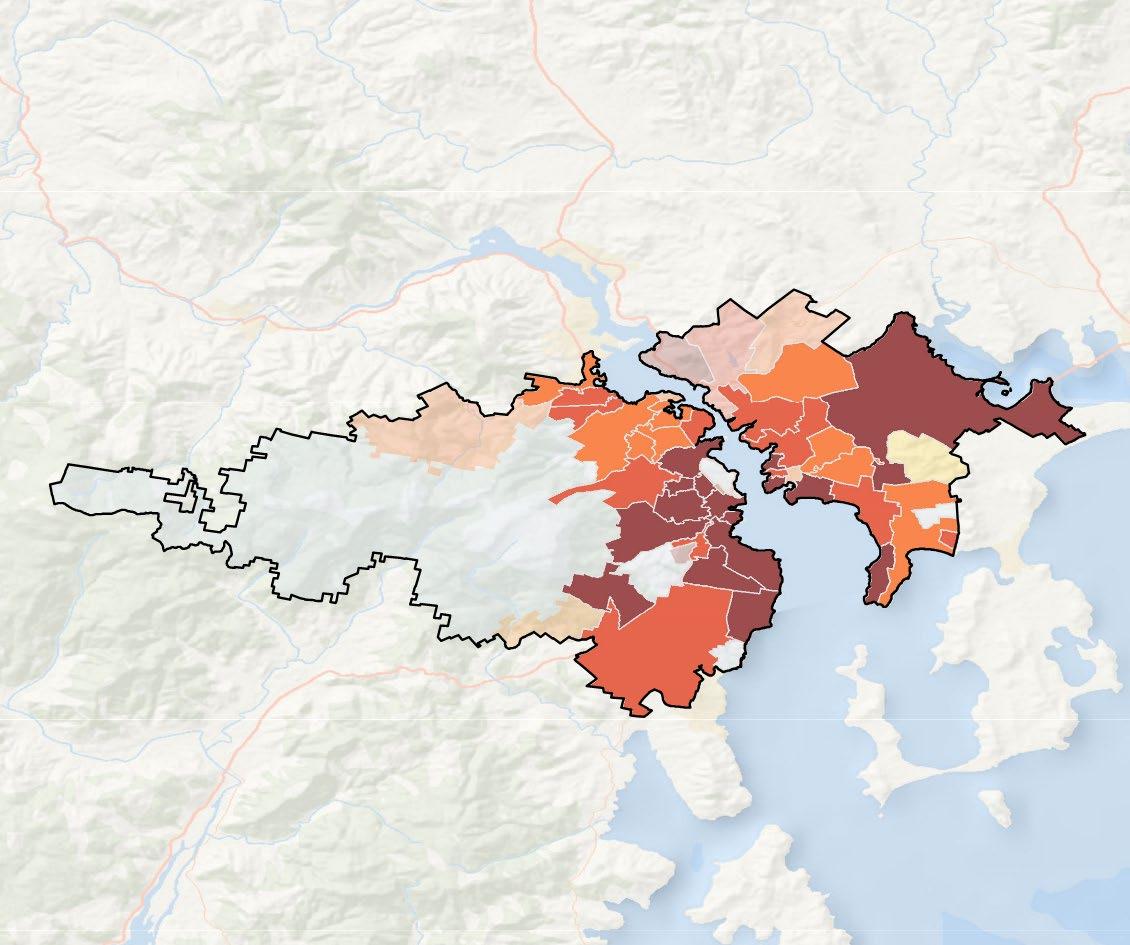
Median House Prices.
1 0KM FROM THE HOBART CBD | 2026*
LEGEND
.
Data not available
$0 - $500,000
$500,000 - $800,000
$800,000 - $1,000,000
$1,000,000 - $2,000,000
$2,000,000+
20km from CBD
Translucent colours for <20 sales
Brisbane Smart Move Suburbs Rental Yield .
Suburb
HOBART
Market Cycle Indicators.
Our easy-to-read clock format indicators show where Hobart’s house and unit markets currently sit in the market cycle, from peak through to recovery. They highlight whether conditions are strengthening or softening, helping buyers and investors understand timing, momentum, and where opportunities may be emerging across the city.
The 4 key market indicators:
Peak.
When prices are at or near their highest point, demand is strong, and growth starts to stabilise.
Downswing.
When the market begins to cool, buyer demand eases, and prices may plateau or decline.
Bottom.
When the market reaches its lowest point, conditions stabilise, and the groundwork is set for the next period of growth
Upswing.
When the market is gaining momentum, buyer confidence is rising, and property prices are beginning to increase.
The hands on the clocks indicate the current position of each property type in the market cycle.
HOUSE
GROWTH)
(MARKET COOLING)
Hobart’s house market is slowing but has not yet entered a downswing phase.
GROWTH)
COOLING)
Hobart’s unit market hasn’t reached it’s peak and is still gaining momentum, compared to Hobart’s housing market.

Smart Suburb Moves Near Hobart for Houses
Warrane.

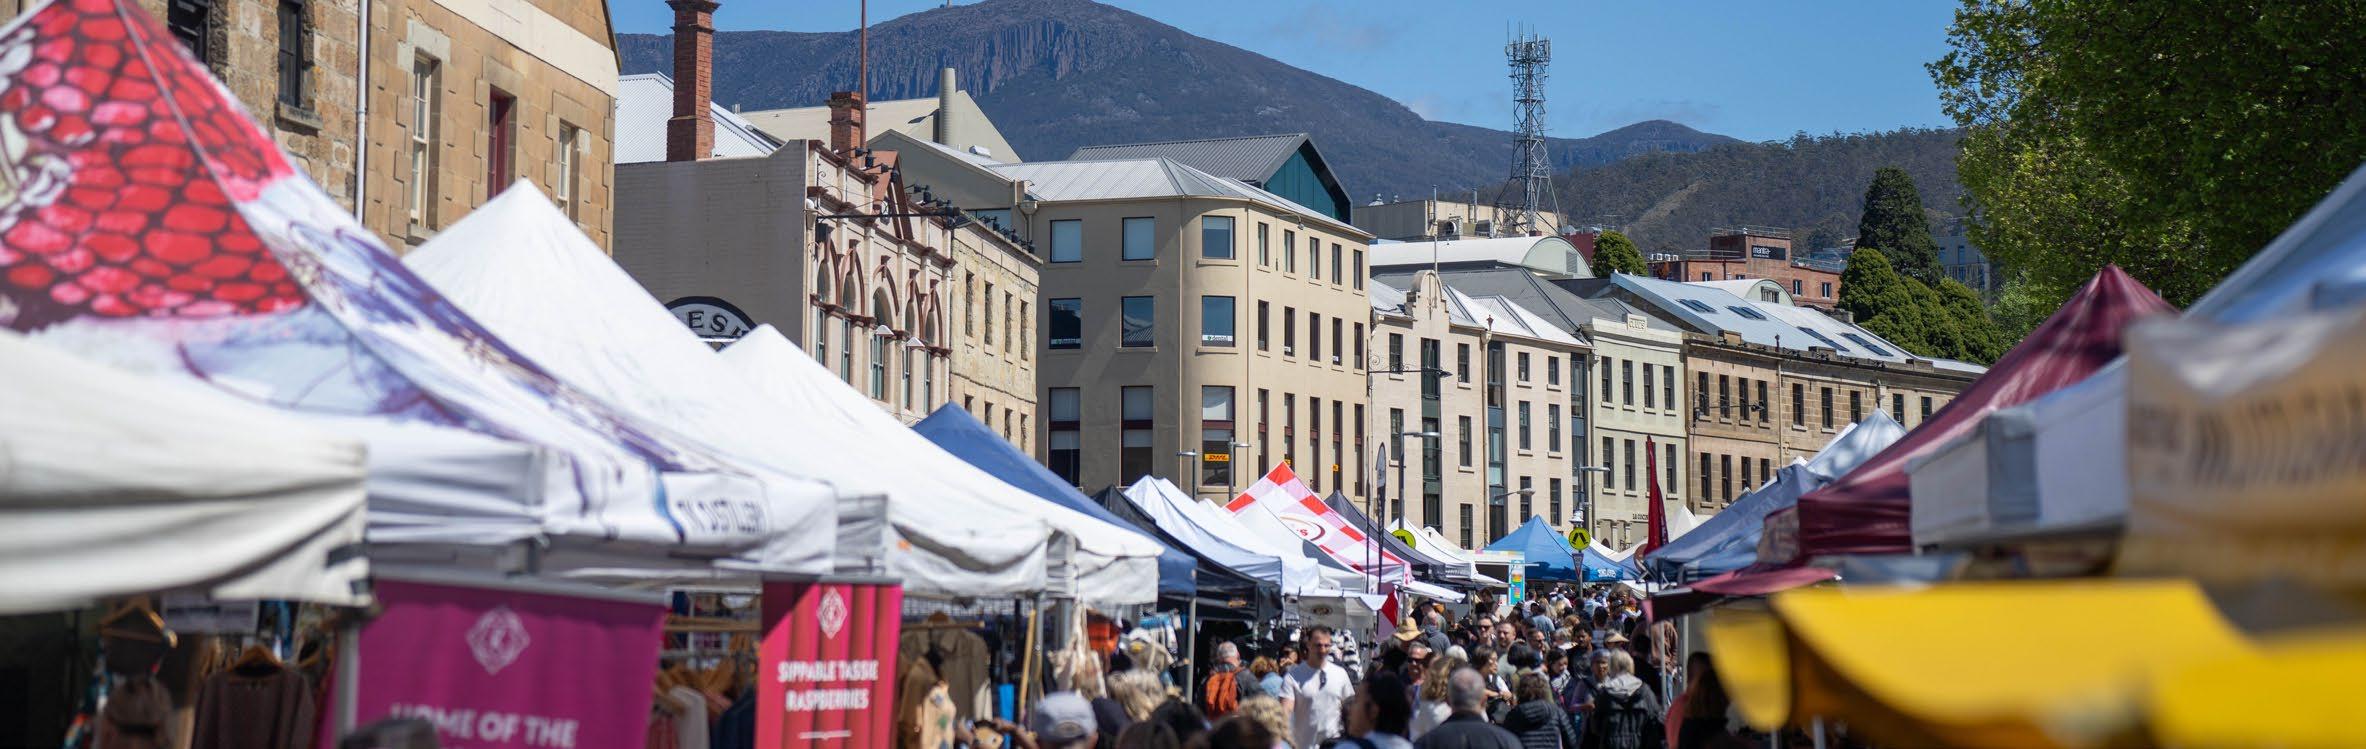
Salamanca Markets Hobart, TAS. 7 km south of Moonah.
Seven Miles Beach SevenMiles Beach,Tasmania LGA,TAS. 10kmsouthofRokeby.
Smart Suburb Moves Near Hobart for Units
Moonah.

Hobart LGA,TAS. 10km’s South from Moonah.
Glenorchy.


Risdon Brook Reservoir Risdon,Tasmania LGA,TAS. 9km north of Warrane.
Project Development Map 2026*.
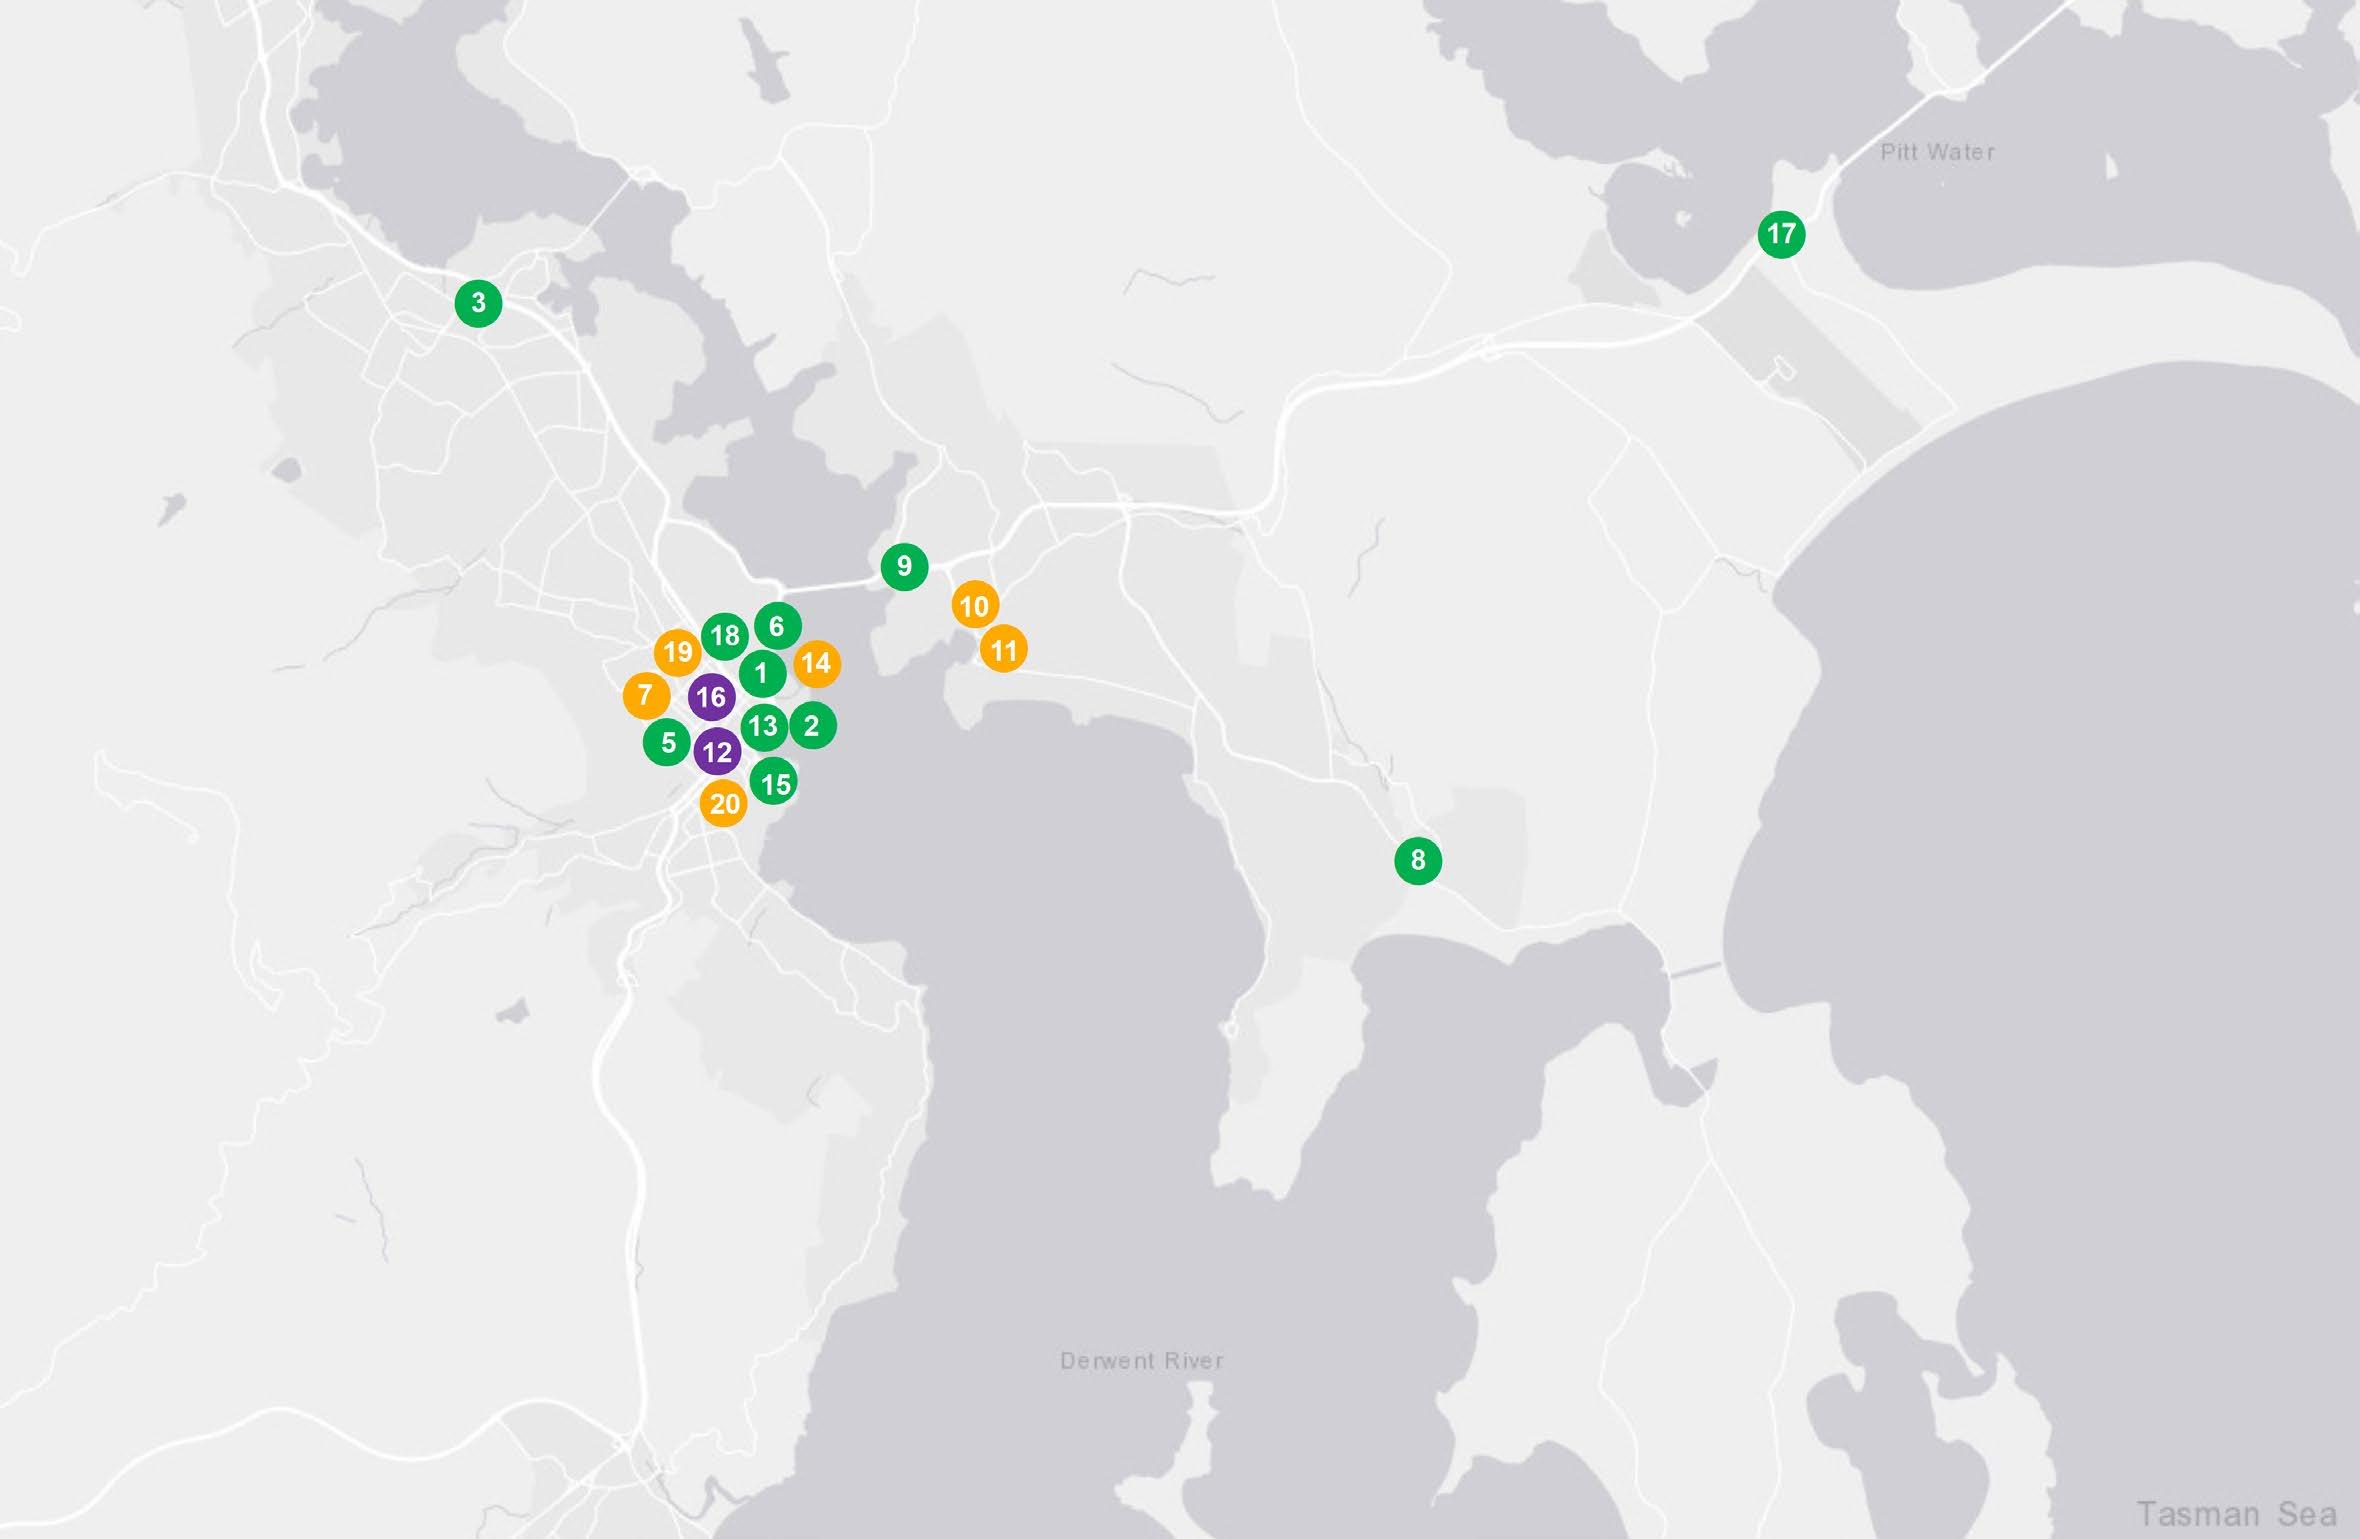



Macquarie Point AFL Stadium Arts, Culture, Entertainment & Sports Precinct (State Government)
Macquarie Wharf Number 6 Redevelopment (State Government)
Hobart Showgrounds Precinct - Stage 3Pavilion & Dwellings (450 Dwellings) (State Government)
Tasman Highway - Midway Point & Sorell Causeways & Mcgees Bridge Stages 1-2 (State Government) (Not Mapped)
Northern Suburbs Transit Corridor Between Glenorchy & Hobart (State Government)
Royal Hobart Hospital Emergency Department Expansion Phase 2 (State Government)
The Hanging Garden Precinct Mixed Use Development (10 Apartments/ Bars/ Restaurants/ Retail)
Rokeby Road - South Arm Road Upgrades (State Government)
Tasman Bridge Safety Barrier & Pathways Upgrade Project (State Government)
Kangaroo Bay Hotel Mixed Use Development (Hotel/ Serviced Apartments/ Shop/ Restaurants)
Additional Smart Moves Suburbs Near Hobart Metro.
To give buyers more choice and uncover additional value-packed opportunities, the tables below highlight a further seven suburbs beyond the top ten. These build on the house and unit locations featured earlier in the report.
Using the same rigorous selection methodology, these suburbs have been identified as strong alternatives, particularly for buyers looking to enter the market below Hobart Metro’s median house and/or unit prices. While they may not meet the benchmark required to rank as ‘key suburbs’ they still present compelling options for those seeking affordability, growth potential or a strategic entry point into the market.
Houses.
Units.
How We Selected The Top 10.
The Smart Moves: Capital Cities Edition for Hobart Metro report takes a deep dive into every suburb within a 10km radius of the Hobart CBD, uncovering where opportunities lie for today’s buyers. Each suburb was carefully assessed against a robust set of criteria to ensure it offers not just value, but long-term appeal.
Property performance.
To ensure meaningful insights, all suburbs included recorded a minimum of 10 sales transactions, providing a reliable data foundation. In line with current market conditions, each suburb demonstrates either positive or near-neutral price growth between 2025 and 2026.*
Investment appeal.
As of March 2026, selected suburbs offer rental yields that meet or exceed the Hobart Metro average, while maintaining vacancy rates at or below comparable levels highlighting their strength as investment locations.
Liveability factors.
Beyond numbers, lifestyle matters. Each suburb offers low crime rates, access to essential amenities within 5km (including schools, transport, green spaces, shopping and healthcare), and unemployment levels at or below the Queensland average. Together, these factors create vibrant, well-rounded communities that buyers can feel confident calling home.
Affordability advantage.
Affordability remains central to suburb selection. Each area featured has a median price below that of the Hobart Metro benchmark. Based on the Tasmanian average home loan of $521,021** (March Quarter 2026), buyers would need to account for a premium of 23.8% for houses and 5.6% for units to enter these markets. Notably, these premiums are significantly lower than those required for Hobart Metro (52.9% for houses and 10.3% for units), reinforcing the relative accessibility of these suburbs and their appeal to first-home buyers.
Growth and development outlook.
The suburbs identified are poised for growth, with new developments commencing in 2026 particularly across commercial and infrastructure sectors. This level of activity signals strong, sustainable economic momentum. In addition, a healthy pipeline of new, ready-to-sell housing ensures future supply for incoming buyers.
The result?
A curated selection of Hobart suburbs that strike the balance between affordability, growth potential, and everyday liveability, helping buyers make smarter, more confident property decisions.


PRD’s Research Division.
PRD’s property research division provides reliable and unbiased data, insights and consultancy to clients in both metropolitan and regional locations across Australia.
Our extensive research capabilities and specialised approach ensure our clients can make the most informed and financially sound decisions about residential and commercial properties.
Knowledge.
Access to accurate and objective research is the foundation of all good property decisions. PRD shares on-the-ground experience and decades of knowledge to deliver innovative and effective solutions to our clients.
We take a holistic approach and focus on understanding new issues impacting the property industry, such as the environment and sustainability, the economy, demographic and psychographic shifts, and commercial and residential design, and forecast future implications around such issues based on historical data and facts.
People.
Our in-house research team is skilled in deriving macro and micro quantitative information from multiple credible sources, so we can ensure we provide strategic advice and financially sound direction regarding property and market performance.

Research Services.
Our research services span over every suburb, local government area, and state within Australia. We have the ability and systems to monitor market movements, demographic changes and property trends.
We use our knowledge of market sizes, price structure and buyer profiles to identify opportunities for clients and provide market knowledge that is unbiased, thorough and reliable.
Our services include:
• Advisory & consultancy
• Market analysis including profiling & trends
• Primary qualitative & quantitative research
• Demographic & target market analysis
• Geographic information mapping
• Project analysis including product & pricing recommendations
• Rental & investment return analysis

MountWellington Hobart, TAS.



Scan the QR Code to locate your local PRD team.
of trusted, local guidance for life’s biggest moves.