Hunter Valley Market Update 2nd Half 2025

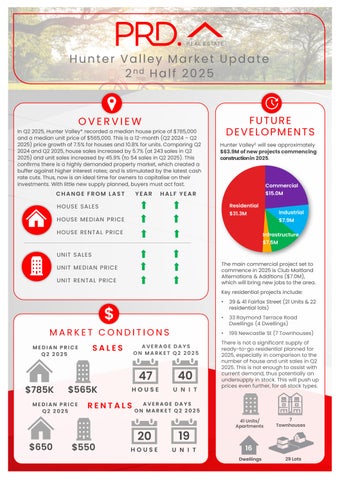
In Q2 2025, Hunter Valley* recorded a median house price of $785,000 and a median unit price of $565,000.This is a 12-month (Q2 2024– Q2 2025)price growth of 7.5%for houses and 10.8% for units. Comparing Q2 2024and Q2 2025,house sales increased by 5.7% (at 243sales in Q2 2025)and unit sales increased by 45.9%(to 54 sales in Q2 2025). This confirms there is a highly demanded property market, which created a buffer against higher interest rates; and is stimulated by the latest cash rate cuts. Thus,now is an ideal time for owners to capitalise ontheir investments. With little new supply planned, buyers must actfast.

HOUSE SALES
FROM LAST HOUSE MEDIAN PRICE HOUSE RENTAL PRICE
SALES


Hunter Valley£ will see approximately $63.9Mofnewprojectscommencing constructionin2025
HALF YEAR


RENTAL PRICE

MEDIAN PRICE Q2 2025
$785K $565K
MEDIAN PRICE Q2 2025
AVERAGE DAYS ON MARKET Q2 2025
47
AVERAGE DAYS ON MARKET Q2 2025
The main commercial project set to commence in 2025is Club Maitland Alternations & Additions ($7.0M), which will bring new jobs to the area.
Key residential projects include:
• 39& 41 Fairfax Street (21 Units & 22 residential lots)
• 33Raymond Terrace Road Dwellings (4 Dwellings)
• 199Newcastle St (7Townhouses) There is not a significant supply of ready-to-go residential planned for 2025, especially in comparison to the number of house and unit sales in Q2 2025. This is not enough to assist with current demand, thus potentially an undersupply in stock. This will push up prices even further, forall stock types.


AVERAGE VENDOR DISCOUNT*
Average vendor discount reflects the average percentage difference between the first list price and final sold price. A lower percentage difference (closer to 0.0%) suggests that buyers are willing to purchase close to the first asking price of a property.


Average vendor discounts between Q2 2024and Q2 2025 have tightened to -2.5% for houses and to -2.1% for units. The peak discount period has passed for houses (in Q1 & Q4 2024). Market conditions in Hunter Valley* still favour buyers, with vendors willing to accept below initial listing prices. However, with discounts tightening, this suggests a shift towards a seller’s market. Thus, buyers must act fast.
The suburb of East Maitland has been on par with the wider Maitland (LGA) in house median prices for the last 5 years, whereas unit median prices are slightly affordable. This continued tobe the case in 2025#, for bothproperty types; as East Maitland and wider LGA sees more stable price growth.
Most of the homes sold in Hunter Valley* in 2024/25#were in the middle-priced brackets of $650,000to $749,999 (27.3%) and $750,000to$849,999(23.7%). Units however present opportunities for buyers and owners, with most of the sales, 28.2%,in the more affordable price bracket of $500,000-$549,999;and 22.0%sales in the premium price point of $650,000and above. Overall, there is a home for all budgets, which is good news for first home buyers.
MARKET COMPARISON
Maitland House Maitland LGA House
The market comparison graph provides a comparative trend for median price of houses and units over the past 5 years. The main LGA chosen was based on their proximity to the main suburb analysed, which is East Maitland.


Less than$499,999
$500,000 to $549,999
$550,000 to $599,999
$600,000to $649,999
$650,000and above
RENTAL GROWTH 2025€
House rental yields in the Hunter Region¥ was 3.6% as of June 2025, below Maitland LGA (4.1%) but higher than Sydney Metro (2.7%). Thatsaid, median house rental price increased by 8.3%in the past 12 months to Q2 2025,to sit at $650per week. The number of houses rented increased as well, by 8.8% (to 235houses in Q2 2025). This indicates a highly-demanded and competitive house rental market in Hunter Valley¥, which is beneficial toinvestors.
3-bedroom houses have provided investors with +9.1%rental growth annually, achieving a median rent of $600per week.
The Hunter Region¥ recorded a vacancy rate of 1.1% in June 2025, below Maitland LGA average of 1.4%and Sydney Metro’s 1.6%. Vacancy rates have declined slightly in the past 12months, indicating a tighter rental market. Furthermore, a 1.1% vacancyrate is well below the Real Estate Institution of Australia’s healthy benchmark of 3.0%, indicating quicker occupancy of rental homes in the Hunter Region¥. This creates a conducive environment for investors, even if entry prices (median house and unit sale prices) have increased in the past 12 months to Q2 2025.
RENTAL VACANCY RATES 2025


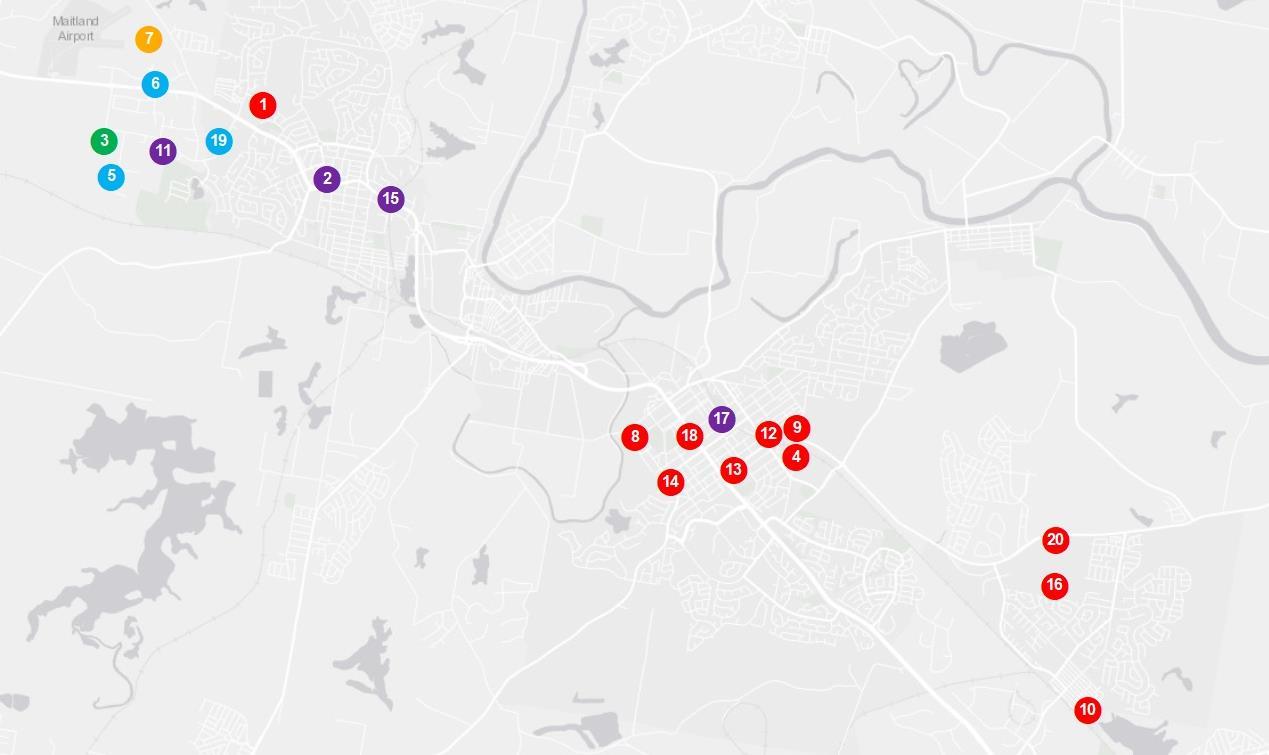
PROJECT DEVELOPMENT MAP 2025 ₳

HUNTER VALLEY

RESEARCH SERVICES
Our research services span over every suburb, LGA,and state within Australia; captured in a variety of standard and customised products, andinclude:
• Advisory and consultancy
• Market analysis including profiling and trends
• Primary qualitative and quantitative research
• Demographic and target market analysis
• Geographic information mapping
• Project analysis including product and pricing recommendations
• Rental and investment return analysis


OUR KNOWLEDGE
Access to accurate and objective research is the foundation of all good property decisions.
OUR PEOPLE
Our research team is made up of highly qualified researchers who focus solely on propertyanalysis.


REFERENCES
* Hunter Valley sales market data and key indicators encapsulates aggregate property market conditions within the suburbs of Aberglasslyn, Ashtonfield, East Maitland, Rutherford and Thornton.
** Estimated values are based on construction value provided by the relevant data authority and does not reflect commercial and/or re-sale value.
# 2024/25encapsulates sales transactions for the 2024 full year (01/01/2024 – 31/12/2024)and 1st half 2025 (01/01/2025 – 30/06/2025).
€ Annual rental growth is a comparison between Q2 2024 (01/04/2024 – 30/06/2024) and Q2 2025 (01/04/2025 – 30/06/2025) house median rent figures.
¥ Hunter Valley rental market data encapsulates aggregate property conditions within the postcode of 2323.
§ Rental yields shown are as reported as of June 2025.
₳ Project development map showcases a sample of upcoming projects only, due to accuracy of addresses provided by the data provider for geocoding purposes.
£ Projects refers to the top developments within the suburb of 2320, 2321, 2322 and 2323.
µ Estimated value is the value of construction costs provided by relevant data authority, it does not reflect the project’s sale/commercial value.
ψ Commencement date quoted for each project is an approximate only, as provided by the relevant data authority, PRD does not hold any liability to the exact date.
Source: APM Pricefinder, Cordell Connect database, SQM Research, Esri ArcGIS.
Disclaimer: PRD does not give any warranty in relation to the accuracy of the information contained in this report. If you intend to rely upon the information contained herein, you must take note that the information, figures and projections have been provided by various sources and have not been verified by us. We have no belief one way or the other in relation to the accuracy of such information, figures and projections. PRD will not be liable for any loss or damage resulting from any statement, figure, calculation or any other information that you rely upon that is contained in the material.
Prepared by PRD Research. © All medians and volumes are calculated by PRD Research. Use with written permission only. All other responsibilities disclaimed. © Copyright PRD 2025.