Gympie Market Update 2nd Half 2026

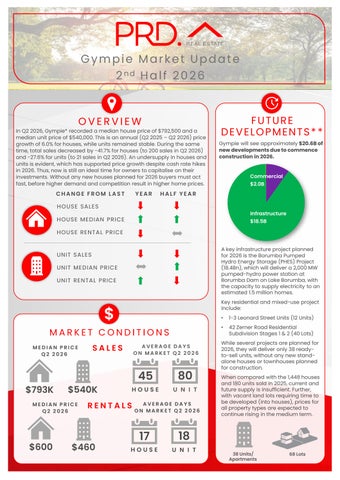
In Q2 2026, Gympie* recorded a median house price of $792,500and a median unit price of $540,000.This is an annual (Q2 2025 – Q2 2026)price growth of 6.0% forhouses, while units remained stable. During the same time, total sales decreased by -41.7% for houses (to 200sales in Q2 2026) and -27.6%for units (to 21 sales in Q2 2026). An undersupply in houses and units is evident, which has supported price growth despite cash rate hikes in 2026. Thus,now is still an ideal time for owners tocapitalise ontheir investments. Without any new houses planned for 2026 buyers must act fast, before higher demand and competition result in higher home prices.
CHANGE FROM LAST


Gympie will see approximately$20.6Bof newdevelopmentsduetocommence constructionin2026.
YEAR HALF YEAR
HOUSE SALES
HOUSE MEDIAN PRICE
HOUSE RENTAL PRICE
UNIT SALES
UNIT MEDIAN PRICE
UNIT RENTAL PRICE

MEDIAN PRICE Q2 2026
AVERAGE DAYS ON MARKET Q2 2026
45 $793K $540K
MEDIAN PRICE Q2 2026
AVERAGE DAYS ON MARKET Q2 2026

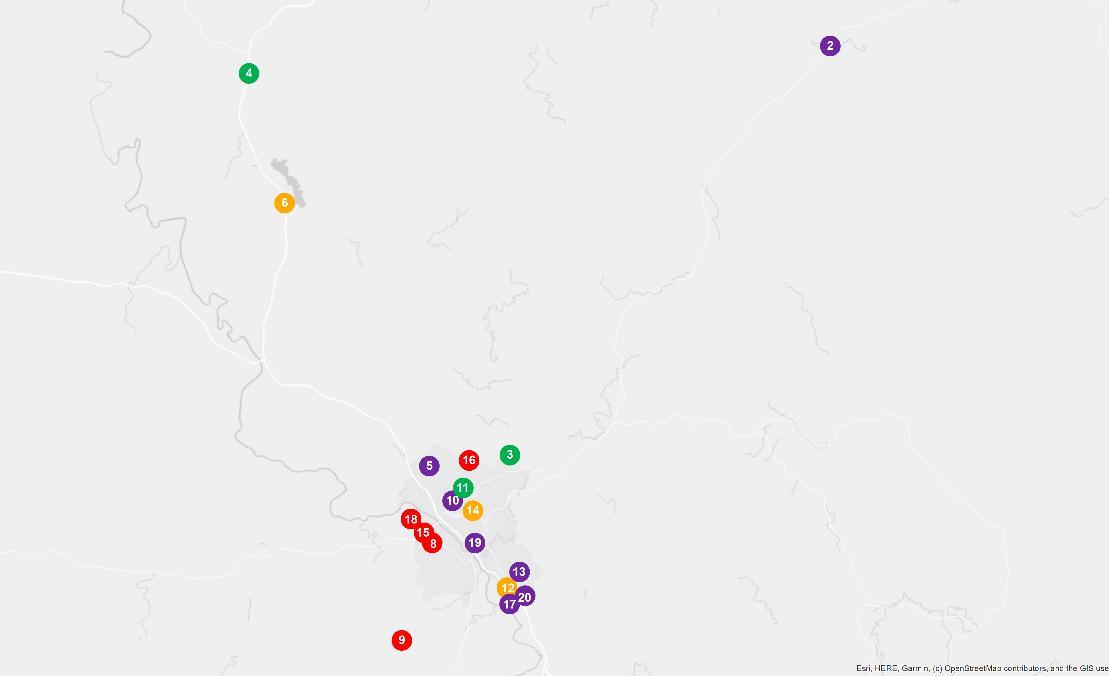
A key infrastructure project planned for 2026 is the Borumba Pumped Hydro Energy Storage (PHES) Project (18.4Bn),which will deliver a 2,000MW pumped-hydro power station at Borumba Dam onLake Borumba,with the capacity to supply electricity to an estimated 1.5million homes.
Key residential and mixed-use project include:
• 1-3 Leonard Street Units (12 Units)
• 42Zerner Road Residential Subdivision Stages 1 & 2(40 Lots)
While several projects are planned for 2026, they will deliver only 38 readyto-sell units, without any new standalone houses or townhouses planned for construction.
When compared with the 1,448houses and 180units sold in 2025,current and future supply is insufficient. Further, with vacantland lots requiring time to be developed (into houses), prices for all property types are expected to continue rising in the medium term. 80

AVERAGE VENDOR DISCOUNT*
Average vendor discount reflects the average percentage difference between the first list price and final sold price. A lower percentage difference (closer to 0.0%) suggests that buyers are willing to purchase close to the first asking price of a property.



Average vendor discounts between Q2 2025and Q2 2026 have tightened to-0.5% forhouses and widened to -3.4% for units. The Gympie* market continued tofavour buyers, with vendors still accepting offers below the first list price. Q2 2025 peak unit discount (of -3.4%) and stable price growth in the past 12 months creates an opportunity for first home buyers. In contrast, tightening house discounts, rising prices and nonew housing supply mean buyers should act fast.
The suburb of Gympie has historically offered a more affordable median house price than the Gympie Regional Council, while remaining onpar with the unit price. This trend continued in 2026#, with price growth in both the suburb and the wider LGA trending in the same direction.
The dominant proportion of homes sold in Gympie* in 2026# were in the premium price point above $950,000for houses (29.4%),which benefits owners. The most affordable price bracket remained available, with 14.9% of houses sold at less than $649,999.Further, unit sales were mostly in the most affordable segment of below $399,999(25.7%). Combined, this is good news forfirst home buyers. Overall, Gympie* offers housing options across a wide range of budgets.
MARKET COMPARISON
(4570) Unit
The market comparison graph provides a comparative trend for median price of houses and units over the past 5 years. The main LGA chosen was based on their proximity to the main suburb analysed, which is Gympie.


PRICE BREAKDOWN 2026#









$400,000 to $499,999
$500,000 to $599,999
$600,000 to $699,999
$700,000 and above
× Gympie* Small Vacant Land Median Price
× Gympie* VacantLand Sales
× Gympie* VacantLand Median
× Gympie* Acreage Land Sales
× Gympie* Acreage Land Median Price

MARKET COMPARISON
COMMENTS
In the past 12months to 2026#,Gympie* saw price growth and less sales across all types of land***.
• Small vacant land (below 1,000sq m): 12sales, $340,000 median price, 6.3% growth
• Vacant land (1,001-2,999sq m): 17sales, $362,500median price, 5.1% growth
• Acreage land (3,000-6,000sq m):16 sales, $420,000 median price, 3.1% growth
2026#saw the lowest number of sales in the past 5years, which confirms a clear undersupply. This has supported price growth for all land types amid cash rate hikes in 2026.
In 2025and 2026#,most sales were in the most affordable price point of under $324,999for small vacant land (49.3%) and vacantland (37.0%). Acreage land sales were mostly in the middle-price bracket between $375,000and $424,999 (42.3%). This creates an opportunity for buyers. The premium market is active; with 4.9% of small vacantland, 23.3%of vacantland and 11.3%of acreage land sold above $475,000. This benefits owners looking to transact and capitalize on their investments Land sales have occurred across multiple price points, offering buyers a greater choice in the market.

The market comparison graph provides a comparative trend for Small vacant land, Vacant land and Acreage land*** median prices over the past 5 years in Gympie*.
















RENTAL GROWTH 2026€
House rental yield in Gympie¥ was 3.6%as of June 2026, higher than Gympie Regional Council (3.1%) and Brisbane Metro (3.1%). Median house rental price in the past 12months toQ2 2026 did slightly soften (by -3.2%), at $600 per week. However, the number of houses rented also decreased, by -19.9% (to 119 houses in Q2 2026). There is still a high demand for rental homes, however rental price growth have slowed slightly after a rapid increase in the past 24months.
3-bedroom houses have provided investors anannual rental growth of +10.5%, achieving a median rent of $580per week.
Gympie¥ recorded a vacancy rate of 1.2%in June 2026,lower than Gympie Region’s average 2.0% but higher than Brisbane Metro’s 1.1%. Vacancy rates increased over the past 12 months, due toinvestors re-entering the market However, a 1.1%vacancy rate is well below the Real Estate Institute of Australia’s healthy benchmark of 3.0%, suggesting quicker occupancy of rental properties. This confirms a conducive and sustainable environment forinvestors, even if the median house sale price (thus, entry price) has increased in the past 12months to Q22026.
RENTAL VACANCY RATES 2026

RENTAL YIELD 2026§
PROJECT DEVELOPMENT MAP 2026


RESEARCH SERVICES
Our research services span over every suburb, LGA,and state within Australia; captured in a variety of standard and customised products, andinclude:
• Advisory and consultancy
• Market analysis including profiling and trends
• Primary qualitative and quantitative research
• Demographic and target market analysis
• Geographic information mapping
• Project analysis including product and pricing recommendations
• Rental and investment return analysis
OUR KNOWLEDGE
Access to accurate and objective research is the foundation of all good property decisions.
OUR PEOPLE
Our research team is made up of highly qualified researchers who focus solely on propertyanalysis.










REFERENCES
* Gympie sales market data and key indicators encapsulates aggregate property market conditions within Gympie Regional Council local government area (LGA).
** Estimated values are based on construction value provided by the relevant data authority and does not reflect commercial and/or re-sale value.
*** Gympie land data encapsulates aggregate market conditions across the Gympie Regional Council Local Government Area (LGA), comprising small vacant land below 1,000 sq m, vacant land between 1,001 and 2,999 sq m and acreage land between 3,000 and 6,000 sq m.
# 2026 encapsulates sales transactions for the 1st half year (01/01/2026 – 30/06/2026)only, other years encapsulates sales transactions for the full year (i.e 01/01 to 31/12 of the relevant year).
€ Annual rental growth is a comparison between Q2 2025 (01/04/2025 – 30/06/2025) and Q2 2026 (01/04/2026 – 30/06/2026) house median rent figures.
¥ Gympie rental market data encapsulates aggregate property conditions within the postcode of 4570.
§ Rental yields and vacancy rates shown are as reported as of May 2026.
₳ Project development map showcases a sample of upcoming projects only, due to accuracy of addresses provided by the data provider for geocoding purposes.
£ Projects refers to the top developments within Gympie Regional Council local government area (LGA).
µ Estimated value is the value of construction costs provided by relevant data authority, it does not reflect the project’s sale/commercial value.
ψ Commencement date quoted for each project is an approximate only, as provided by the relevant data authority, PRD does not hold any liability to the exact date.
Source: APM Pricefinder, Cordell Connect database, SQM Research, Esri ArcGIS.
Disclaimer: PRD does not give any warranty in relation to the accuracy of the information contained in this report. If you intend to rely upon the information contained herein, you must take note that the information, figures and projections have been provided by various sources and have not been verified by us. We have no belief one way or the other in relation to the accuracy of such information, figures and projections. PRD will not be liable for any loss or damage resulting from any statement, figure, calculation or any other information that you rely upon that is contained in the material.
Prepared by PRD Research. © All medians and volumes are calculated by PRD Research. Use with written permission only. All other responsibilities disclaimed. © Copyright PRD 2026.