Ballarat Market Update 2 nd H a l f 2 0 2 6
OVERVIEW
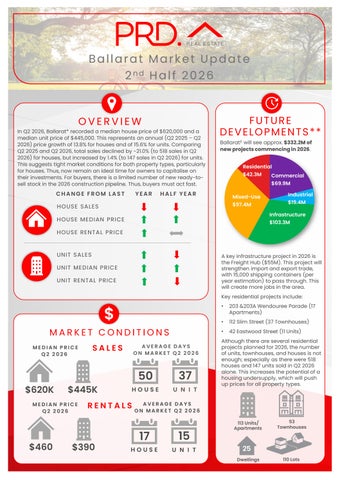
In Q2 2026, Ballarat* recorded a median house price of $620,000 and a median unit price of $445,000. This represents an annual (Q2 2025 – Q2 2026) price growth of 13.8% for houses and of 15.6% for units. Comparing Q2 2025 and Q2 2026, total sales declined by -21.0% (to 518 sales in Q2 2026) for houses, but increased by 1.4% (to 147 sales in Q2 2026) for units. This suggests tight market conditions for both property types, particularly for houses. Thus, now remain an ideal time for owners to capitalise on their investments. For buyers, there is a limited number of new ready-tosell stock in the 2026 construction pipeline. Thus, buyers must act fast.
CHANGE FROM LAST
YEAR
FUTURE DEVELOPMENTS** Ballarat£ will see approx. $332.2M of new projects commencing in 2026. Residential $42.3M
Commercial $69.9M
HALF YEAR
Mixed-Use $97.4M
HOUSE SALE S
Industrial $19.4M Infrastructure
HOUSE ME DIAN PRICE
$103.3M
HOUSE RE NTAL PRICE
UNIT SALE S
A key infrastructure project in 2026 is the Freight Hub ($55M). This project will strengthen import and export trade, with 15,000 shipping containers (per year estimation) to pass through. This will create more jobs in the area.
UNIT ME DIAN PRICE UNIT RE NTAL PRICE
Key residential projects include:
$ MARKET CONDITIONS MEDIAN PRICE Q2 2026
$620K
$445K
MEDIAN PRICE Q2 2026
$460
SALES
AVERAGE DAYS ON MARKET Q2 2026
50
37
HOUSE
U N I T
RENTALS
$390
•
203 &203A Wendouree Parade (17 Apartments)
•
112 Slim Street (37 Townhouses)
•
42 Eastwood Street (11 Units)
Although there are several residential projects planned for 2026, the number of units, townhouses, and houses is not enough; especially as there were 518 houses and 147 units sold in Q2 2026 alone. This increases the potential of a housing undersupply, which will push up prices for all property types.
AVERAGE DAYS ON MARKET Q2 2026
17
15
HOUSE
U N I T
113 Units/ Apartments
53 Townhouses
25 Dwellings
110 Lots
%
AVERAGE VENDOR DISCOUNT*
Average vendor discount reflects the average percentage difference between the first list price and final sold price. A lower percentage difference (closer to 0.0%) suggests that buyers are willing to purchase close to the first asking price of a property.
-3.0%
-3.9%
-1.1%
-1.4%
-3.3%
-1.2%
-3.0%
-1.9%
-3.8%
-5.6%
-6.2%
-2.0%
-4.9%
-1.0%
-6.4%
Change from Listing to Sale Price
0.0%
-4.0% -5.0% -6.0% -7.0% Q1 2025
Q2 2025 Q3 2025 Q4 2025
House
Q1 2026
Q2 2026
Unit
Average vendor discounts between Q2 2025 and Q2 2026 have tightened to -3.9% for houses and -1.1% for units. Market conditions in Ballarat* still favours buyers, as sellers continue to accept below the first list price. That said Q2 2026 records a lesser discount compared to 12 months prior, indicating a shift towards a seller’s market. Buyers must act fast, especially with limited new supply. in the past 5 years to 2026# the suburb of Ballarat has slightly outperformed the Ballarat Local Government Area (LGA) in terms of both house and unit median price. This trend continued in 2026#, with both the suburb and the LGA median prices trending in the same direction. The dominant proportion of homes sold in Ballarat* in 2026# were in the more affordable price point of $550,000 to $649,999 for houses (29.8%) and $400,000 to $499,999 for units (40.5%). This brings positive news for first-home buyers, especially in a higher interest rate environment. The premium price market have continued to strengthen, with 13.9% of houses sold above $750,000 and 6.4% of units sold above $600,000. This benefits homeowners who are looking to transact and capitalise on their investment. Overall, Ballarat* continues to provide multiple housing opportunities for buyers across a wide range of budgets.
MARKET COMPARISON
Ballarat (3350) House
Ballarat LGA House
Ballarat (3350) Unit
Ballarat LGA Unit
$800,000 $600,000 $400,000 $200,000 $0 2022
2023
2024
2025
2026#
The market comparison graph provides a comparative trend for median price of houses and units over the past 5 years. The main LGA chosen was based on their proximity to the main suburb analysed, which is Ballarat.
$
PRICE BREAKDOWN 2026# UNITS SOLD
HOUSES SOLD 13.9%
12.1%
Less than $449,999
14.5%
6.4%8.5%
$450,000 to $549,999
16.6%
27.6%
$400,000 to $499,999 $500,000 to $599,999
$650,000 to $749,999
29.8%
$300,000 to $399,999
30.2%
$550,000 to $649,999
$750,000 and above
Less than $299,999
40.5%
$600,000 and above
RENTAL GROWTH 2026 € House rental yield in Ballarat¥ was 3.4% as of June 2026, higher than Melbourne Metro (3.2%). This is paired with a 6.5% growth in the median house rental price in the past 12 months to Q2 2026, to $460 per week; along with a -13.4% decline in the number of houses rented (to 354 houses in Q2 2026). This is an undersupplied house rental market. With a more affordable entry price compared with Melbourne Metro, Ballarat¥ is an attractive investment alternative. 3-bedroom houses have provided investors with +7.1% rental growth annually, achieving a median rent of $450 per week.
2 BEDROOMS
+5.4%
3 BEDROOMS
+7.1%
Ballarat¥ recorded a vacancy rate of 0.6% in June 2026, on par with Ballarat LGA’s average of 0.6%, but lower than Melbourne Metro’s 2.0%. Vacancy rates have decreased in the past 12 months, which suggests a tighter rental market. Furthermore, a 0.6% vacancy rate is significantly below the Real Estate Institute of Australia’s healthy benchmark of 3.0%, suggesting quicker occupancy of rental homes in Ballarat¥. This is a conducive environment for investors, even with higher median house and unit sales prices (thus, entry price) in the past 12 months to Q2 2026.
4 BEDROOMS
+4.2%
RENTAL VACANCY RATES 2026
3.5% 3.0% 2.5% 2.0% 1.5% 1.0% 0.5% 0.0%
Jun-26
Mar-26
Dec-25
Sep-25
Melbourne Metro
Jun-25
Mar-25
Ballarat LGA
Dec-24
Sep-24
Jun-24
Mar-24
Dec-23
Sep-23
Jun-23
Ballarat (3350)
REIA 'Healthy' Benchmark
%
RENTAL YIELD 2026 §
3.4%
3.3%
3.2%
4.2%
4.7%
4.6%
Ballarat¥
Ballarat LGA
Melbourne Metro
Ballarat¥
Ballarat LGA
Melbourne Metro
PROJECT DEVELOPMENT MAP 2026₳ LEGEND Commercial Infrastructure Industrial Mixed-Use Residential
BALLARAT
Project£
#
Type
Estimated Commence Valueµ Dateψ
1
Ballarat Freight Hub Package 2 (State Government)
Infrastructure
$55,000,000
13/04/2026
2
63 Mahers Road Mixed Use Development (Residential Hotel | Brewery | Distillery | 5 Warehouses)
Mixed-use
$49,000,000
27/10/2026
3
102-108 Humffray Street Apartments & Commercial Building Stages 1 & 2 (74 Apartments | Commercial Building)
Mixed-use
$40,000,000
14/09/2026
4
18 Lilburne Street Hospital
Commercial
$30,000,000
15/12/2026
5
Ballarat Intermodal Freight Hub Terminal - BWEZ
Commercial
$23,500,000
24/09/2026
6
Ballarat Regional Animal Shelter (Local Government)
Infrastructure
$12,000,000
18/05/2026
7
The Lake Residences Lake Wendouree Apartments (17 Apartments)
Residential
$12,000,000
16/11/2026
8
222 Mair Street Office Building
Commercial
$10,100,000
11/12/2026
9
112 Sim Street Townhouses & Residential Subdivision (37 Townhouses & 37 Lots)
Residential
$10,000,000
16/12/2026
10
15 Discovery Road Warehouse
Industrial
$10,000,000
30/11/2026
11
Glenelg Highway Bike Path (Local Government)
Infrastructure
$8,800,000
15/12/2026
12
Ballarat Council - Victoria Park Recycled Water Project Pump Station & Pipe Alignment (Local Government)
Infrastructure
$4,000,000
14/12/2026
13
City Of Ballarat Intersection Pavement Works (Local Government)
Infrastructure
$3,000,000
16/11/2026
14
42 Eastwood Street Units (11 Units)
Residential
$3,000,000
15/09/2026
15
5 Icon Drive Warehouses (18 Warehouses | Office | Café)
Mixed-use
$2,700,000
11/09/2026
16
41 Paddys Drive Warehouses
Industrial
$2,500,000
5/06/2026
17
City Of Ballarat Line Marking (Local Government)
Infrastructure
$2,300,000
16/11/2026
18
Ballarat West Precinct Retarding Basin (Local Government)
Infrastructure
$2,000,000
12/10/2026
19
410a Kline Street Townhouses (6 Townhouses)
Residential
$1,800,000
31/03/2026
20
431 Cobden Street Townhouses (6 Townhouses)
Residential
$1,800,000
21/01/2026
Your home of the latest property market insights.
RESEARCH SERVICES
OUR KNOWLEDGE
Our research services span over every suburb, LGA, and state within Australia; captured in a variety of standard and customised products, and include:
Access to accurate and objective research is the foundation of all good property decisions.
OUR PEOPLE
•
Advisory and consultancy
•
Market analysis including profiling and trends
•
Primary qualitative and quantitative research
•
Demographic and target market analysis
•
Geographic information mapping
•
Project analysis including product and pricing recommendations
•
Rental and investment return analysis
Our research team is made up of highly qualified researchers who focus solely on property analysis.
Jason Birch +61 409 388 377 Jasonb@prdballarat.com.au
GET IN TOUCH WITH US TODAY PRD Ballarat
Your trusted local real estate agency +61 3 5331 1111
Level 1, 51 Lydiard Street South
reception@prdballarat.com.au
Ballarat, VIC, 3350
PRD.com.au/ballarat/
REFERENCES * Ballarat sales market data and key indicators encapsulates aggregate property market conditions within the postcodes of 3350, 3355 & 3356. ** Estimated values are based on construction value provided by the relevant data authority and does not reflect commercial and/or re-sale value. # 2026 encapsulates sales transactions for 1st half of 2026 (01/01/2026 – 30/06/2026) only, other years encapsulates sales transactions for the full year (i.e 01/01 to 31/12 of the relevant year). € Annual rental growth is a comparison between Q2 2025 (01/04/2025 – 30/06/2025) and Q2 2026 (01/04/2026 – 30/06/2026) house median rent figures. ¥ Ballarat rental market data encapsulates aggregate property conditions within the postcode of 3550. § Rental yields shown are as reported as of June 2026.
₳ Project development map showcases a sample of upcoming projects only, due to accuracy of addresses provided by the data provider for geocoding purposes. £ Projects refers to the top developments within the Ballarat Local Government Area. µ Estimated value is the value of construction costs provided by relevant data authority, it does not reflect the project’s sale/commercial value. ψ Commencement date quoted for each project is an approximate only, as provided by the relevant data authority, PRD does not hold any liability to the exact date. Source: APM Pricefinder, Cordell Connect database, SQM Research, Esri ArcGIS. Disclaimer: PRD does not give any warranty in relation to the accuracy of the information contained in this report. If you intend to rely upon the information contained herein, you must take note that the information, figures and projections have been provided by various sources and have not been verified by us. We have no belief one way or the other in relation to the accuracy of such information, figures and projections. PRD will not be liable for any loss or damage resulting from any statement, figure, calculation or any other information that you rely upon that is contained in the material. Prepared by PRD Research. © All medians and volumes are calculated by PRD Research. Use with written permission only. All other responsibilities disclaimed. © Copyright PRD 2026.