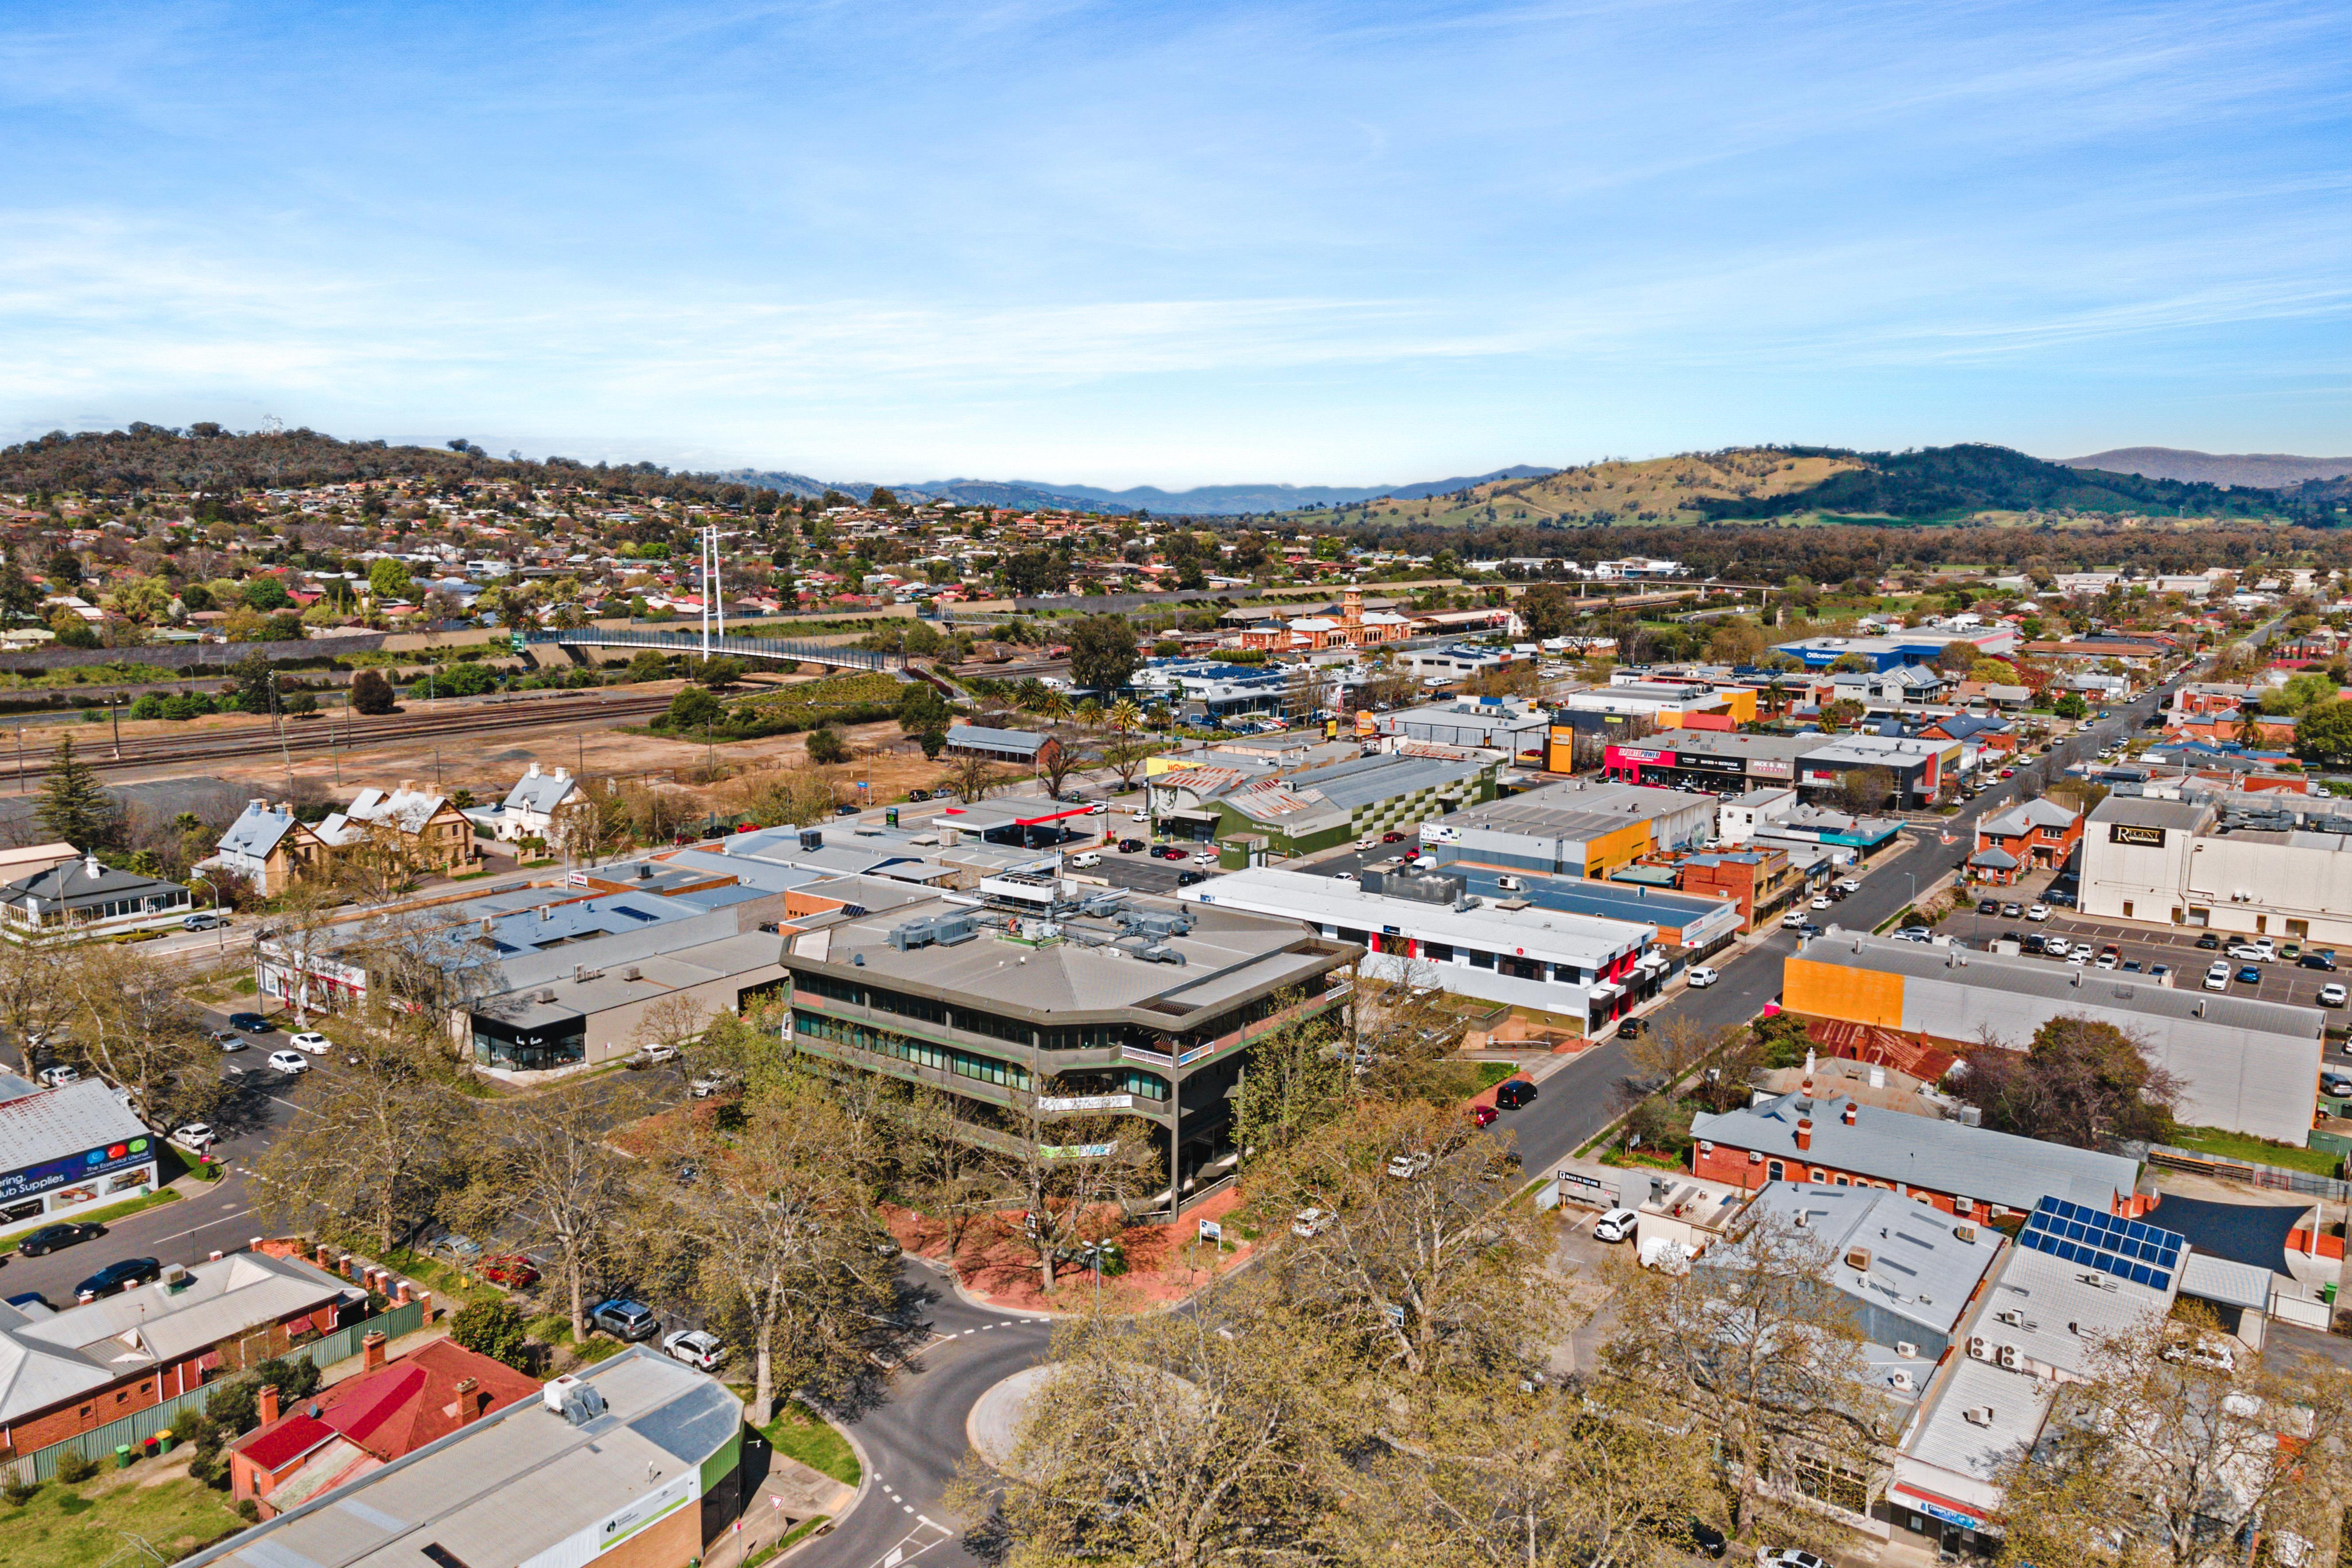



In 2025, which for this report captures sales data between 1st January – 31st December, the median sales price for commercial property was $4,012 per sqm, a slight -4.2% softening in the past 12 months That said, the median price has more than tripled since 2021, and remained above the $4,000 per sqm benchmark since 2024, indicating strong capital growth for owners. The slight dip in prices provides a timely entry point for buyers
Sales surged by 220%, from 5 sales in 2024 to 16 in 2025. This is similar with the 15 sales recorded in 2021, reinforcing stable long-term (5yrs) demand.
$4,012
16
$1,523
11
Median commercial sale price per sqm in Albury (2025)
Total commercial property sales in Albury (2025)
Median industrial sale price per sqm in Albury (2025)
Total industrial property sales in Albury (2025)
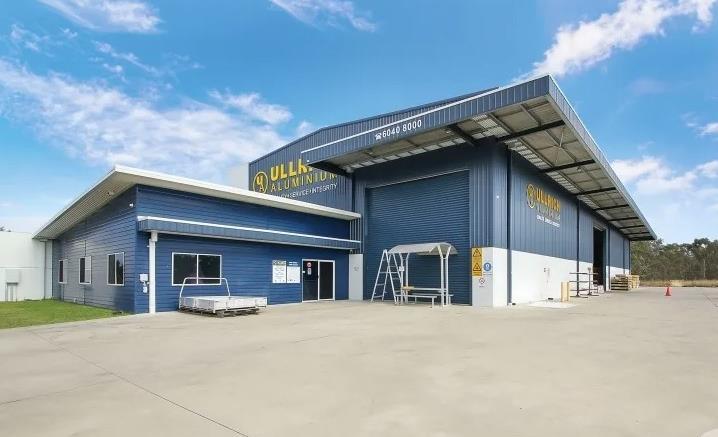
The industrial median sales price was $1,523 per sqm in 2025, a significant decline compared to 2024 peak pricing. That said, prices remain 48.7% above 2021 levels and on par to the 5yrs average of $1,643 per sqm, reflecting long-term growth.
In contrast to the commercial sector, industrial transaction activity has moderated, with 11 sales recorded in 2025 compared to annual average of 13 between 2021 and 2023. That said this is higher than 8 sales recorded in 2024. Supply remains constrained, with only 3 industrial projects on the schedule for completion in the 1st half of 2026. This is unlikely to be sufficient to meet underlying demand, compared to the number of sales each year. This puts upward pressure on prices.


Located approximately 550km south-west of Sydney, the City of Albury is a local government area (LGA) in the Riverina region. It is a vibrant region that includes towns like Albury, Lavington, Thurgoona, and Hamilton Valley. Albury’s economy is diverse, including agriculture, manufacturing, and retail industries. Interestingly, compared to five years ago, market performance has diverged in 2025, with commercial sales increasing to 16 transactions, while industrial sales moderated to 11.
This report focuses on commercial and industrial property types specifically, analysing sales and leasing activity since 2021 to 2025. The entirety of 2025 is used for sales data, to provide a long-term view of the market (past 5 years). Quarterly data is used for leasing due to the nature of the rental market. This report analyses future development in 2025-2027, providing holistic understanding of the commercial and industrial markets in Albury.
The median net lease rate for commercial property in Albury* was $415 per sqm in Q4 2025, reflecting a 66.0% increase in the past 6 months (Q2 2025, at $250 per sqm) and a 127.0% increase in the past 12 months (Q4 2024, at $183 per sqm).
Leasing activity has dropped to a historical low, with only 5 leases in Q4 2025, compared to the average quarterly 9 leases in the past 18 -24 months. This confirms there is an undersupplied commercial leasing market in Albury*, indicating continued opportunities for investors.
$415
5
$146
1
Median commercial net lease rate per sqm in Albury (Q4 2025)
Number of quarterly commercial leases in Albury (Q4 2025)
Median industrial net lease rate per sqm in Albury (Q4 2025)
Number of quarterly industrial leases in Albury (Q4 2025)
The median net lease rate per sqm for industrial property was $146 per sqm as of Q4 2025, which reflects a 32.7% increase in the past 6 months (Q2 2025, at $110 per sqm) and a 50.5% increase in the past 12 months (Q4 2024, at $97 per sqm).
There was only 1 lease activity recorded in Q4 2025, which, like commercial leasing; was one of the lowest in the past 24 months.
This notable rise in lease rates can be attributed to a current undersupply, combined with a low number of industrial projects (6) in the 2026 pipeline (compared to the 7 commercial projects planned in 2026). This intensified competition for renters, which pushed up prices in Q4 2025.

Looking at the whole 2025, a slight majority, representing 53% of commercial leases, were taken on a Nett basis (based on 15 known leases). This is a continuing trend, which was evident for leases in the past 24 months.
The dominant lease type in Albury’s* industrial market proved slightly different to the commercial market, with a majority 75% of leases adhered to on a Nett basis (based on 16 known leases).
The average days to let declined in the 12 months to Q2 2025, falling slightly by -4.6% for commercial properties (to 62 days) and significantly by -40.6% for industrial properties (to38 days). This confirms a highly-demanded leasing market, particularly in the industrial sector.
2/860
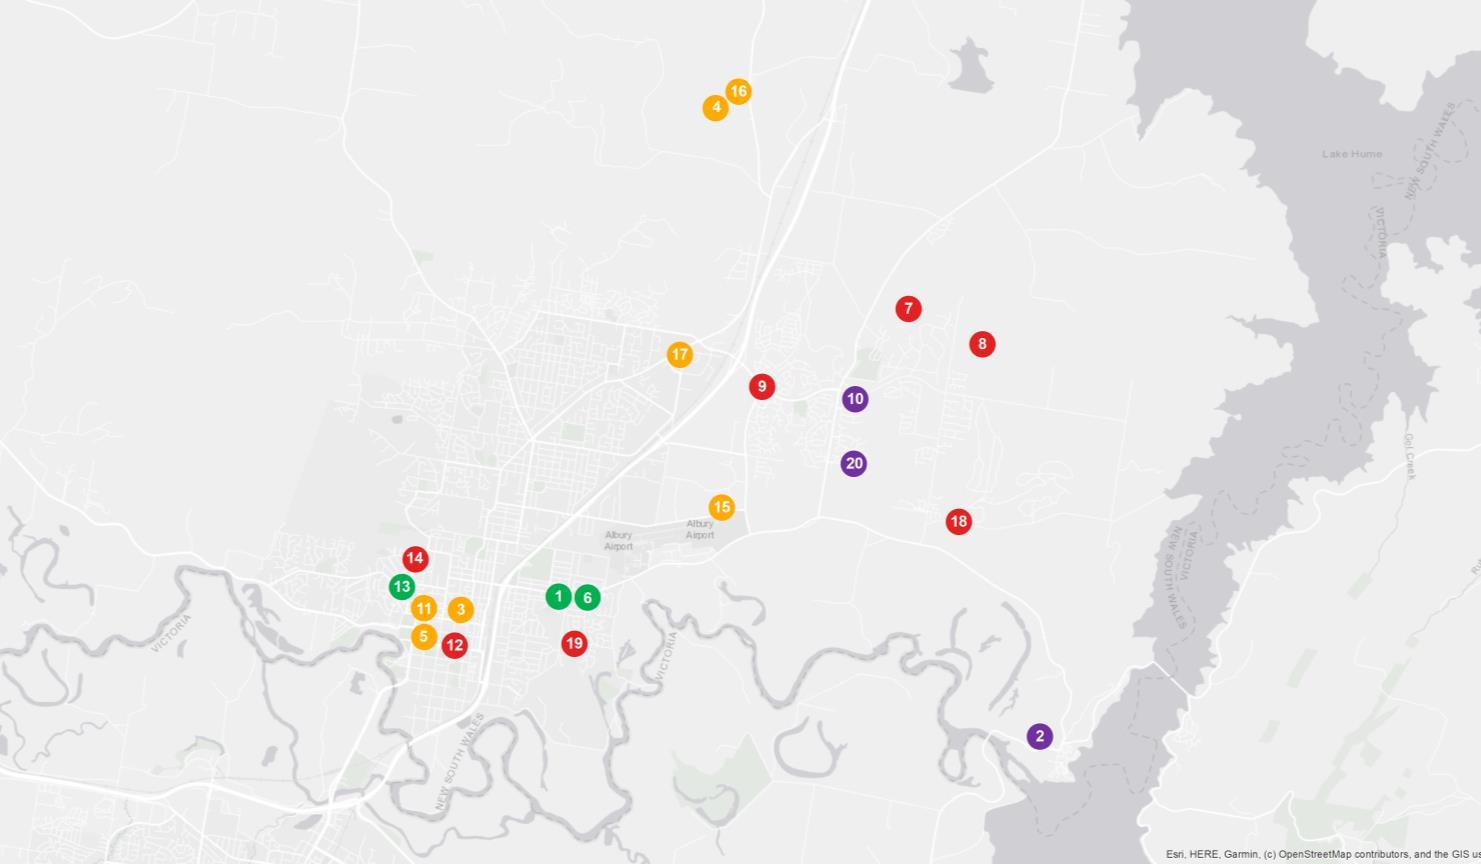
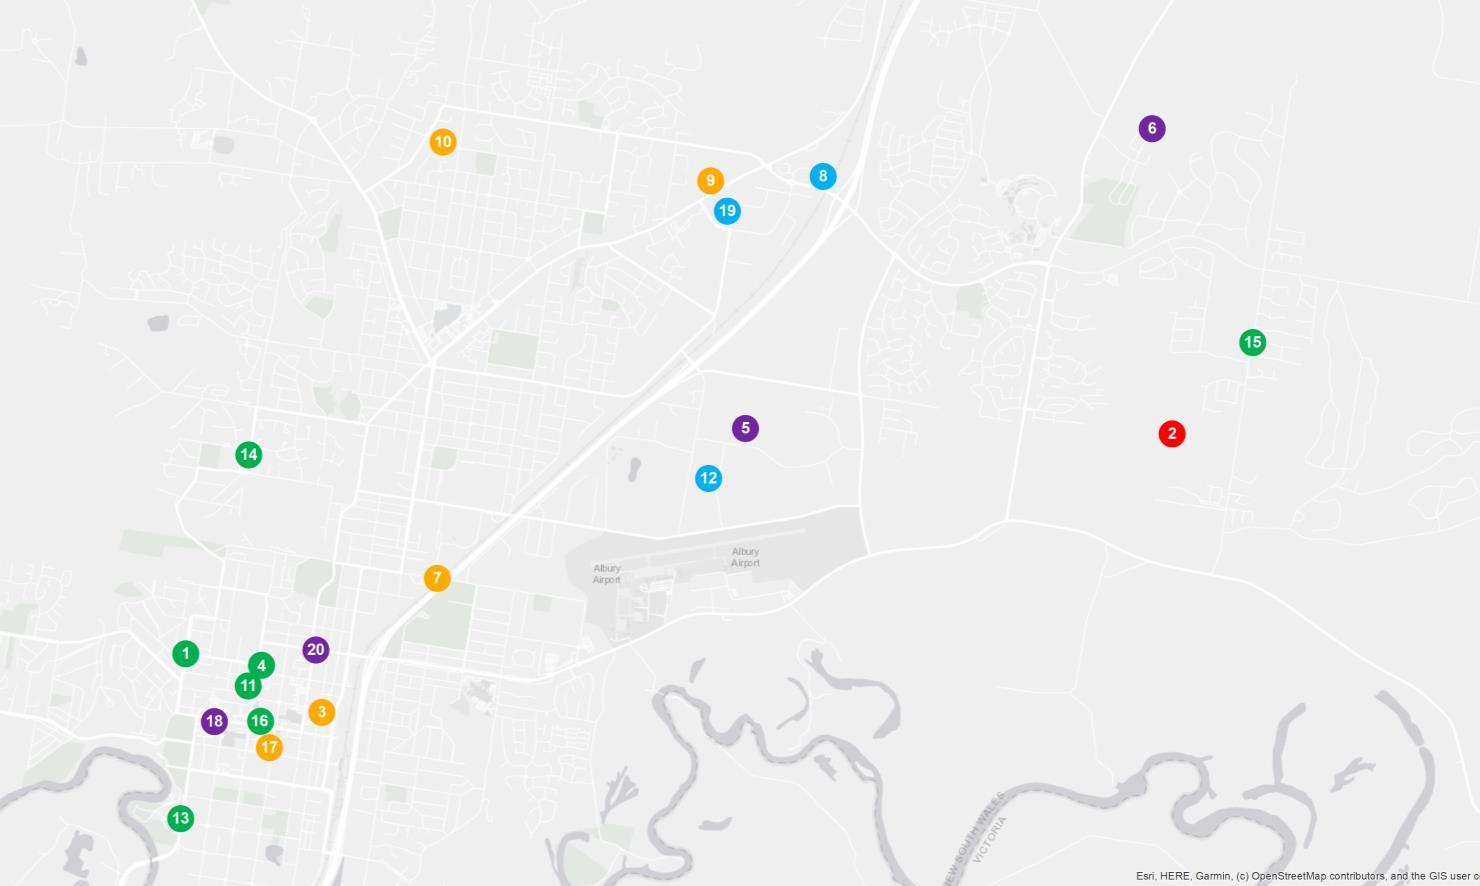
Albury* will benefit from an estimated $1.26B of planned projects, to commence construction in 2025-2027. 148 major projects are proceeding, which is 98.9% of the original pipeline. This is a significant percentage, considering ongoing challenges in the construction industry. The majority planned are key infrastructure projects, which will improve liveability for residents.
In the 1st half of 2026, 46% of total project value is concentrated in the infrastructure sector. Major infrastructure projects include Little Barbers Creek Block Banks & Culverts Upgrade ($13.0M) and Albury City Council Ground Floor Rectification Work ($3.1M).
Key mixed-use projects include 52 Diamond Drive Medical Centre & Business Premises ($4.3M) and 250 North Street Service Station ($1.6M).
The only residential project in the 1st half of 2026 is Woolshed Estate Thurgoona Residential Subdivision Stages 6-10 ($7.2M), which will deliver 161 land lots.
In 2026, total project value for the residential and mixed-use sectors increased compared to 2025, rising by 52.2% and10.3% respectively. In terms of project numbers, most are the mixed-use sector, with 22 projects in 2025 and 17 in 2026. This will improve liveability for residents and attract more people to the area, which can drive more demand for housing stock. That said, residential projects declined from 10 in 2025 to just 7 in 2026, with the majority to supply land lots. Thus, an undersupply in ready-to-sell housing stock will remain.
In the 1st half of 2026, 4 commercial projects are planned, including the 23 Tig Drive Church ($2.7M) and Brooklyn Fields Exhibition Village Thurgoona Exhibition Homes Stage 2 ($1.8M). These projects are expected to generate job opportunities.
Three industrial projects are planned in the 1st half of 2026. These are: 4 Travelstop Way & Thurgoona Drive Industrial Shed ($1.6M), 57 Merkel Street Industrial Buildings ($933K) and 599 Dallinger Road Warehouses Additions ($327K). Together, 5 industrial sheds and/or warehouse units will be added to the market. This can assist with some of the current demand, but will not be enough.




• Advisory and consultancy
• Market analysis including profiling and trends
• Primary qualitative and quantitative research
• Demographic and target market analysis
• Geographic information mapping
• Project analysis including product and pricing recommendations
• Rental and investment return analysis

Access to accurate and objective research is the foundation of all good property decisions.
Our research team is made up of highly qualified researchers who focus solely on propertyanalysis.
Our research services span over every suburb, LGA, and state within Australia; captured in a variety of standard and customised products.