
LiveabilityStudy Executive Summary
Port Stephens Council
December 2024




We acknowledge the Gadigal people as Traditional Owners of the land on which we host this presentation today.
We pay our respects to Elders past and present, and recognise the oldest living culture in the world.
PROJECT OVERVIEW


RESEARCH STUDY SUMMARY
About Place Score
Place Score offers two sophisticated data collection tools, Care Factor (CF) survey and Place Experience (PX) Assessments
Like a ‘place census’, Care Factor captures what your community really values, while PX Assessments measure the community’s lived place experience.
Together they help yo u identify what is important, how a neighbourhood is performing, and what the focus of change should be.
An attribute with a high CF but a low PX should be a priority for investment as it will have the most positive impact on the most amount of people.
Additionally, Place Score gathers community ideas of improving local liveability. These openended suggestions allow residents to voice their aspirations and concerns, generating authentic, community-driven feedback to guide meaningful improvements.
Your Project
Between 21 October and 1 December 2024, Place Score, on behalf of Port Stephens Council, delivered the 2024 Port Stephens Liveability Survey.
This is the second LGA wide survey undertaken by Place Score with all results being loaded onto your online liveability platform.
The 2024 project includes:
• Online Liveability Survey (national benchmark)
• Open question –asking respondents ideas to make their neighbourhood more liveable and enjoyable
• 2024 ExecutiveSummary Report (this document)
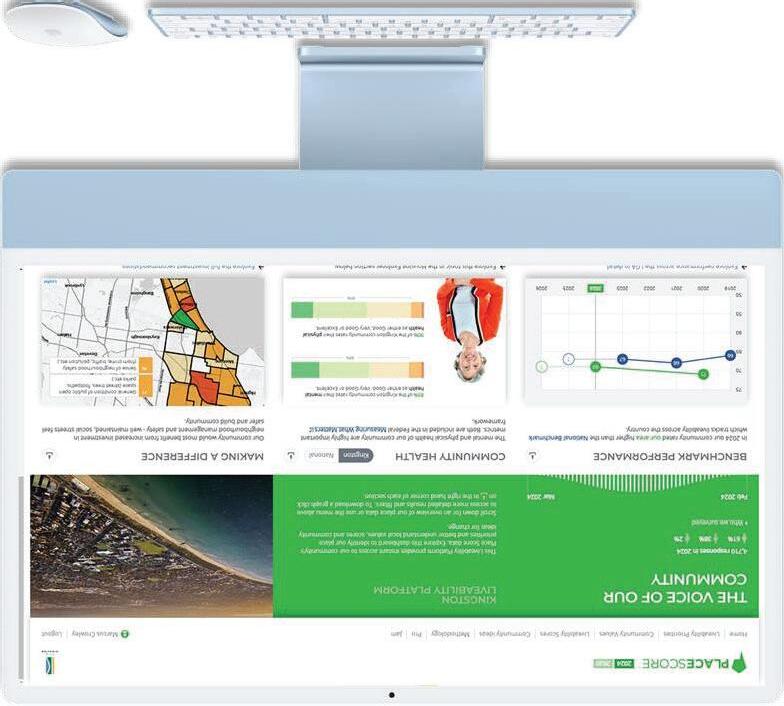

The results in this presentation are only a summary of the available data on the LiveabilityPlatform
ENGAGEMENT CAMPAIGN
Distribution
The residents of the local government area were invited to participate in the survey using a mixture of emails, social media, posters, and flyers.
• Council’s website was the data acquisition method to receive the most responses
• School engagement was the data acquisition method to receive the least responses
• Moving forward, a greater focus should be placed on youth and men under 45
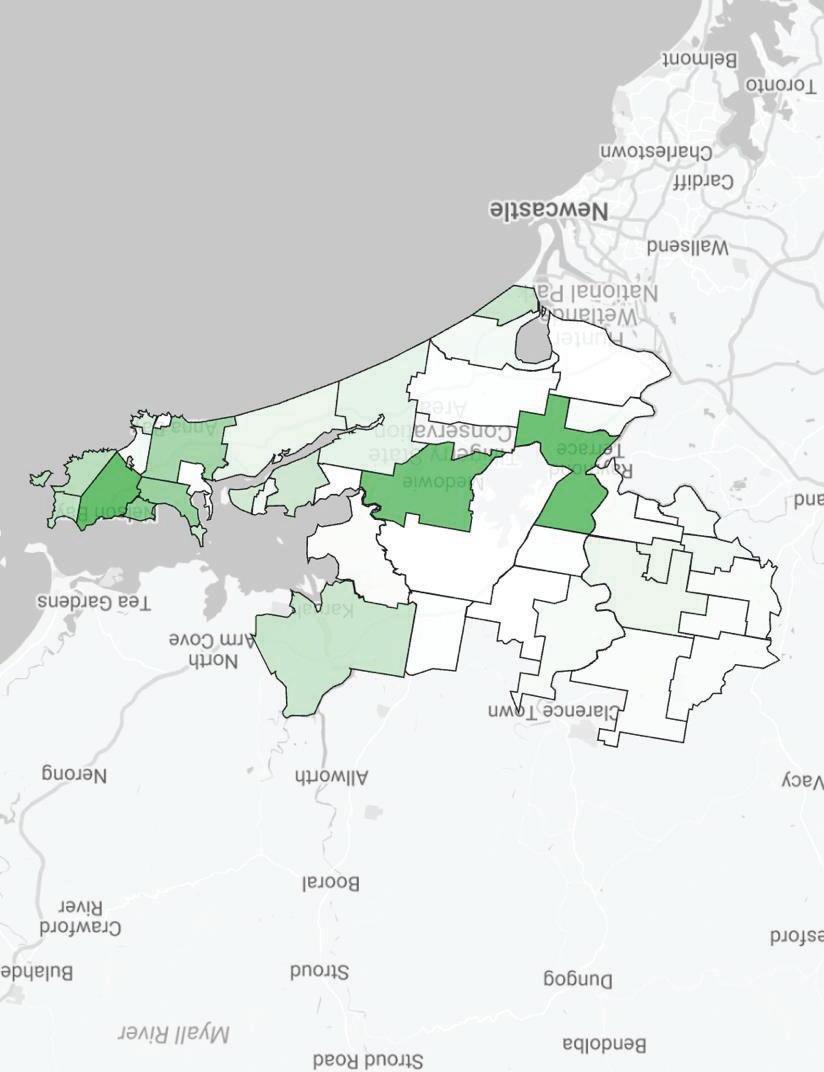
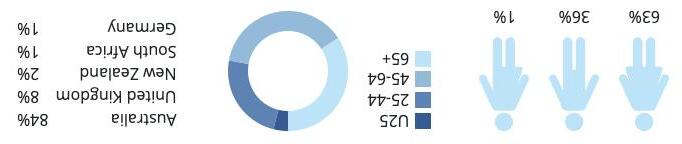
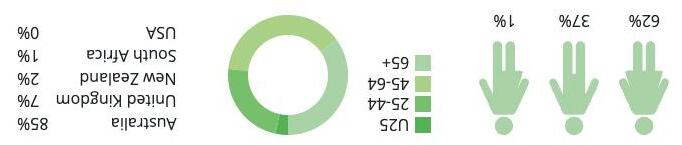
Responses by geography

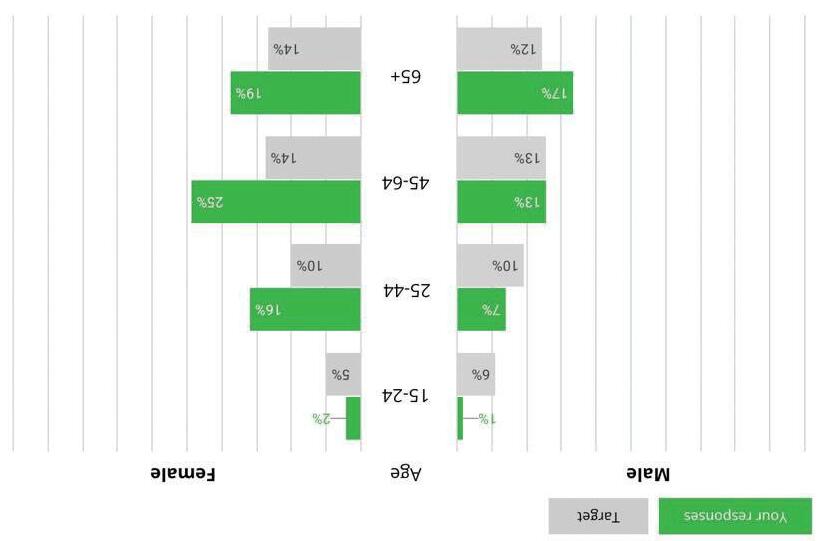
Demographic balance





ABOUT THE RESPONDENTS
7,904 records from over 2,300 local residents were collected
• At the LGA level we achieved a confidence level of ≥ 95% within ±2% margin of error (CF)
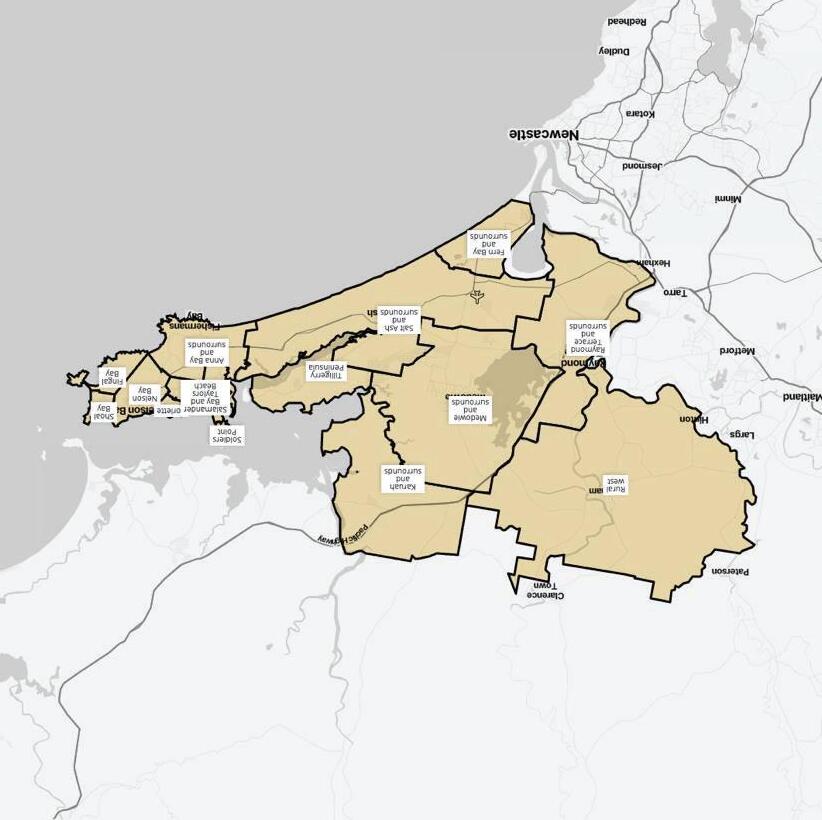
• Results were collected for 44 suburbs and will be represented in 14 geographic areas with relevant sample sizes
• As per the national trends, women are overrepresented in the sample, and men and youth underrepresented
• 4% of PX and CF responses are from those aged 24 or under
COMMUNITY VALUES AND PLACE PERFORMANCE
RESULTS SNAPSHOT
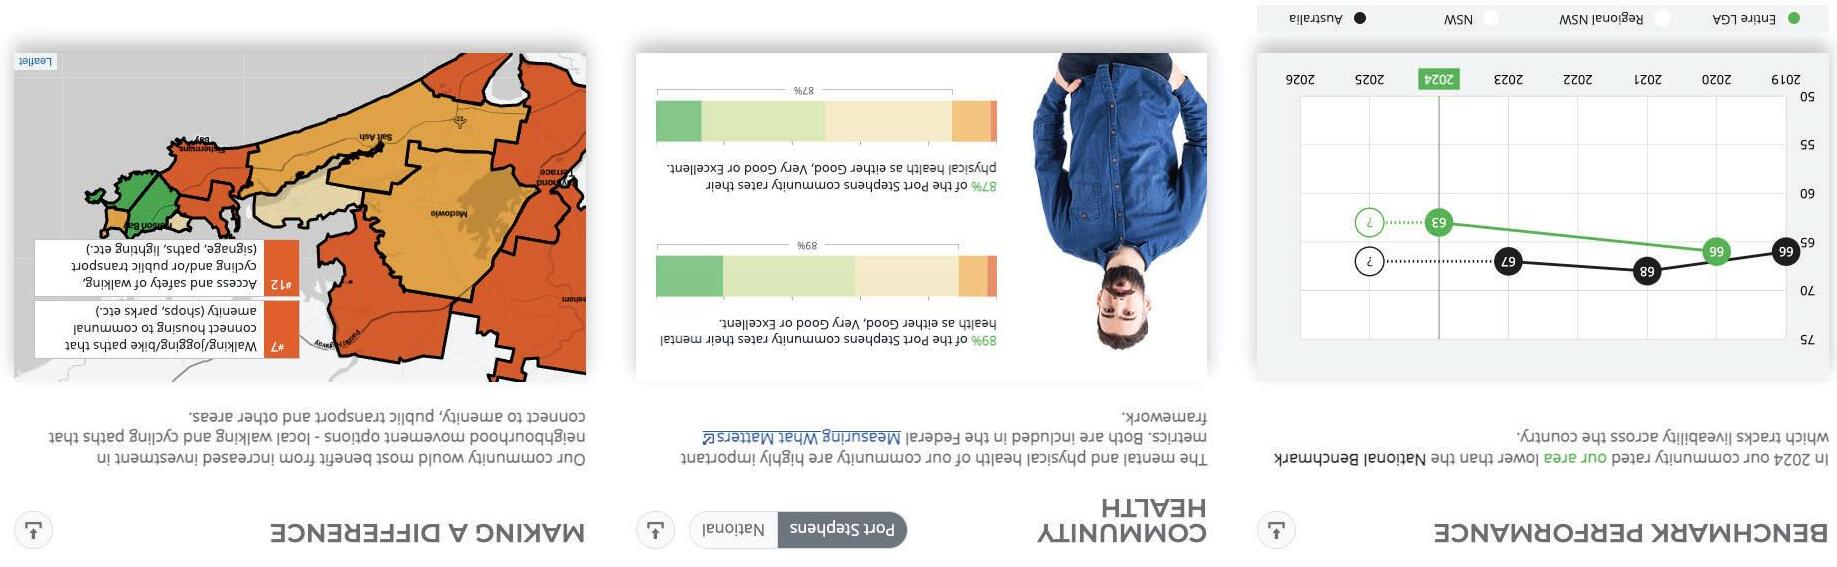
On average, the neighbourhoods scored PX63
89% of your community rates their mental health positively (national average 82%)
Top priority for impact is to invest in neighbourhood movement options
OUR IDEAL NEIGHBOURHOOD
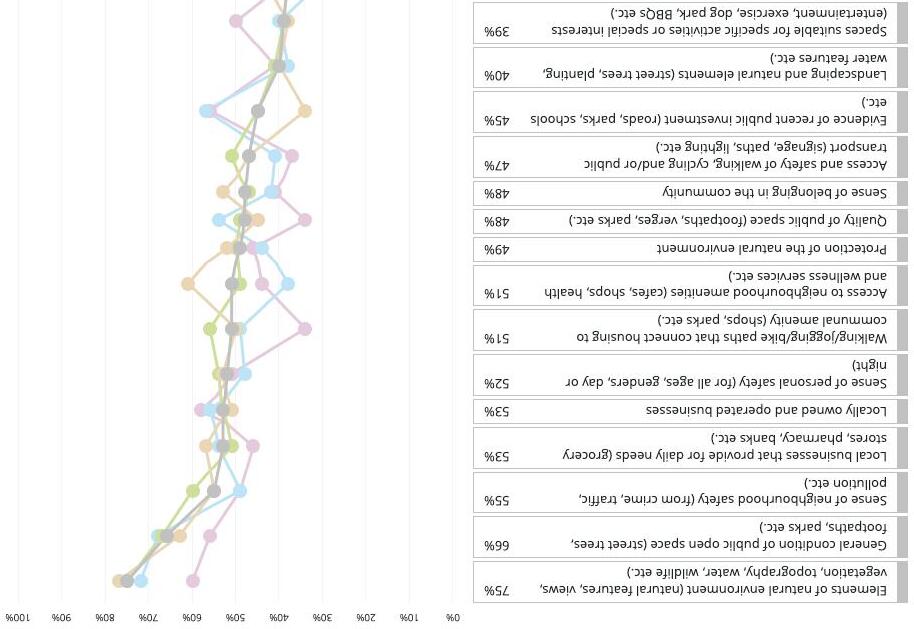
Our community’s ideal neighbourhood is safe, and connected to nature and its local community
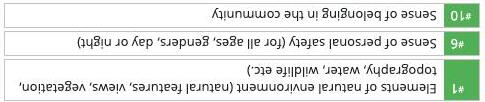
The top 3 shared values of our community are:
• #1 (75%)
Elements of natural environment
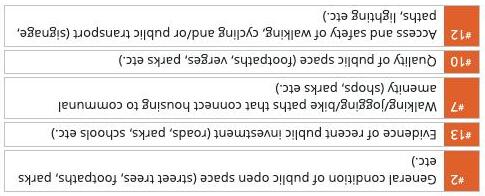
• #2 (66%)
General condition of public open space
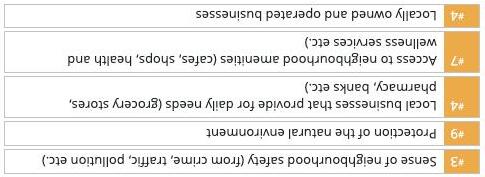
• #3 (55%)
Sense of neighbourhood safety
LGA top 15 Care Factors by age group
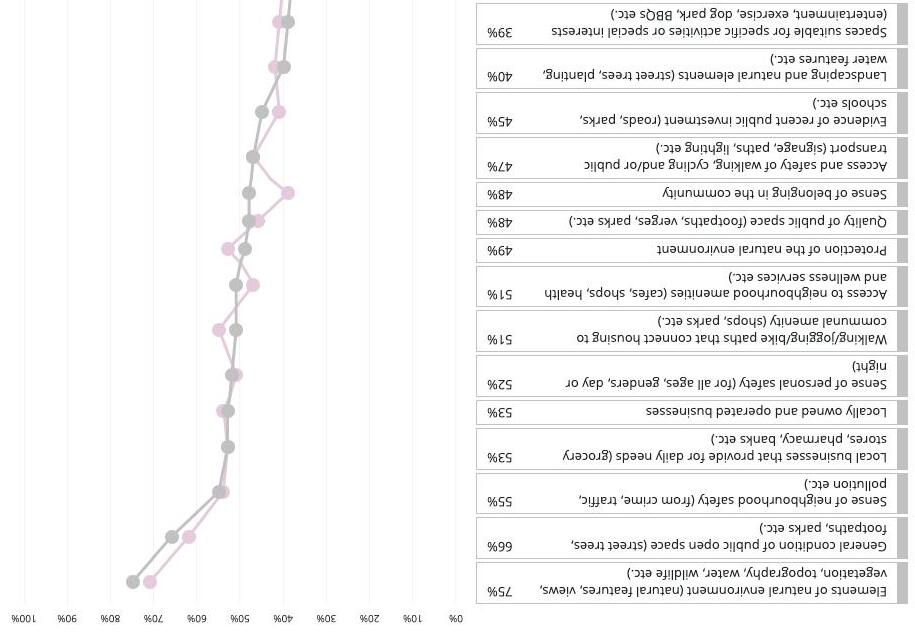
COMMUNITY VALUES CHANGES BETWEEN 2024 AND 2020
Community values have remained relatively stable between 2024 and 2020.
However, some key differences between the years are:
More people selected the following liveability metrics as important compared to 2020:
Elements of the natural environment
General condition of public open space
Access to neighbourhood amenities
Sense of belonging in the community
Evidence of recent public investment
2024 vs 2020 top 15 Care Factors
COMMUNITY VALUES
Aligning community engagement, strategic planning and financial planning around what the community values can help us deliver stronger outcomes for all residents and stakeholders.
Across Australia there are two shared values: Elements of natural environment and Sense of neighbourhood safety
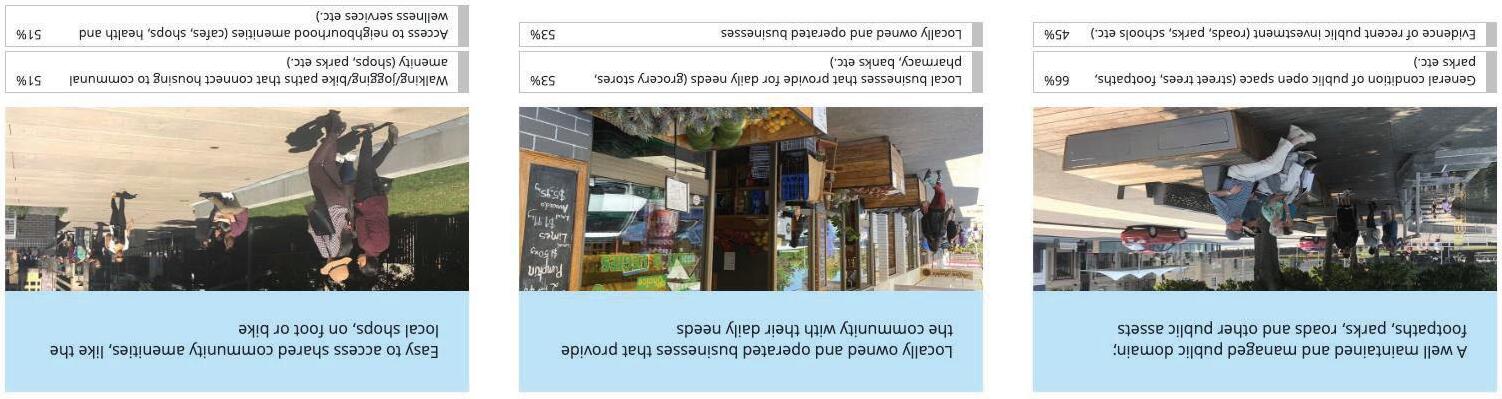
In addition to these two, our community's ideal neighbourhoods have the following features:
LOCAL LIVEABILITY
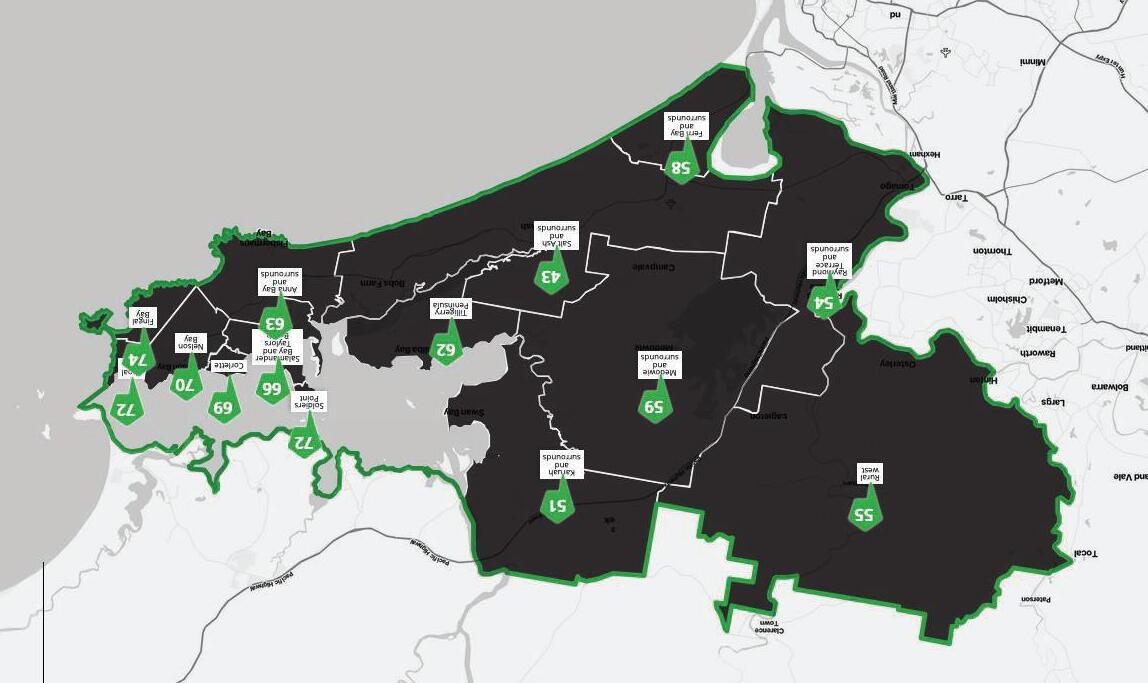
On average, the neighbourhoods scored PX63
This is four points lower than Place Score’s National Benchmark Average of PX67
LOCAL AREA PERFORMANCE
2024 results
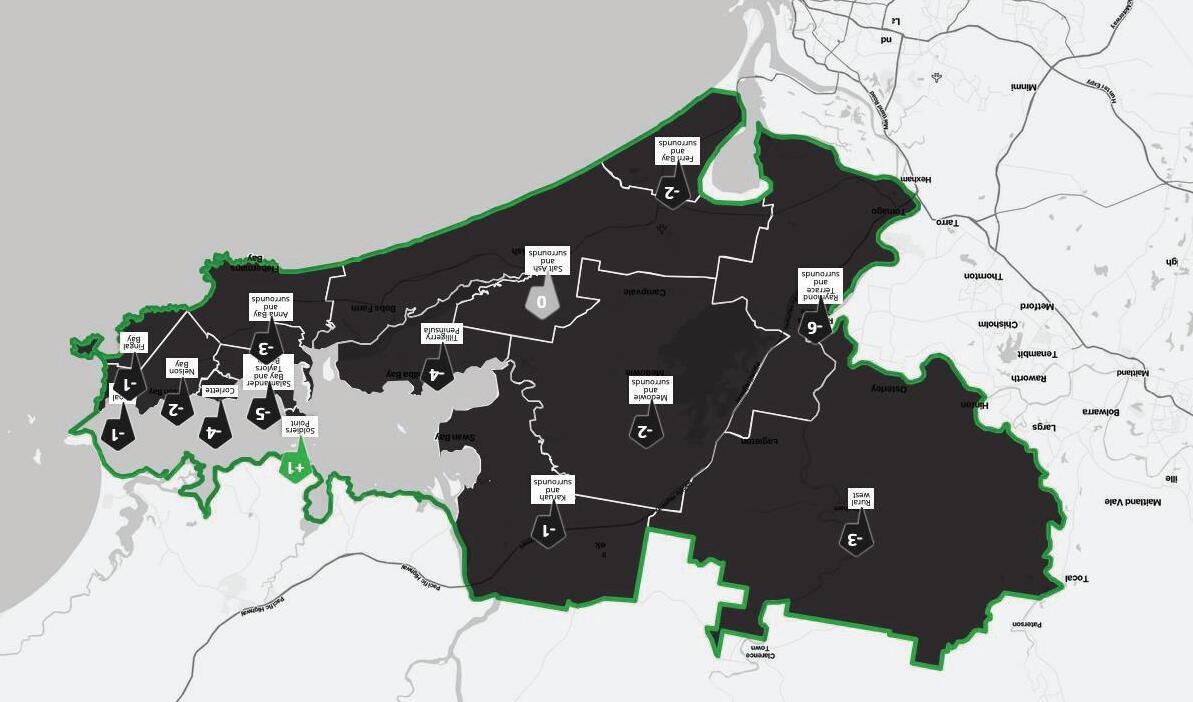
• The area with the highest liveability score is Fingal Bay (PX74) 1
• The LGA’s best performing attributes are:
• ‘Elements of natural environment’ (7.9)
• ‘There are people like me’ (7.7)
• Areas with the lowest liveability scores are Salt Ash and surrounds (PX43)1 and Karuah and surrounds (PX51)1
• The LGA’s worst performing attributes are:
• ‘Evidence of recent public investment ’ (4.2)
• ‘Things to do in the evening’ (4.4)
Notes:
1. PX score out of 100.
2. Place Attribute Score out of 10.
LOCAL AREA PERFORMANCE
2024 vs 2020 results
• The most significant decreases in community sentiments regarding local liveability are in the areas of:
• Raymond Terrace and surrounds (-6%)
• Salamander Bay and Taylors Beach (-5%)
Notes:
1. PX score out of 100.
2. Place Attribute Score out of 10.
BENCHMARKS
The following attributes have seen the most improvement and largest decreases since 2020
BENCHMARKS
These are the top and bottom performing attributes compared with the national and the state
COMMUNITY PRIORITIES
LIVEABILITYDIRECTIONS
LGA strengths and priorities
An attribute with a high CF but a low PX should be a priority for investment as it will have the most positive impact on the most amount of people.
These can be used to recommend where to invest resources and to what level.
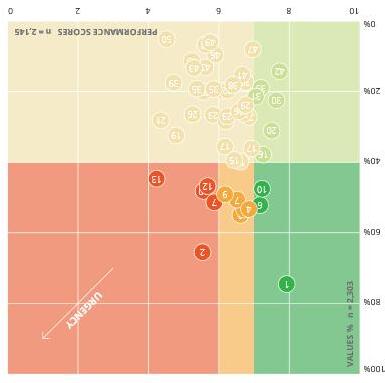

Nurture (CF ≥ 40%, PX ≥ 7) Prioritise (CF ≥ 40%, PX < 6)
Manage (CF ≥ 40%, 6 ≤ PX < 7) Monitor (CF < 40%, PX ≥ 7) Maintain (CF < 40%, PX < 7)
LEGEND
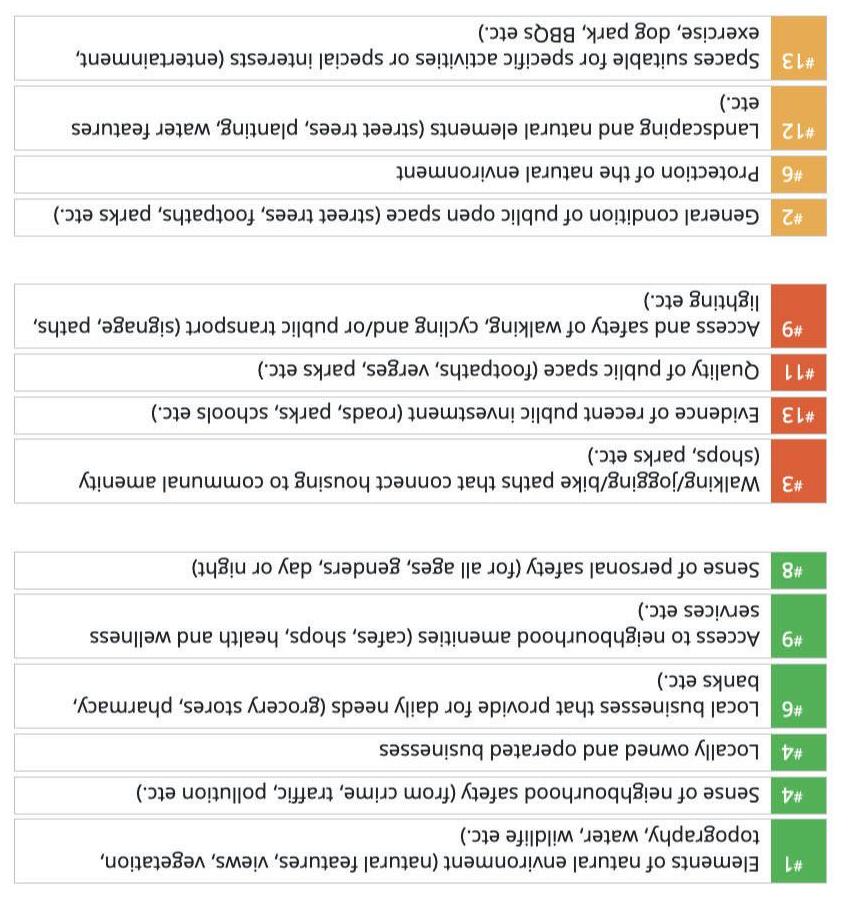
LIVEABILITY DIRECTIONS
LGA strengths and priorities
An attribute with a high CF but a low PX should be a priority for investment as it will have the most positive impact on the most amount of people.
These can be used to recommend where to invest resources and to what level.
Nurture (CF ≥ 40%, PX ≥ 7) Prioritise (CF ≥ 40%, PX < 6)
LEGEND
LIVEABILITY SNAPSHOT
Liveability themes
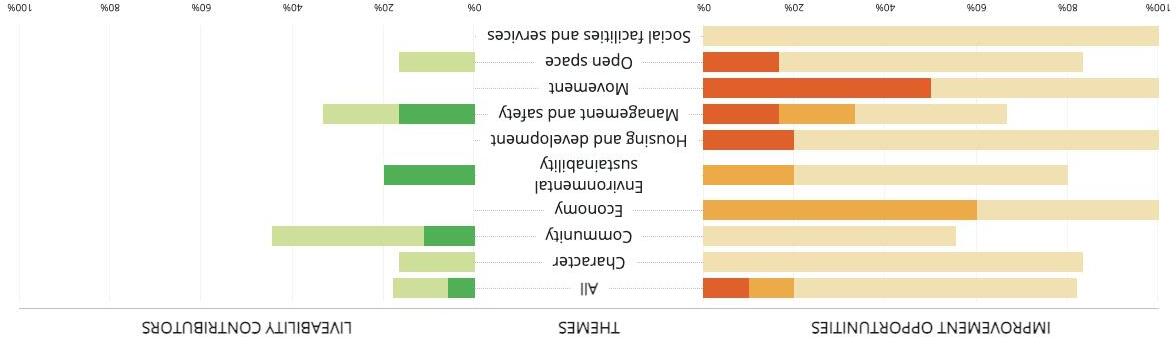
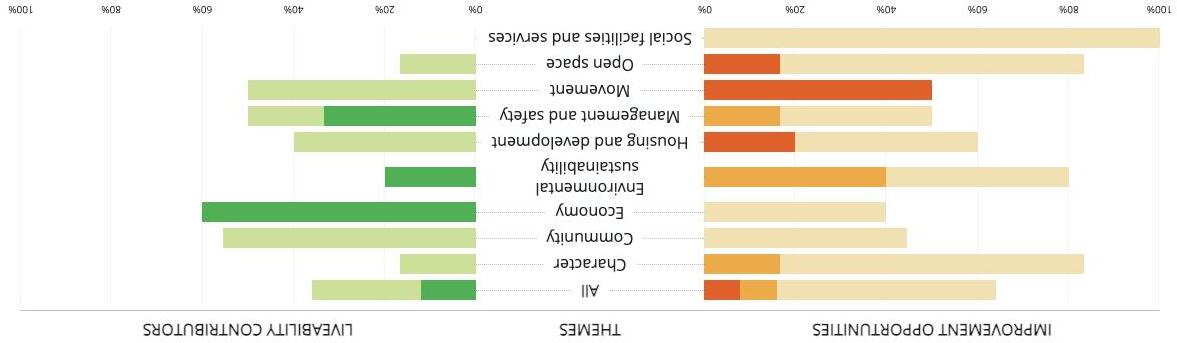
This summary provides us with a snapshot of the relative performance of all 50 Place Attributes categorised into 9 key themes.
The orange bars indicate the proportion of attributes that are underperforming .
The green bars indicate the proportion of attributes that are overperforming.
LGA - 2024
LGA - 2020
ACTIONABLE INSIGHTS – CHARACTER
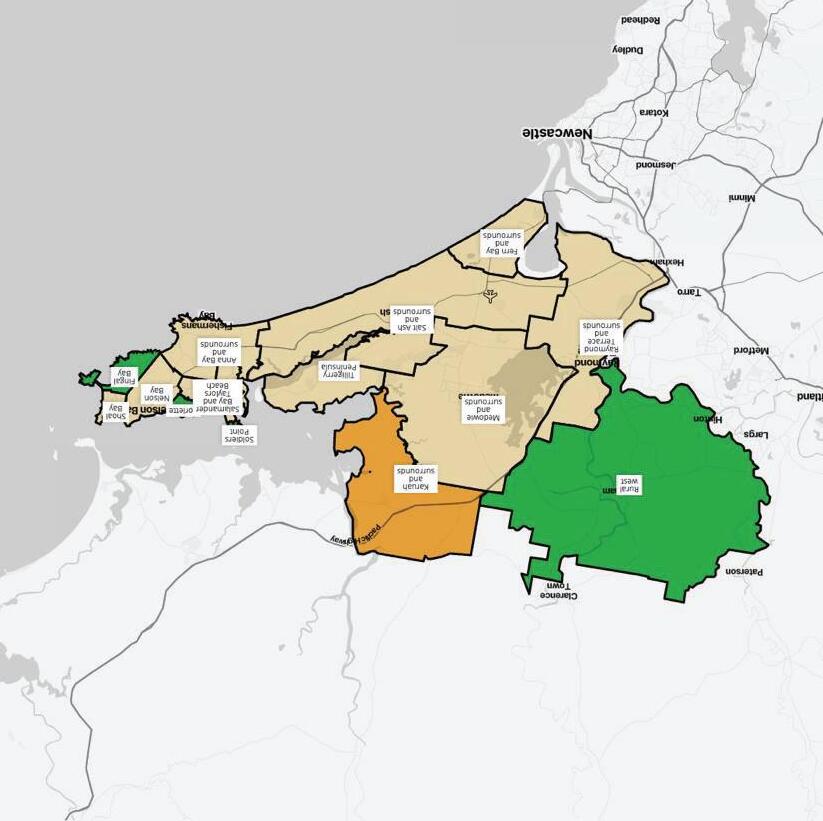
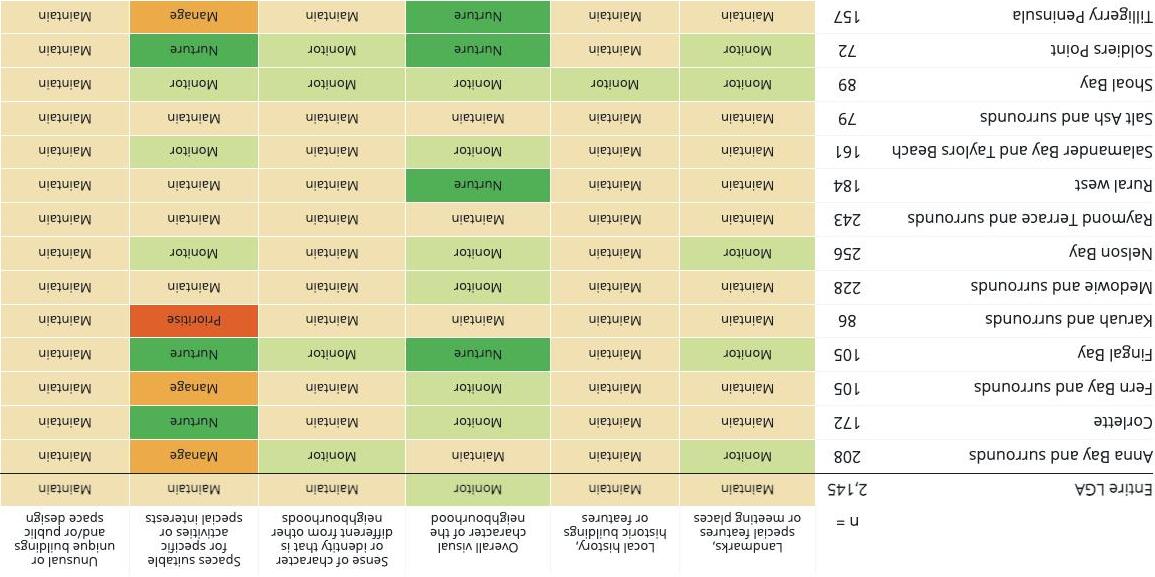
The Character theme is contributing positively for most of the suburbs in Port Stephens.
• ‘Overall visual character of the neighbourhood’ is a strength in this theme
• ‘Sense of character or identity that is different from other neighbourhoods’ is a lower priority compared with 2020
Place Score ©2024
ACTIONABLE INSIGHTS – COMMUNITY
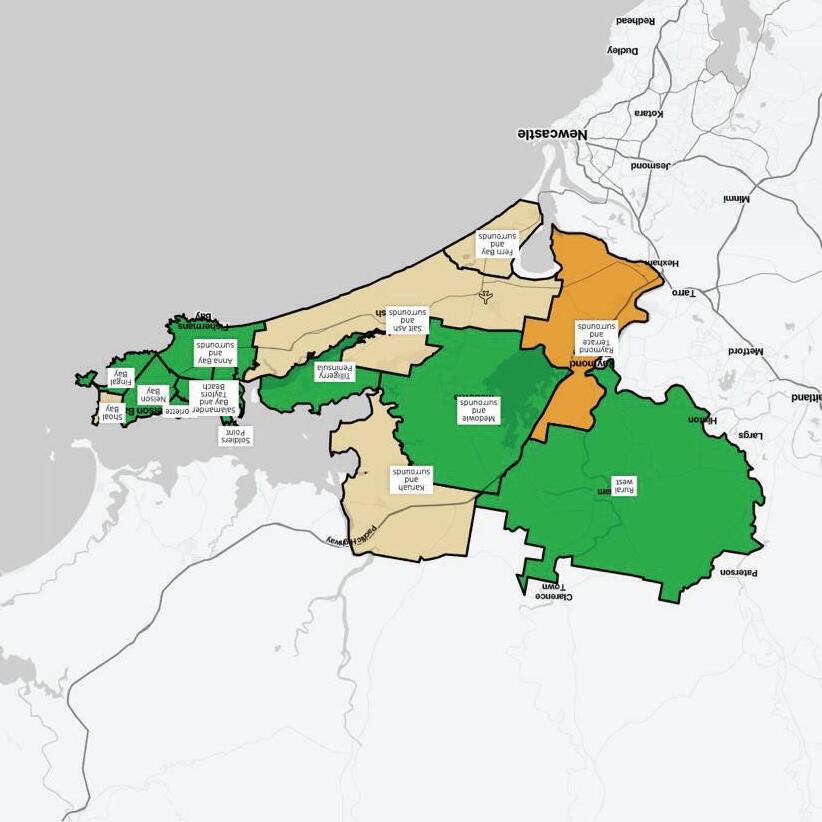
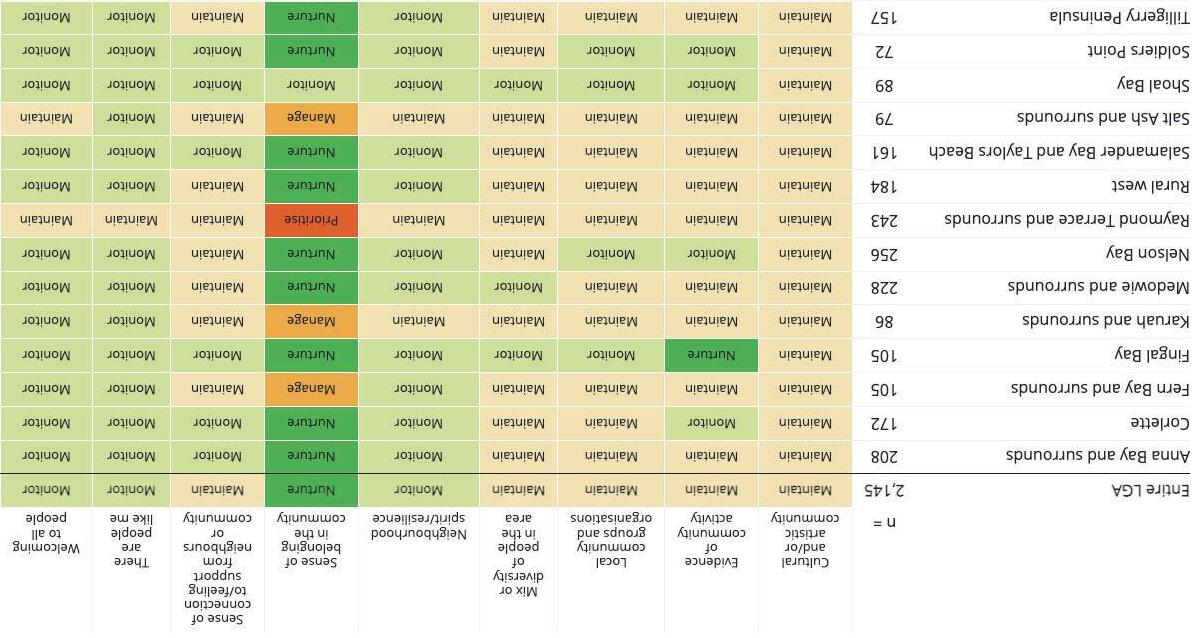
The Community theme is contributing positively for most of the suburbs in Port Stephens.
• Raymond Terrace and surrounds requires the most investment in this theme
• Fingal Bay has less priorities for this theme compared with 2020 results
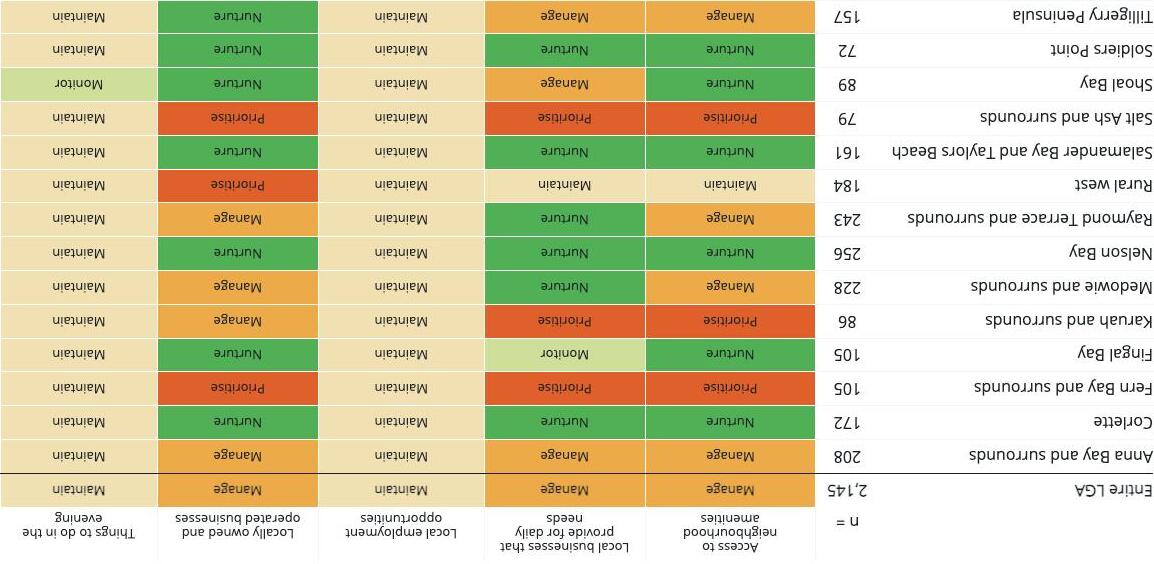
ACTIONABLE INSIGHTS – ECONOMY
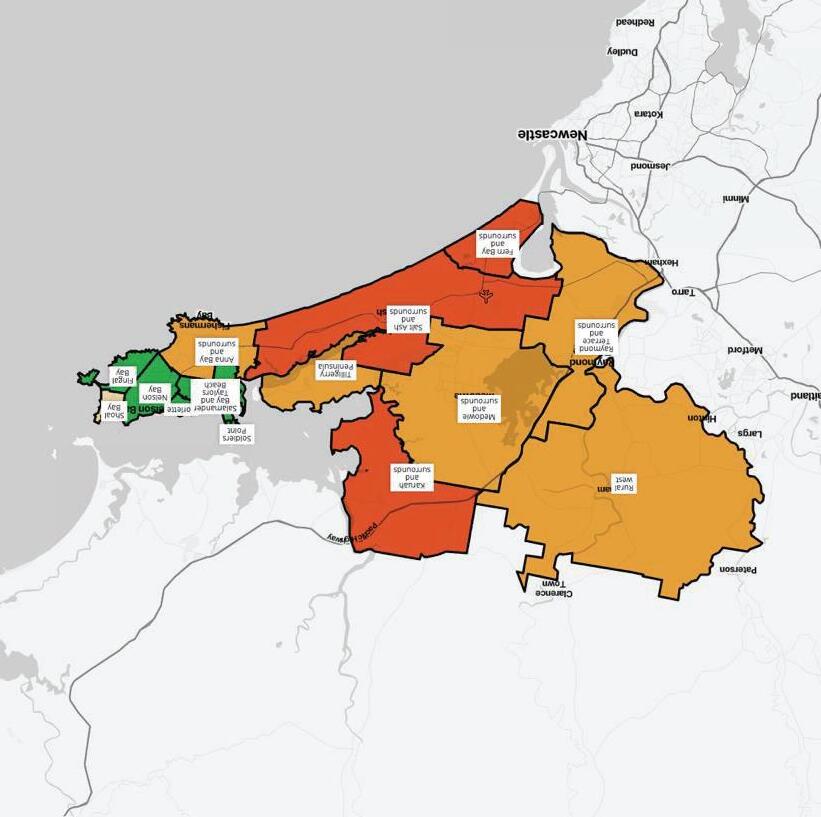
The Economy theme is contributing differently for the suburbs in Port Stephens.
• Anna Bay and surrounds has more priority areas in this theme compared with in 2020
• ‘Access to neighbourhood amenities’ has increased in priority level for most suburbs
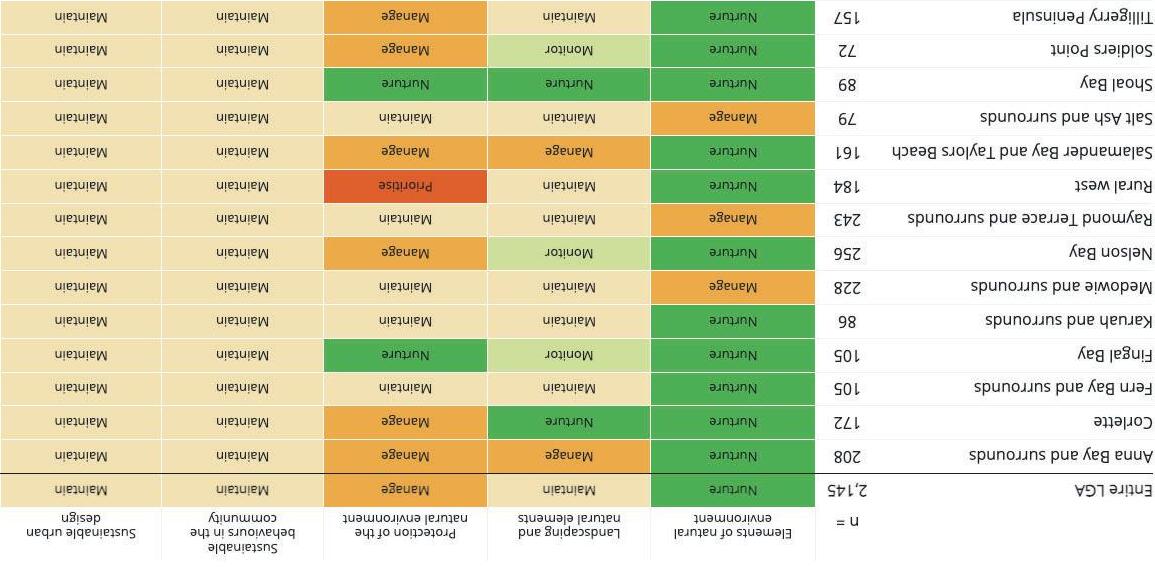
ACTIONABLE INSIGHTS – ENVIRONMENTAL SUSTAINABILITY
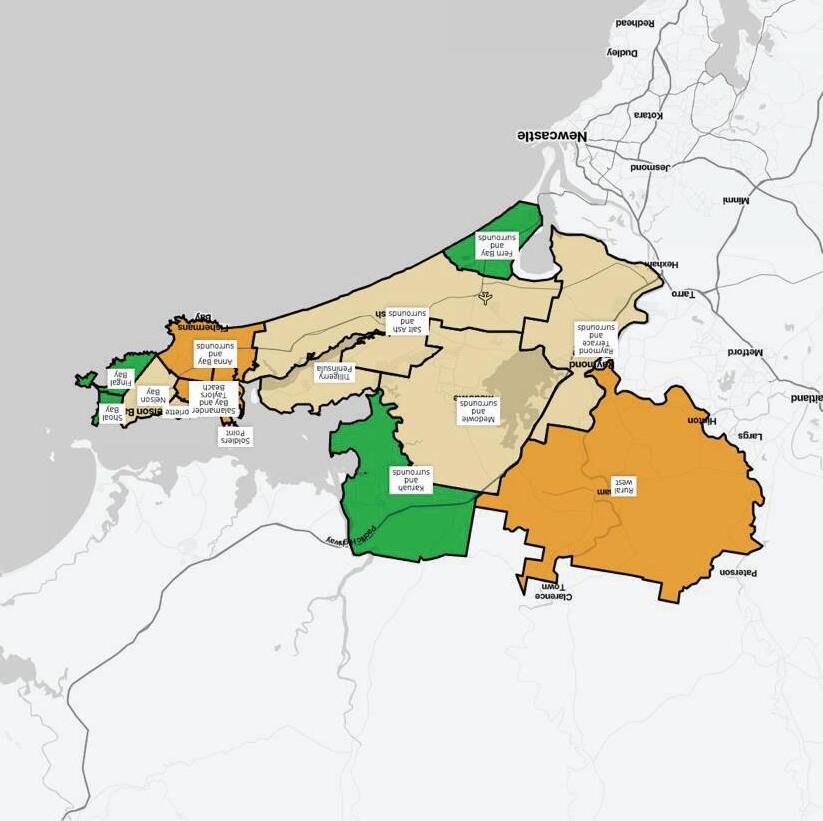
The Environmental sustainability theme is contributing differently for suburbs in the LGA.
• ‘Elements of the natural environment’ is performing well in almost all geographies
• The Shoal Bay area has the least number of priorities in this theme
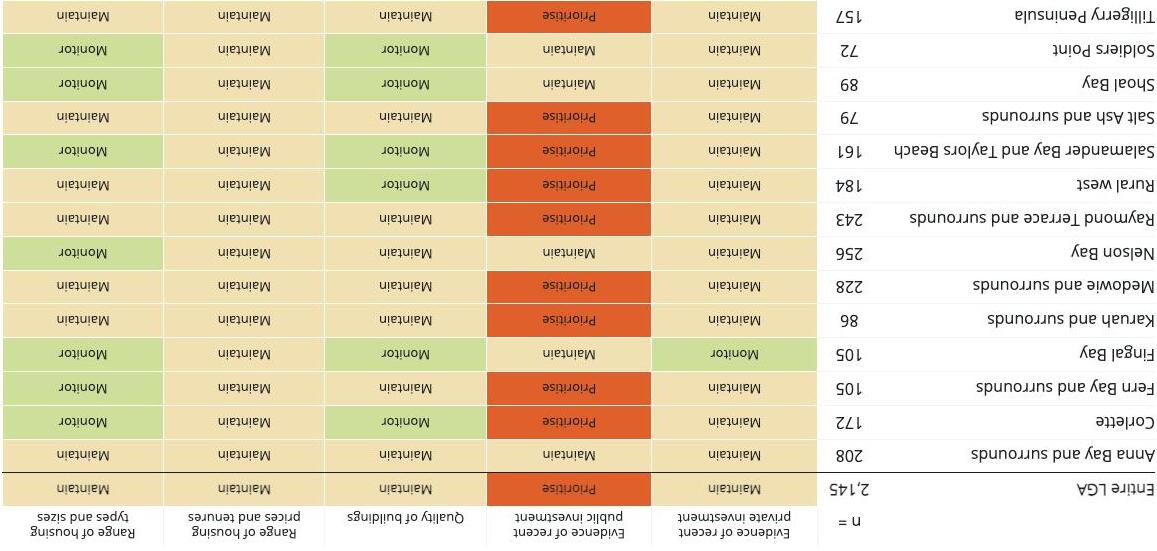
ACTIONABLE INSIGHTS – HOUSING AND DEVELOPMENT
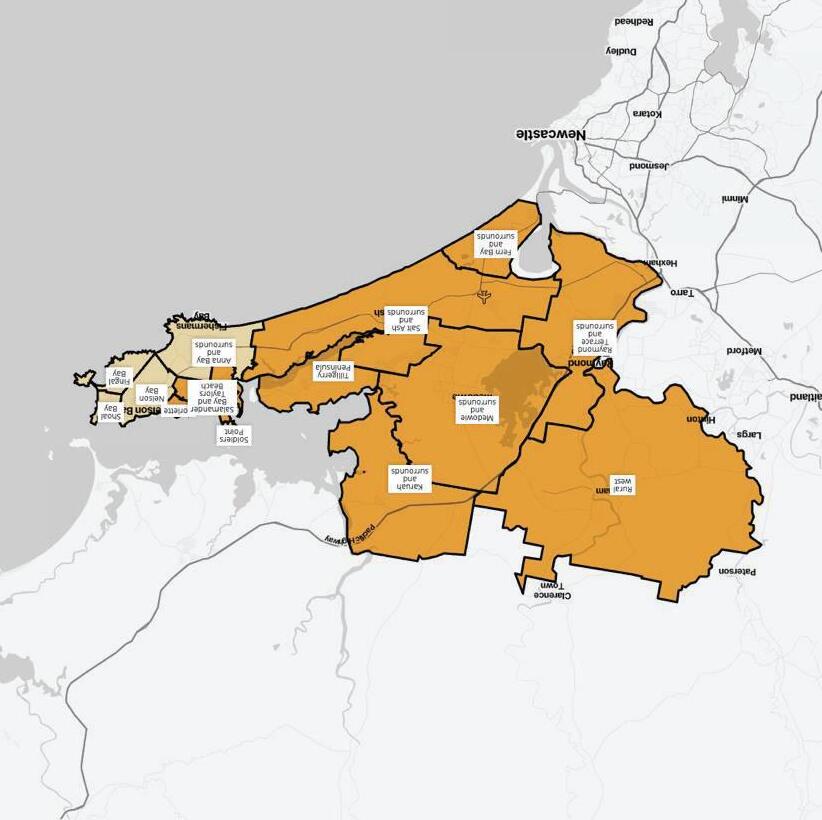
The Housing and development theme is contributing differently for suburbs in the LGA.
• ‘Evidence of recent public investment’ is a priority for almost every geography
• ‘Range of housing prices and tenures’ was a significantly lower priority attribute in 2020 for most geographies
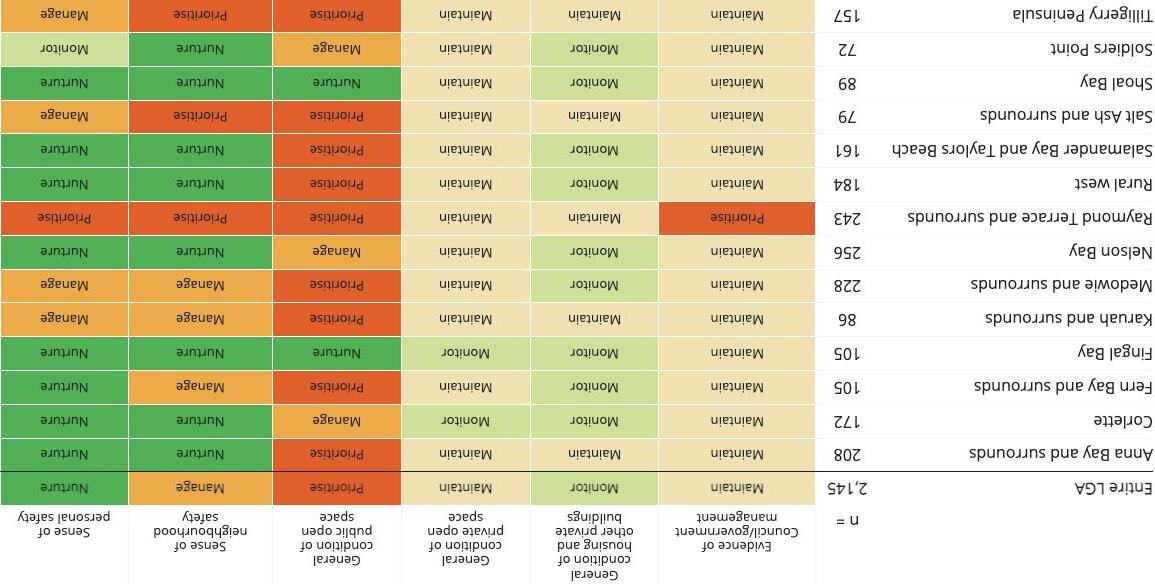
ACTIONABLE INSIGHTS – MANAGEMENT AND SAFETY
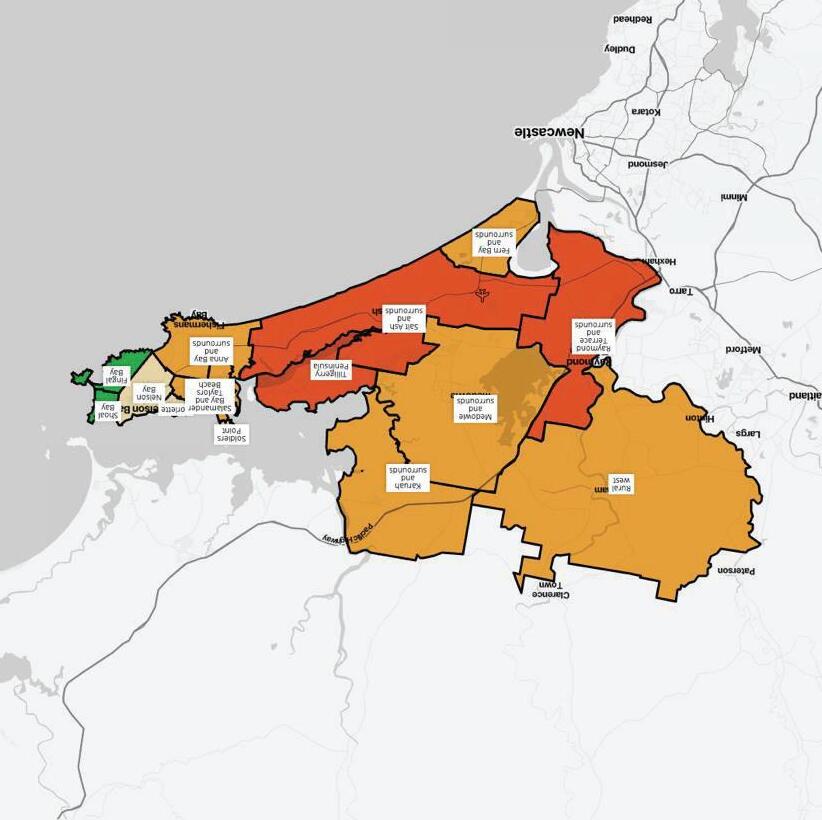
The Management and safety theme is contributing differently for suburbs in the LGA.
• ‘General condition of public open space’ is a key priority for all areas except Shoal Bay and Fingal Bay
• Raymond Terrace and surrounds has the most priorities in this theme
ACTIONABLE INSIGHTS – MOVEMENT
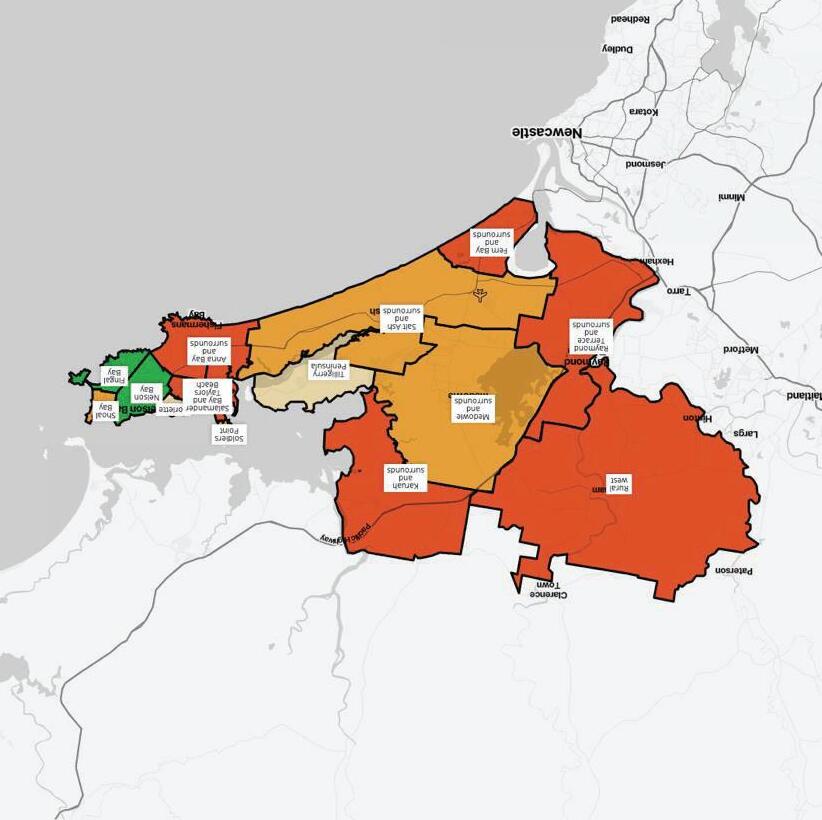
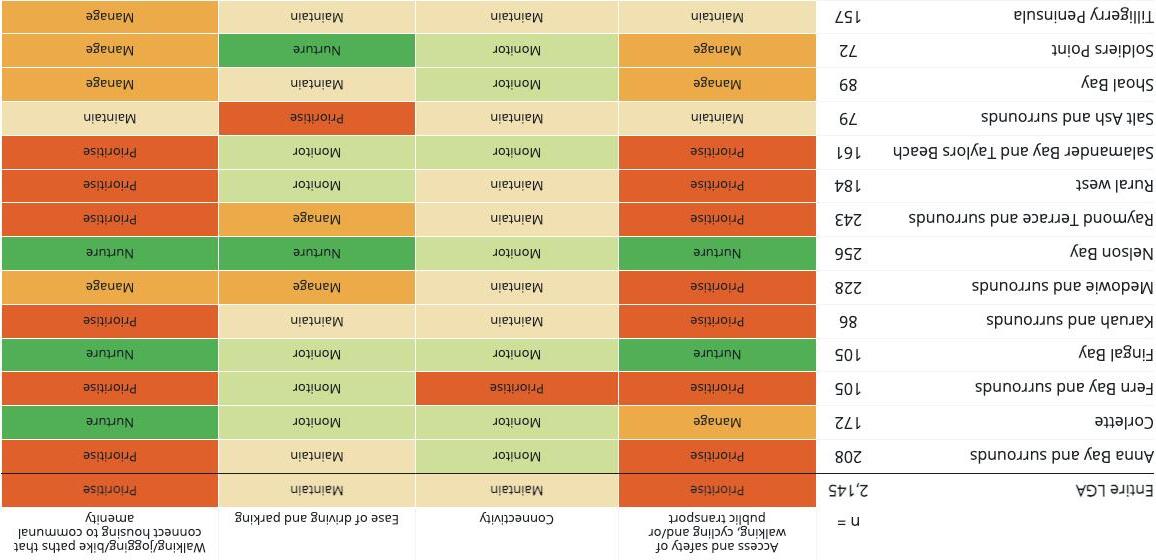
The Movement theme is contributing differently for suburbs in the LGA.
• Nelson Bay and Fingal Bay have no major priority attributes in this theme
• The number of priority areas in this theme has increased since 2020
ACTIONABLE INSIGHTS – OPEN SPACE
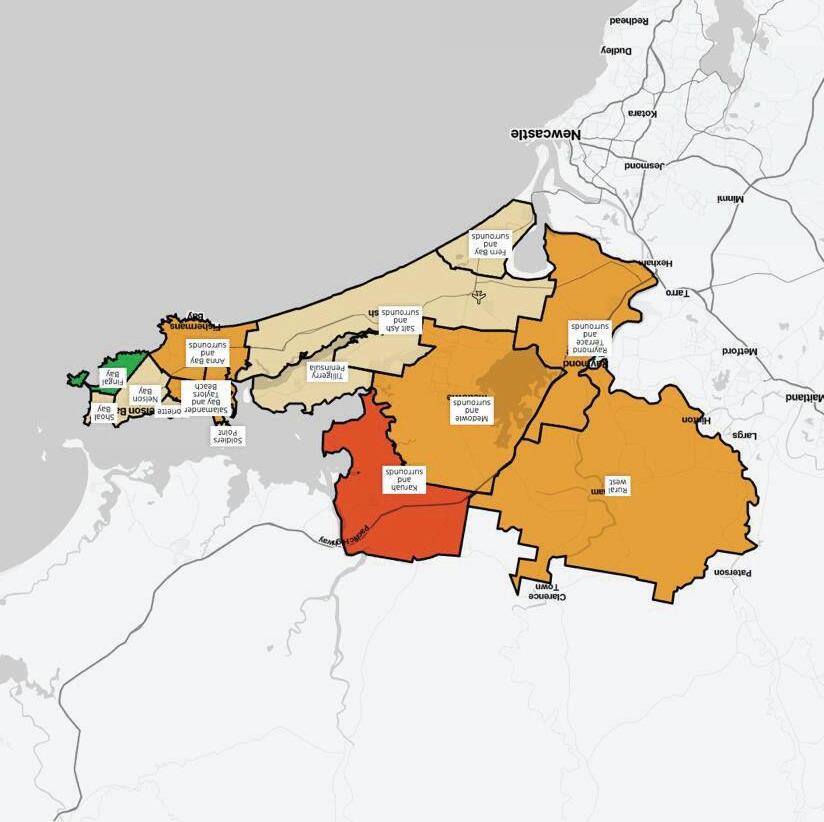
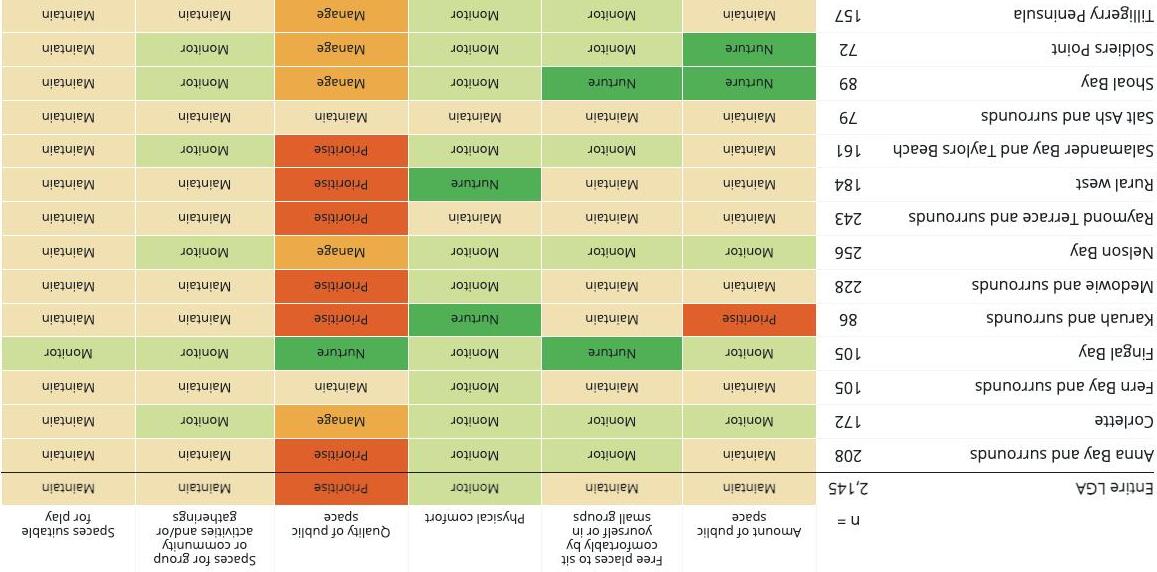
The Open space theme is contributing mostly positively for the suburbs in Port Stephens.
• ‘Quality of public space’ is seen as a priority for most of the geographies
• ‘Physical comfort’ has reduced in priority level for Fern Bay and surrounds, and Soldiers Point since 2020
ACTIONABLE INSIGHTS – SOCIAL FACILITIES AND SERVICES
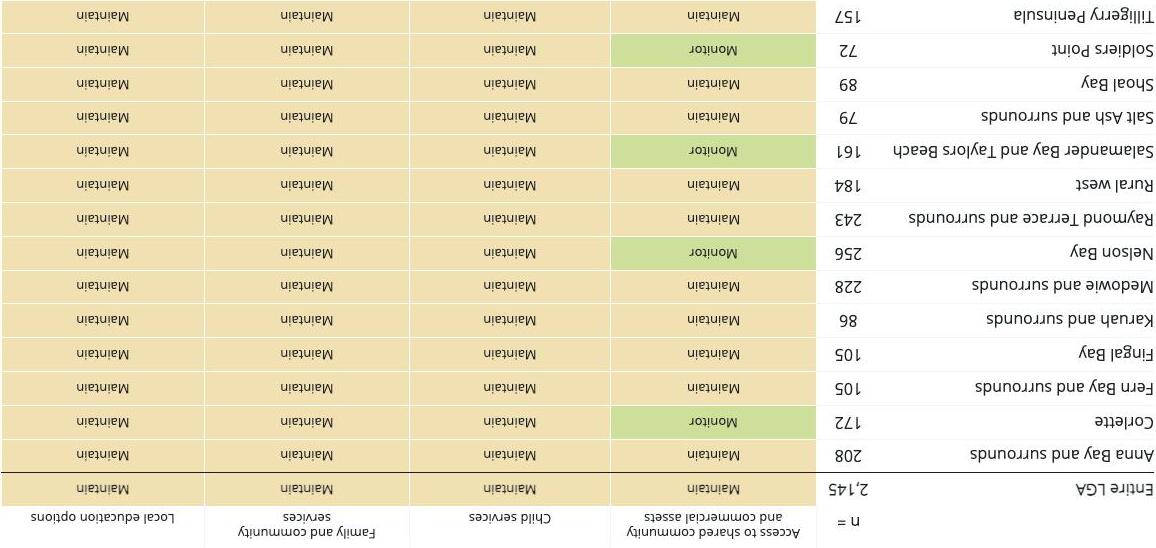
The Social facilities and services theme is not a major priority area for suburbs in Port Stephens.
• This theme is generally performing similar to 2020, with some areas increasing priority level
• ‘Access to shared community and commercial assets’ is the attribute with the lowest priority level in this theme
COMMUNITY IDEAS FOR CHANGE
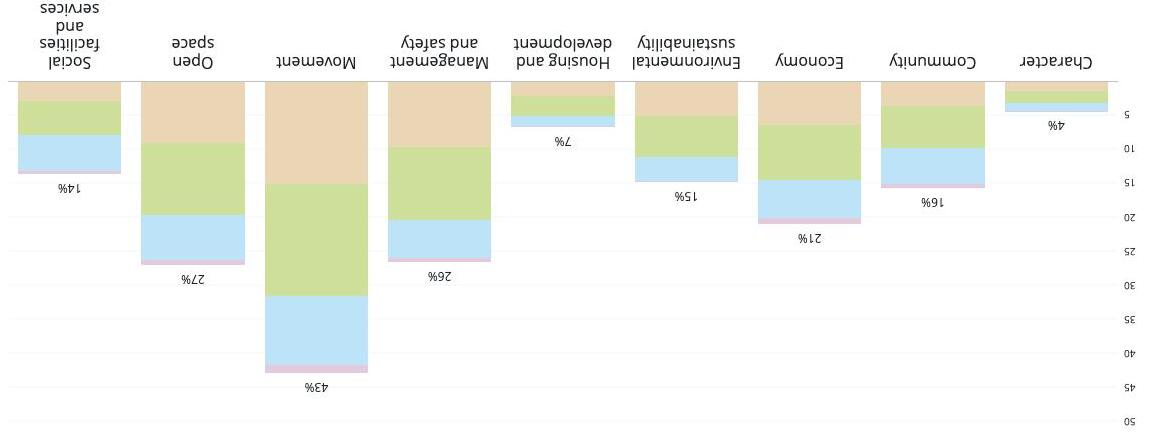
3,456 community ideas were collected from LGA residents
These have been coded into 9 common council themes to illustrate where the community would most benefit form change.
The top improvement areas are:
• Movement (43%)
• Open Space (27%)
• Management and safety (26%)
These ideas can be further analysed on your Liveability Platform
2024 LGA Community ideas for change by age group
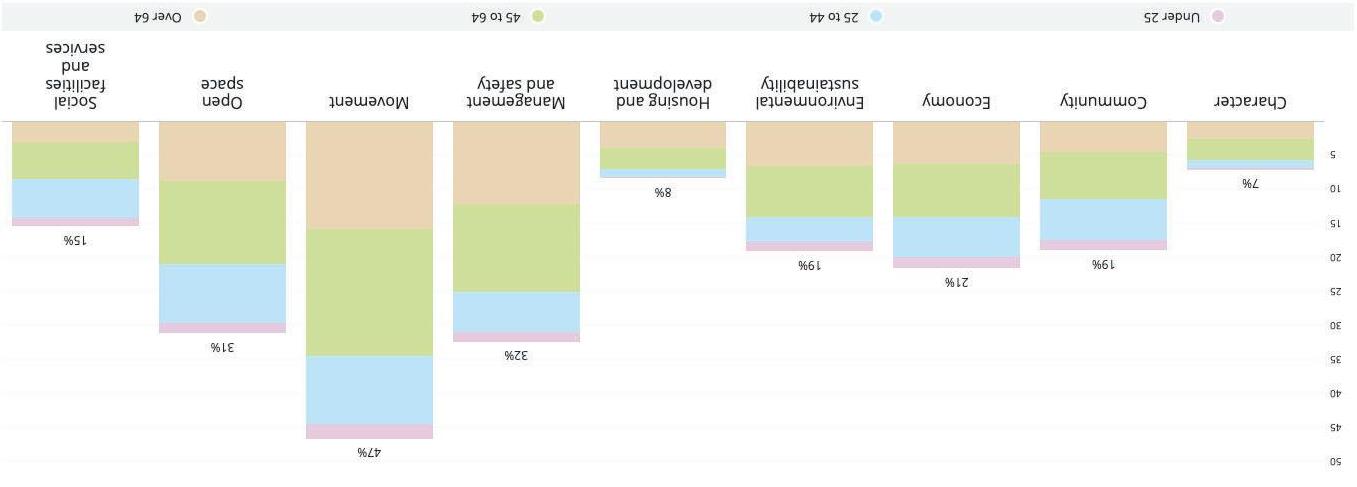
2020 LGA Community ideas for change by age group
GLOSSARY
Liveability
Social research like Australian Liveability Census reflects the Australian school curriculum definition of liveability as ‘an assessment of what it’s like to live in a place.’ It gives a voice to the community about their values, how neighbourhoods are performing for them and their ideas for improvements that will make a difference to them.
Place Attributes
Place Score has developed 50 liveability metrics , also called Place Attributes to measure the liveability of a neighbourhood. Participants rated the performance of the same 50 Place Attributes between ‘Perfect’ and ‘Fail’. These translate to a score between 0 and 10 for each attribute.
Community Values (CF)
This community values data indicates what people value most in their ideal neighbourhood. 50 neighbourhood Place Attributes are ranked according to the percentage of people who selected them as important in their ideal neighbourhood. Council can use these results to understand what is most important to the community. This data also reveals where the community is in agreement as well as possible areas of conflict.
Place Experience (PX)
Place Experience (also known as performance) reveals how people rate the lived experience of their current suburb of residence. Council can use these results to understand the attributes that are contributing most to liveability and which are detracting from community satisfaction.The overall place experience of a place is calculated out of 100.
Strengths and Priorities
Strengths are those Place Attributes that are highly valued by your community and positively rated. Priorities are those attributes that are highly valued but performing poorly. Council can use these results to prioritise investment in those areas that will impact most people.
Community Ideas
At the end of the survey, all respondents were also invited to share a big and a small idea on what would make their neighbourhood a better place for them to live in.This provides a wealth of local expertise to guide action in liveability improvements.
Nurture
These attributes are both valued by a significant proportion of the community and rated most highly for performance. These are the strongest contributors to local liveability. They should be strengthened and protected.
Prioritise
These attributes are highly valued by the community but rated poorly. Increasing the performance of these attributes will deliver the biggest benefit to the community.
Manage
These attributes are valued by the community but not performing as well as they could and are not quite an emergency. Increasing investments in these attributes can make them great contributors to local liveability, or maintain the current level of investment to prevent future problems.
Monitor
These attributes are rated well and are among the top performers, but not highly valued compared to other attributes. Monitoring performance of these attributes will ensure they do not become something we need to manage in the future.
Maintain
These attributes are rated the lowest and are potential threats, but not the most valued. If values change, these attributes can move up to 'Prioritise'. Engage with stakeholders to future-proof or de-risk these attributes.
Thank you