1 minute read
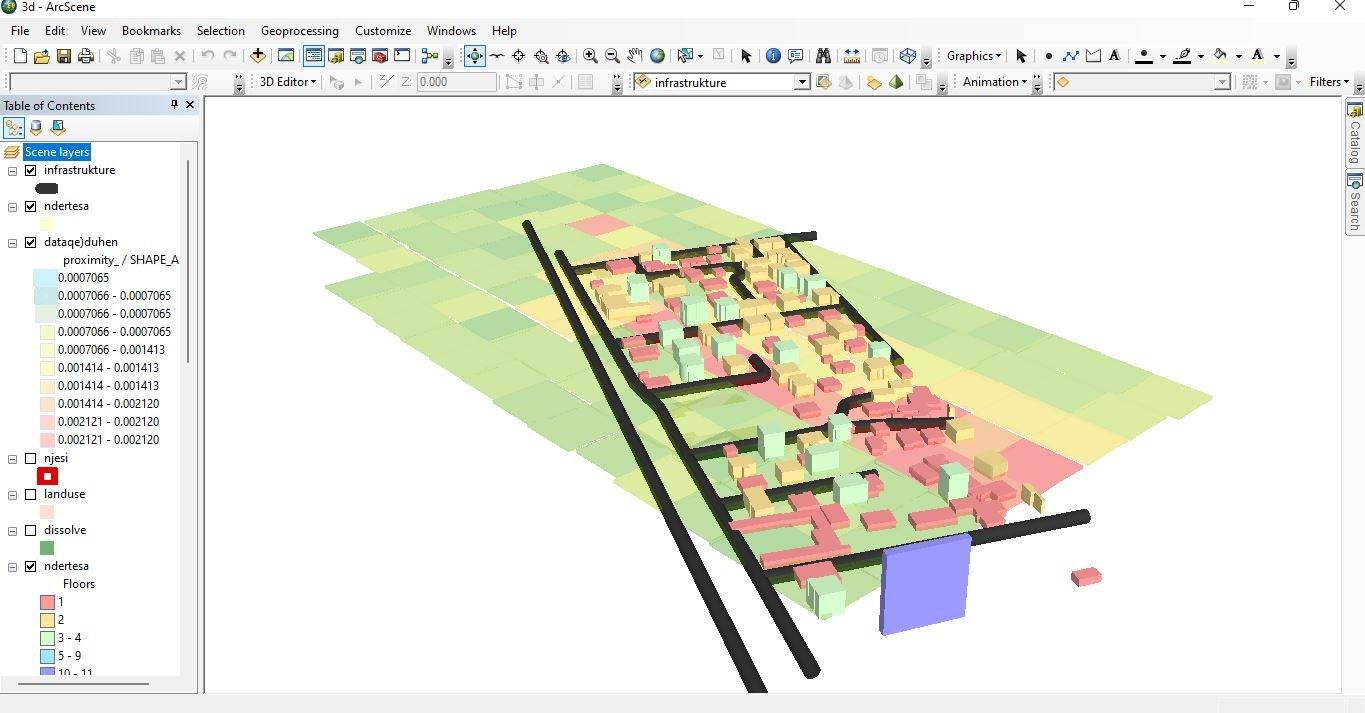
FIGURE 29 THE OVERLYING OF THE BUILD, VOID AND TRANSIT AREAS IN OUR CASE

Figure 33 The overlying of the build, void and transit areas in our case
With this map outcome we can observe what is the number of buildings that have a high density with low accessibility and what buildings have low accessibility, also high accessible areas with no built volume, which as a result become areas were future development can occur. Calculating the overall proximity to transit and how effective this proximity is within the area we use:
Advertisement
Np= Number of Trips in Public transportation Nt= Total number of Trips

218

The data measured in the table below belong to the data field by the researcher during the two different times of observation. The first observation happened in the interval of two hours from the 11:00 am to 13:00 pm on June 20th 2020, in the two intersections of the area. The second observation took place between 9:00 am and 11:00 am at the same intersections on 21st November 2021.

219
