2 minute read
Community Input & Background
DEMOGRAPHIC PROFILE
A look into the demographics helps to frame the characteristics of the plan area’s population. This information is used to guide recommendations for policies and changes to the built environment. This information is derived from the American Community Survey 2014-2019 5-year using Esri’s Community Analyst software that aggregates multiple block groups that make up the plan area. This gives us the most accurate information for the defined area and helps tell the story of the plan area demographics.
Population by Age Cohort Under 5 years 5 to 9 years 10 to 14 years 15 to 19 years 20 to24 years 25 to 29 years 30 to 34 years 35 to 39 years 40 to 44 years 45 to 49 years 50 to 54 years 55 to 59 years 60 to 64 years 65 to 69 years 70 to 74 years 75 to 79 years 80 to 84 years 85 years+
050100150200250300350400


35.2 Median Age
2.54 People per Household
Educational Attainment
21.1% Less Than High School
32.4% Some College/ Associates
30.0% High School/GED
$43,573 Median Household Income
21.9% Households Below Poverty Line
Employment of Residents by Industry
Demographic Takeaways
The following are a few summary conclusions derived from reviewing the demographics within the plan area:
• A majority of the homes in the plan area were built in the 1950s.
• The predominant mode of transportation for to work for plan area residents is vehicular, with other modes making up less than 1%.
• There is a substantial amount of young people within the population, with the largest age cohort being 20-24 years old, followed by 25-29.
• Median household income is low, and the number of households below the poverty line is high.


• Over half of the homes in the neighborhood are rentals.
Public Engagement


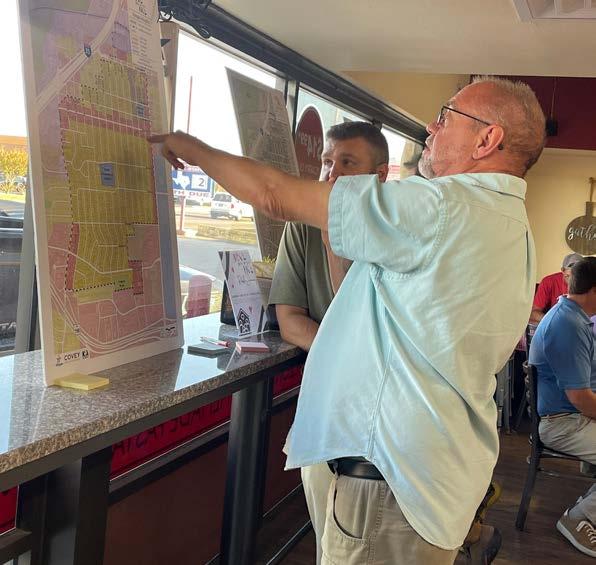
The Neighborhood Planning Team was challenged to develop a community engagement method so that crucial feedback could be gathered from the residents of the Temple Heights Neighborhood. The City Staff conducted events in an effort to engage plan area residents and inform them about the planning effort. As part of that outreach, residents were asked to respond to a three question survey, as well as a longer online survey. The results of the outreach efforts are highlighted on the following pages.

Online Survey Results
Performance Vs Importance
The performance versus importance assessment matrix asks survey respondents about their views on the City’s performance in provision of facilities and/or services, as well as the importance of those same facilities and/or services. These responses are plotted against each other to provide a measurement and suggested prioritization for planning efforts, by showing the results in conjunction with the target line (the point where importance and performance meet).
Rate the following land uses on their importance to the Temple Heights Neighborhood (1–unimportant, 5 – most important).
Rank your preference of the following safety measures.
Public Survey Takeaways
The following are a few summary conclusions derived from reviewing the online survey responses:


• The biggest assets of the neighborhood are its closeness and quiet nature, while the biggest weaknesses of the plan area is its sidewalks and traffic.
• As a whole, the City’s provision of services are in the “Keep It Up” quadrant of the performance vs importance assessment. However, all elements are below the target line with public safety, street conditions, and sidewalks highlighted by survey respondents as needing the most attention from the City for improvements.
• Lighting was identified as survey respondents as very important to improving safety within the neighborhood.
• Survey respondent’s identified the lack of sidewalks and sidewalk conditions are reoccurring concern withing the Temple Heights Neighborhood District.
• Dining and shopping options are identified as a missing business within the plan area.


