22 minute read
WATER IN VENTURA COUNTY AGUA EN EL CONDADO DE VENTURA

Learn about what watershed you live in, discover parks and open space where you enjoy local water resources, learn strategies for catching and storing rainwater, and learn about future predictions of flooding and sea-level rise.
AGUA EN EL CONDADO DE VENTURA
Aprenda sobre la cuenca hidrográfica en la que vive, descubra parques y espacios abiertos donde disfruta de los recursos hídricos locales, aprenda estrategias para capturar y almacenar agua de lluvia y conocer las predicciones futuras de inundaciones y aumento del nivel del mar.
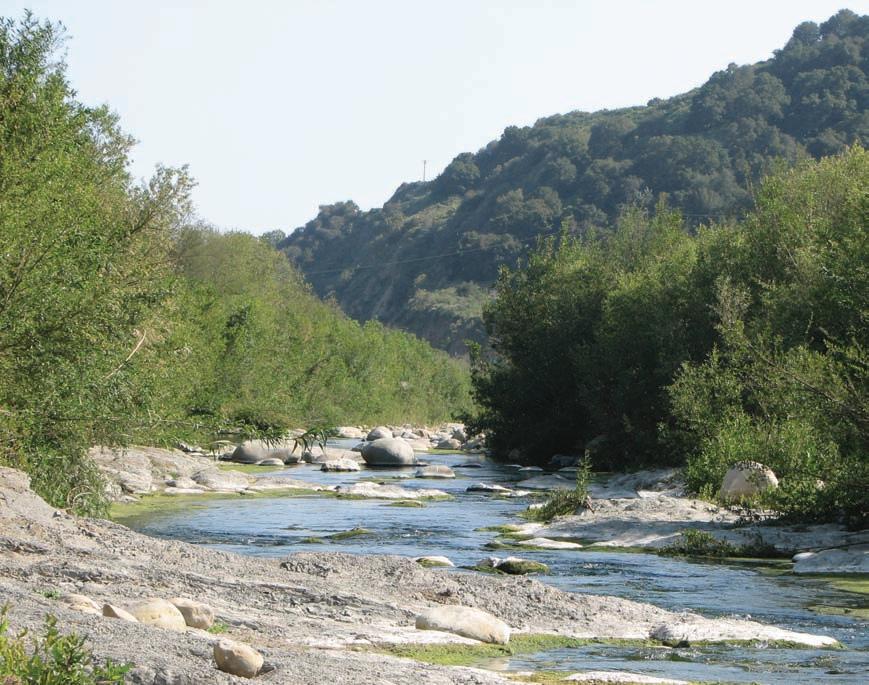
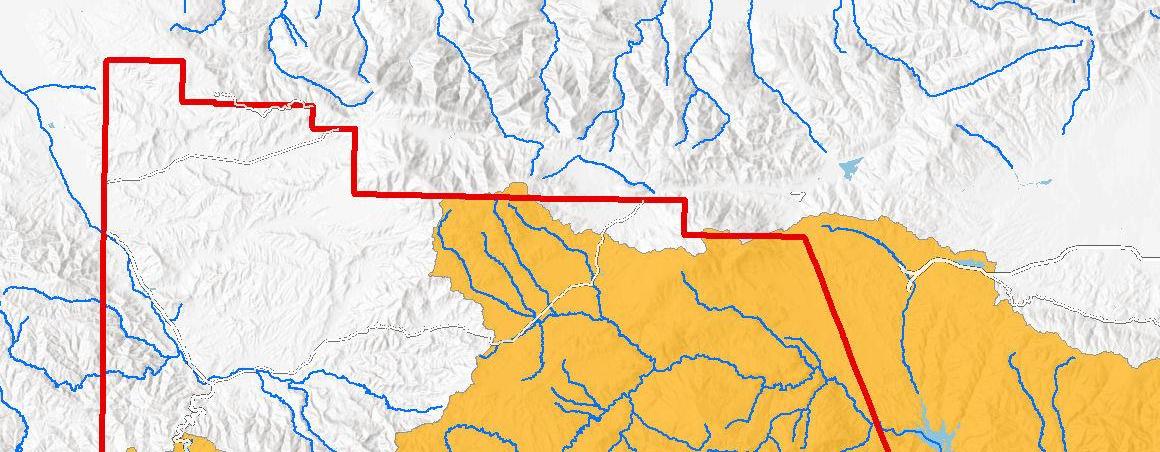
o WHAT IS A WATERSHED? P A watershed is a land area that channels rainfall and snowmelt into creeks, streams, and rivers that flow into a common i SanEmi gdi oCreek CuddyCreek l e t Cree k Salt C r e e k G rapevineCreek Te cuyaCree k ¿QUE ES UNA CUENCA? Una cuenca hidrográfica es una área de tierra que canaliza la agua de lluvia y el deshielo en arroyos, riachuelos y ríos que PastoriaCreek outlet such as a reservoir, bay, or the ocean. For example, the desembocan en una salida común al océano. Por ejemplo, la cuenca hidrográfica del río Ventura sería los barrios circundantes y el terreno natural. El condado de Ventura tiene tres cuencas hidrográficas principales: Calleguas Creek, Santa Clara River y Ventura River Watersheds. watershed of the Ventura River would be the surrounding neighborhoods and natural terrain. P Ventura County has three major watersheds: Calleguas Creek, Santa Clara River, and Ventura River Watersheds. FIGURE ii The Lower Ventura River, looking south from its confl uence with the Canada Larga. Source: Vision Plan for the Lower Ventura River, 2008. T he Ventura River watertalks.csusb.edu To learn more about your watershed and groundwater basin, visit the website below. ^ _^ _ ^ _^ _ ^ _ ^ _^ _ ^ _ Calleguas Cree k Santa Pa l a C ree Snowy Creek BellCreek SeymourCreek DryCreek Tinta Creek Mutau Creek Arroyo Ca labasas Sesp e C r eek SantaClaraRiver Bould erC r eek Matili jaCree k GormanCreek S isar Creek Thacher Cree k San AntonioCreek P SanEmi gdi oCreek AlamoCreek CuddyCreek Castai c C reek ArroyoConejo l i t Cree k Salt C r e k TuleCreek Ventu r River Piru Creek LasVir ge n e s C ree k G rapevineCreek Cuyama River BeardsleyWash PastoriaCreek Roc k C reek BuckCreek Arroyo Simi Conejo Creek ArroyoSantaRosa Med e a C r e ek Te cuyaCree k Arroyo Las Posas R ev ol on Sl o u gh Piru FillmoreSanta Paula Casitas Springs Oxnard Saticoy West Ventura ^Nyeland £ ¤ 1 10 ¬ « 32 ¬ « 11 8 El Rio Acres _ ^ _^ _ ^ _ ^ _ ^ _ ^ _^ _ Calleguas Cree k Santa P a u l a C rek Snowy Creek BellCreek SeymourC reek DryCreek MutauCreek Arroyo Ca labasas Sesp e C r eek kSantaClaraRiver Bould erC reek GormanCreek S isar Creek e SanEmi gdi oCreek CuddyCreek Castai c C reek ArroyoConejo l i t o Cree k Salt C r e e k PiruCreek LasVir ge n es C ree k G rapevineCreek Bear dsleyWash PastoriaCreek ColdCreek BuckCreek Arroyo Simi ConejoCreek ArroyoSantaRosa Med e a C r eek Te cuyaCree k a ArroyoLasPosas R evol onSl ou gh Piru FillmoreSanta Paula Oxnard aticoy ra eland ° £ ¤ 1 10 £ « 32 £ « 11 8 El Rio ^ _^ _ ^ _^ _ ^ _ ^ _^ _ ^ _^ _ Calleguas Cree k kSanta P a u l a C re Snowy Creek BellCreek SeymourC reek DryCreek Tinta Creek MutauCreek Arroyo Ca labasas Sesp e C r ek SantaClaraRiver Bould erC reek e Matili jaCree k GormanCreek S isar Creek Thacher Cree k SanAntonioCreek P SanEmi gdi oCreek AlamoCreek e CuddyCreek Castai c C reek ArroyoConejo l e i t o Cree Salt C r e e k TuleCreek Ventu r River PiruCreek LasVir ge n es C ree k G rapevineCreek Cuyama River Bear dsleyWash PastoriaCreek Roc k C reek ColdCreek BuckCreek Arroyo Simi ConejoCreek ArroyoSantaRosa Med e a C r eek Te cuyaCree k ArroyoLasPosas R evol onSl ou gh Piru FillmoreSanta Paula Casitas Springs Oxnard Saticoy West Ventura Nyeland £ ¤ 1 10 £ « 32 £ « 11 8 El Rio ^ _^ _ e ^ _^ _ ^ _ ^ _^ _ ^ _ Calleguas Cree k Santa Pa u l a C reek Snowy Creek BellCreek SeymourCreek DryCreek Tinta Creek Mutau Creek Arroyo Ca labasas Sesp e C r eek SantaClaraRiver Bould erC r eek Matili jaCree k GormanCreek S isar Creek Thacher Cree k San AntonioCreek k AlamoCreek Castai c C reek ArroyoConejo TuleCreek Ventu r a River Piru Creek LasVir ge n e s C ree k Cuyama River BeardsleyWash e Roc k C reek ColdCreek BuckCreek Arroyo Simi Conejo Creek ArroyoSantaRosa Med e a C r e ek Arroyo Las Posas R ev ol on Sl o u gh Piru FillmoreeSanta Paula a Casitas Springs Oxnard uSaticoy West Ventura ^Nyeland £ ¤ 1 10 ¬ « 32 ¬ « 11 8 El Rio Acres _ VENTURA COUNTY! VENTURA COUNTY WATERSHEDS o CUENCAS HIDROGRÁFICAS DEL CONDADO DE VENTURA
ColdCreek
5 10 20
County Boundary Wat Miles ersheds ° IRWM Region Calleguas Creek Watershed RiversCounty Boundar Santa Clara River Watershedy Watersheds County Boundary Waterbodies IRWM Regi Waon tershedsVentura RiverCaWatershlleguaeds Creek 0 Watershed IRWM Region Calleguas Creek Watershed Rivers Santa Clara River Rivers WaterbodWaterie bs odies Santa Water Clara River shedWatershed Ventura River WatershVentura ed River Watershed
5 10
Miles
Source: USGS, 2018; Ventura County, 2015
20
Para obtener más información sobre su cuenca hidrográfica y subterránea, visite el sitio web anterior.
HOW CAN WE CATCH AND STORE RAINWATER?
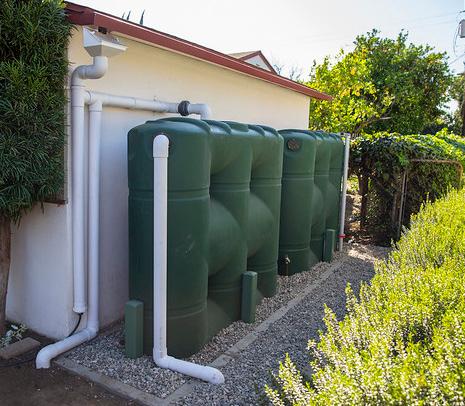
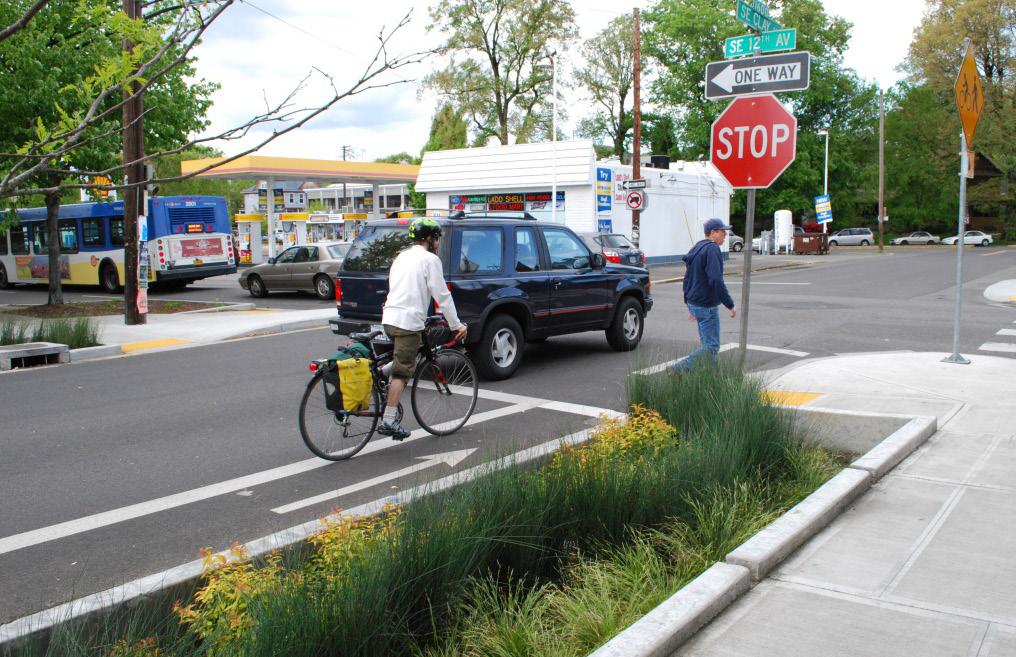
It is crucial to our water supply that we treat and clean contaminated runoff, or urban runoff, by catching, storing, and treating this water through various green infrastructure strategies. Strategies include constructing rain gardens, bioswales, and bioretention ponds; protecting open space; removing hardscape; and redirecting rainwater that falls on rooftops and parking lots into large tanks (cisterns) where it can be stored for later use. These strategies help keep our waterways and ocean clean, and help replenish our groundwater supply and reduce our dependence on imported water. Additionally, sustainable landscaping and irrigation practices can reduce and treat urban runoff while also conserving water.
¿CÓMO PODEMOS CAPTURAR Y ALMACENAR AGUA?
Es crucial para nuestro suministro de agua que tratemos y limpiemos escorrentía, o escorrentía urbana, mediante la captura, el almacenamiento y el tratamiento de la escorrentía urbana. Las posibles estrategias para atrapar y almacenar agua incluyen la creación de jardines de lluvia, bioswales, estanques de bioretención; proteción del espacio abierto; eliminación de superficies duras; y la redireción del agua de lluvia que cae en los tejados y estacionamientos hacia grandes tanques (cisternas) donde se pueda almacenar para su uso posterior.
Estas estrategias pueden ayudar a mantener nuestras vías fluviales y el océano limpios, y reponer nuestro suministro de agua subterránea y reducir nuestra dependencia de agua. Además, las prácticas sostenibles de paisajismo y riego pueden reducir y tratar la escorrentía urbana, al mismo tiempo que se conserva el agua.
WHERE DOES WATER GO? ¿A DÓNDE VA EL AGUA?
Green infrastructure practices in our cities helps clean, filter and collect our rainwater.
Las prácticas de infraestructura ecológica en nuestras ciudades ayudan a limpiar, filtrar y recolectar el agua de lluvia.
In Ventura County, municipal wastewater (sewage) is also treated and re-used.
En el condado de Ventura, las aguas residuales municipales también se tratan y se reutilizan.
5
Surface water flows into rivers, streams and reservoirs.
El agua superficial fluye hacia ríos, arroyos y embalses.
2 1
4
3
Examples of Green Infrastructure | Ejemplos de infraestructura verde: Rain Garden Jardín de lluvia Cistern Cisterna Drought Tolerant Garden Jardín Tolerante Sequía

Rain falls to the earth and collects on the surface or seeps underground.
La lluvia cae a la tierra y se acumula en la superficie o se filtra bajo tierra.
Groundwater is stored in underground reservoirs also known as “aquifers.”
El agua subterránea se almacena en depósitos subterráneos también conocidos como “acuíferos.”

THE SANTA CLARA RIVER IS 83 MILES LONG. EL RÍO DE SANTA CLARA ESTÁ 83 MILLAS DE LARGO.


THE VENTURA RIVER IS 16 MILES LONG. EL RÍO DE VENTURA ESTÁ 16 MILLAS DE LARGO.
AMERICANS DRINK OVER 1 BILLION GLASSES OF TAP WATER EACH DAY. AMERICANOS BEBEN MÁS DE MIL MILLONES VASOS DE AGUA DEL GRIFO CADA DIA.
STEELHEAD TROUT LIVE IN BOTH THE VENTURA AND SANTA CLARA RIVERS. STEELHEAD TROUT VIVEN EN LOS RÍO DE VENTURA Y SANTA CLARA.
THE VENTURA RIVER DRAINAGE WAS HISTORICALLY HOME TO THE CHUMASH EL DRENAJE DEL RÍO VENTURA HISTÓRICAMENTE FUE EL HOGAR DE LA TRIBU CHUMASH.
LOS JARDINES DE LLUVIA PUEDEN ELIMINAR HASTA EL 90% DE LOS PRODUCTOS QUÍMICOS DE LA ESCORRENTÍA DE TORMENTAS.
SHARE YOUR INPUT BY TAKING OUR SURVEY!
¡COMPARTE TUS COMENTARIOS TOMANDO NUESTRA ENCUESTA!
Your input on your community needs & priorities is needed to inform water-related project funding decisions!
¡Su opinión sobre las necesidades y prioridades de su comunidad es necesaria para informar las decisiones de financiamiento de proyectos relacionados con el agua!
Take the survey online at: Responda a la encuesta en linea: watertalks.csusb.edu
Or complete the paper survey attached to this newspaper! ¡O complete la encuesta en papel en este periódico!
WIN $100! New winners every month!
Survey participants can enter into a drawing to win one of several $100 Visa Gift Cards!
Los participantes de la encuesta pueden participar en un sorteo para tener la oportunidad de ganar uno de varios $100 Certificado de Visa!
¡GANA $100! ¡Nuevos ganadores cada mes!
Surveys must be completed by April 30, 2021 Las encuestas deben ser completadas antes del 31 de abriil de 2021.
To learn more about your water and how to get involved in planning for your community’s water, visit watertalks.csusb.edu! ¡Para obtener más información sobre el agua y cómo involucrarse en la planificación del agua en su comunidad, visite watertalks.csusb.edu!
¿DÓNDE ESTÁN MIS PARQUES Y VÍAS FLUVIALES LOCALES? ¿QUÉ ÁREAS ESTÁN EN RIESGO DE INUNDACIONES?
SnowyCree k
WHERE ARE MY LOCAL PARKS AND WATERWAYS? Angeles NF Ald er Creek Ca staicCreek FishCreek PiruCreek BuckCreek Ca staicCreek Los Padres WHAT AREAS ARE AT RISK OF FLOODING?NF Castaic Lake SRA
Castaic Lake SRA Los cuerpos de agua, los hábitats y los espacios abiertos además de proporcionar lugares de recreación y descanso, contribuyen a mejorar la calidad de vida en nuestras comunidades. Miles de visitantes nadan, vadean, practican kayak y pescan en distintos sitios de agua dulce a lo largo de nuestra región. Sin embargo, ciertos contaminantes pueden representar un riesgo para la salud de aquellos que se recrean y comen peces de nuestros ríos y arroyos. Antes de recrear, revise los informes de calidad del agua. Visite la página web del Consejo de Monitoreo de la Calidad del Agua de California para obtener más información: https://mywaterquality.ca.gov/index.html Nuestros parques locales y espacios abiertos también son muy importantes para ayudar a controlar las inundaciones. El Distrito de Protección de Cuencas Hidrográficas del Condado de Ventura (VCWPD) es responsable de la planificación de la salud de las cuencas hidrográficas, la protección contra inundaciones y el manejo de aguas pluviales dentro de las áreas no incorporadas del Condado. El mapa a continuación identifica los parques y vías fluviales locales, y mapea las áreas potenciales de inundación.
Water bodies and the habitats and open space they support can provide places for recreation and respite, contributing to quality of life in our communities. Thousands of visitors swim, wade, kayak, and fish at dozens of freshwater sites located across our region. However, certain contaminants can pose a health risk to those that recreate in and eat fish from our local streams and rivers. Visit the California Water Quality Monitoring Council website to learn more : https://mywaterquality.ca.gov/index.html Our local parks and open space are also very important to help protect against flooding events. Our regional and local parks provide buffer and storage capacity for large flood events. The Ventura County Watershed Protection District (VCWPD) is responsible for watershed health planning, flood protection, and stormwater management within the unincorporated areas of the County. The map below identifies local parks and waterways, and maps potential flooding areas. Los Padres NF Matili jaCreek MutauCreek TuleCreek Ro ckC reek ETelegraphRd Del Valle Park Santa Woo BLM Lake Piru ell rk Mill Park Toland Park Happy Camp Canyon RP Hopper Mtn. NWR Sespe Cree k Santa ClaraRiver Piru Fillmore Del Valle Park Santa Clarita Woodlands Park nta ClaraRiver Trail Access Trails with Water Access Rivers Area of Focus Waterbodies Parks with Water Access Parks and Open Space FEMA Flood Zone 500 Year Flood Zone 100 Year Flood Zone Acceso al sendero Parques con acceso al agua Senderos con acceso al agua Parques con espacio abierto Ríos Zona de inundación de FEMA Área de enfoque Zona de inundación de 500 años Zona de inundación de 500 añosCuerpos de agua LEGEND | LEYENDA Angeles NF Ald er Creek Ca staicCreek FishCreek SnowyCree k PiruCreek BuckCreek Clarita dlands Park Trail Access Trails with Water Access Rivers Area of Focus Waterbodies Parks with Water Access Parks and Open Space FEMA Flood Zone 500 Year Flood Zone 100 Year Flood Zone Acceso al sendero Parques con acceso al agua Senderos con acceso al agua Parques con espacio abierto Ríos Zona de inundación de FEMA Área de enfoque Zona de inundación de 500 años Zona de inundación de 500 añosCuerpos de agua Trail Access Trails with Water Access Rivers Area of Focus Waterbodies Parks with Water Access Parks and Open Space FEMA Flood Zone 500 Year Flood Zone 100 Year Flood Zone Acceso al sendero Parques con acceso al agua Senderos con acceso al agua Parques con espacio abierto Ríos Zona de inundación de FEMA Área de enfoque Zona de inundación de 500 años Zona de inundación de 500 añosCuerpos de agua 0 Castaic Lake SRA
Tapo 8 WaterTalks | watertalks.csusb.edu Trail Access Trails with Water Access Rivers Area of Focus Waterbodies Parks w Parks a FEMA 500 Yea 100 Yea Acceso al sendero Parques con acceso al agua Senderos con acceso al agua Parques con espacio abierto Ríos Zona de inundación de FEMA Área de enfoque Zona de inundación de 500 años Zona de inundación de 500 añosCuerpos de agua ETelegraphRd Rocky Peak Park Sage Ranch Park Yellowhill Valle Lindo Park Big Rock Beach Circle X Ranch Malibu Creek SP Tapia Park Forest Cove Park Ladyface Mtn. Grape Arbor Park Secret Valley Del Sol Park Estella Park Upper Stokes Arroyo Park North Ranch College Park Verde Park Santa Monica Mtns. NRA Serrano Valley Chase Park Lanark Rec. Ctr. Palo Comado Canyon Brittel Park Dewar Park Lang Ranch OS Knapp Ranch Park Durley Park South Winds Park Bolker Park South Ranch OS Tapo Canyon Park Middle Santa Clara River Wildwood Park Lebow Llano Carbon Beach Rocky Ledge Saddle Peak Topanga SP Tuna Canyon Park King Gillette Ranch Piuma Ridge Park Del Valle Park Solstice Canyon Santa Clarita Woodlands Park Rocky Oaks Castro Crest Hennesy Property Dizdar Park Arneill Ranch Park Grant Park Westlake Vista Charmlee Wilderness Park Mae Boyar Park Zuma/Trancas Canyons Arroyo Verde Park Hope Nature Preserve Knolls Park Knoll OSDos Vientos OS McCrea Ranch McGrath SB Oak Park Decker Canyon Rio Lindo Park Sierra Linda Park Ormond Beach BLM Lake Piru Daly Ranch Park Foster Park Ebell Park Mill Park Toland Park Olivas Links GC Corral Canyon Big Sky Park Simi Dog Park Faria Beach Park Puerco Beach Sinaloa GC Simi Hills GC Gage OS Conejo Canyons OS Sunset Hills OS Deer Creek OS Stone OS Happy Camp Canyon RP Leo Carrillo SP Point Mugu SP Rancho Simi Rec. Area Saticoy Reg. GC Hopper Mtn. NWR CalleguasCree k BellCreek CoyoteC r e e k Arroy o Calabasas Sespe Cree k Santa ClaraRiver SanAntonioCreek A r royo Conejo V e ntu ra Rive Las Vi r genes C r e e k ColdCreek Arroyo Simi LionCreek ConejoCreek ArroyoSanta Rosa M ed e a C r ee k ArroyoLasPosas R evol onSlou gh Piru Fillmore Santa Paula Casitas Springs Saticoy West Ventura £ ¤ 1 10 £ « 32 £ « 11 8 Oxnard rNyeland El Rio Acres Acres Rocky Peak Park Sage Ranch Park Yellowhill Valle Lindo Park Big Rock Beach Circle X Ranch Malibu Creek SP Tapia Park Forest Cove Park Ladyface Mtn. Grape Arbor Park Secret Valley Estella Park Upper Stokes Arroyo Park North Ranch Verde Park Santa Monica Mtns. NRA Serrano Valley Chase Park Lanark Rec. Ctr. Palo Comado Canyon Lang Ranch OS Knapp Ranch Park South Ranch OS Canyon Park rWildwood Park Lebow Llano Carbon Beach Rocky Ledge Saddle Peak Topanga SP Tuna Canyon Park King Gillette Ranch Piuma Ridge ParkSolstice Canyon Rocky Oaks Castro Crest Hennesy Property Dizdar Park Arneill Ranch Park Westlake Vista Charmlee Wilderness Park Mae Boyar Park Zuma/Trancas Canyons Hope Nature Preserve Knolls Park Knoll OSDos Vientos OS McCrea Ranch Oak Park Decker Canyon Corral Canyon Big Sky Park Simi Dog Park Puerco Beach Sinaloa GC Simi Hills GC Gage OS Conejo Canyons OS Sunset Hills OS Deer Creek OS Stone OS Leo Carrillo SP Point Mugu SP Rancho Simi Rec. Area e CalleguasCree k BellCreek Arroy o Calabasas A r royo Conejo Las Vi r genes C r e e k ColdCreek Arroyo Simi ConejoCreek ArroyoSanta Rosa M ed e a C r ee k ArroyoLasPosas 0 9 184.5 Miles ° £ ¤ 1 10 £ « 32 £ « 11 8 d Acres Acres Rocky Peak Park Sage Ranch Park Big Rock Beach Secret Valley Upper Stokes Chase Park Lanark Rec. Ctr. Knapp Ranch Park Llano Carbon Beach Rocky Ledge Saddle Peak Topanga SP Tuna Canyon Park te h Piuma Ridge Park Knolls Park BellCreek Arroy o Calabasas s Vi r gen ColdCreek 18 ° VENTURA COUNTY: LOCAL PARKS, WATERWAYS AND AREAS OF POTENTIAL FLOODING CONDADO DE VENTURA: PARQUES, SISTEMAS DE AGUA LOCALES Y LAS ZONAS DE POSIBLES INUNDACIONES Source: PlaceWorks, 2019; CPAD, 2019; Ventura County, 2019; USGS, 2018; FEMA, 2018; GreenInfo Network 2019. VENTURA COUNTY!


HOW DOES THE CHANGING CLIMATE AFFECT OUR COMMUNITY?


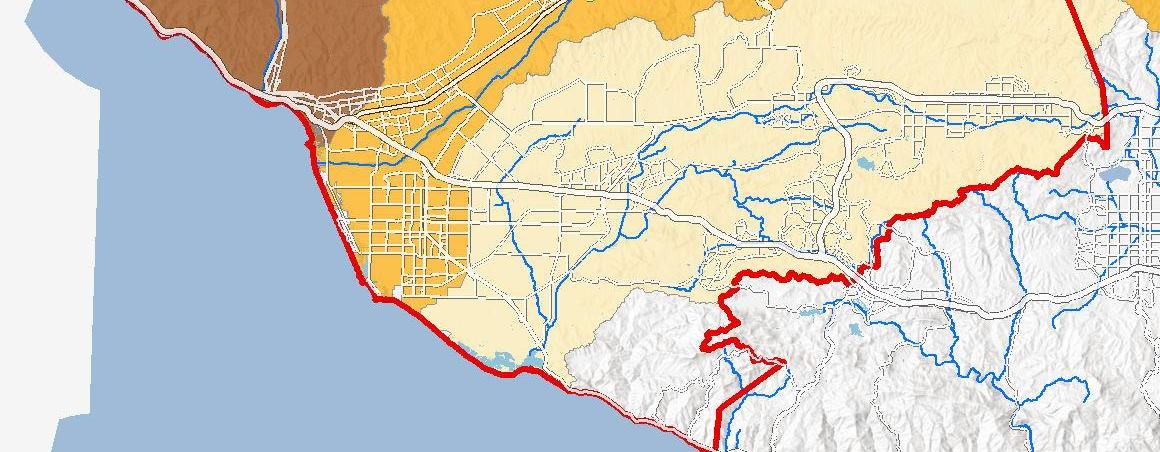
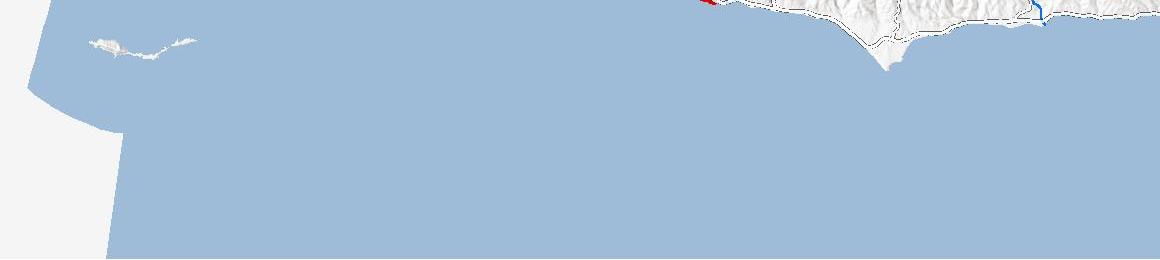
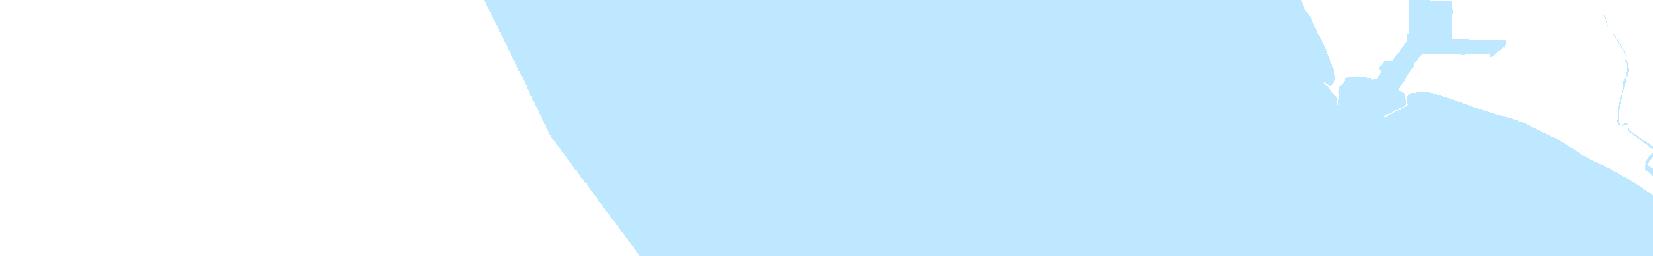
Recent climate models predict sea-level rise, hotter temperatures, and shifts in overall precipitation patterns in coming years. These changes can affect water supply and increase the likelihood of natural disasters. Rising sea levels will affect coastal development and require funding to protect critical infrastructure, such as coastal highways. Sea-level rise can also increase coastal erosion and flooding.


San ¿CÓMO AFECTA EL CAMBIO CLIMÁTICO Buenaventu (Ventura) ra A NUESTRA COMUNIDAD?
San Buenaventura
Los modelos climáticos recientes predicen el aumento del nivel del (Ventura) mar, temperaturas más altas y cambios en los patrones generales de precipitación en los próximos años. Estos cambios pueden afectar el suministro de agua y aumentar la probabilidad de desastres naturales. El Rio El aumento del nivel del mar afectará el desarrollo costero y requerirá fondos para proteger la infraestructura crítica, como las carreteras costeras. El aumento del nivel del mar también puede aumentar la erosión costera y las inundaciones. Santa Paula


The map on page 8 shows flood hazard areas as defined by the Federal Emergency Management Agency (FEMA) based on historic flooding. These maps do not account for changes in climate that may increase potential for flooding.


El mapa de la página 8 muestra las áreas de peligro San de inundación según las define la Agencia Federal Buenaventura para el Manejo de Emergencias (FEMA) según las (Ventura) inundaciones históricas. Estos mapas no tienen en cuenta los cambios climáticos que pueden aumentar el potencial de inundaciones.


To learn more about our changing climate and Oxnard view flood maps visit the website below.
watertalks.csusb.edu Port Hueneme
Saticoy
118


Para obtener más información sobre
nuestro clima cambiante, y ver mapas de 118 inundación visite el sitio web anterior. 118 El Rio


0 0.5 1 2
Miles


WHAT ARE THE POSSIBLE ENVIRONMENTAL CHANGES WE WILL EXPERIENCE? ¿CUÁLES SON LOS POSIBLES CAMBIOS AMBIENTALES QUE EXPERIMENTAREMOS?


Fewer but more intense rain events, flash floods and landslides. Menos lluvias, inundaciones repentinas y deslizamientos de tierra, pero más intensos. Our aquifers will not be as frequently recharged by rainwater. Nuestros acuíferos no serán recargados con tanta frecuencia por el agua de lluvia. Water demand for irrigation and wildfire protection is also likely to increase. También es probable que aumente la demanda de agua para riego y protección contra incendios forestales.
Oxnard
0 0.5 1 2
Miles 0 0.5 1 2
Miles City Boundary Line County Boundary
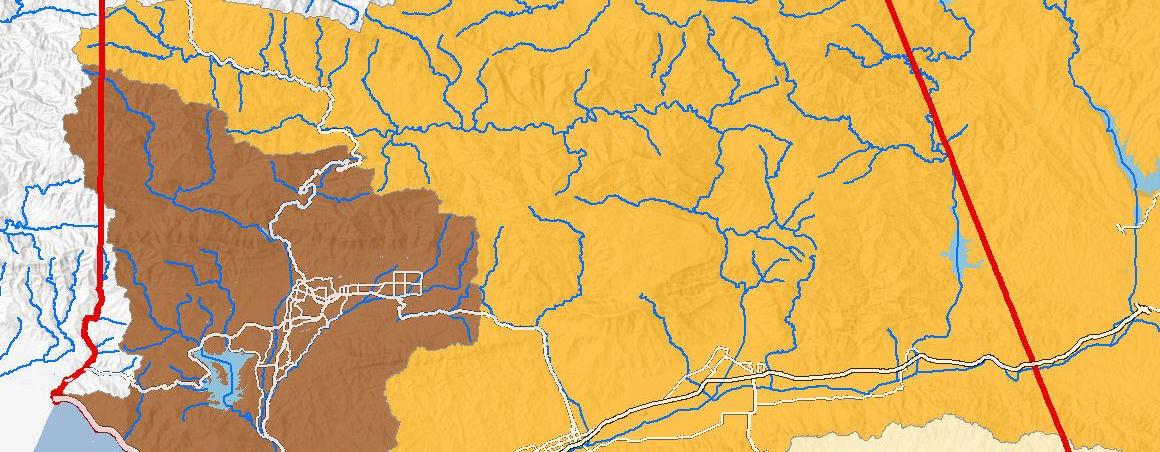
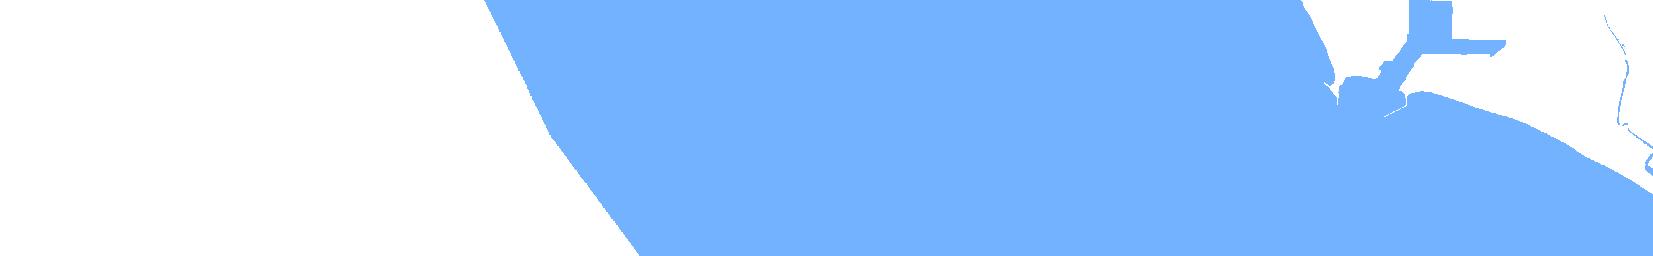
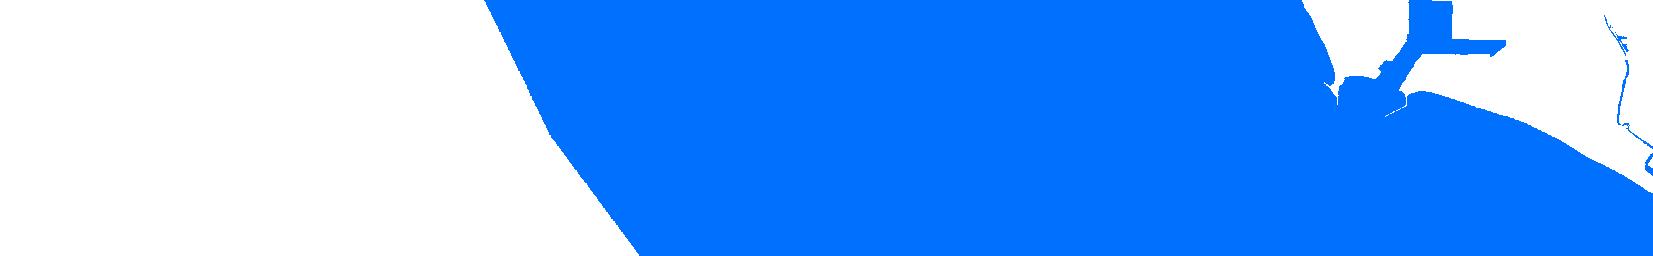
City Boundary Line County Boundary 101Camarillo Current Water Level (2016)
1ft Sea Level Rise (2050)
City Boundary Line 34 County Boundary Current Water Level (2016)
1ft Sea Level Rise (2050) 2ft Sea Level Rise (~2070)
3ft Sea Level Rise (2100)
Port Hueneme
Sea-Level Rise Projections*
Proyecciones de aumento del nivel del mar *
2030: 0.4 feet/pies 2050: 1 foot/pies 2070: 1.7 feet/pies 2100: 3.1 feet/pies
*Source: Low Risk Aversion projections for the Santa Barbara Tide Gauge, California Coastal Commission’s Sea Level Rise Policy Guidance document.
