



Barbara Eckert
Vice President, National Account Executive
Megan Baggett
Account Manager
Ozzie Khan, MD
Medical Executive, National Accounts
Amanda Watkins, RN
Nurse Executive, National Accounts
Eddie Bradford, MBA
Senior Informatics Consultant, Client Reporting

Our Mission
• Current period reflects claims incurred between Jan 2025 and Dec 2025, paid through Feb 2026 (incl. 4% completion factor)
• Base period reflects claims incurred between Jan 2024 and Dec 2024, paid through Feb 2026
• High-cost claimant threshold of $100k was used for this analysis
• Norm represents Cigna’s book of business for Open Access Plus (OAP) in Texas – 944K members
To improve the health and vitality of those we serve


1. Easier Access to Care - We commit to address the challenges customers and patients face by making our processes simpler, easier, and faster.

2. Better Support - We commit to enhanced support and resources to navigate the health care system with greater ease and peace of mind.

3. Better Value - We will provide better value for our customers and patients.

4. Accountability - We will stand behind our commitments to our customers and patients.

5. Transparency - We commit to provide public information on how we are continuously improving to serve our customers better.
Designed for one, scaled for all
Smarter identification
Identify risk early
Models and data
• Artificial intelligence (AI) across 200 + predictive models
• Near real-time insights using prior-day claims data
What it enables
• Earlier detection of conditions and disease progression (e.g., breast cancer: 55 days sooner)
• Rapidly pinpoint cost and risk drivers by market, site, and workforce
• Flag emerging high-cost claimants and rising-risk members early
Accelerated engagement
Act quickly and precisely
Targeted action
• AI-enabled case management with enhanced next-best-action guidance
• Targeted outreach to high-risk and high-cost Populations
• Rapid 24 – 48 Hour post-ED followup for ambulatory-sensitive conditions
Personalized support
• Close care gaps through targeted engagement campaigns
• Hybrid on-site + virtual care model
Deliver care seamlessly
Reduce friction
• 17% reduction in prior authorizations
• Faster approvals: Minutes vs. days
Improve access
• EHR integration + value-based alignment
• Dedicated advocacy pathways for complex and life-altering diagnoses
• Integrated pharmacy + EHR point of care approvals
Reasons for drops:
• Terminations
• Concluded events/risk
• Future claims not expected to exceed $500K
High dollar prescription, stem cell transplant
Gene therapy authorization, high dollar prescription
Bridges historical experience with forward-looking risk
Enabling planning based on where cost is heading, not just where it has occurred
Prior 12 Months Count: 17
TotalDollarsforClaimantsover$500K $19.5M
Integrated predictive modeling and clinical validation
Continuing: At-Risk Over $500K Count: 3-5
TotalEstimatedDollarsin2026 $3.5M - $6.0M
Combines predictive analytics with in-depth, clinician validation to deliver more accurate, actionable cost and risk forecasts
Emerging: At-Risk Over $500K Count: 3-9
TotalEstimatedDollarsin2026 $3.6M - $12.5M
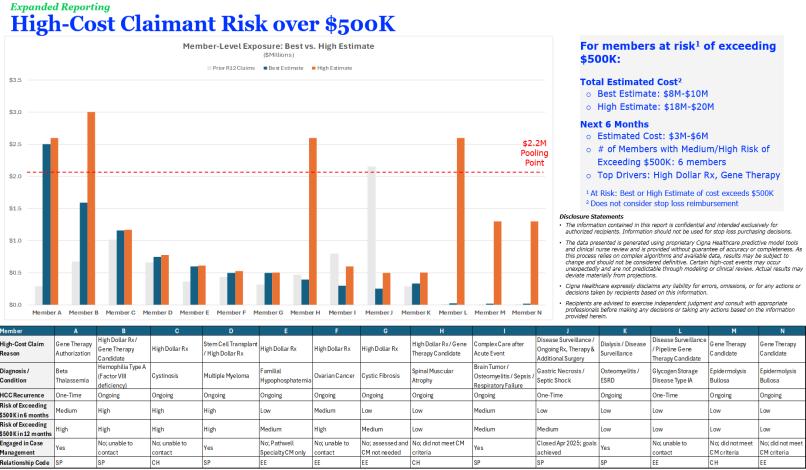
• Predicts future high-cost claimants at the member level before costs materialize, using integrated claims, authorization, and emerging risk signals
• Identifies individuals at risk of exceeding cost thresholds within 12 months, including chronic progression, ongoing utilization, and emerging high-cost events across services

• Membership rose by 2.8% or by 349 members
• H S A plan had the biggest spike in membership increasing by 287 members
• Total PMPM spend rose by 29% +$26.1M year over year
• Well visits and preventive care rates held steady and were above and equivalent to norms, respectively
• PMPM spend rose by 22.2% or up $15.5M
• Non-Catastrophic contributed 16.8% to the overall 29% trend
• Top trend contributors: Musculoskeletal, Gastrointestinal, and Neoplasms
• PMPM Spend rose by 49.6%, up +$10.6M
• Catastrophic claimants contributed 12.2% to overall trend of 29%
• Claimants rose from 12 in 2024 to 20 in 2025
• Average cost per claimant rose from $249K to $280K and is above norm of $259K

• Your Health First is our chronic condition coaching program designed to help members better manage ongoing health conditions through personalized coaching, education, and digital engagement
• Chronic members percentage increased from 43% to 46% and are above norm of 41%
• Chronic members percentage of spend rose from 71% to 74% and is below norm of 77%
• 4,798 members were identified with a chronic condition down from 5,047 in 2024
• 45% of chronic members were engaged down from 46% in 2024 compared norm at 51%
• Top engagement modalities: Preventive Care and Alert with Action
• Top Chronic Conditions: Low Back Pain, Depression and Diabetes
• 82% (16) of catastrophic claimants has a chronic condition
• Hypertension, Obesity, and Disease of the Thyroid were the top chronic conditions for catastrophic claimants

• Prevalence 35%
• Total spend $23.9M
• Joints, Muscle/Connective Tissue, and Fractures/Dislocations make of 68% of spend
• Surgical is the top Outpatient Service category followed by Emergency Room
• Prevalence 3.3%
• Total spend $10.6M
• Cancer Screening compliance rates are below norm for Cervical and Colorectal screenings
• Top Cancers by Spend: Breast, Prostate, and Skin
• 32% (4,103) of members have 1 to 3 of the associated conditions
• Average age of these members is 47 years and 51% are males
• Cost for these members is 2.5x higher than for those without these conditions
• Well Visits
• Cancer Screenings
• Immunizations
• One Guide Customer Navigation Tool
• Personify Well Being Solution
• Paytient
Available at renewal
• Cigna Care Designated OBGYN
• Know Your Lemons Partnership
• Virtual Women’s Health Clinic (Visana)
• Case Management: Complex Gynecology
• Healthy Pregnancies, Healthy Babies
• Fertility Benefits
• Your Health First
• Lifestyle Management Program
• Cancer Care Support Program
• Omada Diabetes Prevention
• Omada Complete
• Education, Tools & Awareness
• MDLIVE
• Behavioral Health
• Nutritional Counseling
• Supplemental Health
• AIRROSTI, ASH Care, and Joint Academy
• Hello Fresh & Food Smart
• Preferred Lab
• Well-Being Strategist

Average Annual Trend, 2019-2025 -
PanTexas Deterrance Achieved a FY 2025 Medical Cost Trend of 29%





Utilization
(Change in Volume of Goods)
Unit Cost (Change in Cost of Goods)

(Change in Basket of Goods)
Demographics (Change in Population)
Demographic Index *
Geography (Change in Location) Service
Medical trend result of 29% driven by a 23% service mix trend and an increase in utilization of 3.5% and unit cost increase of 1.5%
Medical trend was influenced by a decrease of -0.3% in demographic risk

Change in age distribution decreased the demographic Index by -0.3%

Geographic Index * Cigna’s relative market index
Change in population location distribution (state) contributed 0.0% to the overall medical cost trend result



Inpatient Utilization
Management Events
Current: 51 | Base: 74
Current: $316K | Base: $548K
Event Summary
• Admission avoided: 15
• Decertified Days: 6
• Bed Day Intensity Management: 30
• Readmission Avoided: 1
Case Management Outpatient Utilization
Members Engaged
Current: 242 | Base: 271
Current: $856K | Base: $1.3M
Case Management Summary
• Total cases engaged/managed: 254
• Top 3 category managed: Medical Injectable Steerage, Complex, and NICU
Avoided Events
Current:757 | Base: 690
Current: $727K | Base: $783K
Savings are derived from programs including home health care, diagnostic imaging, medical injectables, durable medical equipment, and site of care.
Avoided Events
Current:440 | Base: 335
Current: $499K | Base: $409K
• MSK Pain Management
• Radiation Therapy
• Cardiology Mgmt.
$100,000 Threshold
(Base: 73)
• Average Age: 47
• 41% male
• 39 Employees, 41 Spouses, 24 Dependents
• 10 were new enrollees on the plan (2 Newborns)
• 5 are no longer enrolled on the plan
• 17 were catastrophic in the base period
82% have a chronic condition
• Top chronic conditions were Hypertension, Obesity, Disease Of Thyroid Gland
• 69% have 2+ chronic conditions
#N/A
• Lower Respiratory System was the highest diagnostic category by spend (1 individuals)
• #2 Internal/External Injury (2 individuals)
$280K average cost per individual
(Base: $249K, Norm: $0K)
• Top individual was $1.9M
• 91% of spend was in-network
• 14 exceeded the catastrophic threshold based on medication related spend
• Specialty medications (both medical and pharmacy) made up 13% of the total
Catastrophic individuals accounted for 27% of the total spend, which is below the norm of 29%
70% of Medical Specialty Spend was at a lower-cost home/office setting
Top 10 Specialty Drugs by Spend
• Cancer contributed 3.5% to medical plan trend
• 27 members reached $100k with cancer as the primary diagnosis, 15 in the base period
• Active prevalence is 3.3% an increase of 0.1% from 3.2% in 2024
• 46.8% of medical SRX spend was for cancer treatment
• 67% of members in active treatment also have a Cardiodiabesity condition
• 8% of Cancer claimants are utilizing their behavioral health benefits
100% of cancer members identified for case management were engaged
A complex condition of three diagnoses at once:
1 2 3 Hypertension/ Hyperlipidemia Type II diabetes Obesity
Progressive disease | Costly | Projected to get even worse
50%+ by 2030 $719 Billion
More than half of U.S. adults are projected to be obese by 2030.*
Combined annual cost of cardiovascular disease, diabetes and obesity.*
Up to 6 times greater
4,103 Members with one of the above chronic conditions

Strategies
Driving Interactive Well-being Solutions
Wellness challenges to improve health with Cigna Healthcaresm well-being solution, with incentive option available.*
Focusing On Whole-person Behavioral Health
Counseling, behavioral support and lifestyle change programs.
Total health care costs for people with comorbid behavioral and physical health conditions.*
Supporting Chronic Conditions
Diabetes Prevention Digital Care Program to encourage lifestyle change and chronic condition coaching.
Driving Affordability
Cost caps, including $25 for select insulins, reduce out-of-pocket costs on qualifying drugs.1
** This exhibit excludes members without adequate time on the plan.
** Excludes HCCs

of Medical Spend
Diagnostic Categories by Spend Joint
Muscle/Connective Tissue
Fractures/Dislocations
Back
Sprains/Strains
Bone
Aftercare
Congenital Musculoskeletal
35% of claimants had a Musculoskeletal diagnosis, compared to 34% in the base period.
Musculoskeletal made up 23% of total medical spend, compared to 20% in the base period.
Steerable ER visits related to MSK in the current period (Base: 99)
Comments
• Top Professional SurgeriesKnee Arthroplasty ($105K ) and Spinal Fusion ($102K)
• MSK/Pain Mgt savings ($308K)
• PT OPUM intervention and savings ($23K)
> Preventive care
> Healthy behaviors
> Physical/emotional changes
> Healthy eating
> Adequate sleep
> Physical activity
> Preventive care
> Contraception
> Fertility & sexual health
> Skin changes
> Family history
> Mental health
> Bone strength
Pregnancies:
> Mammograms
> Mental health
> Perimenopause
> Menopause
> Colonoscopies
> Overall health Risk
> Mammograms
> Bone density screening
> Menopause
> Mood changes
> Memory loss
> Pelvic floor support
> Ongoing doctor visits
> Social & physical activity
> Continue screenings, medications, and treatments
> Preventive care
> Contraception
> Fertility & sexual health
> Skin
> Family history
Health spend for women evolves throughout each decade.
Specialized condition-specific support and case management for complex needs
Perimenopause & Menopause
> Behavioral resources
> Hormone therapy
> Nutrition counseling
> Trained specialists
Cancer
> Personalized nurse advocates
> Behavioral health cancer expertise
> Medical specialty drug management
> Know Your Lemons®
Fertility & Maternity
> Clinical, behavioral, and pharmacy support
> Progyny (available soon through Cigna)
> One Guide
Virtual Women’s Health Clinic
Visana Health
Comprehensive women’s health clinic treating menstruation to menopause in all 50 states
Women’s Health
Wellness Library

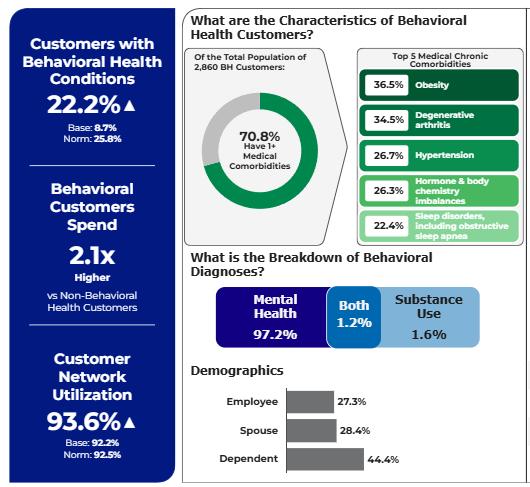
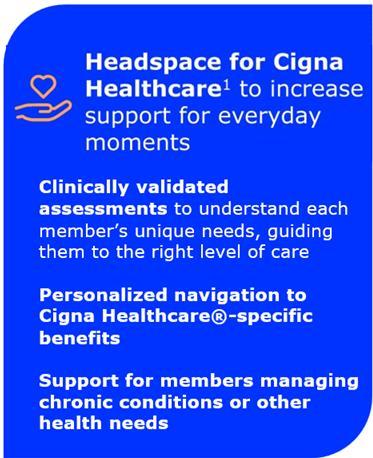
Our behavioral solutions integrate care for the whole person – body and mind.
• Clinical Navigator assigned to individuals with more complex needs.
• 100% follow-up with Care Navigator digitally or by telephone to ensure customer needs are met.
• Unlimited in-the-moment consultations lasting up to 60 minutes.
Spend = Fee for Service only
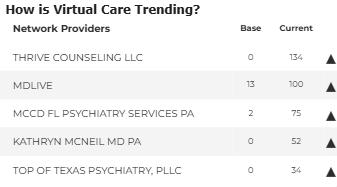
A simplified experience so a member can get the best care both virtually and in person through an integrated ecosystem of providers when and where they need it most
Virtual Care Visits by Provider Base vs Current
Total Visits
Unique Users
Users with Multiple Visits
Total Behavioral Visits
Member Utilization
*Adjusted for change in population
Cigna Medical Provider Virtual Visits by Condition
Cigna Behavioral Virtual Visits by Condition
Non-Cat Inpatient Spend +$2.4M
• Maternity was the top non-catastrophic admission category representing 48% of admissions and 33% of spend.
• Total admits/K rose by4% and bed days/K rose by 3%.
• Cost per admit rose from $10,177 to $13,525 or up 33%.
• 175 completed pregnancies in the current period.
• Key Drivers: Emergency Room +$3.8M. Surgery +3.3M, and Diagnostic +$3.1M
➢ Emergency Room – Visits/k up 6.6%, cost per visit up 35%.
➢ Surgical – Visits/k up 2%, cost per visit up 42%
➢ Diagnostic – Visits/k down -6%, cost per visit up 55%.
• Preferred Lab (Lab Corp/Quest Diagnostic) usage fell from 35% to 34% versus norm of 53%.
• Shifting 25% to preferred providers will generate $504K.
• Key Drivers: Evaluation & Mgmt. +$705K,