

Executive summary December 2024 results
In this edition of the Pitcher Partners Motor Industry Services –Australian Listed Dealer Comparison, Pitcher Partners provide insights into the top three listed motor dealer groups and explore how major trends, the macroeconomic environment and inventory supply has affected them in the 12 months ended 31 December 2024.
The listed dealership groups Eagers Automotive (ASX: APE), Autosports Group (ASX: ASG), and Peter Warren Automotive Holdings (ASX: PWR) all saw revenue growth in CY24, up 13.6%, 0.9%, and 10.1% respectively. However, the rising costs of running operations has added pressure on top of the impact of compressed margins caused by the oversupply of vehicles in the second half of 2024. Average inventory days’ supply increased across the board, rising from 61.1 to 69.7 days for APE, 65.1 to 82.8 days for ASG, and 76.5 to 79.5 days for PWR.
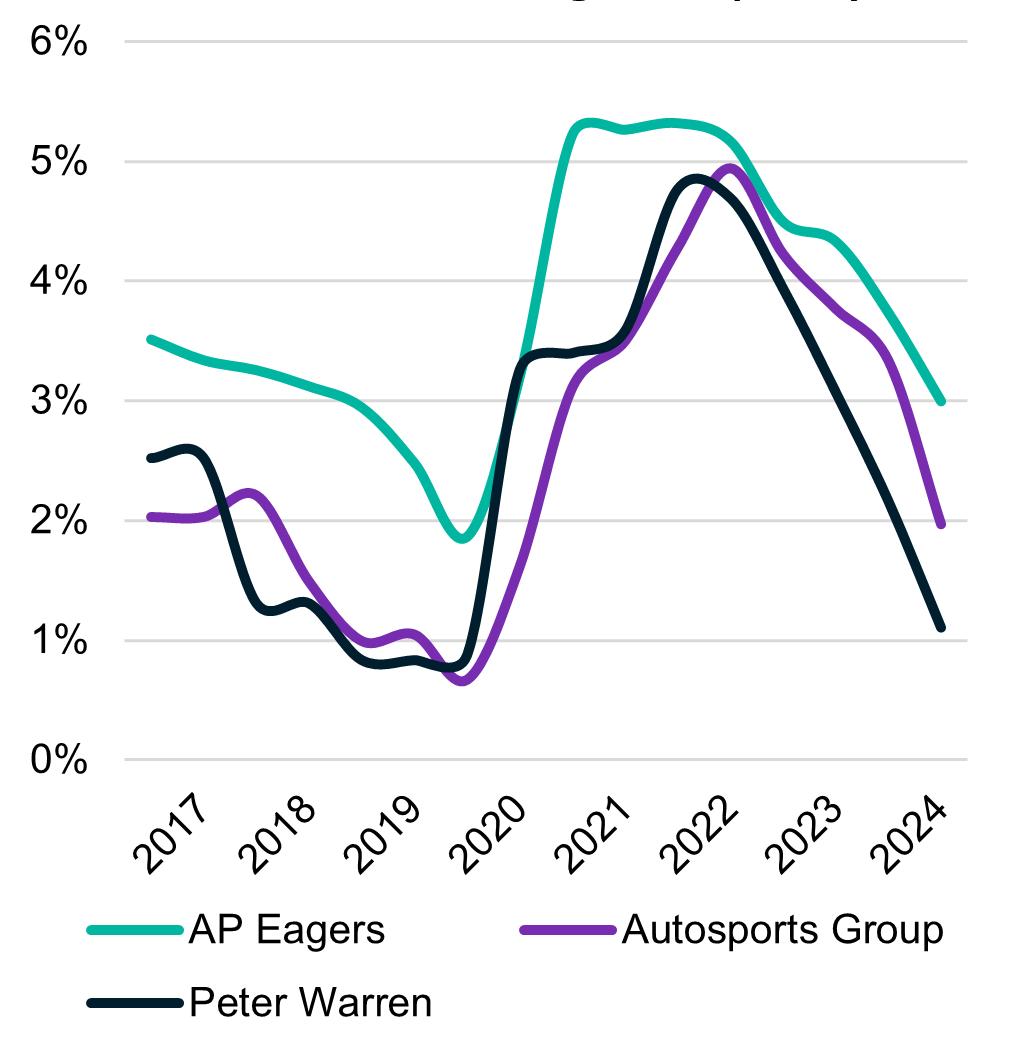
Despite strong top-line growth, Net Profit Before Tax (“NPBT ”) as a percentage of revenue reduced across all groups, with APE achieving 3.0% (down from 4.3%), ASG recording 2.0% (down from 3.8%), and PWR at 1.1% (down from 3.1%). With increased inventory aging & pressure on interest rates, the cost of carrying stock remains a key challenge heading into CY25.
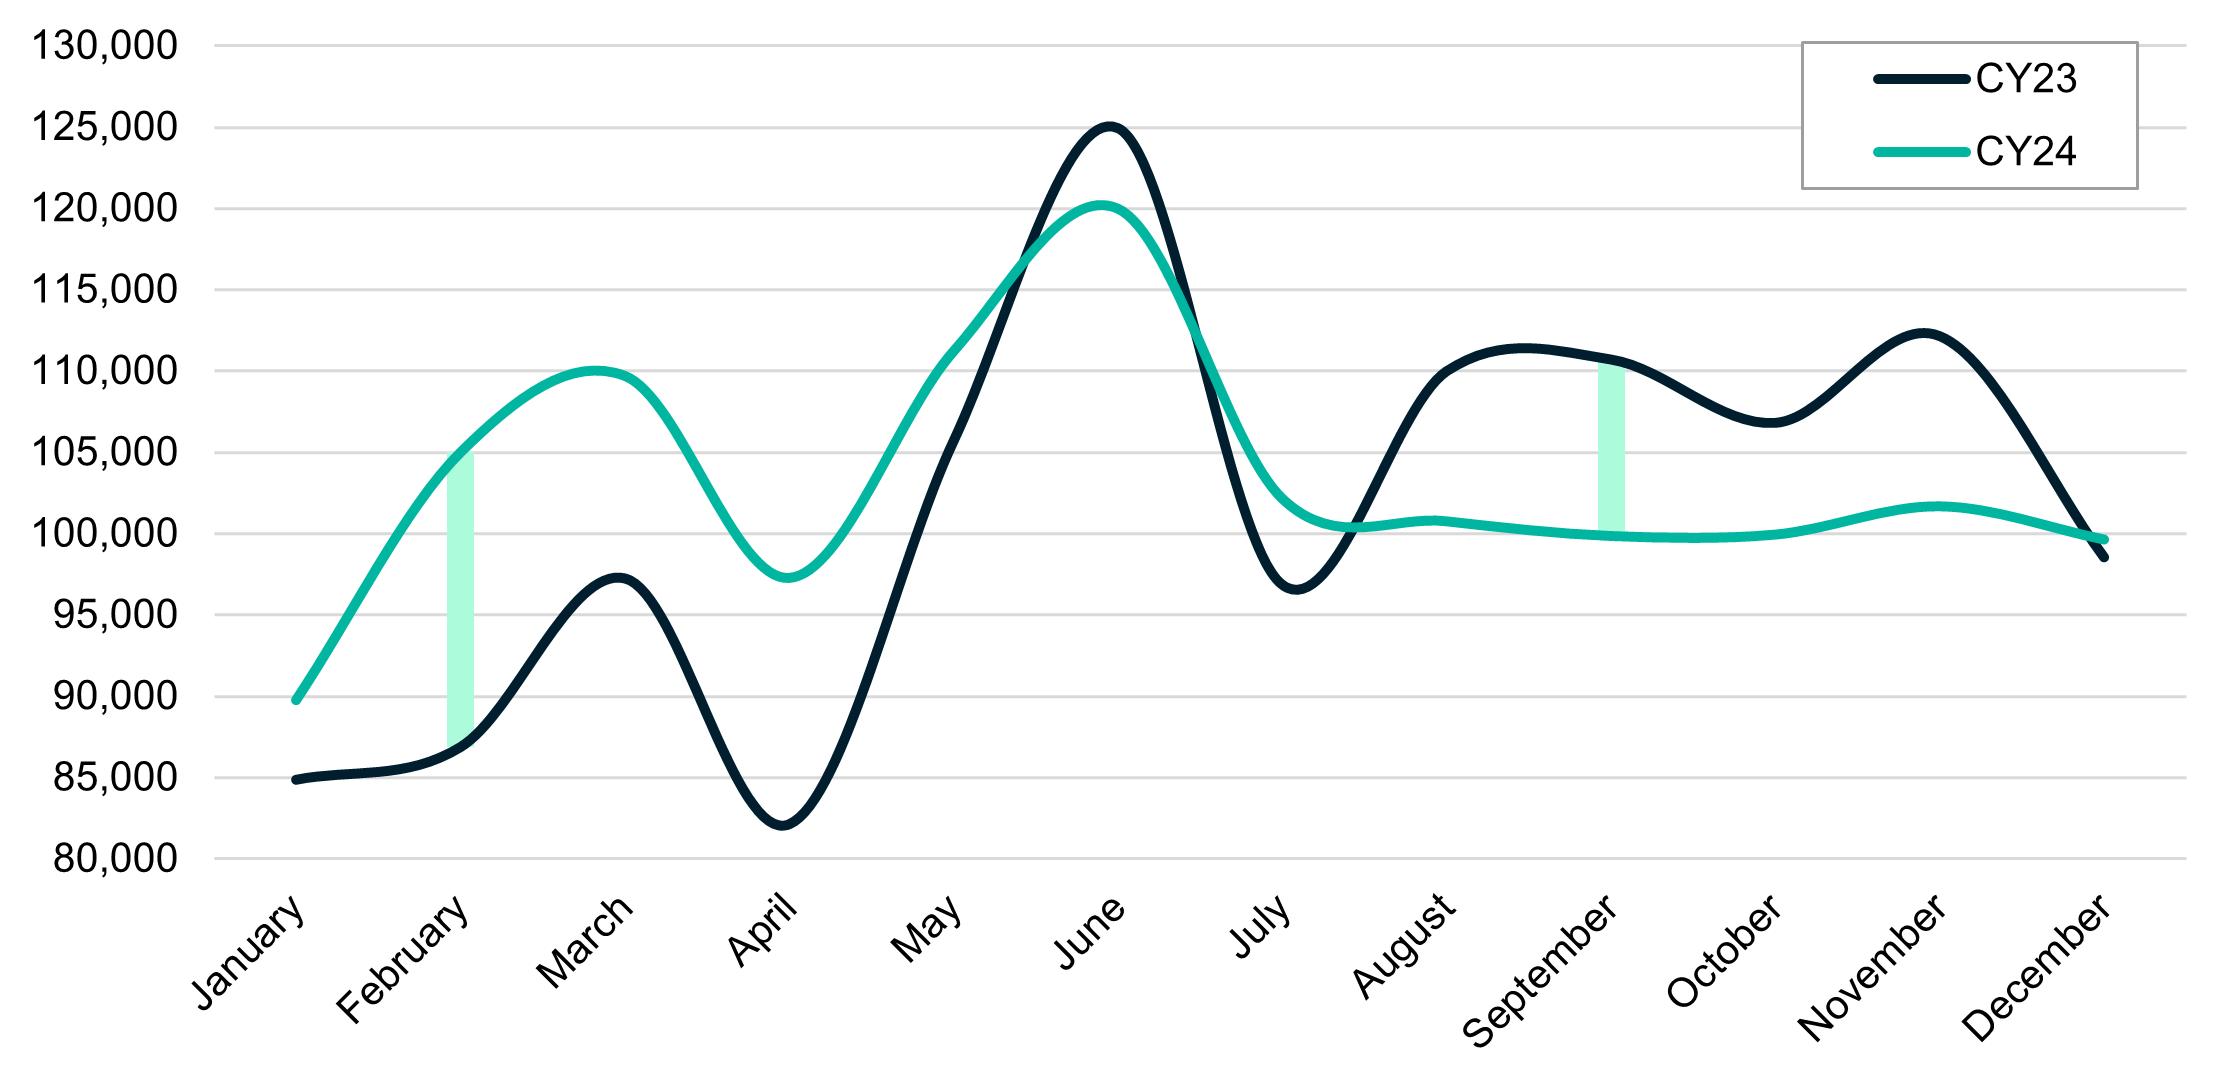
CY24 has been another record-breaking year for new vehicle sales, building on the momentum of CY23, closing at 1,237,287 units sold (just shy of Pitcher Partners estimate of 1.25m units), a 1.7% increase on CY23, according to VFacts. The first half of the year started strong, up 8.7%, but the second half saw a clear slowdown. Starting in June 2024 sales declined by 4.2% YOY, with overall volumes slowing down in subsequent months.
The increased vehicle volume and increased vehicles MSRPs have been key growth drivers for listed dealer groups, supporting double-digit yearon-year revenue growth. However, profitability pressures continue to mount. Compressed front-end gross margins, rising expenses, and shifting market
dynamics are forcing dealerships to double down on higher-margin products and services. Floorplan costs, advertising, employee compensation, and rent have all climbed, squeezing profit margins even further. As operating conditions bottom out, dealerships must return to fundamentals: disciplined cost control, operational efficiency, and a focus on profitable departments will be essential during tough market conditions.
Interest rates remain elevated compared to the past decade, despite the Reserve Bank of Australia’s decision at its February 2025 meeting to decrease the cash rate by 0.25 percentage points to 4.1 per cent. While this marks a shift in monetary policy, finance costs remain high, continuing to impact affordability for consumers. Inflation has fallen substantially since its 2022 peak, with underlying inflation recorded at 3.2 per cent in the December quarter. This suggests inflationary pressures are easing more quickly than expected, aided by subdued private demand. With inflation now tracking closer to the RBA’s 2-3 per cent target range, there is growing confidence that price stability is being restored.
This is before any impacts of the current trade and tariff ‘wars’ taking place since the inauguration of President Trump in the USA. Despite the market headwinds, Pitcher Partners now forecasts new vehicle sales of 1.1 million units in CY25 (after a subdued start), reflecting a decline from 2024 levels as demand normalises following the pandemic-era new vehicle sales volume highs.
Results snapshot
Listed Dealer Groups consolidated performance vs PCP
10.8%↑
Total revenue increased across all listed entities by $16.37bn. This was primarily driven by record car sales and dealership acquisitions in CY24.
77.6 days
Cash conversion increased by 9.3 days driven mainly by increasing inventory days.
2.0% NPBT as a % of total revenue decreased YOY by 1.7% on average as revenue growth outpaced gross margin.
37.3%↑
Interest expense on average increased from $71.49m to $98.18m YOY. Alongside this average interest expense % of Gross increased from 7.7% to 10.1%.
77.3 days
2.1x
Interest coverage decreased from 3.4x on the back of increased floorplan costs associated with increased inventory days and declining profitability.
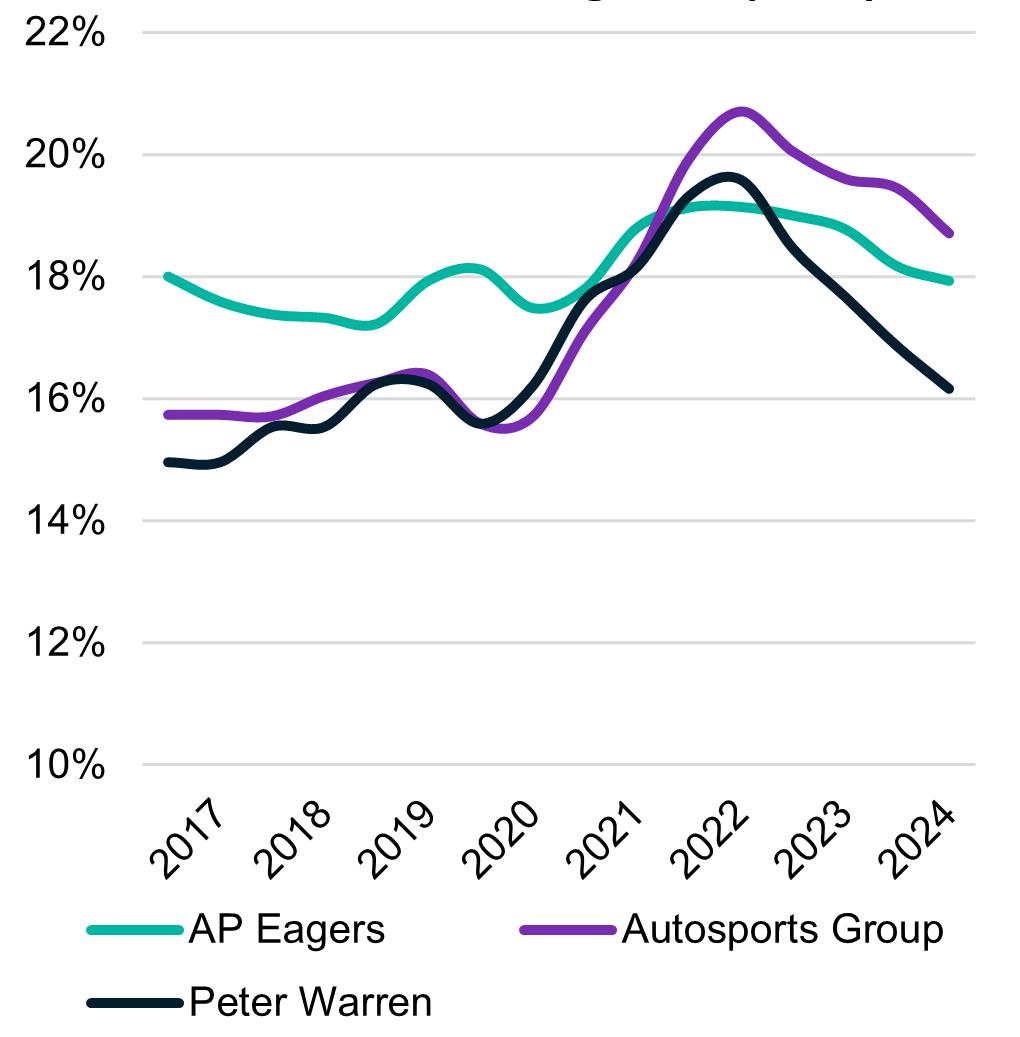
Listed Gross Margin % (LTM)
Listed Stat NPBT Margin % (LTM)*
Listed results summary
The good
Revenue growth
Despite economic challenges, all three listed dealer groups (PWR, APE, and ASG) reported revenue growth, with a combined revenue increase of $1.99B AUD YOY, moving from $14.78B to $16.37B AUD, or up 10.8%. This indicates that while profitability stays under pressure, demand is not timid.
The not so good
Increasing the cost base
The cost of running a dealership has continued to climb across the board, with nearly every area of operation seeing increased expenses. These increases are compounded by inflationary pressures and higher input costs, which are eroding profitability.
In 2024, the average listed dealer’s operating expenses reached $727.67 million, compared to $654.87 million in 2023, an increase of 11.1%. And as a percentage of gross profit, operating expenses have risen from 71.62% in 2023 to 77.15% in 2024, marking a 7.72% increase. As the cost of doing business continues to rise, it is becoming more challenging for dealerships to maintain margins, despite revenue continuing to grow.
Inventory management challenges
The automotive industry continues to grapple with inventory management, with oversupply becoming a real concern. While some dealerships have done well to manage inventory effectively, the broader trend of oversupply is concerning. This excess stock has led to increased bailment expenses and higher holding costs, which are eroding into profit margins. Overall, the average days’ supply of inventory for all three companies has risen to 77.3 days, up from 67.6 in CY23 (up 14.5% YoY).
Substantial increase in finance costs
Interest expenses are becoming an ever-greater concern for dealerships, especially with the rise of higher inventory levels and recent historically high cash rate. In 2023, the average interest expense across the three listed was $71.5 million. This figure rose to $98.2 million in 2024 (up 37.3% YoY), reflecting an increase of $26.7 million YoY. This surge in finance costs represents a significant drain on profitability, with the higher interest burden eroding profit by approximately $30 million across the average listed dealer.
The interesting
Market shift from NSC (national sales company) to distributor dominance will see the large retail groups dip their toe into distribution
• Australia’s fragmented market, that is 75+ brands selling just 1.2 million new units annually, cannot sustain its current structure. The rise of distributors (Eagers Automotive & BYD’s joint venture is an example) will streamline these brands offerings, ensuring models that suit local demand and benefit both dealers and consumers.
• This shift will also elevate the importance of the used car market. No longer will a brand be able to sell ~10,000 units in Australia and employ hundreds of staff to do so. The economics haven’t stacked up for over a decade. The implementation of NVES and Chinese brand competition will force the hand of many brands to distribution.
NVES: A political football and industry catalyst
• The implementation of the National Vehicle Emissions Standards (NVES) will be clunky (run on an $80m spreadsheet) and caused a stir in the first quarter of CY25.
• This will die down as the impact in year one is minimal, and the traditional OEMs will have loaded up on ICE stock to get them through the first half of CY26. However, NVES will be contentious during Australia’s May federal election.
• The biggest impact of NVES will be the allocation of vehicles a dealer will provided to sell. For example, OEM distributors may only allocate a limited number of high emissions vehicles to dealers that attract penalties once the penalties become significant in CY27. Despite customer demand, dealers will not receive any additional high emission vehicles to sell so that the OEM can achieve its emissions targets to avoid penalties.
Results snapshot (cont.)
Eagers Automotive performance vs PCP
17.9%
Revenue increased to $11.20bn This was driven by record car sales and dealership acquisitions in CY24.
4.8%
EBIT decreased by $10.89m, due to increasing depreciation and impairment of the NZ cash generating unit. The EBIT margin decreased 0.8%.
Gross margin has decreased by 0.9% YOY (18.8% to 17.9%) despite Total Gross Profit increasing by 8.4% YOY to $2.01bn demonstrating margin compressions.
3.0%
NPBT as a % of total revenue decreased YOY by 1.3%, due to gross margin compression and increasing operating expenditure.
Cash conversion increased by 5.6 days driven mainly by increasing inventory days. 41.1% Interest expense increased from $130.75m to $184.48m YOY Alongside this Interest expense % of Gross increased from 7.1% to 9.2%.
6.1%
EBITDA increased by 11.68m YOY. However, EBITDA margin decreased by 0.7% attributed to declines in gross margin demonstrating continued margin pressures within the market.
69.7 days
Inventory days increased by 14.1% YOY as a result of inconsistent stock levels across OEMs and growth in the parts business.
2.9x
Interest coverage decreased from 4.2x on the back of increased floorplan costs due to excess stock and declining profitability.
13.2x EV to EBIT increased to 13.2x compared to 11.3x at Dec 23. This is primarily attributed to a decline in EBIT.
18.9x The share price to earnings per share (before extraordinary items) is 18.9x compared to 13.2x at Dec 2023.
Results snapshot (cont.)
Autosports performance vs PCP
0.9%↑
Revenue increased to $2.67bn. The increase was driven by dealership acquisitions in CY24.
4.3%
EBIT decreased by $43.42m Alongside this, EBIT margin decreased by 1.7%
18.7%
Gross margin has decreased by 0.9% YOY (19.6% to 18.7%). Total Gross Profit decreased by 3.7% YOY to $500.5m demonstrating continued margin pressure.
2.0%
NPBT as a % of total revenue decreased YOY by 1.8%, due to gross margin compression and increasing operating expenditure.
Cash conversion increased by 18.7 days driven mainly by increasing inventory days. 28.5%
Interest expense increased from $48.02m to $61.70m YOY. Alongside this Interest expense % of Gross increased from 9.2% to 12.3%.
7.4% Return on Equity decreased by 11.9% YOY, mainly due to a decrease in
12.3x EV to EBIT increased to 12.3x compared to 8.9x at Dec 23. This is primarily attributed to a decline in EBIT.
6.6%
EBITDA decreased by $37.12m YOY. EBITDA margin decreased by 1.5% attributed to declines in gross margin demonstrating continued margin pressures within the market.
82.8 days
Inventory days increased by 27.2% YOY as a result of stock oversupply from multiple OEMs.
1.9x
Interest coverage decreased from 3.3x on the back of increased floorplan costs due to excess stock and declining profitability.
10.3x
The share price to earnings per share (before extraordinary items) is 10.3x compared to 7.1x at Dec 2023.
Results snapshot (cont.)
Peter Warren performance vs PCP
16.2%
Revenue increased to $2.50bn This was driven by record car sales in 2024 and dealership acquisitions in CY24.
EBIT decreased by $24.52m Alongside this, EBIT margin decreased by 1.4%
Gross margin has decreased by 1.5% YOY (17.7% to 16.2%) despite total gross profit increasing by 0.7% YOY to $404.2m demonstrating margin compressions.
1.1%
NPBT as a % of total revenue decreased YOY by 2.0%, due to gross margin compression and increasing operating expenditure.
Cash conversion increased by 3.5 days driven mainly by increasing inventory days. 35.5%
Interest expense increased from $35.70m to $48.36m YOY. Alongside this interest expense % of gross increased from 8.9% to 12.0%.
4.5%
EBITDA decreased by $19.92m YOY. EBITDA margin also decreased by 1.3% attributed to declines in gross margin demonstrating continued margin pressures within the market.
79.5 days
Inventory days increased by 3.9% YOY as a result of stock oversupply from multiple OEMs.
1.6x
Interest coverage decreased from 2.8x on the back of increased floorplan costs due to excess stock and declining profitability. Return
3.7%
Return on equity decreased by 61.0% YOY, due to a decrease in earnings representing gross margin
13.3x
EV to EBIT increased to 13.3x compared to 11.1x at Dec 23. This is primarily attributed to a decline in EBIT.
13.1x
The share price to earnings per share (before extraordinary items) is 13.1x compared to 8.8x at Dec 2023.
At a glance
Australia
Listed Dealer Groups Comparison – 12 months to 31 December 2024
At a glance (cont.)
At a glance (cont.) Australia Listed Dealer Groups Comparison
– 12 months to 31 December 2023
Market share VFACTS National – December 2024
VFACTS December 2024 summary
CY23 vs CY24 retail unit sales1, 2
Sources:
1Federal Chamber of Automotive Industries – VFACTS 2023 & 2024 monthly reports.
2Electric Vehicle Council – 2024 monthly vehicle sales reports.
Key takeaways for the month of December 2024
December 2024 monthly figures were up 1.1% for the total market compared to December 2023, thanks to the strong performances by BYD, Chery, Ford, GWM, KIA, Mitsubishi, Nissan, Suzuki and Toyota offsetting mediocre performances by others.
Ford finished the year with a slim lead over Mazda with continual impressive sales in the Ranger and Everest ranges.
The Chinese brands have now fully established themselves in the volume (Chery, GWM, and MG) and EV segments (BYD and Tesla).
Dealer performance
Margins continue to compress, forcing dealers to focus on the back end, F&I and aftermarket to maintain best practice profitability.
Dealers should also be reviewing the big four expenses (floorplan, advertising, employee and rent) and generate well-developed strategies to generate productivity and efficiencies throughout the business to mitigate the everincreasing cost base of running a dealership.
The return to pre-pandemic gross profits and inflationary cost base has put dealers into a vice that is significantly impacting net profit margins. Dealers must focus on pro-active generation of gross and expense management is now critical.
Do not fall behind! In these times, dealers need to return to fundamentals and focus on best practices to keep the dealership profitable!
VFACTS December 2024 summary (cont.)
VFACTS analysis
Pitcher Partners predict CY25 new vehicle sales volumes will be 1.1million+ units, with the first half being particularly impacted by cost-of-living pressures and the looming May election. We believe the second half of CY25 will see increasing new car sales as interest rate reductions start to drive improved consumer sentiment.
The good news is once the industry navigates through the first half of CY25 and the election; the second half should be better for dealers and their bottom lines.
To quell any concerns about the trajectory that the Australian market is on, we analysed the last 15 years of monthly VFACTS data compared to Australia’s population.
Population growth will also continue to contribute to increasing unit sales. The population grew by 552,000 people in CY24 meaning 25,000 more new vehicles were sold by virtue of population growth alone. That means 4.58 % of the Australian population bought a new car in CY2024. Despite any economic headwinds, Australians still need cars and trucks for mobility and transport of goods. In Pitcher Partners opinion, the new ‘water-line’ for new vehicle sales is ~1.1m units as the natural replacement rate of vehicle in Australia. Anything more or less will be due to external environmental or economic impacts.

About Pitcher Partners About Pitcher Partners
Sydney statistics
National statistics
34 partners
300+ people
145+ partners
1,500+ people
We’re ready to help you thrive
Since day one we’ve been helping businesses, families and individuals intelligently frame their goals and make the most of their potential.
Today, we’re one of the largest accounting, audit and business advisory firms in Australia. We work with middle market businesses, from family-run companies to renowned industry leaders and iconic brands. And help families and individuals manage their wealth across generations.
If you’ve got ambition, we’re the team you want on your side.
Local knowledge, national footprint
Pitcher Partners is a national association of six independent accounting, audit and business advisory practices. You’ll find our firms in Adelaide, Brisbane, Melbourne, Newcastle and Hunter, Perth and Sydney. Each firm has a unique character, with a strong connection to the local community. Supported by our combined resources, we deliver Australia’s most personalised and responsive assurance and advisory services.
And if you’re thinking beyond the border, we can support your global operations and ambitions through the Baker Tilly International network.
We’ll always make it personal
At the heart of Pitcher Partners is the idea that business is never just business. We’re known for the dedication we give to building great relationships, and it’s been that way from the start. People first.
Everything we do is grounded in communication and collaboration. We’re here for that frank, refreshing and always informed discussion that leads to new ideas and better decisions. And we’re here for you. Whatever your goals, we can get there together.
6 independent member firms

Statistics as at January 2025.
Our global reach
Our global reach
We are proud to be a member of the Baker Tilly network, a global network of independent accounting and business advisory firms, whose member firms share our dedication to exceptional client service.
Every day, more than 43,500 people in 143 territories share experiences and expertise to help privately held businesses and public interest entities meet challenges and proactively respond to opportunities. International capability and global consistency of service are central to the way we work.
3,840+ partners
43,500+ experienced professionals
Baker Tilly International
Experts across a wide range of industry and business sectors, each Baker Tilly International member firm combines high-quality services and in-depth local knowledge. Sharing knowledge and resources, our business approach brings together the power of the global network to deliver exceptional results to clients globally.

143 territories
$5.6bn worldwide revenue 2024 (USD)

Pitcher Partners
Pitcher Partners is an independent member of Baker Tilly International. Pitcher Partners’ strong relationship with other Baker Tilly International member firms, particularly in Asia-Pacific, provides clients with access to international networks, opportunities and expertise to expand globally.
Global statistics as at January 2025.
Disclaimer



Motor Industry Services
m +61 437 445 200
e steven.bragg@pitcher.com.au John Gavljak Partner, Business Advisory and Assurance
m +61 499 773 881
e john.gavljak@pitcher.com.au
Motor Industry Services
m +61 400 193 352
e maya.sutanto@pitcher.com.au Steven Bragg
This Report (‘Report’) has been produced by Pitcher Partners and has been prepared for informational and discussion purposes only. This information is correct at time of publishing. The information provided in this document is of a general nature and has been prepared without taking into account your objectives, circumstances, financial situation or particular needs. This Report does not constitute personal advice. All financial numbers have been sourced from SP Capital IQ, Pitchers Partners do not provide any assurance with regard to these figures.
This Report has been prepared by us in the ordinary course of our profession. In providing this Report, we are not purporting to act as solicitors or provide legal advice. Appropriate advice should be sought prior to acting on anything contained in this Report or implementing any transaction or arrangement that may be referred to in this Report.
Information contained within this Report is based on the relevant law and its interpretations by relevant authorities as it stands at the time the information is provided. Any changes or modifications to the law and/or its interpretation after this time could affect the information we have provided.
This Report, or any part thereof, must not be distributed, copied, used, or relied on by any person, without our prior written consent. Permission must be sought to reproduce any content via the media enquiry form.
To the maximum extent permitted by law, Pitcher Partners will not be liable for any loss, damage, liability or claim whatsoever suffered or incurred by an person arising directly or indirectly out of the use or reliance on the information contained within this Report.
Pitcher Partners is an independent member of Baker Tilly International. Baker Tilly International Limited is an English company. Baker Tilly International provides no professional services to clients. Each member firm is a separate and independent legal entity, and each describes itself as such. Pitcher Partners is not Baker Tilly International’s agent and does not have the authority to bind Baker Tilly International or act on Baker Tilly’s behalf. None of Baker Tilly International, Pitcher Partners, not any of the other member firms of Baker Tilly International have any liability for each other’s acts or omissions. The name Baker Tilly and its associated logo is used under license from Baker Tilly International Limited.
Pitcher Partners is an association of independent firms.
Any trademarks, logos, and service marks contained herein may be the registered and unregistered trademarks of their respective owners. Nothing contained herein should be construed as granting by implication, or otherwise, any license or right to use any trademark displayed without the written permission of the owner.
Liability limited by a scheme approved under Professional Standards Legislation.