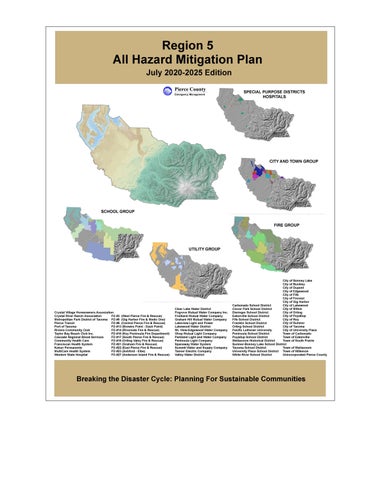
SPECIAL ACKNOWLEDGEMENTS: Cities and Towns Group (19)
Jurisdiction Participants
School Group (15)
1. 2. 3. 4. 5. 6. 7. 8. 9. 10. 11. 12. 13. 14. 15. 16. 17. 18. 19. 20. 21.
City of Bonney Lake City of Buckley City DuPont City of Edgewood City of Fife City of Fircrest City of Gig Harbor City of Lakewood City of Milton City of Orting City of Puyallup City of Roy City of Sumner City of Tacoma City of University Place Town of Carbonado Town of Eatonville Town of South Prairie Town of Steilacoom Town of Wilkeson Unincorporated Pierce County Fire Group (12)
1. 2. 3. 4. 5. 6. 7. 8. 9. 10. 11. 12. 13. 14. 15.
1. 2. 3. 4. 5. 6. 7. 8. 9. 10. 11. 12.
FD #3 (West Pierce Fire & Rescue) FD #5 (Gig Harbor Fire & Medic One) FD #6 (Central Pierce Fire & Rescue) FD #13 (Browns Point – Dash Point) FD #14 (Riverside Fire & Rescue) FD #16 (Key Peninsula Fire Department) FD #17 (South Pierce Fire & Rescue) FD #18 (Orting Valley Fire & Rescue) FD #21 (Graham Fire and Rescue) FD #22 (East Pierce Fire and Rescue) FD #23 (Ashford – Elbe) FD #27 (Anderson Island Fire & Rescue)
1. 2. 3. 4. 5. 6. 7. 8. 9. 10. 11. 12. 13. 14.
Utility Group (12)
Special Purpose District (10) 1. 2. 3. 4. 5. 6. 7.
Crystal River Ranch Association Crystal Village Homeowners Association Metropolitan Park District of Tacoma Pierce Transit Port of Tacoma Riviera Community Club Taylor Bay Beach Club Inc.
Carbonado School District Clover Park School District Dieringer School District Eatonville School District Fife School District Franklin Pierce School District Orting School District Pacific Lutheran University Peninsula School District Puyallup School District Steilacoom School District No. 1 Sumner-Bonney Lake School District Tacoma School District University Place School District White River School District
Clear Lake Water District Firgrove Mutual Water Company Fruitland Mutual Water Company Graham Hill Mutual Water Company Lakeview Light and Power Lakewood Water District Mt. View-Edgewood Water Company Ohop Mutual Light Company Parkland Light & Water Company Peninsula Light Company Spanaway Water Company Summit Water and Supply Company Tanner Electric Valley Water District Health and Medical Group (8)
1. 2. 3. 4. 5. 6.
Cascade Regional Blood Services Community Health Care Franciscan Health System Group Health Cooperative MultiCare Health System Western State Hospital
DIRECTOR OF PIERCE COUNTY DEPARMENT OF EMERGENCY MANAGEMENT Jody Ferguson
FUNDING ACKNOWLEDGEMENTS:
This plan was financed by grant funding from the Washington State Military Department, Emergency Management Division and the Federal Emergency Management Agency under the Pre-Disaster Mitigation Grant Program.
GEOGRAPHIC INFORMATION SYSTEMS (GIS) MAPS:
Pierce County Department of Emergency Management developed all of the maps included in this plan. The information on the maps in this plan was derived from Pierce County GIS and other sources. Care was taken in the creation of these maps but is provided “as is.” Pierce County cannot accept any responsibility for any errors, omissions or positional accuracy, and therefore, there are no warranties that accompany these products (the maps). Users are cautioned to field verify information on this product before making any decisions.
PREPARED BY:
Pierce County Department of Emergency Management 2501 South 35th Street, Suite D Tacoma, WA 98409-7405 (253) 798-7470 http://www.co.pierce.wa.us/PC/
Debbie Bailey-Project Lead Wyatt Godfrey-Project Team Chelsey Bell-Project Team Todd Kilpatrick-Project Team
(This page left blank intentionally)
REGION 5 ALL HAZARD MITIGATION PLAN 2020-2025 EDITION Table of Contents EXECUTIVE SUMMARY……………………………………………………………………………………….. 1 REGION 5 PLAN PROCESS…………………………………………………………………... SECTION 1 REGION 5 PLAN PROFILE...................................................................... SECTION 2 REGION 5 CAPABILITY IDENTIFICATION …………………………………………….. SECTION 3 REGION 5 RISK ASSESSMENT (INTRODUCTION) ………………………………….. SECTION 4 REGION 5 RISK ASSESSMENT – GEOLOGICAL ……………………………………. SECTION 4.G AVALANCHE HAZARD …………………………………………………………………………… SUB-SECTION 4.G1 EARTHQUAKE HAZARD ………………………………………………………………………… SUB-SECTION 4.G2 LANDSLIDE HAZARD ……………………………………………………………………………. SUB-SECTION 4.G3 TSUNAMI HAZARD ………………………………………………………………………………. SUB-SECTION 4.G4 VOLCANO HAZARD ……………………………………………………………………………… SUB-SECTION 4.G5
REGION 5 RISK ASSESSMENT – METEOROLOGICAL …………………………… SECTION 4.M CLIMATE CHANGE HAZARD ………………………………………………………….…….. SUB-SECTION 4.M1 DROUGHT HAZARD ………………………………………………………………………….… SUB-SECTION 4.M2 FLOOD HAZARD …………………………………………………………………………….….. SUB-SECTION 4.M3 SEVERE WEATHER HAZARD ……………………………………………….………………. SUB-SECTION 4.M4 WUI FIRE HAZARD …………………………………………………………….……………… SUB-SECTION 4.M5
REGION 5 RISK ASSESSMENT – TECHNOLOGICAL ………………..…………… SECTION 4.T ABANDONED MINES……………………………………………………..…………………… .SUB-SECTION 4.T1 ACTIVE THREAT / ATTACK TACTICS……………………………………..……….……… SUB-SECTION 4.T2 CIVIL DISTURBANCE ………………………………………………………..……….……… SUB-SECTION 4.T3 CYBER-ATTACK ………………………………………………………..……….……… SUB-SECTION 4.T4 DAM FAILURE……………………………………………………………………..……………. SUB-SECTION 4.T5 ENERGY EMERGENCY.………………………………………………………………………. SUB-SECTION 4.T6 EPIDEMIC/PANDEMIC……………………………………………………………………….. SUB-SECTION 4.T7 HAZARDOUS MATERIALS ………………………………………………………..………… SUB-SECTION 4.T8 PIPELINES………………………………………………………………………………..……… SUB-SECTION 4.T9 TERRORISM ………………………………………………………………………………….…. SUB-SECTION 4.T10 TRANSPORTATION……………………………………………………………………….…… SUB-SECTION 4.T11
REGION 5 MITIGATION STRATEGY………………………………………………………. SECTION 5 REGION 5 INFRASTRUCTURE ……………………………………………………………… SECTION 6 REGION 5 PLAN MAINTENANCE ………………………………………………………….. SECTION 7 ADDENDA City and Town Group ………………………………………………………………….. Addendum A CITY OF BONNEY LAKE……………………………………………………………………………… ADDENDUM A-1 CITY OF BUCKLEY ……………………………………………………………………………………. ADDENDUM A-2
CITY OF DUPONT ……..……………………………………………………………………………… ADDENDUM A-3 CITY OF EDGEWOOD ………………………………………………………………….……………. ADDENDUM A-4 CITY OF FIFE ………………………………………………………………………………….………. ADDENDUM A-5 CITY OF FIRCREST………………………………………………………………………..….…….. ADDENDUM A-6 CITY OF GIG HARBOR ………………………………………………………………………….…… ADDENDUM A-7 CITY OF LAKEWOOD ………………………………………………………………………….…….. ADDENDUM A-8 CITY OF MILTON………………………………………………………………….…………….……. ADDENDUM A-9 CITY OF ORTING……………………………………………………………………….…………… ADDENDUM A-10 CITY OF PUYALLUP…………………………………………………………………….…………… ADDENDUM A-11 CITY OF ROY………………………………………………………………………….……………… ADDENDUM A-12 CITY OF SUMNER……………………………………………………………………………….…… ADDENDUM A-13 CITY OF TACOMA……………………………………………………………………..…………….. ADDENDUM A-14 CITY OF UNIVERSITY PLACE……………………………………………………..…………….. ADDENDUM A-15 TOWN OF CARBONADO…………………………………………………………………………… ADDENDUM A-16 TOWN OF EATONVILLE …………………………………………………………………..……. ADDENDUM A-17 TOWN OF SOUTH PRAIRIE ………………………………………………………...………… ADDENDUM A-18 TOWN OF STEILACOOM ………………………………………………………………………… ADDENDUM A-19 TOWN OF WILKESON……………………………………………………………………………… ADDENDUM A-20 UNINCORPORATED PIERCE COUNTY…………………………………………………….… ADDENDUM A-21
School Group ……………………………………………………………………………… Addendum B
CARBONADO SCHOOL DISTRICT……………………………………………………………….. ADDENDUM B-1 CLOVER PARK SCHOOL DISTRICT……………………………………………………………… ADDENDUM B-2 DIERINGER SCHOOL DISTRICT ………………………………..………………………………. ADDENDUM B-3 EATONVILLE SCHOOL DISTRICT …………………………….………………………………… ADDENDUM B-4 FIFE SCHOOL DISTRICT ……………………………………………..…………………………… ADDENDUM B-5 FRANKLIN PIERCE SCHOOL DISTRICT ………………………………………………………. ADDENDUM B-6 ORTING SCHOOL DISTRICT …………………………………………………………………….. ADDENDUM B-7 PACIFIC LUTHERAN UNIVERSITY ……………………………………………………………… ADDENDUM B-8 PENINSULA SCHOOL DISTRICT ………………………………………………………………… ADDENDUM B-9 PUYALLUP SCHOOL DISTRICT …………………………………………………………………..ADDENDUM B-10 THE RAINIER SCHOOL …………………………………………………………………………… ADDENDUM B-11 STEILACOOM HISTORIC SCHOOL DISTRICT ……………………………………………. ADDENDUM B-12 SUMNER SCHOOL DISTRICT …………………………………………………………………… ADDENDUM B-13 TACOMA PUBLIC SCHOOLS …………………………………………………………….………. ADDENDUM B-14 UNIVERSITY PLACE SCHOOL DISTRICT …………………………………………………… ADDENDUM B-15 UNIVERSITY OF PUGET SOUND………………………………………………………………… ADDENDUM B-16 WHITE RIVER SCHOOL DISTRICT ……………………………………………………………. ADDENDUM B-17
Fire Group ………………………………………………………………………………………. Addendum C
WEST PIERCE FIRE & RESCUE (PCFD #3) …………………………………………..……….ADDENDUM C-1 GIG HARBOR FIRE & MEDIC ONE (PCFD #5) …………………………………………….. ADDENDUM C-2 CENTRAL PIERCE FIRE & RESCUE (PCFD #6) ……………………………….…………… ADDENDUM C-3 BROWNS POINT – DASH POINT (PCFD #13) …………………………………………….. ADDENDUM C-4 RIVERSIDE FIRE & RESCUE (PCFD #14)…………………………………………………….. ADDENDUM C-5 KEY PENINSULA FIRE DEPARTMENT (PCFD #16) ……………………………………….. ADDENDUM C-6 SOUTH PIERCE FIRE & RESCUE (PCFD #17)……………………………………………….. ADDENDUM C-7 ORTING VALLEY FIRE & RESCUE (PCFD #18)…………………………………………….. ADDENDUM C-8 GRAHAM FIRE & RESCUE (PCFD #21) ……………………………………………………… ADDENDUM C-9 EAST PIERCE FIRE & RESCUE (PCFD #22) ……………………………………………….. ADDENDUM C-10 ASFORD – ELBE (PCFD #23) …………………………………………………….……..……… ADDENDUM C-11 ANDERSON ISLAND FIRE & RESCUE (PCFD #27)……………………………………… ADDENDUM C-12
Utility Group …………………………………………………………………………………… Addendum D CLEAR LAKE WATER DISTRICT ………………………………………………………………… ADDENDUM D-1 FIRGROVE MUTUAL WATER COMPANY ………………………………………………………. ADDENDUM D-2
FRUITLAND MUTUAL WATER COMPANY ……………………………………………………. ADDENDUM D-3 GRAHAM HILL MUTUAL WATER COMPANY ………………………………………….…….. ADDENDUM D-4 LAKEVIEW LIGHT AND POWER COMPANY ……………………………….………………… ADDENDUM D-5 LAKEWOOD WATER DISTRICT ………………………………………………………….……… ADDENDUM D-6 MT. VIEW-EDGEWOOD WATER COMPANY …………………………………………..……. ADDENDUM D-7 OHOP MUTUAL LIGHT COMPANY ……………………………………………………….…….. ADDENDUM D-8 PARKLAND LIGHT AND WATER COMPANY ………………………………………….…….. ADDENDUM D-9 PENINSULA LIGHT COMPANY ………………………………………………………….…….. ADDENDUM D-10 SPANAWAY WATER COMPANY…………………………………………………………..……… ADDENDUM D-11 SUMMIT WATER AND SUPPLY COMPANY ……………………………………….………… ADDENDUM D-12 VALLEY WATER DISTRICT……………………………………………………………………… ADDENDUM D-13 TANNER ELECTRIC ………………………………………………………….…………………….. ADDENDUM D-14
Special Purpose Districts…………………………………………………………………… Addendum E CRYSTAL RIVER RANCH ASSOCIATION …………………………………………………….. ADDENDUM E-1 CRYSTAL VILLAGE HOMEOWNERS ASSOCIATION……………………………………….. ADDENDUM E-2 METROPOLITAN PARK DISTRICT OF TACOMA …………………………………………… ADDENDUM E-3 PIERCE TRANSIT ……………………………………………………………………………………. ADDENDUM E-4 PORT OF TACOMA ………………………………………………………………………………….. ADDENDUM E-5 RIVIERA COMMUNITY CLUB……………………………………………………………………… ADDENDUM E-6 TAYLOR BAY BEACH CLUB………………………………………………………………………. ADDENDUM E-7
Health and Medical Group……………………………………………………..…….…… Addendum F CASCADE REGIONAL BLOOD SERVICS ………………………………………………….…… ADDENDUM F-1 COMMUNITY HEALTH CARE SYSTEM …………………………………………………………. ADDENDUM F-2 FRANCISCAN HEALTH SYSTEM……………………………………………………………….…. ADDENDUM F-3 KAISER PERMANENTE ………………………………………………………………………..….… ADDENDUM F-4 MULTICARE HEALTH SYSTEM COMMUNITY HEALTH CARE ………………….……… ADDENDUM F-5 TACOMA-PIERCE COUNTY HEALTH DEPARTMENT ……………………………………… ADDENDUM F-6 WESTERN STATE HOSPITAL …………………………………………………………….…….. ADDENDUM F-7
APPENDICES Acronyms …………………………………………………………………………………….. Appendix A Maps, Figures and Tables …………………………………………………………..…. Appendix B Glossary ………………………………………………………………………………………. Appendix C
MAPS, FIGURES AND TABLES Executive Summary
TABLE ES-1 REGION 5 PLANNING GROUP………………………………………………………………………… ES-7 MAP ES-1 CITY AND TOWN PLANNING GROUP ……………………………………………..…………………. ES-8 MAP ES-2 FIRE PLANNING GROUP ………………………………………………………………………………….. ES-9 MAP ES-3 SCHOOL PLANNING GROUP ……………………………………………………..……………………… ES-10 MAP ES-4 SPECIAL PURPOSE PLANNING GROUP ……………………………………………………..……… ES-11 MAP ES-5 UTILITY PLANNING GROUP …………………………………………………….……………………… ES-12 MAP ES-6 HOSPITAL PLANNING GROUP …………………………………………………….…………………… ES-13 MAP ES-7 UNINCORPORATED PIERCE COUNTY PLANNING GROUP …………………………………… ES-14
Process Section
TABLE 1-1 CHANGE MATRIX ……………………………………….……………………………………………………. 1-4 TABLE 1-2 PLANNING TEAM-CITY GROUP ……………………………..…………………………………….…. 1-10 TABLE 1-3 PLANNING TEAM-FIRE GROUP ……………………………………………………….……………….. 1-11 TABLE 1-4 PLANNING TEAM-SCHOOL GROUP …………………………………………..………………………. 1-12 TABLE 1-5 PLANNING TEAM-SPECIAL PURPOSE GROUP …………………………………………...………. 1-13 TABLE 1-6 PLANNING TEAM-UTILITY GROUP ………………………………………….………………………… 1-14 TABLE 1-7PLANNING TEAM-HEALTH AND MEDICAL GROUP ……………………………………….…… 1-14 TABLE 1-8 PLANNING TEAM-PIERCE COUNTY GOVERNMENT GROUP …………………………………. 1-15 TABLE 1-9 PLANNING TEAM-NORTH GROUP ……………………………..…..…………………………….…. 1-16 TABLE 1-10 PLANNING TEAM-NE GROUP ………………………………………………………...……………….. 1-17 TABLE 1-11 PLANNING TEAM-WEST GROUP …………………………………………..………..………………. 1-19 TABLE 1-12 PLANNING TEAM-SW GROUP ………………………………………………………….…….………. 1-19 TABLE 1-13 PLANNING TEAM-CENTRAL GROUP …………………………………….…………….…………… 1-20 TABLE 1-14 PLANNING TEAM MEETINGS-CITY AND TOWN GROUP……………………………………. 1-22 TABLE 1-15 PLANNING TEAM MEETINGS-FIRE GROUP ……………………………………………………… 1-22 TABLE 1-16 PLANNING TEAM MEETING-SCHOOL GROUP …………………………………………………. 1-22 TABLE 1-17 PLANNING TEAM MEETING-SPECIAL PURPOSE GROUP ………………………………….. 1-22 TABLE 1-18 PLANNING TEAM MEETING-UTILITY GROUP ………………………………………………….. 1-22 TABLE 1-19 PLANNING TEAM MEETING-HEALTH AND MEDICAL GROUP ……………………………. 1-23 TABLE 1-20 PLANNING TEAM MEETING-UNINCORPORATED PIERCE COUNTY GROUP ……….. 1-23 TABLE 1-21 REGIONAL PLANNING TEAM NORTH GROUP MEETINGS ………………………..……… 1-25 TABLE 1-22 REGIONAL PLANNING TEAM NE GROUP MEETINGS ………….………..…………………… 1-27 TABLE 1-23 REGIONAL PLANNING TEAM WEST GROUP MEETINGS ………………………………….… 1-27 TABLE 1-24 REGIONAL PLANNING TEAM CENTRAL GROUP MEETINGS ……………………………..… 1-30 TABLE 1-25 REGIONAL PLANNING TEAM SW GROUP MEETINGS ………………………………………… 1-32 TABLE 1-26 DROP-IN MEETINGS ………………………………………………………………………………..…… 1-34 TABLE 1-27 THREAT AND HAZARD WORKSHOP AGENDA-NATURAL HAZARDS …………………… 1-35 TABLE 1-28 THREAT AND HAZARD WORKSHOP AGENDA-TECHNOLOGICAL HAZARDS ……….. 1-35 TABLE 1-29 FIRST ELECTED OFFICIAL’S MEETINGS-CITYS AND TOWNS GROUP …………………. 1-41 TABLE 1-30 FIRST ELECTED OFFICIAL’S MEETINGS-FIRE GROUP ………………………………………. 1-43 TABLE 1-31 FIRST ELECTED OFFICIAL’S MEETINGS-SCHOOL GROUP …………………………………. 1-45 TABLE 1-32 FIRST ELECTED OFFICIAL’S MEETINGS-SPECIAL PURPOSE GROUP …………………. 1-46 TABLE 1-33 FIRST ELECTED OFFICIAL’S MEETINGS-UTILITY GROUP …………………………………. 1-47 TABLE 1-28 FIRST ELECTED OFFICIAL’S MEETINGS MEDICAL GROUP ……………………….…..….. 1-48
Profile Section
TABLE 2-1 2010 PIERCE COUNTY CENSUS DATA ………………..………………………………………………. 2-4 TABLE 2-2 PIERCE COUNTY POPULATION……………………….. ……………………………………………….. 2-4 MAP 2-1 PIERCE COUNTY POPULATION CONCENTRATION ……………..…………………………………. 2-6 MAP 2-2 PIERCE COUNTY PERCENT SPEAKING LESS ENGLISH ……………..…………………………….. 2-7 MAP 2-3 PIERCE COUNTY PERCENT WITH A DISABILITY ………………………………………………….. 2-10 MAP 2-4 ELECTRICAL DEPENDENCIES ………………………………………………………………………………..2-11 TABLE 2-3 FEDERAL & STATE LARGE LAND PARCELS IN PIERCE COUNTY……………………………. 2-13
TABLE 2-4 PIERCE COUNTY TOP EMPLOYERS…….……………………………………………………………… 2-15
Risk Assessment Section
TABLE 4-1a REGION 5 HAZARD IDENTIFICATION SUMMARY-GEOLOGICAL ………..………………….4-12 TABLE 4-1b REGION 5 HAZARD IDENTIFICATION SUMMARY-METEOROLOGICAL ………..…………4-13 TABLE 4-1c REGION 5 HAZARD IDENTIFICATION SUMMARY-TECHNOLOGICAL ………..………… 4-15 MAP 4-1 SHAKE MAP M7.1 TACOMA FAULT ZONE ……………………..……………………………………… 4-18 MAP 4-2 SHAKE MAP M7.2 SEATAC FAULT ZONE ……………………….………………………..…………… 4-19 MAP 4-2 SHAKE MAP M7.2 NISQUALLY FAULT ZONE ……………………….…………………..…………… 4-20
Geological Hazards Avalanche
FIGURE 4.1-1 SLAB AVALANCHE ……………………..…………………………..……………….………………… 4-22 MAP 4.1-1 AREA VULNERABLE TO AVALANCHE ……………………………………..…………..….…………. 4-24 TABLE 4.1-1 PIERCE COUNTY AVALANCHES OF RECORD ………………..…….………………..………… 4-25
Earthquake
FIGURE 4.2-1 WHAT IS AN EARTHQUAKE? ……………………………………….……………….………..…… 4-29 FIGURE 4.2-1 TYPES OF EARTHQUAKES ……………………………………….………………….……………… 4-30 MAP 4.2-1 PIERCE COUNTY EARTHQUAKES SOURCES ……………………….……………….……….…… 4-31 MAP 4.2-2 SEATTLE AND TACOMA FAULT SEGMENTS ……………….……………………………………… 4-34 MAP 4.2-3 MAGNITUDE 6.9 SCENARIO EARTHQUAKE – TACOMA FAULT ZONE ……………..…… 4-36 MAP 4.2-4 MAGNITUDE 7.2 SCENARIO EARTHQUAKE – SEATTLE FAULT ZONE ……….……….… 4-37 MAP 4.2-5 MAGNITUDE 9.3 SCENARIO EARTHQUAKE – CASCADIA MEGATHRUST ……….…..… 4-38 MAP 4.2-6 PIERCE COUNTY LIQUEFACTION SUSCEPTIBILITY ……….……………………………….… 4-40 MAP 4.2-7 MAJOR PACIFIC NORTHWEST EARTHQUAKES ………………………………………..……..… 4-41 TABLE 4.2-1 NOTABLE EARTHQUAKES FELT IN PIERCE COUNTY ……………….………….……....…. 4-41 FIGURE 4.2-3 SALMON BEACH, TACOMA WA-FOLLOWING FEB 2001 EARTHQUAKE ………..…… 4-45 FIGURE 4.2-4 LIQUEFACTION, NIIGATA JAPAN 1964 …………………………………………….…….……. 4-48 FIGURE 5.2-5 LATERAL SPREADING – MARCH 2001 ……………….…………………………………………. 4-48 FIGURE .62-5 BRIDGE SEISMIC SCREENING TOOL …………………….……………………………….……. 4-52
Landslide
FIGURE 4.3-1 NORTHEAST TACOMA-LANDSLIDE 01/2007 …………………………………..……..……… 4-55 TABLE 4.3-1 LANDSLIDE FACTS FOR PIERCE COUNTY – SHALLOW LANDSLIDE ………………..… 4-57 MAP 4.3-1 PIERCE COUNTY DEEP LANDSLIDE HAZARD AREA ………………..……………………..…… 4-58 MAP 4.3-2 PIERCE COUNTY SHALLOW LANDSLIDE HAZARD AREA ……………………………..……… 4-59 MAP 4.3-3 PIERCE COUNTY SLOPE STABILITY AREAS ……………………….………….………..………… 4-60 FIGURE 4.3-3 PIERCE COUNTY COMPARISON OF LANDSLIDE SUSCEPTIBLE AREAS ……………. 4-61 TABLE 4.3-1 NOTABLE LANDSLIDES IN PIERCE COUNTY …………….………………………………….… 4-62 FIGURE 4.3-4 SKI PARK ROAD-LANDSLIDE 01/31/03 ………………………………………………………… 4-63 FIGURE 4.3-5 SR-165 BRIDGE ALONG CARBON RIVER-LANDSLIDE 2/1996 ……………..…….…… 4-64 FIGURE 4.3-6 ALDERCREST DRIVE-LANDSLIDE ……………….………………………………………………. 4-65
Tsunami
FIGURE 4.4-1 HAWAII 1957-RESIDENTS EXPLORE OCEAN FLOOR BEFORE TSUNAMI ……..…… 4-67 FIGURE 4.4-2 HAWAII 1949-WAVE OVERTAKES A SEAWALL ……………………………………………… 4-68 FIGURE 4.4-3 TSUNAMIS IN WASHINGTON STATE ……………………………………………………..….... 4-70 FIGURE 4.4-4 SEATTLE AND TACOMA FAULTS …………………………………………………….…………… 4-71 FIGURE 4.4-5 TSUNAMI INUNDATION AND CURRENT ….……………..…………………………..…….…. 4-73 TABLE 4.4-1 NOTABLE TSUNAMIS IN PIERCE COUNTY …………………………………………..…………. 4-75 FIGURE 4.4-8 SALMON BEACH, 1949 TSUNAMIGENIC SUBAERIAL LANDSLIDE ………..………..… 4-76 FIGURE 4.4-11 DAMAGE IN TACOMA FROM THE 1894 TSUNAMI ……………………………..…………. 4-78
Volcanic
FIGURE 4.5-1 VOLCANIC HAZARDS …………………….………………………………………………………..… 4 -83 TABLE 4.5-1 TEPHRA TYPES AND SIZES …………………..………………………………………………….…. 4 -85 MAP 4.5-1 LAHARS, LAVA FLOWS, AND PYROCLASTIC HAZARDS OF MT RAINIER …….……..… 4 -87 TABLE 4.5-2 ESTIMATED LAHAR TRAVEL TIME-LAHAR 107 to 108 Cubic Meters Volume ……... 4 -89 MAP 4.5-2 ASHFALL PROBABILITY FROM MT RAINIER …………………..………………………………… 4 -90 TABLE 4.5-3 MT RAINIER IDENTIFIED TEPHRA, LAST 10,000 YEARS ………………………………… 4 -91 TABLE 4.5-4 PIERCE COUNTY RIVER VALLEY DEBRIS FLOW HISTORY ………………………….…… 4 -92
Meteorological Hazards Climate Change
FIGURE 4.6-1 GLOBAL TEMPERATURE CHANGE 1850 TO 2006 ……………….…………………….…. 4 -106 TABLE 4.6-1 RECENT AND PROJECTED TEMPERATURES FOR THE PACIFIC NW ……….…….…. 4 -108 FIGURE 4.6-2 PUGET SOUND PROJECTED WARMING ……………….…………………………..………... 4 -109 FIGURE 4.6-3 PUGET SOUND PROJECTED PRECIPITATION CHANGE …………………………….…. 4 -110 FIGURE 4.6-4 PUYALLUP RIVER: PROJECTED CHANGE IN MONTHLY HYDROGRAPH ……….…. 4 -111 FIGURE 4.6-5 PROJECTED DECLINE IN SNOWPACK ………………………………….……………………. 4 -112 TABLE 4.6-2 PROJECTED SEA LEVEL RISK: TACOMA ………………………………………………..……. 4 -113 FIGURE 4.6-6 SEA LEVEL RISK INUNDATION AREA IN 2100 TACOMA TIDEFLATS ………….…. 4 -113 FIGURE 4.6-7 CLIMATE IMPACTS AND NATURAL HAZARDS ……………….……………………………. 4 -116 FIGURE 4.6-8 COMPARISON OF THE SOUTH CASCADE GLACIER FROM 1928 TO 2003 …….… 4 -120 FIGURE 4.6-9 LOWER NISQUALLY GLACIER RETREAT: 1912 TO 2001 ………..…………..………. 4 -121
Drought
FIGURE 4.7-1 SEQUENCE OF DROUGHT IMPACTS ……………….………………………………….……… 4 -124 TABLE 4.7-1 PALMER DROUGHT SEVERITY INDEX ………………………………………………….……… 4 -125 MAP 4.7-1 PIERCE COUNTY WATERSHEDS ………………..………………………………………………..… 4 -126 TABLE 4.7-2 % AREA OF BASIN IN DROUGHT CONDITIONS SINCE 2895……………………..…… 4 -127 MAP 4.7-2 % OF TIME IN SEVERE TO EXTREME DROUGHT: 1895-1995 …………………………… 4 -128 MAP 4.7-3 % OF TIME IN SEVERE TO EXTREME DROUGHT: 1985-1995 …………………..……… 4 -128 TABLE 4.7-2 NOTABLE DROUGHTS AFFECTING PIERCE COUNTY ………………………………..…… 4 -129 FIGURE 4.7-3 NATIONAL DROUGHT MITIGATION CENTER DROUGHT IMPACT ………………… 4 -131 MAP 4.7-4 COLUMBIA RIVER BASIN …………………….………………………………………………………. 4 -132 MAP 4.7-5 USDA CLIMATE ZONES-WASHINGTON STATE ………………………………………..……… 4 -136
Flood
MAP 4.8-1 LOWER PUYALLUP RIVER …………………………………………………………………………..… 4 -143 TABLE 4.8-1 HISTORICAL FLOODING IN LOWER PUYALLUP RIVER ……………………….………… 4 -144 TABLE 4.8-2 LEVEES AND REVETMENTS IN THE LOWER PUYALLUP RIVER ……………………… 4 -146 TABLE 4.8-3 SUMMARY OF DAMANGES TO LOWER PUYALLUP RIVER FACILITIES ……….…… 4 -147 MAP 4.8-2 MIDDLE PUYALLUP RIVER …………………..………………………………………………….…… 4 -149 TABLE 4.8-4 HISTORICAL FLOODING IN MIDDLE PUYALLUP RIVER ………………………………… 4 -150 TABLE 4.8-5 LEVEES AND REVETMENTS IN THE MIDDLE PUYALLUP RIVER ……………………… 4 -152 TABLE 4.8-6 SUMMARY OF DAMANGES TO MIDDLE PUYALLUP RIVER FACILITIES …….… 4 -153-156
MAP 4.8-3 UPPER PUYALLUP RIVER …………………..…………………………………………………..……… 4 -158 TABLE 4.8-7 HISTORICAL FLOODING IN UPPER PUYALLUP RIVER …………………………………… 4 -159 TABLE 4.8-8 LEVEES AND REVETMENTS IN THE UPPER PUYALLUP RIVER ……………………… 4 -161 TABLE 4.8-9 SUMMARY OF DAMANGES TO UPPER PUYALLU8P RIVER FACILITIES ……… 4 -162-170 MAP 4.8-4 LOWER WHITE RIVER …………………..………………………………………………………..…… 4 -172 TABLE 4.8-10 HISTORICAL FLOODING IN LOWER WHITE RIVER ……………………………..……… 4 -173 TABLE 4.8-11 LEVEES AND REVETMENTS IN THE LOWER WHITE RIVER ………………….… 4 -174-175 TABLE 4.8-12 SUMMARY OF DAMANGES TO LOWER WHITE RIVER FACILITIES ………..….…… 4 -176 MAP 4.8-5 UPPER WHITE RIVER …………………..………………………………………………………….…… 4 -178 TABLE 4.8-13 HISTORICAL FLOODING IN UPPER WHITE RIVER ………………………………….…… 4 -179 TABLE 4.8-14 LEVEES AND REVETMENTS IN THE UPPER WHITE RIVER ………………………….… 4 -180 TABLE 4.8-15 SUMMARY OF DAMANGES TO UPPER WHITE RIVER FACILITIES ………..……… 4 -181 MAP 4.8-6 GREENWATER RIVER …………………..………………………………………………………..…… 4 -183 TABLE 4.8-16 HISTORICAL FLOODING IN GREENWATER RIVER ………………………………..…… 4 -184 MAP 4.8-7 CARBON RIVER …………………..……………………………………………………………………… 4 -187 TABLE 4.8-17 HISTORICAL FLOODING IN CARBON RIVER ………………………………………..…… 4 -188 TABLE 4.8-18 LEVEES AND REVETMENTS IN THE CARBON RIVER …………………………….…… 4 -190 TABLE 4.8-19 SUMMARY OF DAMANGES TO CARBON RIVER FACILITIES ………………...… 4 -190-198 MAP 4.8-8 SOUTH PRAIRIE CREEK …………………..…………………………………………….……….….… 4 -200 TABLE 4.8-20 HISTORICAL FLOODING IN SOUTH PRAIRIE CREEK …………………………………… 4 -201 MAP 4.8-9 MIDDLE NISQUALLY RIVER …………………..………………………………….……….……….… 4 -204 TABLE 4.8-21 HISTORICAL FLOODING IN MIDDLE NISQUALLY RIVER …………………………..… 4 -205 MAP 4.8-10 UPPER NISQUALLY RIVER …………………..………………………………………….….…….… 4 -208 TABLE 4.8-22 HISTORICAL FLOODING IN UPPER NISQUALLY RIVER ………………………..…..… 4 -209 TABLE 4.8-23 SUMMARY OF DAMANGES TO UPPER NISQUALLY RIVER FACILITIES ………..… 4 -210 MAP 4.8-10 MASHEL RIVER …………………..…………………………………………….……………….…….… 4 -213 TABLE 4.8-24 HISTORICAL FLOODING IN MASHEL RIVER ………………………………………….…… 4 -214 FIGURE 4.8-1 NOV 2006 FLOODING RIVER PARK ESTATES-PUYALLUP RIVER ………….…….… 4 -216
Severe Weather
TABLE 4.9-1 FUJITA TORNADO DAMAGE SCALE ……………………………………………………….……. 4 -224 FIGURE 4.9-1 WINDSTORM TRACKS ………………………………………………………………………..……. 4 -226 MAP 4.9-1 PIERCE COUNTY SEVERE WEATHER WIND HAZARD-SOUTH WIND EVENT ……..… 4 -227 MAP 4.9-2 PIERCE COUNTY SEVERE WEATHER WIND HAZARD-EAST WIND EVENT ……….…. 4. -228 TABLE 4.9-2 NOTABLE SEVERE WEATHER IN PIERCE COUNTY ………………………………..… 4 -229-230 FIGURE 4.9-2 SNOWSTORM 01/2004 DOWNTOWN TACOMA ………………………………..…….…… 4 -233 FIGURE 4.9-3 SATELLITE IMAGE-HANUKKAH EVE WINDSTORM …………………………………….… 4 -234 FIGURE 4.9-4 BEFORE/AFTER TORNADO DAMAGE GREENSBURG KS 05/04/07 …………………. 4 -236 FIGURE 4.9-5 TACOMA NARROWS BRIDGE-NOVEMBER 7, 1940 WINDSTORM ……………….…. 4 -239 FIGURE 4.9-6 COUNTY ROAD DECEMBER 2006 WINDSTORM ……………………………………….… 4 -241
Wildland Urban Interface Fire
MAP 4.10-1 WASHINGTON STATE FIRE HAZARD MAP …………………………………………………... MAP 4.10-2 INDUSTRIAL FIRE PRECAUTION LEVEL SHUTDOWN ZONE …………………………… FIGURE 4.10-1 CARBON COPY FIRE AUGUST 2006 ……………….……………………………..……….. MAP 4.10-3 WASHINGTON STATE DNR WILDLAND FIRE STATISTICS: 1973-2018 …..………. TABLE 4.10-1 DNR WILDLAND RESPONSE SOUTH PUGET SOUND REGION: 2010-2019 ….… MAP 4.10-4 PIERCE COUNTY FIRE OCCURANCES 2010-2019 ………………………………..……..… TABLE 4.10-2 PIERCE, KING AND SNOHOMISH COUNTY FIRES ….…………………………………..
4 -247 4 -248 4 -249 4 -251 4 -252 4 -253 4 -254
Technological Hazards Abandoned Mines
FIGURE 4.11-1 WARNING SIGN POSTED AT MINE ENTRANCE……………………………………..…… 4 -259 TABLE 411-1 SOME PIERCE COUNTY NAMED COAL MINES…………………………………………….… 4 -260 FIGURE 4.11-2 LADY WELLINGTON MINE TIPPLE……………………………………………………….…… 4 -261 MAP 4.11-1 MINE HAZARD AREAS OF PIERCE COUNTY……………………………………………………. 4 -262
FIGURE 4.T1-3 PACIFIC COAST COAL MINE TIPPLE, CARBONADO……………………………….…… 4 -264
Active Threat / Attack Tactics
FIGURE 4.12-1 ACTIVE SHOOTER INCIDENTS IN US FROM 2000-2017 INCIDENTS …………… 4 -270 FIGURE 4.12-2 ACTIVE SHOOTER INCIDENTS IN US FROM 2000-2017 CASUALTY ……….…… 4 -271 FIGURE 4.12-3 ACTIVE SHOOTER INCIDENTS IN US FROM 2000-2017 LOCATION ……….…… 4 -272 TABLE 4.12-1 OCCURANCES IN THE PUGET SOUND ………………………………………………………. 4 -274
Civil Disturbance
MAP 4.13-1 CIVIL DISTURBANCE HIGH PROBABILITY LOCATIONS ……………………….…….…… 4 -281 MAP 4.13-2 CIVIL DISTURBANCE HIGH PROBABILITY LOCATIONS ZOOMED IN …….…….…… 4 -282
Cyber Attack
TABLE 4.14-1 REORTED INCIDENTS IN THE US BETWEEN LATE 2010 TO EARLY 2013 ……… 4 -289
Dam Failure
FIGURE 4.15-1 REASONS FOR DAM FAILURES NATIONALLY………………………………………..…… 4 -293 TABLE 4. 15-1 PIERCE COUNTY DAMS THAT POSE A RISK TO THE PUBLIC…………………..…… 4 -295 TABLE 4. 15-1 PIERCE COUNTY HIGH AND SIGNIFICANT RISK DAMS………………………….…… 4 -298 TABLE 4. 15-2 SELECT DAM FAILURES IN WASHINGTON STATE…………………………………….… 4 -299 FIGURE 4. 15-2 MUD MT DAM INTAKE…………………………………………………………………………… 4 -300
Energy Emergency
FIGURE 4.16-1 THE CARRIER LEXINGTON PROVIDING ELECTRICITY………………………………… 4-307
Epidemic/Pandemic
FIGURE 4.17-1 INDIVIDUALS HOPING TO AVOID CONTACTING DISEASE……………………..…… 4-318
Hazardous Materials
TABLE 4.18-1 LIST OF CONSTITUENTS OR INGREDIENTS FOUND IN BAKKEN CRUDE OIL … 4-321 TABLE 4. 18-2 REPORTED IDENTIFIED TOP FIVE FACILITIES ……………………………….…………. 4-322 FIGURE 4. 18-1 EXXON VALDEZ OIL SPILL, 1989…………………………………………………….………. 4-323 TABLE 4. 18-3 PIERCE COUNTY SPILL DATA FROM May 2018-May 2019 ……………………………. 4-324 FIGURE 4. 18-2 DALCO PASSAGE OIL SPILL CLEAN UP…………………………………………….………. 4-326
Pipelines18
TABLE 4.19-1 CITIES & TOWNS WITH INTERSTATE PIPELINES…………………………………….…… 4-330 FIGURE 4.19-1 OLYMPIC PIPELINE RUPTURE 06/10/99………………………………………………..…… 4-331 MAP 4.19-1PIERCE COUNTY PIPELINES…………………………………………………………………………… 4-332 FIGURE 4.19-2 WATCOM FALLS PARK, 2003……………………………………………………………….…… 4-335
Terrorism Transportation
TABLE 4.21-1 AIRPORTS IN PIERCE COUNTY………………………………………………………………..… 4 -345 TABLE 4.21-2 FERRY SERVICE IN PIERCE COUNTY………………………………………………………..… 4 -347 FIGURE 4.21-1 TRANSPORTATION ACCIDENTS/CATASTROPHIC FAILURES PIERCE COUNTY 4 -348
REGION 5 ALL HAZARD MITIGATION PLAN 2020-2025 EDITION BASE PLAN EXECUTIVE SUMMARY Introduction Public Law 106-390 The Disaster Mitigation Act of 2000 was passed by Congress on October 30th, 2000. This act required local jurisdictions to have a disaster mitigation plan in order to obtain either Pre-Disaster Mitigation (PDM) or Hazard Mitigation Grant Program (HMGP) funds. The Region 5 Hazard Mitigation Plan was originally completed in 2008 and included 48 jurisdictions; having worked together for over two years. This Base Plan with 48 Addenda received final approval from FEMA in November 2008. In 2009 a Phase II and a Phase III were completed adding an additional 21 Addenda to the existing Region 5 Hazard Mitigation Plan and bringing the total Addenda to 68 (several mergers in Fire Districts changed the original numbers). The final approval from FEMA for these additional addenda came on January 13, 2010. In addition, there are eight health and medical hazard mitigation plans that were completed under a contract from Multi-Care Organization and these have also been incorporated into the larger Region 5 Hazard Mitigation Plan. A review and update from the original plan that expired on November 24, 2013 was completed and FEMA granted an extension allowing for further hazard analysis incorporating HAZUS-MH. That update encompassed the work of the 75 original jurisdictions under the direction and guidance of staff from the Pierce County Department of Emergency Management. In addition to the original jurisdictions, one new jurisdiction; Tanner Electric Company was added bringing the total Addenda to 76. A complete review of the July 23, 2015 edition occurred during 2019 and 2020. This current update originally began with the 76 existing Addenda with 5 deciding not to update their plans bringing the number down to 71. Two jurisdictions having stand alone mitigation plans decided to join the Region 5 Mitigation Program and an additional 3 jurisdictions developed their first-time plans bringing the total Addenda back up to 76. The Process Section of this document details the complete process to accomplish this update. (Section 1 – Process) Homeland Security Region 5 is congruent with Pierce County. While technically the two are interchangeable on a geographic level they are not interchangeable on the planning level. This plan, and the commitment of those whose energy created it, is a testament to the resolve of the jurisdictions to make Region 5, Pierce County, a safer more enjoyable place to work, live, and thrive. These 76 jurisdictions include 20 cities and towns and unincorporated Pierce County, 12 fire districts, 14 school districts and 1 university, 14 water purveyors and electric companies, 7 special purpose districts, and 7 health and medical organizations.
PAGE ES-1 REGION 5 ALL HAZARD MITIGATION PLAN – 2020-2025 EDITION BASE PLAN
This plan is an all hazard mitigation plan. As such it addresses those hazards that are considered part of the natural environment of Pierce County as well as those most common technical hazards. Though not required for a federally approved Mitigation Plan, Pierce County is an EMAP (Emergency Management Accreditation Program) County and as such must include technological hazards as well. Traditionally many of the hazards were considered independently. For the purposes of this Plan some consolidation was done. For example, snowstorms, ice storms, tornadoes, and windstorms were all combined into a single category, severe weather. The other traditional hazards that are included are avalanche, drought, earthquake, flood, landslide, tsunami and seiche, volcano, and wildland/urban interface fires. Due to the extensive research that has been conducted the past few years into the effects of climate change the decision was made to provisionally include it in the Plan, but without attempting to address mitigation measures related to it. As more is understood about the consequences for the local jurisdictions, mitigation measures may be included in future editions of the Plan. Additionally, the following technological hazards were reviewed including abandoned mines, active threat / attack tactics, civil disturbance, cyber-attack, dam failure, energy emergencies, epidemics, hazardous materials, pipeline hazards, terrorism, and transportation accidents. Though there is not a lot of documentation on these types of events in the greater Puget Sound area, extensive research was done for the Pierce County Hazard Identification and Risk Assessment (HIRA) Guide and updated in 2020.
Natural Hazards Some but not all of these hazards have had a major impact on the jurisdictions within the Homeland Security Region 5 boundaries. Of the 9 natural hazards that affect Pierce County, avalanche is the only one that affects very few jurisdictions. Avalanches are a factor in the higher mountainous areas of Region 5; areas that are predominately outside the boundaries of the 76 jurisdictions. Drought has intermittently created problems for citizens of all 76 jurisdictions. Generally not reaching disaster proportions, it strains the ability of water purveyors to supply the public with enough water to carry on their normal activities. Drought can have variable effects depending on the location within the Region and type of businesses that are affected. Agriculturally based businesses and a few types of industry will feel the effects the earliest and usually the most. It is not until a drought has occurred for over the course of some years that citizens in the Region begin to feel its effects in their everyday activities. The earthquake threat is becoming better known through the research done by both governmental and educational organizations. We no longer have to rely on recorded earthquakes of the past 150 years. Research has shown that we have three distinct earthquake threats in Region 5. Deep earthquakes like the 2001 Nisqually earthquake that was magnitude 6.8; earthquakes on the Seattle or Tacoma Faults that could have a magnitude up to 8.0; and subduction earthquakes located off the Washington Coast that could have a magnitude as high as PAGE ES-2 REGION 5 ALL HAZARD MITIGATION PLAN – 2020-2025 EDITION BASE PLAN
9.0. An earthquake of any of these types could cause millions if not billions of dollars of damage within the Region. Floods are the cause of most federal disaster declarations that include Pierce County. The last two major floods to impact Pierce County were the January 2009 flood and December 2007 flood. Both of these caused millions of dollars worth of damage to both the private and public sectors. The landslide hazard in Pierce County includes slopes identified as having over a 15% rise. Landslides happen with frequently both during and after rainstorms and earthquakes In the County, to date none have been catastrophic. However, with continuing population expansion into areas with landslide potential, the possibility of a large slide damaging multiple properties and possibly injuring or killing citizens continues to increase. The severe weather hazard includes the wide variety of weather problems jurisdictions in Pierce County will encounter. Windstorms, hail, snow, ice storms, and tornadoes have all impacted the County in the past. The most recent example was the federal disaster declaration for the Christmas snow and freezing temperatures of December 2008. The tsunami section includes seiche as a problem that may impact the County in the future. Tsunami is a Japanese word meaning large harbor wave. Pierce County has been impacted by three tsunamis generated in Puget Sound in the past 120 years. The largest of these, the 1894 tsunami, originated in Commencement Bay, destroyed 300 feet of dock and sent a ten-foot wave into Old Town Tacoma. A close relative of the tsunami is the seiche. Formed in an enclosed body of water, it is likened to a large basin of water where one side is lifted a little and the resulting waves are reflected back and forth from shore to shore over time. Seiches in Pierce County could happen in lakes or to some extent in the southern portion of Puget Sound. Pierce County’s volcano problem largely stems from Mt. Rainier. There is a small potential for ash from other volcanoes in the Cascades, especially Mt. St. Helens. Mt. Rainier is the only volcano with the high potential for inundating the major river valleys in the County with mud (by a lahar) up to 30 or more feet deep. The wildland/urban interface fire (WUI) problem faced by the jurisdictions is directly related to the quantity of unimproved/forested land they have in their boundaries. The Department of Natural Resources reports that there are one or two WUI fires in the Pierce/King County area every couple of years. Most are of small size and do not affect large areas, but the possibility of a large-scale fire is always there.
Technological Hazards Known abandoned mines in Pierce County are all located in the eastern part of the County and thus only affect those jurisdictions in that vicinity. Potential damage from abandoned mines PAGE ES-3 REGION 5 ALL HAZARD MITIGATION PLAN – 2020-2025 EDITION BASE PLAN
includes collapse of buildings or roads built over old mine shafts, but most of these are in less populated areas of the County and the threat is limited. Civil unrest or disturbance is of higher probability in the larger cities and areas with a higher population density. This can, spill into rural areas as situations escalate. Generally it requires a seed incident and an adequate population to get started. In Pierce County there are 33 dams and dikes; most owned by Puget Sound Energy and Tacoma Public Utilities. Of these, three are considered high risk for dam failure and five others at considerable risk according to the number of people in the threat area. Cyber attacks are increasing in frequency and can have devasting impacts. There is a significant increase in scams, phishing attacks, and Advance Persistent Threat attacks to gain access to financial a cyber systems during times of disasters. Cyber Critical Infrastructure CyberSecurity Consultants provides services to many in Pierce County including South Sound 9-1-1, Pierce County Radio Communications, Washington State Patrol, and many other local agencies. An energy emergency may happen anywhere in the County. It may happen to a small community, or it may be County or even western Washington-wide. The most frequent energy emergencies exist during winter storms. The breaking of power lines due to trees toppling or branches breaking is the usual cause. Epidemics and pandemics have, in the past impacted every jurisdiction and they will continue to do so in the future. To what extent they infect the public depends on their ease of transmittal. Hazardous materials incidents may be either generated from a fixed site or the result of a transportation related accident or release. Current Pierce County pipelines include Northwest Pipeline Corp, Olympic Pipeline Co, and U.S. Oil and Refining Co. Between these they contain 80.93 miles of natural gas pipeline and 44.68 miles of liquid petroleum product pipeline in the County and this defines the pipeline hazard in Pierce County. Terrorist / Active Threat / Attack Tactics incidents can occur at any time or place where a group can justify or rationalize their action. They have occurred in major metropolitan areas such as bombings in New York and other major cities and they have occurred in forests of Washington and Oregon. Terrorism and active threats exist in every state in the nation. The various forms of transportation covering the majority of the County have considerable potential for Transportation accidents that could threaten Pierce County’s infrastructure, its citizens, and their livelihood. Because these hazards continually threaten the citizens of the County, Pierce County developed a mitigation plan in 2004, assisted eight other jurisdictions with their plan development prior to the Region 5 Hazard Mitigation Plan of 2008 and now we update the 2008 plan to include all PAGE ES-4 REGION 5 ALL HAZARD MITIGATION PLAN – 2020-2025 EDITION BASE PLAN
previous jurisdictions. Each plan completed brings another segment of the community closer to being disaster resilient.
DMA 2000 and the Plan Purpose FEMA defines hazard mitigation as those actions taken to reduce or eliminate the long-term risk to people, property, the social infrastructure, or the environment from hazards and their effects. Hazard mitigation planning is the process of determining the best means of reducing or eliminating these risks. The Disaster Mitigation Act of 2000 (DMA 2000) is the federal impetus for the Region 5 Hazard Mitigation Plan. This act, amending the Robert T. Stafford Disaster Relief and Emergency Assistance Act, added a new section 322 on Mitigation Planning. Section 322 requires each jurisdiction wishing to receive mitigation funds through the Hazard Mitigation Grant Program and the Pre-Disaster Mitigation Program, to abate or reduce the threat from local hazards by means of an approved mitigation plan. This legislation is codified as 44 CFR Part 201. The specifics that local jurisdictions are to follow in developing their plans are outlined in 44 CFR Part 201.6. The regulatory directive included in the Federal Statement of Purpose under 44 CFR 201.1 subpart (b) states: “The purpose of mitigation planning is for State, local, and Indian tribal governments to identify the natural hazards that impact them, to identify actions and activities to reduce losses from those hazards, and to establish a coordinated process to implement the plan, taking advantage of a wide range of resources.” Taking the Federal Statement of Purpose as a guide, the Region 5 All Hazard Mitigation Plan team has developed the following Region 5 Plan Purpose: The 76 Region 5 jurisdictions covered in this Plan, in an effort to develop disaster resilient communities by breaking the hazard cycle, joined together to develop this mitigation plan. Over time, working independently and in coordination with other jurisdictions, each jurisdiction through hazard risk assessments, the administration of hazard mitigation grant programs, and developing a coordinated approach to mitigation strategy at the local, state, and regional levels, will contribute to the safety and well being of citizens throughout the Region. In seeking accordance with Federal requirements and the individual jurisdictions mission statements, the Plan Purpose is the foundation for the Plan’s Goals.
The Plan’s Goals All jurisdictions worked together to come up with a list of goals that would represent their views and will create a foundation for the mitigation measures they develop. The goals are: PAGE ES-5 REGION 5 ALL HAZARD MITIGATION PLAN – 2020-2025 EDITION BASE PLAN
• • • • • •
Protect Life and Property, Ensure Continuity of Operations, Establish and Strengthen Partnerships for Implementation, Protect or Restore Natural Resources, Increase Public Preparedness for Disasters, and Promote a Sustainable Economy.
Each mitigation measure in the individual jurisdictions portion of the plan addresses one or more of these goals. In many cases the measures address multiple goals or even all of the goals.
The 76 Jurisdictions and the Process Prior to the end of 2004, Emergency Management Planning Staff had been working on local jurisdiction mitigation plans. However, these were done in small increments of one or two at a time. In December of 2004 Pierce County Emergency Management consulted with many jurisdictions throughout the County to determine the interest in combining the work into developing a joint plan to cover many jurisdictions at the same time. This would speed up the process of plan development allowing many more jurisdictions the opportunity to improve their mitigation of natural hazards, but also to become eligible for both pre- and post-disaster mitigation funds. 48 jurisdictions decided to work together on the Plan with the County and that initial planning effort was completed in 2008. In 2009 and 2010 an additional 21 jurisdictions elected to develop hazard mitigation plans with Pierce County and those plans were adopted under the original base plan from 2008 and added as addenda to that plan. This brought our total jurisdiction plans to 68 (two fire districts merged eliminating one of the original 48). In 2009 the Multi-Care Organization applied for a planning grant for PDM funding and received a grant to develop a hazard mitigation plan for Multi-Care. They immediately asked for other health care organizations to join with them in their planning effort and then asked Pierce County to lead them in the process. These plans were completed and adopted in 2012. The review process began in 2012 to update the original mitigation plans, an additional jurisdiction, Tanner Electric, came forward and asked to be included in this planning effort. This brought our total jurisdictions to 76 for this plan. During 2017, the City of Puyallup asked to be included with the Region 5 Hazard Mitigation planning efforts and completed and adopted their plan in 2018, bringing the total jurisdictional plans to 77. The second review process began in 2019 and one more city asked to be included in the planning effort. In addition, two more utility companies and a special purpose district also joined the early stages of the update. During the early phases of the review process 3 Special Purpose Districts PAGE ES-6 REGION 5 ALL HAZARD MITIGATION PLAN – 2020-2025 EDITION BASE PLAN
and 2 jurisdictions from the Medical Organizations opted to not update their plans at this time. With gaining 5 jurisdictions and then loosing 5 our number remained the same with 76 Addendum. These jurisdictions were split into six separate planning groups of similar or related interests, with an additional group just for the unincorporated Pierce County Addenda at the beginning of the review process. In addition each jurisdiction was grouped to a regional group based on their location in the County and commonality of hazards. These geographic groups were to facilitate relationship building and local collaborative planning between jurisdictions in an effort to bring increased resiliency to their communities. The six planning groups, with their geographic group in parentheses, are shown in Table ES-1 Region 5 Planning Groups. Table ES-1 Region 5 Planning Groups Cities and Towns Group (21) 1. City of Bonney Lake (NE) 2. City of Buckley (NE) 3. City of DuPont (SW) 4. City of Edgewood (N) 5. City of Fife (N) 6. City of Fircrest (N) 7. City of Gig Harbor (W) 8. City of Lakewood (SW) 9. City of Milton (N) 10. City of Orting (NE) 11. City of Puyallup (C) 12. City of Roy (C) 13. City of Sumner (NE) 14. City of Tacoma (N) 15. City of University Place (SW) 16. Town of Carbonado (NE) 17. Town of Eatonville (C) 18. Town of South Prairie (NE) 19. Town of Steilacoom (SW) 20. Town of Wilkeson (NE) 21. Unincorporated Pierce County Fire Group (12) 1. West Pierce Fire & Rescue (PCFD #3) (SW) 2. Gig Harbor Fire & Medic One (PCFD #5) (W) 3. Central Pierce Fire & Rescue (PCFD #6) (C) 4. Browns Point – Dash Point (PCFD #13) (N) 5. Riverside Fire & Rescue (PCFD #14) (N) 6. Key Peninsula Fire (PCFD #16) (W) 7. South Pierce Fire District #17 (SW) 8. Orting Valley Fire & Rescue (PCFD #18) (NE) 9. Graham Fire and Rescue (PCFD #21) (C) 10. East Pierce Fire and Rescue #22 (NE) 11. Ashford – Elbe (PCFD #23) (C) 16. Anderson Island Fire & Rescue (PCFD #27) (SW)
1.
Special Purpose Districts (7) Crystal River Ranch Association N(E)
School Group (15) 1. Carbonado School District (NE) 2. Clover Park School District (SW) 3. Dieringer School District (NE) 4. Eatonville School District (C) 5. Fife School District (N) 6. Franklin Pierce School District (C) 7. Orting School District (NE) 8. Pacific Lutheran University (C) 9. Peninsula School District (W) 10. Puyallup School District (C) 11. Steilacoom School District No. 1 (SW) 12. Sumner-Bonney Lake School District (NE) 13. Tacoma School District (N) 14. University Place School District (SW) 15. White River School District (NE)
1. 2. 3. 4. 5. 6. 7. 8. 9. 10. 11. 12. 13. 14.
Utility Group (14) Clear Lake Water District (SE) Firgrove Mutual Water Company (C) Fruitland Mutual Water Company (C) Graham Hill Mutual Water Company (C) Lakeview Light and Power (SW) Lakewood Water District (SW) Mt. View-Edgewood Water Company (N) Ohop Mutual Light Company (SE) Parkland Light and Water Peninsula Light Company Spanaway Water Company (C) Summit Water and Supply Company (C) Tanner Electric (SW) Valley Water District (E)
1.
Health and Medical Group (7) MultiCare Health System (N)
PAGE ES-7 REGION 5 ALL HAZARD MITIGATION PLAN – 2020-2025 EDITION BASE PLAN
2. Crystal Village Homeowners Association (NE) 2. Franciscan Health System (N) 3. Metropolitan Park District of Tacoma (N) 3. Kaiser Permanente (N) 4. Pierce Transit (SW) 4. Cascade Regional Blood Services (N) 5. Port of Tacoma (N) 5. Community Health Care (N) 6. Riviera Community Club (SW) 6. Western State Hospital (SW) 7. Taylor Bay Beach Club Inc. (W) 7. Tacoma-Pierce County Health Department (N) C – Central Planning Area, NE – North East Planning Area, N – North Planning Area, W – West Planning Area, SW – Southwest Planning Area,
PAGE ES-8 REGION 5 ALL HAZARD MITIGATION PLAN – 2020-2025 EDITION BASE PLAN
Map ES-1 City and Town Planning Group
PAGE ES-9 REGION 5 ALL HAZARD MITIGATION PLAN - 2020-2025 EDITION BASE PLAN
Map ES-2 Fire Planning Group
PAGE ES-10 REGION 5 ALL HAZARD MITIGATION PLAN - 2020-2025 EDITION BASE PLAN
Map ES-3 School Planning Group
PAGE ES-11 REGION 5 ALL HAZARD MITIGATION PLAN - 2020-2025 EDITION BASE PLAN
Map ES-4 Special Purpose Districts Group
PAGE ES-12 REGION 5 ALL HAZARD MITIGATION PLAN - 2020-2025 EDITION BASE PLAN
Map ES-5 Utility Planning Group
PAGE ES-13 REGION 5 ALL HAZARD MITIGATION PLAN - 2020-2025 EDITION BASE PLAN
Map ES-6 Health and Medical Planning Group
PAGE ES-14 REGION 5 ALL HAZARD MITIGATION PLAN - 2020-2025 EDITION BASE PLAN
Map ES-7 Unincorporated Pierce County
PAGE ES-15 REGION 5 ALL HAZARD MITIGATION PLAN - 2020-2025 EDITION BASE PLAN
Reader’s Guide to the Plan This plan is broken into three main components, the Base Plan, the Addenda, and the Appendices. The Base Plan covers the material relevant to all 76 jurisdiction plans. It contains the structure and information that underlies the individual plans. The Addenda include the individual 76 jurisdiction plans, and the Appendices information relevant to understanding and completing the plan. The format of the Base Plan is also followed for each of the 76 individual plans. In addition each of the individual plans, in its own addendum, will have an appendix that will include a copy of the resolution passed by the jurisdiction adopting the plan, and the final approval letter from FEMA. The Base Plan consists of seven sections: a Process Section; a Profile Section; a Capability Identification Section; a Risk Assessment Section; a Mitigation Strategy Section; an Infrastructure Section; and a Maintenance Section. The Process Section describes the process the 76 jurisdictions went through with the Pierce County staff to update these plans. It gives the participants, lists the meetings, and what was discussed in those meetings. It then addresses how the Plan was developed around all major components identified in 44 CFR 201.6, including: • • • • • • •
Public Involvement Process; Jurisdiction Profile; Capability Identification; Risk Assessment; Mitigation Strategy; Infrastructure Section; and, Plan Maintenance Procedure.
It discusses the reasoning for the process that was followed. It covers the types of information that was garnered from the individual jurisdictions and the information from research that was done by County staff. The Profile Section gives an overview of Region 5. It discusses the Region in six different categories. They are demographics, geography, geology, climate, transportation, and economy. Maps are included to show the overall lay of the County, it’s topography, the six different planning groups, and a County land use map. The Capability Identification Section provides an overview of the types of capabilities that would be available to local jurisdictions. It summarizes the types of capabilities that local jurisdictions are already in some cases using and can continue to use as they develop targeted mitigation plans. It summarizes the types of capabilities and their use by local jurisdictions. PAGE ES-16 REGION 5 ALL HAZARD MITIGATION PLAN - 2020-2025 EDITION BASE PLAN
Finally it covers extra-local federal funding sources, and state agencies that have mitigation capabilities. The Risk Assessment Section analyzes the risk throughout the Region for the identified hazards. In this update we have identified additional hazards aside from natural hazards. Included are nine natural hazards and eleven technological hazards. The natural hazards are avalanche, drought, earthquake, flood, landslide, severe weather, tsunami, volcano, and wildland/urban interface fire. The technological hazards are abandoned mines, active threat / attack threats, civil disturbance, cyber-attack, dam failure, energy emergency, epidemic, hazardous materials, pipeline hazards, terrorism, and transportation accidents. In addition an overview section on climate change has been added although it is not referenced in the development of mitigation strategies. The Risk Assessment Section goes a step further and evaluates the effects of each hazard on the public; on the responders; on the ability of a jurisdiction to maintain operations and deliver services; on property, facilities, and infrastructure; on the environment; on the economic and financial condition; and on the reputation of jurisdictions or organizations that are impacted by it. The Mitigation Strategy Section describes how mitigation measures are developed based on the Risk Assessment and Capability Identification. Being the Base Plan it does not have mitigation measures proposed here. They are in the individual jurisdiction plans in the Addenda. The Infrastructure Section is an optional component of the Plan. In the Base Plan it only lists the components that each jurisdiction has included. It was decided that by including a section on each individual jurisdiction’s infrastructure it would help the jurisdictions focus on their vulnerability and where their mitigation measures could bring the most benefit. The infrastructure section is exempt from public disclosure pursuant to RCW 42.56.420. The Plan Maintenance Section has three components. The first component involves Plan Adoption. It discusses how each individual plan will be sent to Washington Emergency Management Division and then on to FEMA as part of the Pre-Adoption Review. Once reviewed, and any modifications requested by the State or FEMA have been made, the plans will be adopted by the individual jurisdictions. The second component discusses how each individual jurisdiction must come up with a strategy to implement, maintain and update the plan. These updates must be done at a minimum of every 5 years. Jurisdictions may do it more frequently if they desire. The final component covers the need for the public to have input into the plan review and update processes.
The Addenda
PAGE ES-17 REGION 5 ALL HAZARD MITIGATION PLAN - 2020-2025 EDITION BASE PLAN
The Addenda are the core of this Plan. They are the individual plans for the 76 jurisdictions. Each addendum’s format follows the same format as the Base Plan, having the same seven sections and attached appendices. However, the material in each section is specific to that jurisdiction and not general as in the Base Plan. It relies on the background information given in the Base Plan but is focused on the individual jurisdiction’s situation and needs. Rather than repeat the background information given in the Base Plan each Annex accepts the relevant background material and only summarizes the information pertinent to it. The Addenda Process Sections refer back to the Base Plan for the comprehensive list of the meetings and the process that each jurisdiction went through. Because this is a plan update, this is where you will find specific information for each jurisdiction on the changes made to their plans. The Addenda Profile Sections provide summaries of the individual jurisdictions. Each section includes the services provided, what type of organization they are, their population, a summary of their infrastructures, individual land use descriptions where applicable, and economic summary or specific budget information. The Addenda Capability Sections cover the different ways that the mitigation measures might be able to be implemented. It summarizes the legal and regulatory capabilities of each jurisdiction. It then summarizes using tables the administrative, technical, and fiscal as well as any special capabilities each jurisdiction may have. The Addenda Risk Assessment Sections give an overview of the natural hazard threat and which hazards could affect each individual jurisdiction. It does this through a series of maps, tables, and hazard summary for each of the hazards the jurisdiction considers their highest risks. First the maps spatially show the location of the hazards that affect each jurisdiction, flood, lahar, earthquake, and landslide, etc. Additionally, wildland/urban interface fire is included where information is available although this cannot be mapped out at this time . In addition, the drought, severe weather, or the area affected by climate change are something we can map since their affects are universal, although with minor variations across the County . Since avalanche does not directly affect any of the jurisdictions covered in this plan there is no map. There is an assumption that the entire Region will be affected by earthquakes, storms, drought and possibly ashfall from the Cascade volcanoes; especially Mt. Rainier and Mt. Saint Helens. The maps showing earthquake hazard areas are only the areas with soils that are prone to liquefaction. Similarly the volcano hazard map only shows those areas that can expect lahar inundation. The technological hazards are difficult to map, but we are able to include locations of abandoned mines, locations of dams, locations of pipelines as well as transportation routes where we find hazardous materials being transported as well as the potential for transportation accidents. The Addenda Mitigation Strategy Sections build on the risk assessment and capability identification sections. Each of the mitigation strategies are prioritized according to the jurisdictions risk and capabilities to mitigate the risk and build resiliency within their PAGE ES-18 REGION 5 ALL HAZARD MITIGATION PLAN - 2020-2025 EDITION BASE PLAN
communities. Each Mitigation Strategy Section is divided into two parts. The first part is a compilation table showing all the various mitigation measure priorities the jurisdiction has proposed. It shows who is the lead organization and the estimated timeframe when it might be implemented. It also shows which goals the measure addresses. The second part is comprised of short write ups of all the proposals. Each jurisdiction creates their own individual mitigation strategies. Each strategy as with the table displays specific information about the measure proposal. The third part is an updated quick status table of where the jurisdiction is at with each mitigation measure, they developed. With completed or deferred strategies an Appendix E or F was created to retain the history of completed strategies. Deferred strategies can be at any time incorporated back into Strategy section of their plans. This allows this section of the plan to remain the working portion. The Addenda Infrastructure Section is not a requirement of 44 CFR Part 201. However it was decided to include it to help with an overall understanding of each jurisdiction’s needs. This section includes summary tables of each piece of infrastructures’ dependencies and vulnerabilities. The Addenda Plan Maintenance Section is the final section of each Addendum. It describes how that individual plan will be monitored and updated. Each of the 76 plans must be updated at least every 5 years. Some jurisdictions have scheduled a more frequent review and that is included in the maintenance section.
The Appendices The Appendices consist of supplementary material to assist with the understanding of the Plan. This includes a list of acronyms and a glossary. In the individual Addenda, Appendix A includes the Resolution by their elected officials to adopt their plan as well as a copy of the final approval letter from FEMA. Each of the individual Addenda contains Appendices A-D with some having an additional E and F for public documentation and completed or deferred mitigation strategies.
Conclusion The Base Plan as updated in 2020, was submitted to the State EMD for review June 2020. The Plan was then submitted to FEMA for review and was initially approved in September 2020. Individual Addendums are sent to State EMD as jurisdictions finalize their update process. Upon completion and pre-approval from the State and FEMA, jurisdictions governing body will then adopt their Addenda to this Plan. These adoptions can be found in Appendix A of their individual Addenda. The first Addenda was received and officially approved by FEMA on November 23, 2020. This then becomes the official date for the completion of the Plan. This plan will have to be re-adopted and re-approved prior to the five-year deadline of November 22, 2025.
PAGE ES-19 REGION 5 ALL HAZARD MITIGATION PLAN - 2020-2025 EDITION BASE PLAN
Though this plan is a product of the Disaster Mitigation Act of 2000, the Planning Team has researched and incorporated other planning standards based on the Homeland Security (HLS) requirements, the National Fire Protection Association (NFPA) 1600: National Preparedness Standard, and the Emergency Management Accreditation Program (EMAP). Region 5 is an extremely diverse community. It ranges in elevation from sea level to 14,410 feet. Some of the jurisdictions active in this planning process are totally surrounded by forests with limited access. Others are isolated on islands in the middle of Puget Sound. Some are urban, others rural. They range in size from a few hundred to nearly 200,000 people. Yet they all have a desire to improve the health and safety of the citizens that reside within their borders. The charge of these 76 plans is to assist citizens with that process. In essence, to help the jurisdictions protect their citizens from the hazards that threatens their homes, their livelihood, and themselves. As time has progressed the population of Region 5 has continued to expand and with this expansion comes an increase in vulnerability. The hazards are not going to go away, so it is time to learn from the past, evaluate options, and develop plans to mitigate the effects of the hazards. To do that requires foresight, imagination, and the will to overcome the obstacle of inertia. These 76 jurisdictions have continued to take steps in this process. They have had the foresight to develop their plans, keep them current and move forward, developing the foundation for a safer tomorrow.
PAGE ES-20 REGION 5 ALL HAZARD MITIGATION PLAN - 2020-2025 EDITION BASE PLAN
Section 1 Plan Process Requirements Planning Process---Requirement §201.6(b): An open public involvement process is essential to the development of an effective plan. Documentation of the Planning Process---Requirement §201.6(b): In order to develop a more comprehensive approach to reducing the effects of natural disasters, the planning process shall include: (1) An opportunity for the public to comment on the plan during the drafting stage and prior to plan approval;
(2) An opportunity for neighboring communities, local and regional agencies involved in hazard mitigation activities, and agencies that have the authority to regulate development, as well as businesses, academia and other private and non-profit interests to be involved in the planning process; and
(3) Review and incorporation, if appropriate, of existing plans, studies, reports, and technical information. Documentation of the Planning Process---Requirement §201.6(c)(1): [The plan shall document] the planning process used to develop the plan, including how it was prepared, who was involved in the process, and how the public was involved. •
Does the plan provide a narrative description of the process followed to prepare the new or updated plan?
•
Does the new or updated plan indicate who was involved in the current planning process? (Who led the development at the staff level and were there any external contributors such as contractors? Who participated on the plan committee, provided information, reviewed drafts, etc.?)
•
Does the new or updated plan indicate how the public was involved? (Was the public provided an opportunity to comment on the plan during the drafting stage and prior to the plan approval?)
•
Does the new or updated plan discuss the opportunity for neighboring communities, agencies, businesses, academia, nonprofits, and other interested parties to be involved in the planning process?
•
Does the planning process describe the review and incorporation, if appropriate, of existing plans, studies, reports, and technical information?
•
Does the updated plan document how the planning team reviewed and analyzed each section of the plan and whether each section was revised as part of the update process?
PAGE 1-1 REGION 5 ALL HAZARD MITIGATION PLAN – 2020-2025 EDITION BASE PLAN
SECTION 1 REGION 5 ALL HAZARD MITIGATION PLAN 2020-2025 EDITION PLAN PROCESS SECTION
Table of Contents PLAN PROCESS REQUIREMENTS ...................................................................... 1 TABLE OF CONTENTS ........................................................................................ 2 CHANGES TO JURISDICTION PLAN IN THIS DOCUMENT ................................ 4 CHANGE MATRIX .............................................................................................. 4 PLAN PROCESS ................................................................................................. 9 PUBLIC INVOLVEMENT PROCESS..............................................................................................................9 PLANNING TEAM ............................................................................................................................... 10 PLANNING TEAM MEMBERS.................................................................................................................. 10 REGIONAL PLANNING TEAM MEMBERS .................................................................................................... 16 PLANNING TEAM MEETINGS ................................................................................................................. 21 REGIONAL PLANNING TEAM MEETINGS ................................................................................................... 25 THREAT AND HAZARD IDENTIFICATION WORKSHOP ................................................................................... 34 ELECTED OFFICIAL’S MEETINGS ............................................................................................................ 41 FINAL ELECTED OFFICIAL’S MEETINGS ................................................................................................... 50 PUBLIC COMMENT ............................................................................................................................. 50
PROFILE PROCESS .......................................................................................... 51 SERVICES SUMMARY .......................................................................................................................... 51 GEO-POLITICAL SUMMARY .................................................................................................................. 52 POPULATION SUMMARY ...................................................................................................................... 52 INFRASTRUCTURE SUMMARY ................................................................................................................ 53 LAND USE MAPS ............................................................................................................................... 53 ECONOMIC SUMMARY......................................................................................................................... 53
CAPABILITY IDENTIFICATION PROCESS ....................................................... 53 PAGE 1-2 REGION 5 ALL HAZARD MITIGATION PLAN – 2020-2025 EDITION BASE PLAN
RISK ASSESSMENT PROCESS ......................................................................... 54 HAZARD IDENTIFICATION.................................................................................................................... 55 THE JURISDICTIONS .......................................................................................................................... 57 HAZUS-MH ..................................................................................................................................... 60
MITIGATION STRATEGY PROCESS ................................................................. 62 REGION 5 MITIGATION GOALS ............................................................................................................. 62 REGION 5 MITIGATION OBJECTIVES ...................................................................................................... 63 REGION 5 MITIGATION MEASURES: IDENTIFICATION AND EVALUATION .......................................................... 66 MITIGATION MEASURES: PRIORITIZATION............................................................................................... 68
INFRASTRUCTURE SUMMARY PROCESS ........................................................ 69 DEFINITION .................................................................................................................................... 69 IDENTIFICATION ............................................................................................................................... 70 PROFILE ......................................................................................................................................... 70 INFRASTRUCTURE SUMMARY ................................................................................................................ 71 INFRASTRUCTURE CATEGORY SUMMARY .................................................................................................. 71 INFRASTRUCTURE DEPENDENCY SUMMARY .............................................................................................. 71 INFRASTRUCTURE HAZARD SUMMARY ..................................................................................................... 71 DEPENDENCY ................................................................................................................................... 71 VULNERABILITY ASSESSMENT ............................................................................................................... 71
PLAN MAINTENANCE PROCESS ...................................................................... 72 ENDNOTES ...................................................................................................... 76
PAGE 1-3 REGION 5 ALL HAZARD MITIGATION PLAN – 2020-2025 EDITION BASE PLAN
Changes To Jurisdiction Plan in this Document The Base Plan for the Region 5 Hazard Mitigation Plan includes the following changes that are documented as a result of a complete review and update of the previous Base Plan. The purpose of the following change matrix is to advise the reader of these changes since updating this plan was approved in July 2015. Each of the 76 Addenda falling under this Base Plan has also produced a Change Matrix for their individual plans. The purpose for the changes is three-fold: 1) the Federal Law (Code of Federal Regulations (CFR), Title 44, Part 201.4) pertaining to Mitigation Planning has changed since the original Plan was undertaken; 2) the Local Mitigation Planning Requirements of the Disaster Mitigation Act of 2000 201.6 (d) (3) Plan Review states Plans must be reviewed, revised if appropriate, and resubmitted for approval within five years in order to continue to be eligible for HMGP project grant funding. This document when completed and approved will become the Base Plan for the Region 5 Hazard Mitigation Plan and the guiding document for 76 Addenda to the plan.
Change Matrix This Matrix of Changes documents the pertinent changes made from the July 2015 Base Plan for the Region 5 All Hazard Mitigation Plan; 2020-2025 Update. Most of the changes are a matter of additional detail, more information provided and some reformatting to the current Pierce County DEM format. This 2020 version represents a complete review and update by Pierce County Department of Emergency Management using a detailed process for development and following an established format. All 76 Addenda under this Base Plan have also used this procedure in reviewing and updating their plans. During this procedure, all web links have been verified and updated. Table 1-1 Change Matrix – Region 5 All Hazard Mitigation Plan 2020 – 2025 Edition Section 1 – Plan Development, Base Plan Process Section Section or Part of Plan
New in 2020 Plan
Section 1 – Process Section
Section 1 – Process Section The original Region 5 Hazard Mitigation Plan contained a Base Plan and 48 Addenda for the 48 jurisdictions. The following update (20152020) brought together the original 48 Addenda, Phase II, III, Unincorporated Pierce County and Health and Medical Addenda’s one Base Plan document increasing the addenda to 76. This rewrite (2020-2025) includes the above with the addition of three new plans (Parkland Light & Water Co., Peninsula Light Co., and the Tacoma Pierce County Health Department) and two existing city plans (City of University Place and the City of Puyallup) joining the other Addenda
PAGE 1-4 REGION 5 ALL HAZARD MITIGATION PLAN – 2020-2025 EDITION BASE PLAN
under the Region 5 All Hazard Mitigation Plan. Our Addenda at 76 remains with 5 jurisdictions opting to not update their plans (Herron Island, Raft Island, Madigan Hospital, Dynamic Partners and the American Red Cross). The 2020 Process Section contains this Change Matrix Table in this Base Plan and in all Addenda.
Section 2 – Base Plan Profile Section or Part of Plan
Section 2 – Profile
Previous
2020 Plan
The 2020 version of the Profile has been reviewed and updated. The Infrastructure Summary section was updated showing a significant increase in tax parcel values. In addition, the Economic Summary was updated also showing an increase. The current review and update The 2010 Census Data of all addenda have used the remained for population data 2010 Census data. and is the current GIS available information from Pierce County. Once the 2020 Census data becomes available in Pierce County GIS format, population data figures will be updated in the Profile Section 2 and the Risk Assessment Section 4. A new Demographic Analysis paragraph was added to the 2020 Mitigation Plan to elaborate on jurisdiction’s demographics in more detail and capturing some of the atrisk populations. This also allowed jurisdictions to provide an updated overview of their growing populations
PAGE 1-5 REGION 5 ALL HAZARD MITIGATION PLAN – 2020-2025 EDITION BASE PLAN
beyond the 2010 census which is outdated. This 2020 version incorporates the Profile Section of the Hazard Identification Risk Assessment (HIRA) into the HMP Profile incorporating a strong demographic profile. This also provides for consistency between the two documents.
Section 3 – Base Plan Capability Identification Section or Part of Plan
Previous
2020 Plan
Section 3 – Capability
The Capability Section of the previous Base Plan explained how we developed the individual jurisdiction capabilities in the original documents.
This section was reviewed along with the website links to make sure they were still viable or current versions.
Section 4 – Vulnerability, Risk Analysis Section or Part of Plan
2020 Plan
Vulnerability and Hazard Impact Analysis
This section was added to the jurisdictional Addenda’s to provide a better understanding on how the identified hazards affect the jurisdiction’s and their critical infrastructure. It gives context to the maps and charts identifying the hazard risk.
Changes in Development
This required element was added to the jurisdictional Addenda’s to provide a clearer understanding and location within the plan of the changes in development that have occurred within their jurisdiction’s over the past five years.
Disaster Declarations Charts.
The Geological, Meteorological and Technological Charts have been updated to reflect current changes in Pierce County’s Hazard Identification Risk Assessment
PAGE 1-6 REGION 5 ALL HAZARD MITIGATION PLAN – 2020-2025 EDITION BASE PLAN
(HIRA). Major changes include updating the maps, figures and table column to align with the changes in the HIRA. Technological Hazards added “Active Threat” and “Cyber Attack” under the Terrorism category. Hazard Identification Risk Assessment
Many hazards were updated with the Hazard Workshop held in May 2019 in Section 4. The biggest change to the HIRA was the complete rewrite of the Flood Section by Pierce County Surface Water Management Division. This now provides an in-depth profile of each prominent river system in Pierce County and will be invaluable as a planning tool.
Hazard Maps - Overview of Data Source Descriptions
This section was added to provide the reader with a better understanding of the data source that was used to produce the hazard maps.
The previous version of the plan contained hazard maps.
The 2020 Risk Section includes updated maps and contains additional hazard maps such as deep/shallow landslides susceptibility, and liquefaction potential.
The previous version included specific analysis showing vulnerability of population, land and infrastructure according to Census 2010 and 2013/2014 tax parcel data.
The 2020 Risk Section includes completely updated tables showing vulnerability of population, (where different hazard maps were used) land and infrastructure using Census 2010 data and 2019/2020 tax parcel data.
Section 5 – Base Plan Mitigation Strategy Section or Part of Plan
2020 Plan
The previous document used the standard goals as outlined for the entire project.
The 2020 Mitigation Section was drafted using specific goals and objectives written or updated by the jurisdictions to their specific hazards and concerns.
The previous document contained a Mitigation Measure Matrix chart followed by written descriptions of each individual measure.
The new document uses the same format as the original plan with the addition of a ‘Status Update” table under each mitigation measure. This provides the opportunity to update each mitigation strategy and track the status. New measures have been added to both the Matrix and the individual measure descriptions. Measures completed in the past five years
PAGE 1-7 REGION 5 ALL HAZARD MITIGATION PLAN – 2020-2025 EDITION BASE PLAN
have been moved to a historical appendix in the plan to track projects completed by the jurisdiction.
Section 6 – Base Plan Infrastructure Section or Part of Plan
2020 Plan
The previous plan described the process used to develop the Infrastructure Sections for each of the 76 Addenda under the Base Plan.
The updated Base Plan gives a thorough description of how each Infrastructure Section was developed for each of the 76 Addenda under the Region 5 Hazard Mitigation Plan. This 2020 plan uses the same table. The tables have been reviewed and updated by the jurisdiction. This section is only available to the jurisdiction due to the sensitivity of information contained. A disclosure statement acts as a placeholder for their Section 6.
Section 7 – Base Plan Maintenance Section or Part of Plan
2020 Plan
The original Plan Maintenance for the Base Plan has a complete explanation of the Plan Adoption Process, the Maintenance Strategy and Continued Public Involvement.
The updated 2020 version of the Plan Maintenance Section for the Base Plan borrows from the format and content of the original; however, the entire section has been reviewed and updated to current information.
Section 8 – Other Changes Section or Part of Plan
2020 Plan
The previous document contained four Appendices.
The 2020 Plan contains in some jurisdictional plans, six Appendices including: place for the final resolution and approval letter from FEMA, list of jurisdiction’s planning team, a chart for any changes, 2014 HAZUS analysis, documentation records for Public Outreach events and a historical appendix for completed projects. The Acronym list appears in the Base Plan.
PAGE 1-8 REGION 5 ALL HAZARD MITIGATION PLAN – 2020-2025 EDITION BASE PLAN
Plan Process The Region 5 Hazard Mitigation Plan Process Section is a discussion of the planning process used to update the Region 5 Hazard Mitigation Plan (Pierce County is Homeland Security (HLS) Region 5 in Washington State). This includes how the process was prepared, who aided in the process, and the public’s involvement. The Plan update is developed around all major components identified in 44 CFR 201.6, including: • Public Involvement Process; • Jurisdiction Profile; • Capability Identification; • Risk Assessment; • Mitigation Strategy; • Infrastructure Section; and, • Plan Maintenance Procedure. Below is a summary of those elements and the processes involved in their development.
Public Involvement Process Public participation is a key component to strategic planning processes. Citizen participation offers citizens the chance to voice their ideas, interests, and opinions. “Involving stakeholders who are not part of the core team in all stages of the process will introduce the planning team to different points of view about the needs of the community. It will also provide opportunities to educate the public about hazard mitigation, the planning process, and findings, and could be used to generate support for the mitigation plan.”i In order to accomplish this goal and to ensure that the updated Region 5 Hazard Mitigation Plan be comprehensive, the seven planning groups in conjunction with Pierce County Department of Emergency Management developed a public participation process of three components: 1. A Planning Team comprised of knowledgeable individual representatives of HLS Region 5 area and its hazards; 2. Hazard Meetings to target the specialized knowledge of individuals working with populations or areas at risk from all hazards; and 3. Public meetings to identify common concerns and ideas regarding hazard mitigation and to discuss specific goals, objectives and measures of the mitigation plan. This section discusses each of these components in further detail below with public participation outlined in each. Integrating public participation into the development of the Region 5 Hazard Mitigation Plan update has helped to ensure an accurate depiction of the Region’s risks, vulnerabilities, and mitigation priorities.
PAGE 1-9 REGION 5 ALL HAZARD MITIGATION PLAN – 2020-2025 EDITION BASE PLAN
Planning Team The Planning Team was organized early in 2019. The individual Region 5 Hazards Mitigation Planning Team members understand the portion of Pierce County containing their specific jurisdiction, including how residents, businesses, infrastructure, and the environment may be affected by all hazard events. The members are experienced in past and present mitigation activities and represent those entities through which many of the mitigation measures would be implemented. The Planning Team guided the update of the Plan, assisted in reviewing and updating goals and measures, identified stakeholders, and shared local expertise to create a more comprehensive plan. The Planning Team was organized into six planning groups of like jurisdictions, plus the Pierce County Government, for a portion of the update. the overall process. These groups are: City and Town Group
School Group
Fire District Group
Utility Group
Special Purpose Group
Health and Medical Group
Unincorporated Pierce County
The majority of the meetings were held in regional groups with the county broken into five geographical areas. These geographical areas share in the same commonality of hazards and allowed for relationship building amongst the different jurisdictions during the overall process. For this update the Unincorporated Pierce County group stayed within their group and did not participate in the regional groups. As we move forward beyond this update different departments within the Unincorporated Pierce County group will meet with regional groups where there is a commonality in mitigation strategies, objectives and goals. This collaborative planning will allow integrations of ideas and potential future projects to have shared funding costs. These groups are: North Group
Northeast Group (NE)
West Group
Central Group
Southwest Group (SW) Tables 1-1 through 1-12 identify the Planning Teams by listing the various members and the jurisdictions or departments they represent. Coordinating each of the groups from Pierce County Department of Emergency Management were Debbie Bailey, Program Coordinator and, Wyatt Godfrey, Program Coordinator. Tables 1-13 through 1-24 document the Planning Team meetings.
Planning Team Members Table 1-2 Planning Team – City and Town Group
NAME
TITLE
JURISDICTION
Woody Edvalson
Emergency Manager
City of Bonney Lake
Alan Predmore
Fire Chief/Emergency Manager
City of Buckley
PAGE 1-10 REGION 5 ALL HAZARD MITIGATION PLAN – 2020-2025 EDITION BASE PLAN
Jeffrey Wilson
Director of Community Development
City of DuPont
Micah Lundborg
Chief of Police
City of Edgewood
Pete Fisher
Police Chief
City of Fife
Robert Eugley
Patrol Officer
City of Fife
John Cheesman
Chief of Police
City of Fircrest
Kelly Busey
Chief of Police
City of Gig Harbor
Carl Desimas
City Planner
City of Gig Harbor
John Unfred
Assistant Police Chief
City of Lakewood
Christine Badger
Emergency Management Coordinator
City of Lakewood
Tony Hernandez
Police Chief
City of Milton
Mark Bethune
City Manager
City of Orting
Kirstin Hofmann
Emergency Manager
City of Puyallup
Chief Armitage
Police Chief
City of Roy
Officer Armitage
Police Officer
City of Roy
Ryan Windish
Community Development Director
City of Sumner
Ute Scofield
Emergency Manager
City of Tacoma
Jacob Rain
EM Program Coordinator
City of Tacoma
Lisa Petorak
Human Resources Manager
City of University Place
Jack Ecklund
Dir. of Engineering & Capital Projects
City of University Place
Daillene Argo
Clerk-Treasurer
Town of Carbonado
Abby Gribi
Town Administrator
Town of Eatonville
Glen Yates
Eatonville Police Department
Town of Eatonville
Emily Terrell
Consultant
Town of South Prairie
Paul Loveless
Town Administrator
Town of Steilacoom
Alan Predmore
Fire Chief
Town of Wilkeson
Table 1-3 Planning Teams – Fire Group
NAME
TITLE
JURISDICTION
Stan Gacioch
Battalion Chief
Central Pierce Fire & Rescue - District#16
Alan Predmore
Fire Chief
City of Buckley Fire
PAGE 1-11 REGION 5 ALL HAZARD MITIGATION PLAN – 2020-2025 EDITION BASE PLAN
Jim Jaques
Assistant Fire Chief
East Pierce Fire & Rescue – District #22
Eric Watson
Assistant Fire Chief
Gig Harbor Fire & Medic One - District #5
Steve Nixon
Assistant Fire Chief
Gig Harbor Fire & Medic One - District #5
Tony Judd
Retired Deputy Fire Chief
Graham Fire and Rescue - District #21
Todd Jensen
Battalion Chief
Graham Fire and Rescue - District #21
Dustin Morrow
Fire Chief
Key Peninsula Fire - District #16
Chuck West
Battalion Chief
Key Peninsula Fire – District #16
Jim Wassall
Fire Chief
Browns Point Dash Point Fire - District #13
Zane Gibson
Fire Chief
Orting Valley Fire & Rescue - District #18
Matt Medford
Fire Chief
Ashford Elbe Fire - District - #23
Jim Bixler
Fire Chief
Anderson Island Fire District - #27
Kira Thirkield
Fire Chief
Riverside Fire and Rescue - District#14
Lloyd Galey
Fire Chief
South Pierce Fire and Rescue – District #17
Hallie McCurdy
Assistant Chief of Prevention
West Pierce Fire and Rescue -District #3
Christine Badger
Emergency Management Coordinator
West Pierce Fire and Rescue - District#3
Table 1-4 Planning Teams – School Group
NAME
TITLE
JURISDICTION-DEPARTMENT
Scott Hubbard
Superintendent (retired during update)
Carbonado School District
Jessie Sprouse
Superintendent
Carbonado School District
Randy Granum
Safety and Security Manager
Clover Park School District
Kirsten Parker
Director of Human Resources
Dieringer School District
Clay Jamerson
Manager of Transportation
Eatonville School District
John Fisher
Facilities Manager
Eatonville School District
Ben Ramirez
Deputy Superintendent
Fife School District
PAGE 1-12 REGION 5 ALL HAZARD MITIGATION PLAN – 2020-2025 EDITION BASE PLAN
Katie Gillespie
Safety, Security/EM Supervisor
Franklin Pierce School District
Chris Willis
Executive Director for Student Support Services
Orting School District
Holly Mortenson
Payroll Specialist & Operations Support Assistant
Orting School District
Shawn Thompson
Environmental Health & Safety Officer
Pacific Lutheran University
Patrick Gillespie
Director of Facilities
Peninsula School District
Sara Hoover
Risk and Compliance Manager
Peninsula School District
Brian Devereux
Director of Facilities Planning
Puyallup School District
Susanne Beauchaine Executive Director of Human Resources and Safety
Steilacoom School District No. 1
Cheryl Collins
Risk Manager / Purchasing
Sumner-Bonney Lake School District
Bill Gaines
Assistant Superintendent Operations & community Engagement
Sumner-Bonney Lake School District
Mike Rupert
Director of Safety/Security
Tacoma Public Schools
Jeff Rogers
Environmental Health/Safety
Tacoma Public Schools
Torey Heidelberg
Emergency Preparedness/Safety Coordinator
University Place School District
Michelle Bradshaw
Intervention Specialist
White River School District
Table 1-5 Planning Teams – Special Purpose Group
NAME
TITLE
JURISDICTION-DEPARTMENT
Curt Simonson
President
Crystal River Ranch Association
Gary Castell
President
Crystal Village Homeowners Association
Erwin Vidallon
Chief Financial Officer
Metropolitan Park District of Tacoma
Paul Weed
Chief Admin Officer
Metropolitan Park District of Tacoma
Jason Harms
Sergeant Pierce County Sheriff’s Pierce Transit Department PAGE 1-13 REGION 5 ALL HAZARD MITIGATION PLAN – 2020-2025 EDITION BASE PLAN
Alisha Peña
Senior Planner
Port of Tacoma
Deidre Wilson
Planning Manager
Port of Tacoma
John Cammon
Maintenance Superintendent
Riviera Community Club
Don Tjossem
President HOA
Taylor Bay Beach Club
Table 1-6 Planning Teams – Utility Group
NAME
TITLE
JURISDICTION
Robert Popek
Board Member
Clear Lake Water District
Steve Sacksteder
Water Quality
Firgrove Mutual Water Co.
Ben Ames
Cross Connection Specialist
Fruitland Mutual Water Co.
Nick Nelson
General Manager
Graham Hill Mutual Water Co.
John DeVore
General Manager
Lakeview Light & Power
Don Stanley
Operations Dept. Head
Lakewood Water District
Mike Craig
General Manager
Mt. View – Edgewood Water Co.
Hannah Reece
Member Services
Ohop Mutual Light
Dale Budzinski
Water Superintendent
Parkland Light & Water Co.
Dale Butcher
Electric Superintendent
Parkland Light & Water Co.
Susan Cutrell
General Manager
Parkland Light & Water Co.
Amy Grice
System Engineering Manager
Peninsula Light Co.
Jeff Johnson
General Manager
Spanaway Water Co.
Darryl Scott
Manager
Summit Water and Supply Company
Dave Troupe
Draftsman/I.T. Technician
Summit Water and Supply Company
Lora Scott
Water Quality Administrator
Summit Water Co.
Sean Vance
Manager
Valley Water District
Table 1-7 Planning Teams – Health and Medical Group
NAME
TITLE
JURISDICTION-DEPARTMENT
PAGE 1-14 REGION 5 ALL HAZARD MITIGATION PLAN – 2020-2025 EDITION BASE PLAN
Keith Warner
Assistant Director
Cascade Regional Blood Services
James Oliver
Assistant Quality Improvement Manager
Community Health Care
Eileen Newton
Director Disaster Coordinator
Franciscan Health System
Jacob Hausdorf
Emergency Management Specialist Franciscan Health System
Alex Truchot
Sr. Environmental Health and Safety Kaiser Permanente Manager
Johanna Hanson
Emergency Management Specialist Kaiser Permanente
Heidi Rock
Program Manager
MultiCare Health System
Linda Horey
Emergency Management Program Specialist
Western State Hospital
Table 1-8 Planning Groups – Unincorporated Pierce County Government
NAME
TITLE
JURISDICTION-DEPARTMENT
Cindy Hartman
Deputy Auditor
Auditor’s Office
Debbie Bailey
Program Coordinator
DEM Mitigation & Recovery
Wyatt Godfrey
Program Coordinator
DEM Mitigation & Recovery
Chelsey Bell
Program Coordinator
DEM Mitigation & Recovery
Todd Kilpatrick
Program Coordinator
DEM Mitigation & Recovery
Rob Allen
Sr. Economic Development Specialist
PC Economic Development
Bob Carr
Facilities Maintenance & Operations Facilities Maintenance and Ops Division Manager
Warner Webb
Fire Marshal
DEM Fire Prevention Bureau
Brandy Riche
IT Manager – Spatial Services
Finance – Information Technology
Paulina Kura
Special Advisor to the Director
Human Services
Kyle Wintermute
Parks & Recreation Manager
Parks and Recreation Services
Randy Rogers
Airport and Ferry Division
Planning and Public WorksAirports/Ferry
PAGE 1-15 REGION 5 ALL HAZARD MITIGATION PLAN – 2020-2025 EDITION BASE PLAN
Dan Cardwell
Long Range Planning Manager
Planning and Public Works – Planning Division
Jen Lambrick
Assistant Planner / Long Range Planning
Planning and Public Works – Planning Division
Tyler Bemis
Maintenance Program Manger
Planning and Public Works-Maintenance
Callene Abernathy
Planner
Planning and Public Works-Sewer
Katherine Brooks
Senior Planning Manager
Planning and Public Works-Sewer/Water
Gloria Van Spanckeren
Emergency Program Planner
Anne-Marie Marshall-Dody
Floodplain & Watershed Services Manager
Planning and Public Works SWM
Brynne Walker
Floodplain Planner
Planning and Public Works SWM
Dennis Dixon
Floodplain Engineer
Planning and Public Works SWM
Helmut Schmidt
Floodplain Services Supervisor
Planning & Public Works - SWM
Johnny Mauger
Asset Management Specialist 3
Planning & Public Works - SWM
Dawn Borgeson, PMP
Program Manager
Planning & Public Works – Transportation Division
Clint Ritter
Civil Engineer
Planning & Public Works – Transportation Division
Kirk Stenger
Risk Manager
PC Risk Management
Mary Beth DiCarlo
Risk Manager
PC Risk Management
Peter Cropp
Lieutenant
Sheriff’s Department
Planning and Public Works
Regional Planning Team Members Table 1-9 Planning Teams – North Group
NAME
TITLE
JURISDICTION-DEPARTMENT
Micah Lundborg
Police Chief
City of Edgewood
Pete Fisher
Police Chief
City of Fife
Robert Eugley
Patrol Officer
City of Fife
PAGE 1-16 REGION 5 ALL HAZARD MITIGATION PLAN – 2020-2025 EDITION BASE PLAN
John Cheesman
Police Chief
City of Fircrest
Tony Hernandez
Police Chief
City of Milton
Ute Scofield
EM Program Manager
City of Tacoma
Jacob Rain
EM Program Coordinator
City of Tacoma
Jim Wassall
Fire Chief
Pierce County Fire District #13
Jim Jaques
Assistant Fire Chief
East Pierce Fire & Rescue
Kira Thirkield
Fire Chief
Riverside Fire & Rescue #14
Mike Rupert
Director of Safety/Security
Tacoma School District
Jeff Rogers
Environmental Health/Safety
Tacoma School District
Bart Stepp
General Manager
Mt. View-Edgewood Water Co
Jim Oliver
Assistant Quality Improvement Community Health Care Manager
Eileen Newton
Emergency Manager
Franciscan Health System
Heidi Rock
Emergency Management Program Manager
MultiCare Health System
Alex Truchot
Sr. HSE Manager
Kaiser Permanente
Johanna Hanson
Emergency Management Specialist
Kaiser Permanente
Alisha Peña
Senior Planner
Port of Tacoma – NW Seaport Alliance
Marty Kapsh
Port of Tacoma Patrol Officer
Port of Tacoma
Deirdre Wilson, AICP
Planning Manager
Port of Tacoma
Table 1-10 Planning Teams – NE Group
NAME
TITLE
JURISDICTION-DEPARTMENT
Woody Edvalson
Director/EM Coordinator
City of Bonney Lake
Alan Predmore
Fire Chief/EM Director
City of Buckley ~ Town of Wilkeson ~ Town of Carbonado
Daillene Argo
Town Clerk-Treasurer
Town of Carbonado
PAGE 1-17 REGION 5 ALL HAZARD MITIGATION PLAN – 2020-2025 EDITION BASE PLAN
Mark Bethune
City Administrator
City of Orting
Emily Terrell
Contracted Planner
Town of South Prairie
Ryan Windish
Community Development Director
City of Sumner
Trisha Sumners
Town Clerk-Treasurer
Town of Wilkeson
Jim Jaques
Fire Chief, Asst.
East Pierce Fire & Rescue
Zane Gibson
Fire Chief
Orting Valley Fire
Scott Hubbard
Superintendent
Carbonado Historical School District #19
Jessie Sprouse
Principal/Superintendent
Carbonado Historical School District #19
Kirsten Parker
Director of Human Resources
Dieringer School District
Chris Willis
Executive Director of Student Support Services
Orting School District
Holly Mortenson
Payroll Specialist & Ops Support Asst.
Orting School District
Cheryl Collins
Risk Manager
Sumner-Bonney Lake School District
Michelle Bradshaw
Intervention Specialist
White River School District
Jer Argo
Director of Business and Operations
White River School District
James Oliver
Assistant Director of Operations Community Health Care
Curt Simonson
HOA President
Crystal River Ranch Association
Gary Castell
HOA Resident
Crystal Village Homeowners Assoc.
PAGE 1-18 REGION 5 ALL HAZARD MITIGATION PLAN – 2020-2025 EDITION BASE PLAN
Table 1-11 Planning Teams – West Group
NAME
TITLE
JURISDICTION-DEPARTMENT
Kelly Busey
Police Chief
City of Gig Harbor/Police Department
Steve Nixon
Assistant Fire Chief
Gig Harbor Fire & Medic One - District #5
Eric Watson
Assistant Fire Chief
Gig Harbor Fire & Medic One - District #5
Dustin Morrow
Fire Chief
Key Peninsula Fire - District #16
Chuck West
Battalion Chief
Key Peninsula Fire – District #16
Amy Grice
System Engineering Manager
Peninsula Light Co.
Patrick Gillespie
Director of Facilities
Peninsula School District
Sara Hoover
Risk and Compliance Manager
Peninsula School District
Don Tjossem
President HOA
Taylor Bay Beach Club
Table 1-12 Planning Teams – SW Group
NAME
TITLE
JURISDICTION-DEPARTMENT
Jeffrey S. Wilson
Director Community Development
City of DuPont
John Unfred
Emergency Deputy Director
City of Lakewood
Christine Badger
Emergency Manger
City of Lakewood
Paul Loveless
Town Administrator
Town of Steilacoom
John Ecklund
Director of Engineering
City of University Place
Lisa Petorak
HR Manager
City of University Place
Hallie McCurdy
Assistant Chief of Prevention
West Pierce Fire and Rescue -District #3
Christine Badger
Emergency Manger
West Pierce Fire & Rescue #3
Randy Granum
Risk Manager
Clover Park School District
Susanne Beauchaine Executive Director for Human Resources
Steilacoom Historical School District
Torey Heidelberg
University Place School District
Preparedness/Safety Cor.
PAGE 1-19 REGION 5 ALL HAZARD MITIGATION PLAN – 2020-2025 EDITION BASE PLAN
Don Stanley
Operations Department Head
Lakewood Water District
Linda Horey
Emergency Management Program Specialist
Western State Hospital
John Cammon
Maintenance Superintendent
Riviera Community Club
Sgt Jason Harms
Pierce Transit Police
Pierce Transit
Table 1-13 Planning Teams – Central Group
NAME
TITLE
JURISDICTION-DEPARTMENT
Abby Gribi
Town Administrator
Town of Eatonville
Kirstin Hofmann
Emergency Manager
City of Puyallup
Officer Armitage
Police Chief
City of Roy
Debbie Derringer
Clerk, Treasurer
City of Roy
Matt Medford
Fire Chief
Pierce County Fire District #23
Stan Gacioch
Battalion Chief
Central Pierce Fire District #6
Tony Judd
Fire Chief
Graham Fire District #21
Lloyd Galey
Fire Chief
South Pierce Fire District #17
Clay Jamerson
Manager of Transportation
Eatonville School District
John Fisher
Facilities Manager
Eatonville School District
Katie Gillespie
Safety, Security/EM Sup
Franklin Pierce School District
Shawn Thompson
Environmental Health & Safety Pacific Lutheran University Officer
Brian Devereux
Director of Facilities Planning
Puyallup School District
Robert Popek
Board Member
Clear Lake Water District
Larry Jones
General Manager
Firgrove Mutual Water Company
Steve Sacksteder
Water Quality
Firgrove Mutual Water Company
Ben Ames
Cross Connection Specialist
Fruitland Mutual Water Company
Ted Hardiman
General Manager
Fruitland Mutual Water Company
PAGE 1-20 REGION 5 ALL HAZARD MITIGATION PLAN – 2020-2025 EDITION BASE PLAN
Nick Nelson
General Manager
Graham Hill Mutual Water Co.
Joel Hansen
Operations Supervisor
Ohop Mutual Light
Hannah Reece
Member Services
Ohop Mutual Light
Jeff Johnson
General Manager
Spanaway Water Company
Sean Vance
Manager
Valley Water District
Each jurisdiction was tasked with identifying representatives for the planning team and holds the responsibility for documenting the elements of the planning process for their jurisdiction.
Planning Team Meetings The Planning Team held 7 Planning Team Meetings either in their Discipline Groups or Regional Planning Groups. Meeting in Regional Planning Groups supported a whole community planning approach which either developed new or stronger relationships amongst jurisdictions. This allowed for an integration of mitigation strategies for regions sharing the commonality in hazards. There was a total of 45 meetings from February 2019 to January 2020 between all Planning Groups. Additional working group drop-in workshops were provided for jurisdictions to continue to work on and update their plans. Two “drop-in” workshops were provided each month from January through June alternating between morning and afternoons to accommodate work schedules. The Planning Teams Discipline Groups: City and Town Group, Fire Group, School Group, Special Purpose Group, Utility Group, Medical Group and Unincorporated Pierce County Group. These discipline groups will continue to meet on an annual basis for the relationship building and sharing of mitigation strategies and ideas. The Planning Team Regional Groups broken down into five geographical areas in Pierce County: West Group (all of Gig Harbor, Key Peninsula, Herron Island, Fox Island and Raft Island), SW Group (Lakewood, Anderson Island, Steilacoom), Central Group (Puyallup, Graham, Eatonville), NE Group (Buckley, Carbonado, Bonney Lake, Wilkeson), North Group ( Tacoma, Fife, Edgewood, Sumner). The Regional Groups were developed based on geographic location and the commonality of hazards shared and was new with this update. This provided for better community planning, relationship building, and collaboration of mitigation strategies ultimately leading to community resiliency. These Regional groups will continue to meet on an annual basis and as sub committees are developed to work on specific projects the frequency of meetings will potentially increase. In addition to group planning team meetings and drop-in meetings there were numerous one on one meetings that occurred for jurisdictions. This 2020-2025 update brought many new representatives responsible for the update with little prior knowledge of their mitigation plan. They were overwhelmed by the update and the one on one meetings allowed for a personal explanation of their plan and the process to update it and answer specific questions. The Fire District group had about a 70% turn over in leadership alone. Looking forward it will be important to keep jurisdictions involved and connected with their mitigation plans as turnover occurs. PAGE 1-21 REGION 5 ALL HAZARD MITIGATION PLAN – 2020-2025 EDITION BASE PLAN
Table 1-14 Planning Team Meetings – Cities and Towns Group
Planning Team Meeting #1 – Cities & Towns: PCEM Puyallup Room – February 21, 2019 Planning Team members Debbie Bailey and Wyatt Godfrey conducted the meeting and the Planning Team discussed the following items: Introduction of Planning Team, Review of the history of the Grant Application, Defining the Planning Requirements, How We Establish the In-Kind Match, Benefits of Developing a Plan, Defining the Planning Process, Establishing the Planning Team Meetings, Elected Official Meetings and Public Comment Meetings, reviewing each jurisdiction’s profile information, and defining next steps. Table 1-15 Planning Team Meetings – Fire Group
Planning Team Meeting #1 – Fire: PCEM Puyallup Room – February 21, 2019 Planning Team members Debbie Bailey and Bailee Godfrey conducted the meeting and the Planning Team discussed the following items: Introduction of Planning Team, Review of the history of the Grant Application, Defining the Planning Requirements, How We Establish the In-Kind Match, Benefits of Developing a Plan, Defining the Planning Process, Establishing the Planning Team Meetings, Elected Official Meetings and Public Comment Meetings, reviewing each jurisdiction’s profile information, and defining next steps
Table 1-16 Planning Team Meetings – School Group
Planning Team Meeting #1 - School Districts: PCEM Puyallup Room – February 22, 2019 Planning Team members Debbie Bailey and Wyatt Godfrey conducted the meeting and the Planning Team discussed the following items: Introduction of Planning Team, Review of the history of the Grant Application, Defining the Planning Requirements, How We Establish the In-Kind Match, Benefits of Developing a Plan, Defining the Planning Process, Establishing the Planning Team Meetings, Elected Official Meetings and Public Comment Meetings, reviewing each jurisdiction’s profile information, and defining next steps. Table 1-17 Planning Team Meetings – Special Purpose District Group
Planning Team Meeting #1 – Special Purpose: PCEM Puyallup Room – February 28, 2019
Planning Team members Debbie Bailey and Bailee Godfrey conducted the meeting and the Planning Team discussed the following items: Introduction of Planning Team, Review of the history of the Grant Application, Defining the Planning Requirements, How We Establish the In-Kind Match, Benefits of Developing a Plan, Defining the Planning Process, Establishing the Planning Team Meetings, Elected Official Meetings and Public Comment Meetings, reviewing each jurisdiction’s profile information, and defining next steps. Table 1-18 Planning Team Meetings – Utility Group
Planning Team Meeting #1 – Utilities: PCEM Puyallup Room – February 27, 2019
PAGE 1-22 REGION 5 ALL HAZARD MITIGATION PLAN – 2020-2025 EDITION BASE PLAN
Planning Team members Debbie Bailey and Bailee Godfrey conducted the meeting and the Planning Team discussed the following items: Introduction of Planning Team, Review of the history of the Grant Application, Defining the Planning Requirements, How We Establish the In-Kind Match, Benefits of Developing a Plan, Defining the Planning Process, Establishing the Planning Team Meetings, Elected Official Meetings and Public Comment Meetings, reviewing each jurisdiction’s profile information, and defining next steps. Planning Team Meeting #2 – Pierce County Emergency Operations Center-April 19, 2012 Table 1-19 Planning Team Meetings – Health and Medical Group Planning Team Meeting #1 – Medical: PCEM Puyallup Room – February 20, 2019 Planning Team members Debbie Bailey and Bailee Godfrey conducted the meeting and the Planning Team discussed the following items: Introduction of Planning Team, Review of the history of the Grant Application, Defining the Planning Requirements, How We Establish the In-Kind Match, Benefits of Developing a Plan, Defining the Planning Process, Establishing the Planning Team Meetings, Elected Official Meetings and Public Comment Meetings, reviewing each jurisdiction’s profile information, and defining next steps. Table 1-20 Planning Team Meetings – Unincorporated Pierce County Government Group Planning Team Meeting #1 - Pierce County Emergency Operations Center: Puyallup RoomMarch 5, 2019 Planning Team members Debbie Bailey and Wyatt Godfrey conducted the meeting and the Planning Team discussed the following items: Introduction of Planning Team, Review of the history of the Grant Application, Defining the Planning Requirements, How We Establish the In-Kind Match, Benefits of Developing a Plan, Defining the Planning Process, Establishing the Planning Team Meetings, Elected Official Meetings and Public Comment Meetings, reviewing each jurisdiction’s profile information, and defining next steps. Planning Team Meeting #2 – Pierce County Emergency Operations Center: Puyallup Room – April 2, 2019 Planning Team members Debbie Bailey and Wyatt Godfrey conducted the meeting and the Planning Team discussed the following items: Introduction of Planning Team as this was our first Regional Planning meeting and there were new members present. We reviewed items presented at the previous meeting, Defining the Planning Requirements, Defining the Process, Establishing the Planning Team Meetings, Elected Official Meetings and Public Comment Meetings, and explaining the next steps. This meeting focused on continuing review of the Profile Section, an introduction to begin thinking about mitigation strategies to include a review of what measures from their original plan have already been completed and thinking about new measures they may like to add. In addition, this group discussed the Capability Section and how to recognize capabilities that already exist within the jurisdiction. Everyone was reminded to set up their Elected Official meetings. Everyone was given a copy of their original Section 3 – Capability Section
PAGE 1-23 REGION 5 ALL HAZARD MITIGATION PLAN – 2020-2025 EDITION BASE PLAN
There was not a Regional Planning Meeting in April of 2019 Planning Team Meeting #3 – Tacoma Mall Plaza Conference Room 2nd Floor – June 11, 2019 Planning Team members Debbie Bailey and Wyatt Godfrey conducted the meeting with the majority of the regional jurisdictions present. We reviewed the Profile, Capabilities, and Mitigation Strategy Sections, along with introducing the Risk Assessment Section to the group. We also talked about progress made on the In-Kind Match sheets and pre-authorization approval from jurisdictions’ governing bodies. Finally, we gathered feedback about our Threat and Hazard Identification Workshop held on May 1-2, and everyone’s progress with outreach events for their mitigation plans, especially in relation to fire season starting and the opportunity for communities in this region to incorporate more fire protection and mitigation elements into their planning process. There was not a Regional Planning Meeting in June of 2019 Planning Team Meeting #4 – Tacoma Mall Plaza -Conference Room 2nd Floor – July 9, 2019 Planning Team members Debbie Bailey and Wyatt Godfrey reviewed the Profile, Capabilities, Risk Assessment, and Mitigation Strategy Sections to see how everyone was coming along with their update process. A reminder was provided for those who had not turned in their in-kind match sheet, as well as for those who had not completed the governing body pre-approval requirement yet. Debbie offered to create jurisdictional maps for public outreach events to bring residents in to talk about hazards that can affect them and how the mitigation plan plays a role in community resilience. Lastly, Todd Kilpatrick, the former Mitigation Grant Program Manager with Washington State Emergency Management Division who now works at Pierce County Emergency Management, spoke to the group about the Hazard Mitigation Grant Program (HMGP), the Pre-Disaster Mitigation Grant (PDM), potential projects that are eligible for those grants, and the upcoming Mitigation Grant Workshop that’ll be held on August 12th and 19th. There was not a Regional Planning Meeting in August of 2019 Planning Team Meeting #5 – Tacoma Mall Plaza – Conference Room 2nd Floor September 10, 2019 Planning Team members Debbie Bailey and Wyatt Godfrey reviewed the Profile, Capabilities, Risk Assessment, and Mitigation Strategy Sections to check on the jurisdictions’ progress. More specifically, Debbie explained the process of developing new mitigation strategies to add to their plans. This discussion covered how to select a new mitigation strategy, the required components for their strategy development, and the format required to input the strategy into the plan. Feedback was gathered about the August Mitigation Grant Workshop – unanimous positive feedback with a few recommendations to improve for next time. A reminder for the InKind Match Sheet and pre-authorization documentation was provided. Finally, the meeting was closed out with a discussion on the progress of meeting the public outreach requirements and ideas for those who had not completed that component yet. Planning Team Meeting #6 – Tacoma Mall Plaza – Ohanapecosh Room – October 8, 2019 PAGE 1-24 REGION 5 ALL HAZARD MITIGATION PLAN – 2020-2025 EDITION BASE PLAN
Planning Team members Debbie Bailey and Wyatt Godfrey held the meeting with less participation than preferred but included a call-in option for those who couldn’t attend in person. The usual review of previous sections occurred, with the introduction of the Infrastructure and Plan Maintenance Sections. Participants were taught how to fill out the potentially overwhelming tables in the Infrastructure Section and told to review the Plan Maintenance Section for any inaccurate statements or language. Like the previous meeting, a reminder for the In-Kind Match Sheet, pre-authorization documentation, and public outreach documentation was provided. Planning Team Meeting #7 – Tacoma Mall Plaza Paradise Room – November 19, 2019 The final planning meeting was conducted by Debbie Bailey and Wyatt Godfrey. All sections of the plan were discussed and reviewed to ensure participants’ questions were answered. A detailed discussion of the Mitigation Strategy Section occurred, specifically looking at the integration of new strategies into the plan and how to reorder them by priority. Like the previous meeting, a reminder for the In-Kind Match Sheet, pre-authorization documentation, and public outreach documentation was provided. Participants were informed that in the new year, Pierce County DEM would be hosting two “workshops” a month where jurisdictions can walk in and get help with their plan on an individual basis, instead of only in the previously used group format. The goal is to refine the work that participants have done thus far and craft it into a well-rounded, comprehensive, and usable Hazard Mitigation Plan.
Regional Planning Team Meetings Table 1-21 North Regional Planning Team Meetings
Planning Team Meeting #2 – North Regional Group: PCEM Puyallup Room – March 25, 2019 Planning Team members Debbie Bailey and Wyatt Godfrey conducted the meeting and the Planning Team discussed the following items: Introduction of Planning Team as this was our first Regional Planning meeting and there were new members present. We reviewed items presented at the previous meeting, Defining the Planning Requirements, Defining the Process, Establishing the Planning Team Meetings, Elected Official Meetings and Public Comment Meetings, and explaining the next steps. This meeting focused on continuing review of the Profile Section, an introduction to begin thinking about mitigation strategies to include a review of what measures from their original plan have already been completed and thinking about new measures they may like to add. In addition, this group discussed the Capability Section and how to recognize capabilities that already exist within the jurisdiction. Everyone was reminded to set up their Elected Official meetings. Everyone was given a copy of their original Section 3 – Capability Section. There was not a Regional Planning Meeting in April of 2019 Planning Team Meeting #3 – North Regional Group: PCEM Puyallup Room – May 21, 2019
PAGE 1-25 REGION 5 ALL HAZARD MITIGATION PLAN – 2020-2025 EDITION BASE PLAN
Planning Team members Debbie Bailey and Wyatt Godfrey conducted the meeting with the majority of the regional jurisdictions present. We reviewed the Profile, Capabilities, and Mitigation Strategy Sections, along with introducing the Risk Assessment Section to the group. We also talked about progress made on the In-Kind Match sheets and pre-authorization approval from jurisdictions’ governing bodies. Finally, we gathered feedback about our Threat and Hazard Identification Workshop held on May 1-2, and everyone’s progress with outreach events for their mitigation plans, especially in relation to fire season starting and the opportunity for communities in this region to incorporate more fire protection and mitigation elements into their planning process. There was not a Regional Planning Meeting in June of 2019 Planning Team Meeting #4 – North Regional Group: PCEM Puyallup Room – July 16, 2019 Planning Team members Debbie Bailey and Wyatt Godfrey reviewed the Profile, Capabilities, Risk Assessment, and Mitigation Strategy Sections to see how everyone was coming along with their update process. A reminder was provided for those who had not turned in their in-kind match sheet, as well as for those who had not completed the governing body pre-approval requirement yet. Debbie offered to create jurisdictional maps for public outreach events to bring residents in to talk about hazards that can affect them and how the mitigation plan plays a role in community resilience. Lastly, Todd Kilpatrick, the former Mitigation Grant Program Manager with Washington State Emergency Management Division who now works at Pierce County Emergency Management, spoke to the group about the Hazard Mitigation Grant Program (HMGP), the Pre-Disaster Mitigation Grant (PDM), potential projects that are eligible for those grants, and the upcoming Mitigation Grant Workshop that’ll be held on August 12th and 19th. There was not a Regional Planning Meeting in August of 2019 Planning Team Meeting #5 – North Regional Group: PCEM Puyallup Room – September 24, 2019 Planning Team members Debbie Bailey and Wyatt Godfrey reviewed the Profile, Capabilities, Risk Assessment, and Mitigation Strategy Sections to check on the jurisdictions’ progress. More specifically, Debbie explained the process of developing new mitigation strategies to add to their plans. This discussion covered how to select a new mitigation strategy, the required components for their strategy development, and the format required to input the strategy into the plan. Feedback was gathered about the August Mitigation Grant Workshop – unanimous positive feedback with a few recommendations to improve for next time. A reminder for the InKind Match Sheet and pre-authorization documentation was provided. Finally, the meeting was closed out with a discussion on the progress of meeting the public outreach requirements and ideas for those who had not completed that component yet. Planning Team Meeting #6 – North Regional Group: PCEM Puyallup Room – October 22, 2019 Planning Team members Debbie Bailey and Wyatt Godfrey held the meeting with less participation than preferred but included a call-in option for those who couldn’t attend in person. The usual review of previous sections occurred, with the introduction of the Infrastructure and Plan Maintenance Sections. Participants were taught how to fill out the potentially overwhelming tables in the Infrastructure Section and told to review the Plan Maintenance Section for any inaccurate statements or language. Like the previous meeting, a reminder for the In-Kind Match Sheet, pre-authorization documentation, and public outreach documentation was provided. PAGE 1-26 REGION 5 ALL HAZARD MITIGATION PLAN – 2020-2025 EDITION BASE PLAN
Planning Team Meeting #7 – North Regional Group: PCEM Puyallup Room – November 21, 2019 The final planning meeting was conducted by Debbie Bailey and Wyatt Godfrey. All sections of the plan were discussed and reviewed to ensure participants’ questions were answered. A detailed discussion of the Mitigation Strategy Section occurred, specifically looking at the integration of new strategies into the plan and how to reorder them by priority. Like the previous meeting, a reminder for the In-Kind Match Sheet, pre-authorization documentation, and public outreach documentation was provided. Participants were informed that in the new year, Pierce County DEM would be hosting two “workshops” a month where jurisdictions can walk in and get help with their plan on an individual basis, instead of only in the previously used group format. The goal is to refine the work that participants have done thus far and craft it into a well-rounded, comprehensive, and usable Hazard Mitigation Plan. Table 1-22 NE Regional Planning Team Meetings
Planning Team Meeting #2 – NE Regional Group: Buckley Fire Station – March 18, 2019 Planning Team members Debbie Bailey and Wyatt Godfrey conducted the meeting and the Planning Team discussed the following items: Introduction of Planning Team as this was our first Regional Planning meeting and there were new members present. We reviewed items presented at the previous meeting, Defining the Planning Requirements, Defining the Process, Establishing the Planning Team Meetings, Elected Official Meetings and Public Comment Meetings, and explaining the next steps. This meeting focused on continuing review of the Profile Section, an introduction to begin thinking about mitigation strategies to include a review of what measures from their original plan have already been completed and thinking about new measures they may like to add. In addition, this group discussed the Capability Section and how to recognize capabilities that already exist within the jurisdiction. Everyone was reminded to set up their Elected Official meetings. Everyone was given a copy of their original Section 3 – Capability Section. There was not a Regional Planning Meeting in April of 2019 Planning Team Meeting #3 – NE Regional Group: Buckley Fire Station – May 15, 2019 Planning Team members Debbie Bailey and Wyatt Godfrey conducted the meeting with the majority of the regional jurisdictions present. We reviewed the Profile, Capabilities, and Mitigation Strategy Sections, along with introducing the Risk Assessment Section to the group. We also talked about progress made on the In-Kind Match sheets and pre-authorization approval from jurisdictions’ governing bodies. Finally, we gathered feedback about our Threat and Hazard Identification Workshop held on May 1-2, and everyone’s progress with outreach events for their mitigation plans, especially in relation to fire season starting and the opportunity for communities in this region to incorporate more fire protection and mitigation elements into their planning process. There was not a Regional Planning Meeting in June of 2019 Planning Team Meeting #4 – NE Regional Group: Buckley Fire Station – July 25, 2019
PAGE 1-27 REGION 5 ALL HAZARD MITIGATION PLAN – 2020-2025 EDITION BASE PLAN
Planning Team members Debbie Bailey and Wyatt Godfrey reviewed the Profile, Capabilities, Risk Assessment, and Mitigation Strategy Sections to see how everyone was coming along with their update process. A reminder was provided for those who had not turned in their in-kind match sheet, as well as for those who had not completed the governing body pre-approval requirement yet. Debbie offered to create jurisdictional maps for public outreach events to bring residents in to talk about hazards that can affect them and how the mitigation plan plays a role in community resilience. Lastly, Todd Kilpatrick, the former Mitigation Grant Program Manager with Washington State Emergency Management Division who now works at Pierce County Emergency Management, spoke to the group about the Hazard Mitigation Grant Program (HMGP), the Pre-Disaster Mitigation Grant (PDM), potential projects that are eligible for those grants, and the upcoming Mitigation Grant Workshop that’ll be held on August 12th and 19th. There was not a Regional Planning Meeting in August of 2019 Planning Team Meeting #5 – NE Regional Group: Buckley Fire Station – September 16, 2019 Planning Team members Debbie Bailey and Wyatt Godfrey reviewed the Profile, Capabilities, Risk Assessment, and Mitigation Strategy Sections to check on the jurisdictions’ progress. More specifically, Debbie explained the process of developing new mitigation strategies to add to their plans. This discussion covered how to select a new mitigation strategy, the required components for their strategy development, and the format required to input the strategy into the plan. Feedback was gathered about the August Mitigation Grant Workshop – unanimous positive feedback with a few recommendations to improve for next time. A reminder for the In-Kind Match Sheet and pre-authorization documentation was provided. Finally, the meeting was closed out with a discussion on the progress of meeting the public outreach requirements and ideas for those who had not completed that component yet. Planning Team Meeting #6 – NE Regional Group: Buckley Fire Station – November 4, 2019 Planning Team members Debbie Bailey and Wyatt Godfrey held the meeting with less participation than preferred but included a call-in option for those who couldn’t attend in person. The usual review of previous sections occurred, with the introduction of the Infrastructure and Plan Maintenance Sections. Participants were taught how to fill out the potentially overwhelming tables in the Infrastructure Section and told to review the Plan Maintenance Section for any inaccurate statements or language. Like the previous meeting, a reminder for the In-Kind Match Sheet, pre-authorization documentation, and public outreach documentation was provided. Planning Team Meeting #7 – NE Regional Group: Buckley Fire Station – December 9 2019 The final planning meeting was conducted by Debbie Bailey and Wyatt Godfrey. All sections of the plan were discussed and reviewed to ensure participants’ questions were answered. A detailed discussion of the Mitigation Strategy Section occurred, specifically looking at the integration of new strategies into the plan and how to reorder them by priority. Like the previous meeting, a reminder for the In-Kind Match Sheet, pre-authorization documentation, and public outreach documentation was provided. Participants were informed that in the new year, Pierce County DEM would be hosting two “workshops” a month where jurisdictions can walk in and get help with their plan on an individual basis, instead of only in the previously used group format. The goal is to refine the work that participants have done thus far and craft it into a well-rounded, comprehensive, and usable Hazard Mitigation Plan. Table 1-23 West Regional Planning Team Meetings
Planning Team Meeting #2 – West Regional Group: Gig Harbor Fire HQ – March 28, 2019
PAGE 1-28 REGION 5 ALL HAZARD MITIGATION PLAN – 2020-2025 EDITION BASE PLAN
Planning Team members Debbie Bailey and Bailee Godfrey conducted the meeting and the Planning Team discussed the following items: Introduction of Planning Team as this was our first Regional Planning meeting and there were new members present. We reviewed items presented at the previous meeting, Defining the Planning Requirements, Defining the Process, Establishing the Planning Team Meetings, Elected Official Meetings and Public Comment Meetings, and explaining the next steps. This meeting focused on continuing review of the Profile Section, an introduction to begin thinking about mitigation strategies to include a review of what measures from their original plan have already been completed and thinking about new measures they may like to add. In addition, this group discussed the Capability Section and how to recognize capabilities that already exist within the jurisdiction. Everyone was reminded to set up their Elected Official meetings. Everyone was given a copy of their original Section 3 – Capability Section. There was not a Regional Planning Meeting in April of 2019 Planning Team Meeting #3 – West Regional Group: Gig Harbor Fire HQ – May 29, 2019 Planning Team members Debbie Bailey and Bailee Godfrey conducted the meeting with the majority of the regional jurisdictions present. We reviewed the Profile, Capabilities, and Mitigation Strategy Sections, along with introducing the Risk Assessment Section to the group. We also talked about progress made on the In-Kind Match sheets and pre-authorization approval from jurisdictions’ governing bodies. Finally, we gathered feedback about our Threat and Hazard Identification Workshop held on May 1-2, and everyone’s progress with outreach events for their mitigation plans, especially in relation to fire season starting and the opportunity for communities in this region to incorporate more fire protection and mitigation elements into their planning process. There was not a Regional Planning Meeting in June of 2019 Planning Team Meeting #4 – West Regional Group: Gig Harbor Fire HQ – July 24, 2019 Planning Team members Debbie Bailey and Bailee Godfrey reviewed the Profile, Capabilities, Risk Assessment, and Mitigation Strategy Sections to see how everyone was coming along with their update process. A reminder was provided for those who had not turned in their in-kind match sheet, as well as for those who had not completed the governing body pre-approval requirement yet. Debbie offered to create jurisdictional maps for public outreach events to bring residents in to talk about hazards that can affect them and how the mitigation plan plays a role in community resilience. Lastly, Todd Kilpatrick, the former Mitigation Grant Program Manager with Washington State Emergency Management Division who now works at Pierce County Emergency Management, spoke to the group about the Hazard Mitigation Grant Program (HMGP), the Pre-Disaster Mitigation Grant (PDM), potential projects that are eligible for those grants, and the upcoming Mitigation Grant Workshop that’ll be held on August 12th and 19th. There was not a Regional Planning Meeting in August of 2019 Planning Team Meeting #5 – West Regional Group: Gig Harbor Fire HQ – September 25, 2019
PAGE 1-29 REGION 5 ALL HAZARD MITIGATION PLAN – 2020-2025 EDITION BASE PLAN
Planning Team members Debbie Bailey and Wyatt Godfrey reviewed the Profile, Capabilities, Risk Assessment, and Mitigation Strategy Sections to check on the jurisdictions’ progress. More specifically, Debbie explained the process of developing new mitigation strategies to add to their plans. This discussion covered how to select a new mitigation strategy, the required components for their strategy development, and the format required to input the strategy into the plan. Feedback was gathered about the August Mitigation Grant Workshop – unanimous positive feedback with a few recommendations to improve for next time. A reminder for the In-Kind Match Sheet and pre-authorization documentation was provided. Finally, the meeting was closed out with a discussion on the progress of meeting the public outreach requirements and ideas for those who had not completed that component yet.
Planning Team Meeting #6 – West Regional Group: Gig Harbor Fire HQ – October 30, 2019 Planning Team members Debbie Bailey and Wyatt Godfrey held the meeting with less participation than preferred but included a call-in option for those who couldn’t attend in person. The usual review of previous sections occurred, with the introduction of the Infrastructure and Plan Maintenance Sections. Participants were taught how to fill out the potentially overwhelming tables in the Infrastructure Section and told to review the Plan Maintenance Section for any inaccurate statements or language. Like the previous meeting, a reminder for the In-Kind Match Sheet, pre-authorization documentation, and public outreach documentation was provided
Planning Team Meeting #7 – West Regional Group: Gig Harbor Fire HQ – December 4, 2019 The final planning meeting was conducted by Debbie Bailey and Wyatt Godfrey. All sections of the plan were discussed and reviewed to ensure participants’ questions were answered. A detailed discussion of the Mitigation Strategy Section occurred, specifically looking at the integration of new strategies into the plan and how to reorder them by priority. Like the previous meeting, a reminder for the In-Kind Match Sheet, pre-authorization documentation, and public outreach documentation was provided. Participants were informed that in the new year, Pierce County DEM would be hosting two “workshops” a month where jurisdictions can walk in and get help with their plan on an individual basis, instead of only in the previously used group format. The goal is to refine the work that participants have done thus far and craft it into a well-rounded, comprehensive, and usable Hazard Mitigation Plan Table 1-24 Central Regional Planning Team Meetings
There was not a Regional Planning Meeting in March of 2019 Planning Team Meeting #2 – Central Regional Group: CPFR HQ Station 60 – April 8, 2019 Planning Team members Debbie Bailey and Bailee Godfrey conducted the meeting and the Planning Team discussed the following items: Introduction of Planning Team as this was our first Regional Planning meeting and there were new members present. We reviewed items presented at the previous meeting, Defining the Planning Requirements, Defining the Process, Establishing the Planning Team Meetings, Elected Official Meetings and Public Comment Meetings, and explaining the next steps. This meeting focused on continuing review of the Profile Section, an introduction to begin thinking about mitigation strategies to include a review of what measures from their original plan have already been completed and thinking about new measures they may like to add. In addition, this group discussed the Capability Section and how to recognize capabilities that already exist within the jurisdiction. Everyone was reminded to set up their Elected Official meetings. Everyone was given a copy of their original Section 3 – Capability Section. Planning Team Meeting #3 – Central Regional Group: CPFR HQ Station 60 – May 30, 2019
PAGE 1-30 REGION 5 ALL HAZARD MITIGATION PLAN – 2020-2025 EDITION BASE PLAN
Planning Team members Debbie Bailey and Bailee Godfrey conducted the meeting with the majority of the regional jurisdictions present. We reviewed the Profile, Capabilities, and Mitigation Strategy Sections, along with introducing the Risk Assessment Section to the group. We also talked about progress made on the In-Kind Match sheets and pre-authorization approval from jurisdictions’ governing bodies. Finally, we gathered feedback about our Threat and Hazard Identification Workshop held on May 1-2, and everyone’s progress with outreach events for their mitigation plans, especially in relation to fire season starting and the opportunity for communities in this region to incorporate more fire protection and mitigation elements into their planning process. There was not a Regional Planning Meeting in June of 2019 Planning Team Meeting #4 – Central Regional Group: CPFR HQ Station 60 – July 8, 2019 Planning Team members Debbie Bailey and Bailee Godfrey reviewed the Profile, Capabilities, Risk Assessment, and Mitigation Strategy Sections to see how everyone was coming along with their update process. A reminder was provided for those who had not turned in their in-kind match sheet, as well as for those who had not completed the governing body pre-approval requirement yet. Debbie offered to create jurisdictional maps for public outreach events to bring residents in to talk about hazards that can affect them and how the mitigation plan plays a role in community resilience. Lastly, Todd Kilpatrick, the former Mitigation Grant Program Manager with Washington State Emergency Management Division who now works at Pierce County Emergency Management, spoke to the group about the Hazard Mitigation Grant Program (HMGP), the Pre-Disaster Mitigation Grant (PDM), potential projects that are eligible for those grants, and the upcoming Mitigation Grant Workshop that’ll be held on August 12th and 19th. There was not a Regional Planning Meeting in August of 2019 Planning Team Meeting #5 – Central Regional Group: CPFR HQ Station 60 – September 9, 2019 Planning Team members Debbie Bailey and Wyatt Godfrey reviewed the Profile, Capabilities, Risk Assessment, and Mitigation Strategy Sections to check on the jurisdictions’ progress. More specifically, Debbie explained the process of developing new mitigation strategies to add to their plans. This discussion covered how to select a new mitigation strategy, the required components for their strategy development, and the format required to input the strategy into the plan. Feedback was gathered about the August Mitigation Grant Workshop – unanimous positive feedback with a few recommendations to improve for next time. A reminder for the In-Kind Match Sheet and pre-authorization documentation was provided. Finally, the meeting was closed out with a discussion on the progress of meeting the public outreach requirements and ideas for those who had not completed that component yet
Planning Team Meeting #6 – Central Regional Group: CPFR HQ Station 60 – October 24, 2019 Planning Team members Debbie Bailey and Wyatt Godfrey held the meeting with less participation than preferred but included a call-in option for those who couldn’t attend in person. The usual review of previous sections occurred, with the introduction of the Infrastructure and Plan Maintenance Sections. Participants were taught how to fill out the potentially overwhelming tables in the Infrastructure Section and told to review the Plan Maintenance Section for any inaccurate statements or language. Like the previous meeting, a reminder for the In-Kind Match Sheet, pre-authorization documentation, and public outreach documentation was provided
Planning Team Meeting #7 – Central Regional Group: CPFR HQ Station 60 – December 5, 2019 PAGE 1-31 REGION 5 ALL HAZARD MITIGATION PLAN – 2020-2025 EDITION BASE PLAN
The final planning meeting was conducted by Debbie Bailey and Wyatt Godfrey. All sections of the plan were discussed and reviewed to ensure participants’ questions were answered. A detailed discussion of the Mitigation Strategy Section occurred, specifically looking at the integration of new strategies into the plan and how to reorder them by priority. Like the previous meeting, a reminder for the In-Kind Match Sheet, pre-authorization documentation, and public outreach documentation was provided. Participants were informed that in the new year, Pierce County DEM would be hosting two “workshops” a month where jurisdictions can walk in and get help with their plan on an individual basis, instead of only in the previously used group format. The goal is to refine the work that participants have done thus far and craft it into a well-rounded, comprehensive, and usable Hazard Mitigation Plan Table 1-25 SW Regional Planning Team Meetings
Planning Team Meeting #2 – SW Regional Group: PCEM Nisqually Room – March 25, 2019 Planning Team members Debbie Bailey and Bailee Godfrey conducted the meeting and the Planning Team discussed the following items: Introduction of Planning Team as this was our first Regional Planning meeting and there were new members present. We reviewed items presented at the previous meeting, Defining the Planning Requirements, Defining the Process, Establishing the Planning Team Meetings, Elected Official Meetings and Public Comment Meetings, and explaining the next steps. This meeting focused on continuing review of the Profile Section, an introduction to begin thinking about mitigation strategies to include a review of what measures from their original plan have already been completed and thinking about new measures they may like to add. In addition, this group discussed the Capability Section and how to recognize capabilities that already exist within the jurisdiction. Everyone was reminded to set up their Elected Official meetings. Everyone was given a copy of their original Section 3 – Capability Section. There was not a Regional Planning Meeting in April of 2019 Planning Team Meeting #3 – SW Regional Group: PCEM Nisqually Room – May 28, 2019 Planning Team members Debbie Bailey and Bailee Godfrey conducted the meeting with the majority of the regional jurisdictions present. We reviewed the Profile, Capabilities, and Mitigation Strategy Sections, along with introducing the Risk Assessment Section to the group. We also talked about progress made on the In-Kind Match sheets and pre-authorization approval from jurisdictions’ governing bodies. Finally, we gathered feedback about our Threat and Hazard Identification Workshop held on May 1-2, and everyone’s progress with outreach events for their mitigation plans, especially in relation to fire season starting and the opportunity for communities in this region to incorporate more fire protection and mitigation elements into their planning process. There was not a Regional Planning Meeting in June of 2019 Planning Team Meeting #4 – SW Regional Group: PCEM Nisqually Room – July 18, 2019
PAGE 1-32 REGION 5 ALL HAZARD MITIGATION PLAN – 2020-2025 EDITION BASE PLAN
Planning Team members Debbie Bailey and Bailee Godfrey reviewed the Profile, Capabilities, Risk Assessment, and Mitigation Strategy Sections to see how everyone was coming along with their update process. A reminder was provided for those who had not turned in their in-kind match sheet, as well as for those who had not completed the governing body pre-approval requirement yet. Debbie offered to create jurisdictional maps for public outreach events to bring residents in to talk about hazards that can affect them and how the mitigation plan plays a role in community resilience. Lastly, Todd Kilpatrick, the former Mitigation Grant Program Manager with Washington State Emergency Management Division who now works at Pierce County Emergency Management, spoke to the group about the Hazard Mitigation Grant Program (HMGP), the Pre-Disaster Mitigation Grant (PDM), potential projects that are eligible for those grants, and the upcoming Mitigation Grant Workshop that’ll be held on August 12th and 19th. There was not a Regional Planning Meeting in August of 2019 Planning Team Meeting #5 – SW Regional Group: PCEM Nisqually Room – September 19,
2019 Planning Team members Debbie Bailey and Wyatt Godfrey reviewed the Profile, Capabilities, Risk Assessment, and Mitigation Strategy Sections to check on the jurisdictions’ progress. More specifically, Debbie explained the process of developing new mitigation strategies to add to their plans. This discussion covered how to select a new mitigation strategy, the required components for their strategy development, and the format required to input the strategy into the plan. Feedback was gathered about the August Mitigation Grant Workshop – unanimous positive feedback with a few recommendations to improve for next time. A reminder for the InKind Match Sheet and pre-authorization documentation was provided. Finally, the meeting was closed out with a discussion on the progress of meeting the public outreach requirements and ideas for those who had not completed that component yet. Planning Team Meeting #6 – SW Regional Group: PCEM Nisqually Room – October 31, 2019 Planning Team members Debbie Bailey and Wyatt Godfrey held the meeting with less participation than preferred but included a call-in option for those who couldn’t attend in person. The usual review of previous sections occurred, with the introduction of the Infrastructure and Plan Maintenance Sections. Participants were taught how to fill out the potentially overwhelming tables in the Infrastructure Section and told to review the Plan Maintenance Section for any inaccurate statements or language. Like the previous meeting, a reminder for the In-Kind Match Sheet, pre-authorization documentation, and public outreach documentation was provided. Planning Team Meeting #7 – SW Regional Group: PCEM Nisqually Room – December 3, 2019
PAGE 1-33 REGION 5 ALL HAZARD MITIGATION PLAN – 2020-2025 EDITION BASE PLAN
The final planning meeting was conducted by Debbie Bailey and Wyatt Godfrey. All sections of the plan were discussed and reviewed to ensure participants’ questions were answered. A detailed discussion of the Mitigation Strategy Section occurred, specifically looking at the integration of new strategies into the plan and how to reorder them by priority. Like the previous meeting, a reminder for the In-Kind Match Sheet, pre-authorization documentation, and public outreach documentation was provided. Participants were informed that in the new year, Pierce County DEM would be hosting two “workshops” a month where jurisdictions can walk in and get help with their plan on an individual basis, instead of only in the previously used group format. The goal is to refine the work that participants have done thus far and craft it into a well-rounded, comprehensive, and usable Hazard Mitigation Plan.
Drop – In Workshop To provide further opportunity for participating jurisdictions to work on their plan updates Pierce County DEM hosted two additional “workshop” meetings per month starting in January 2020. These were not formal meetings but provided individual instruction or assistance to jurisdictions. They were scattered at two-week intervals during the month with alternating morning and afternoon times trying to accommodate busy schedules. Due to the COVID-19 virus pandemic our “drop-in” workshops were canceled for the remainder of the update cycle. We remained available through email and phone call conversations. Table 1-26 Drop-In Meetings
Date
Location
January 7, 2020 – 1:00-3:30
Pierce County - DEM
January 23, 2020 – 9:00-11:30
Pierce County - DEM
February 11, 2020 – 1:00-3:30
Pierce County - DEM
February 27, 2020 – 9:00-11:30
Pierce County - DEM
Comments/Outcome
Threat and Hazard Identification Workshop In order to prepare and plan for emergencies which might strike the County, it is necessary to understand hazards that potentially could impact it, what their history of activity is in Pierce County, and how vulnerable the citizens of the county are to those hazards. The Hazard Identification and Risk Assessment (HIRA) serves as a basis for the development of plans, public education programs, responder training, and exercises. The Pierce County HIRA is not a detailed study of the hazards and their impacts, but rather it describes those hazards felt to be the greatest potential threat to people, the environment, personal and public property, and the economy. In May of 2019 Pierce County hosted a two-day Threat and Hazard Identification Workshop that included Natural, Technological and Human-Caused hazards. Subject matter experts were brought in to facilitate discussions on threats and hazards and how stakeholders can partner together as a region to increase resiliency within our communities and infrastructure. Subject matter experts discussed the threats and hazards and existing programs that would enable jurisdictions to develop mitigation strategies. Different funding sources were discussed along PAGE 1-34 REGION 5 ALL HAZARD MITIGATION PLAN – 2020-2025 EDITION BASE PLAN
with their current capabilities. These discussions engaged jurisdictions to really identify their threats and hazards including gaps and strategies to close those gaps. Table 1-27 Threat and Hazard Identification Workshop – May 1, 2019 Natural Hazards Agenda
Activity/Hazard
Presenter
7:30am – 8:00am
Registration Welcome / Instructions
Earthquake
Flood
Landslide
Climate Change Drought / Wildland Fires / WUI Fires
Severe Weather Pandemic Flu Closing Comments
Time
Jody Ferguson, Pierce County Emergency Management Chelsey Bell, Pierce County Emergency Management
8:00am – 8:30am
Corina Forson, 8:30am – 9:15am Washington State Department of Natural Resources Helmut Schmidt, Pierce County Planning and Public Works - Surface Water Management Division 9:15am – 10:00am Brynne Walker, Pierce County Planning and Public Works - Surface Water Management Division Break 10:00am – 10:15am Stephen Slaughter, 10:15am – 11:00am Washington State Department of Natural Resources Lunch (On your own)
11:00am – 12:15pm
Crystal Raymond, University of Washington Climate Impacts Group Ashley Blazina, Department of Natural Resources
12:15pm – 1:00pm
Break
1:45pm – 2:00pm
Chelsey Bell, Pierce County Emergency Management Cindy Miron, Tacoma Pierce County Health Department Chelsey Bell, Pierce County Emergency Management
1:00pm – 1:45pm
2:00pm – 2:45pm 2:45pm – 3:30pm 3:30pm – 4:00pm
Table 1-28 Threat and Hazard Identification Workshop – May 2, 2019 Technological and Human-Caused Hazards Agenda
Activity/Hazard Registration
Presenter
Time 7:30am – 8:00am
PAGE 1-35 REGION 5 ALL HAZARD MITIGATION PLAN – 2020-2025 EDITION BASE PLAN
Welcome / Introductions Energy Emergency / Power Outages Dam Failure Transportation Accidents Hazardous Materials / Pipelines Cyber Infrastructure and Structural Collapse and/or Failures Terrorism Civil Disturbance Closing Comments
Nicole Johnson, Pierce County Emergency Management Chelsey Bell, Pierce County Emergency Management Chelsey Bell, on behalf of WA State Energy Office Richard Smith, U.S. Army Corps of Engineers Break Kathy Vatter, Washington State Department of Transportation Lunch (On your own) Dave Byers, Washington State Department of Ecology Mitchell Hillman, Critical Infrastructure Cyber Security Consultants
8:00am – 8:30am
8:30am – 9:15am 9:15am – 10:00am 10:00am – 10:15am 10:15am – 10:30am 11:00am – 12:15pm 12:15pm – 1:00pm
1:00pm – 1:45pm Chelsey Bell, Pierce County Emergency Management Break Chelsey Bell, Pierce County Emergency Management Chelsey Bell, Pierce County Emergency Management Chelsey Bell, Pierce County Emergency Management
1:45pm – 2:00pm 2:00pm – 2:45pm 2:45pm – 3:30pm 3:30pm– 4:00pm
In addition to the two-day workshop, Pierce County Emergency Management continues to seek input on the 2020 HIRA through their website. “Pierce County Emergency Management is looking for input on the recently updated 2019 HIRA, included below. This will be available online until close of business Friday, November 1. Below we have provided a reviewer’s guide for when you review the hazard chapters. Please be sure to read the introduction and profile sections to give you context. We have added a lot of new information that we hope you find helpful.”
https://my.co.pierce.wa.us/3300/Hazard-Identification-and-Risk-Assessmen
PAGE 1-36 REGION 5 ALL HAZARD MITIGATION PLAN – 2020-2025 EDITION BASE PLAN
Hazard-Identification and Risk Assessment Reviewer’s Guide HIRA desired outcomes: • •
an evaluation of each hazard’s potential impacts on the people, economy, and built and natural environments and; an understanding of each community’s overall vulnerability and most significant risks.
HIRA Review Process • • •
Preliminary update of hazard specific chapters based on hazard research – April to August Subject matter expert review and validation of hazard chapters – September Partner / stakeholder comment period – November
General Notes: Subject matter experts from a variety of fields are being asked to review and validate the information in the Pierce County HIRA. This foundational document is used by many groups to develop mitigation strategies for reducing risk. An effective risk assessment informs proposed actions by focusing
attention and resources on the greatest risks. The four basic components of a risk assessment are: 1) hazard identification, 2) profiling of hazard events, 3) inventory of assets, and 4) estimation of potential human and economic losses based on the exposure and vulnerability of people, buildings, and infrastructure. We are asking for folks with expertise in one or more of the 19 identified hazards in Pierce County (such as flooding, earthquakes, volcanoes, active threats, etc.) to review the chapters that pertain to their line of work, acknowledging that some agencies and organizations have responsibilities across multipole disciplines. Remember, when updating hazard chapters, we are asking reviewers to: •
Please use track changes and comments.
•
Help write the narratives summarizing vulnerability (write in the form problem statements). Examples of problem statements: •
The North Creek Sewage Treatment Plant is located in the 100-year floodplain and has been damaged by past flood events. It serves 10,000 residential and commercial properties.
•
The schools are a central focus of the community and offer opportunities to educate the public about hazards, risk, and mitigation. In addition, many school facilities are vulnerable to one or more hazards, including flooding, earthquake, tornado, and severe winter storms.
PAGE 1-37 REGION 5 ALL HAZARD MITIGATION PLAN – 2020-2025 EDITION BASE PLAN
Hazard-Identification and Risk Assessment Review’s Guide Definitions and concepts: •
Hazard: A hazard is a potentially damaging physical event or phenomenon or human activity that may cause the loss of life, property damage, social and economic disruption.
•
Risk: is the potential for an unwanted outcome resulting from an incident or occurrence, as determined by its likelihood and the associated consequences.
•
Hazard Identification and Risk Assessment: A hazard identification and risk assessment provides the factual basis for activities proposed in the strategy portion of a hazard mitigation plan.
•
Natural Hazards: are natural events that threaten lives, property, and other assets.
•
Technological Hazards: These hazards originate from technological or industrial accidents, infrastructure failures, or certain human activities. These hazards cause the loss of life or injury, property damage, social and economic disruption, or environmental degradation, and often come with little to no warning.
•
Human-caused Hazards: Hazards that rise from deliberate, intentional human actions to threaten or harm the well-being of others. Examples include school violence, terrorist acts, or sabotage.
•
Hazard Relationships o
There are primary, secondary, and tertiary hazards. A secondary hazard is one that can be triggered by the primary hazard. A triggered hazard has its own secondary hazards. These are tertiary hazards. For example, a snowstorm occurs. This is the primary hazard. Then it rapidly melts triggering urban flooding and landslides. These are the secondary hazards. The landslides knock out the supports of a bridge that also carries power, water and gas lines. These outages are the tertiary hazards.
Resources FEMA Local Mitigation Handbook (Section 5: Conducting A Risk Assessment) https://www.fema.gov/hazard-identification-and-risk-assessment
PAGE 1-38 REGION 5 ALL HAZARD MITIGATION PLAN – 2020-2025 EDITION BASE PLAN
Hazard Identification and Risk Assessment Hazard Chapter Review Components Identification Description a. Definition Section: •
Is the definition listed accurate according and complete? If not, is there a particular body or agency that provides the definition of this hazard?
•
Are there laws, regulations, and funding streams which further define or restrict this hazard? Please provide a link in the resource directory at the end of the chapter.
•
Are there any other products that define this hazard that we should reference?
b. Types: •
there are not always types of hazards, but if there are subcategories for a hazard this is a section that can be utilized to make the distinction.
c. Secondary hazards (if applicable): List any secondary or tertiary hazards that may result from this hazard. For example, a snowstorm occurs. This is the primary hazard. Then it rapidly melts triggering urban flooding and landslides. These are the secondary hazards. The landslides knock out the supports of a bridge that also carries power, water and gas lines. These outages are the tertiary hazards. Hazard Profile a. Guidance: • •
Information can be provided in many different formats. Tables, infographics, maps, modeling, and written narrative are all accepted. Please provide full APA citations for any sources used in this update.
b. Suggestions/Tips: • • •
Does your agency have an on-call program or person? Did you check the logs for information? Did you review existing studies, reports and plans related to this hazard? (Consider Federal, State, regional and local). When reviewing plans, focus on assumptions, concept of operations, and procedures that reference hazards. Are the hazard impacts in the plan reflected in the HIRA? If not, please be sure to write details in problem statements.
c. Location and extent: •
Location is often explained in the form of maps or narrative. Extent is the strength or magnitude of the hazard. Describing the extent of a hazard is not the same as describing its potential impacts on a community. Extent defines the characteristics of the hazard regardless of the people and property it affects, while impact refers to the effect of a hazard on the people and property in the community. PAGE 1-39 REGION 5 ALL HAZARD MITIGATION PLAN – 2020-2025 EDITION BASE PLAN
• • • •
How does this hazard vary within communities? Has the hazard changed since the last update? In what way? Do we know why? Are we doing anything about it? What are the durations of the hazard? What is our current trend for the past year? (increase, decrease, no change) Past five years? What was the shortest? What was the longest? What is a reasonable and realistic worst-case scenario? (What is the maximum credible scenario?)
d. Occurrences • • •
For some hazards, it may be helpful to compile past events in tables. When data is available, describe the extent of the event and impacts, such as fatalities and injuries, building and infrastructure damages, and loss of services. Has the history of significant or unique hazard events been captured? Are there any new trends since the last update?
e. Recurrence rate • • Impacts
What is the probability of future events? Can it be measured? If yes, how? Is there a well explained recurrence rate? If not, should there be?
a. What are the impacts from the hazard on people, property, and the environment? b. When reviewing the potential impacts consider the following: • Health and safety of persons in the affected area at the time of the incident. • Impacts to individuals with access and functional needs and persons with disabilities • Health and safety of personnel responding to the incident • Continuity of operations and delivery of services • Property, facilities, and infrastructure • Environment • Economic and financial condition • Public confidence in the jurisdiction’s governance Resource directory • • • •
Are the sources used in the chapter listed correctly? Add any additional hazard specific sources. Are any references that specifically authorize or regulate this hazard? Include additional plans that may be relevant, interdependent.
PAGE 1-40 REGION 5 ALL HAZARD MITIGATION PLAN – 2020-2025 EDITION BASE PLAN
Threat and Hazard Identification and Risk Assessment (THIRA) Annually Pierce, King, and Snohomish Counties work together on the Threat and Hazard Identification and Risk Assessment and Stakeholder Preparedness Review (SPR). Each year we look at work that has been done by individual jurisdictions and update our information. In the 2019 process over 200 jurisdictions/organizations participated in an earthquake-based discussion. We met with utility providers, non-profits, government agencies, and the private sector and shared what we knew from a Hazus model on the Seattle Fault which creates a tsunami with more impact than Cascadia. This brought many good discussions and realizations with partners (such as the Port of Tacoma, City of Fife, City of Gig Harbor, etc.) as we talked about existing codes and infrastructure. The next step in 2020 was to have a workshop with utility providers and planning and land services departments to have further discussions.
Elected Official’s Meetings Elected Official’s Meetings allowed the Planning Team and DEM to get approval from the Elected Officials of each jurisdiction to participate in the process. These meetings were done in the beginning of the process to educate them on the updated requirements and the use of their resources (time of their personnel). Table 1-29 through 1-34 document these meetings. Table 1-29 Elected Official’s Meetings – Cities and Towns
Hazard Mitigation Plan Presentation for the Region 5 All Hazard Mitigation Plan Update and Unincorporated Pierce County Plan for the Pierce County Council October 3, 2017
Pierce County Council Chambers
Planning Team member Karen Vindivich from Pierce County Department of Emergency Management presented the history of this project, the All Hazard Mitigation Plan Requirements, the Plan process, the Plan benefits, and a list of participating jurisdictions to the County Council, and the general public. In addition, authorization was needed to proceed with the FEMA grant for this update project. Hazard Mitigation Plan Presentation for City of Bonney Lake January 15, 2019
Bonney Lake Justice & Municipal Center
Planning Team member Harwood Edvalson presented the history of this project, the All Hazard Mitigation Plan Requirements, the Plan process, the Plan benefits, and a list of participating jurisdictions to the Mayor and City Council of Bonney Lake and the general public. Hazard Mitigation Plan Presentation for City of Edgewood City Council January 15, 2019
City Hall, Edgewood
PAGE 1-41 REGION 5 ALL HAZARD MITIGATION PLAN – 2020-2025 EDITION BASE PLAN
Planning Team member Debbie Bailey from Pierce County Department of Emergency Management along with Micah Lundborg presented the history of this project, the All Hazard Mitigation Plan Requirements, the Plan process, the Plan benefits, and a list of participating jurisdictions to the Mayor and Edgewood City Council, and the general public. Hazard Mitigation Plan Presentation for City of Orting City Council January 30, 2019
Orting Multi-Purpose Center
Planning Team member Debbie Bailey from Pierce County Department of Emergency Management along with Mark Bethune presented the history of this project, the All Hazard Mitigation Plan Requirements, the Plan process, the Plan benefits, and a list of participating jurisdictions to the Mayor and City Council of Orting and the general public to their Regular Business Meeting.. Hazard Mitigation Plan Presentation for Town of Steilacoom Town Council March 5, 2019
Town Administration Building
Planning Team member Paul Loveless presented the history of this project, the All Hazard Mitigation Plan Requirements, the Plan process, the Plan benefits, and a list of participating jurisdictions to the Mayor and Steilacoom Town Council, and the general public. Hazard Mitigation Plan Presentation for Town of Carbonado Town Council March 11, 2019
Town Administration Building
Planning Team member Debbie Bailey from Pierce County Department of Emergency Management along with Daillene Argo presented the history of this project, the All Hazard Mitigation Plan Requirements, the Plan process, the Plan benefits, and a list of participating jurisdictions to the Mayor and Carbonado Town Council, and the general public. Hazard Mitigation Plan Presentation for Town of Eatonville Town Council April 22, 2019
Town Administration Building
Planning Team member Debbie Bailey from Pierce County Department of Emergency Management along with Abby Gribi presented the history of this project, the All Hazard Mitigation Plan Requirements, the Plan process, the Plan benefits, and a list of participating jurisdictions to the Mayor and Eatonville Town Council, and the general public. Hazard Mitigation Plan Presentation for City of University Place May 20, 2019
University Place City Hall
Planning Team member Lisa Petorak presented the history of this project, the All Hazard Mitigation Plan Requirements, the Plan process, the Plan benefits, and a list of participating jurisdictions to the Mayor and City Council of University Place and the general public. PAGE 1-42 REGION 5 ALL HAZARD MITIGATION PLAN – 2020-2025 EDITION BASE PLAN
Hazard Mitigation Plan Presentation for City of Lakewood July 8, 2019
Lakewood City Hall
Planning Team member Debbie Bailey from Pierce County Department of Emergency Management along with John Unfred presented the history of this project, the All Hazard Mitigation Plan Requirements, the Plan process, the Plan benefits, and a list of participating jurisdictions to the Mayor and City Council of Lakewood and the general public. Hazard Mitigation Plan Presentation for City of Roy September 10, 2019
Roy City Hall
Planning Team member Wyatt Godfrey from Pierce County Department of Emergency Management along with Officer Armitage presented the history of this project, the All Hazard Mitigation Plan Requirements, the Plan process, the Plan benefits, and a list of participating jurisdictions to the Mayor and City Council of Roy and the general public. Hazard Mitigation Plan Presentation for City of Fife November 12, 2019
Fife City Hall
Planning Team member Pete Fisher presented the history of this project, the Hazard Mitigation Plan Requirements, the Plan process, the Plan benefits, and a list of participating jurisdictions to the Mayor and City Council of Fife and the general public. In addition, he provided a presentation by Daniel Eungard, a Subsurface Lead/Tsunami Hazard Geologist from The Washington Geological Survey to provide the Council and public with an overview of those hazards that could impact the City of Fife. Hazard Mitigation Plan Presentation for City of DuPont November 12, 2019
DuPont City Hall
Planning Team member Debbie Bailey from Pierce County Department of Emergency Management along with Jeffrey Wilson presented the history of this project, the All Hazard Mitigation Plan Requirements, the Plan process, the Plan benefits, and a list of participating jurisdictions to the Mayor and City Council of DuPont and the general public. Hazard Mitigation Plan Presentation for City of Fircrest February 18, 2020
Fircrest Council Chambers City Hall
Planning Team member John Cheesman presented the history of this project, the All Hazard Mitigation Plan Requirements, the Plan process, the Plan benefits, and a list of participating jurisdictions to the Mayor and City Council of Fircrest and the general public during their City Council Study Session. Hazard Mitigation Plan Presentation for Town of South Prairie Town Council PAGE 1-43 REGION 5 ALL HAZARD MITIGATION PLAN – 2020-2025 EDITION BASE PLAN
April 1, 2019
South Prairie Town Hall
Planning Team member Emily Terrell presented the history of this project, the All Hazard Mitigation Plan Requirements, the Plan process, the Plan benefits, and a list of participating jurisdictions to the Mayor and Town Council of South Prairie and the general public.
Table 1-30 Elected Official’s Meetings – Fire Group
Hazard Mitigation Plan Presentation for Pierce County Fire District #23 November 19, 2019
PC Fire District #23 Headquarters Station
Planning Team member Matt Medford presented the history of this project, the All Hazard Mitigation Plan Requirements, the Plan process, the Plan benefits, and a list of the participating jurisdictions to Ashford-Elbe Fire Commissioners and the general public. Hazard Mitigation Plan Presentation for East Pierce Fire District #22 March 19, 2019
East Pierce Fire Headquarters
Planning Team member Debbie Bailey from Pierce County Department of Emergency Management along with Jim Jaques presented the history of this project, the All Hazard Mitigation Plan Requirements, the Plan process, the Plan benefits, and a list of the participating jurisdictions to the East Pierce Fire Commissioners and the general public. Hazard Mitigation Plan Presentation for Central Pierce Fire District #6 July 8, 2019
Central Pierce Fire Headquarters
Planning Team member Stan Gacioch presented the history of this project, the All Hazard Mitigation Plan Requirements, the Plan process, the Plan benefits, and a list of the participating jurisdictions to the Central Pierce Fire & Rescue Commissioners and the general public. Hazard Mitigation Plan Presentation for Riverside Fire and Rescue #14 January 28, 2019
Riverside Fire Headquarters
Planning Team member Kira Thirkield presented the history of this project, the All Hazard Mitigation Plan Requirements, the Plan process, the Plan benefits, and a list of the participating jurisdictions to the Riverside Fire Commissioners and the general public. Hazard Mitigation Plan Presentation for Graham Fire and Rescue #21 May 8, 2019
Graham Fire Headquarters
Planning Team member Tony Judd presented the history of this project, the All Hazard Mitigation Plan Requirements, the Plan process, the Plan benefits, and a list of the participating jurisdictions to the Graham Fire Commissioners and the general public. PAGE 1-44 REGION 5 ALL HAZARD MITIGATION PLAN – 2020-2025 EDITION BASE PLAN
Hazard Mitigation Plan Presentation for Gig Harbor Fire District #5 June 11, 2019
Gig Harbor Fire Headquarters
Planning Team member Debbie Bailey from Pierce County Department of Emergency Management along with Eric Waters presented the history of this project, the All Hazard Mitigation Plan Requirements, the Plan process, the Plan benefits, and a list of the participating jurisdictions to the Gig Harbor Fire Commissioners and the general public.
PAGE 1-45 REGION 5 ALL HAZARD MITIGATION PLAN – 2020-2025 EDITION BASE PLAN
Table 1-31 Elected Official’s Meetings – School Group
Hazard Mitigation Plan Presentation for Carbonado School District February 19, 2019
Carbonado School District Headquarters
Planning Team member Scott Hubbard presented the history of this project, the All Hazard Mitigation Plan Requirements, the Plan process, the Plan benefits, and a list of the participating jurisdictions to the Board of Directors of the Carbonado School District and the general public. Hazard Mitigation Plan Presentation for Franklin Pierce School District May 28, 2019
Franklin Pierce Administration Building
Planning Team member Katie Gillespie presented the history of this project, the All Hazard Mitigation Plan Requirements, the Plan process, the Plan benefits, and a list of the participating jurisdictions to the Board of Directors of the Franklin Pierce School District and the general public. Hazard Mitigation Plan Presentation for Sumner-Bonney Lake School District July 10, 2019
Sumner-Bonney Lake School Administration
Planning Team member Cheryl Collins presented the history of this project, the All Hazard Mitigation Plan Requirements, the Plan process, the Plan benefits, and a list of the participating jurisdictions to the Board of Directors of the Sumner-Bonney Lake School District and the general public. Hazard Mitigation Plan Presentation for Orting School District June 6, 2019
Orting High School
Planning Team member Debbie Bailey from Pierce County Department of Emergency Management along with Chris Willis presented the history of this project, the All Hazard Mitigation Plan Requirements, the Plan process, the Plan benefits, and a list of the participating jurisdictions to the Board of Directors of the of Orting School District and the general public. Hazard Mitigation Plan Presentation for Puyallup School District March 18, 2019
Puyallup School District
Planning Team member Brian Devereux presented the history of this project, the All Hazard Mitigation Plan Requirements, the Plan process, the Plan benefits, and a list of the participating jurisdictions to the Board of Directors of the Puyallup School District and the general public. Hazard Mitigation Plan Presentation for White River School District April 3, 2019
White River District Board and Conference Room
PAGE 1-46 REGION 5 ALL HAZARD MITIGATION PLAN – 2020-2025 EDITION BASE PLAN
Planning Team member Michelle Bradshaw presented the history of this project, the All Hazard Mitigation Plan Requirements, the Plan process, the Plan benefits, and a list of the participating jurisdictions to the Board of Directors of the White River School District and the general public. Hazard Mitigation Plan Presentation for Peninsula School District April 25, 2019
District Office Board and Conference Room
Planning Team member Sarah Hoover presented the history of this project, the All Hazard Mitigation Plan Requirements, the Plan process, the Plan benefits, and a list of the participating jurisdictions to the Board of Directors of the Peninsula School District and the general public. Hazard Mitigation Plan Presentation for University Place School District May 13, 2019
District Office Board and Conference Room
Planning Team member Torey Heidelberg presented the history of this project, the All Hazard Mitigation Plan Requirements, the Plan process, the Plan benefits, and a list of the participating jurisdictions to the Board of Directors of the University Place School District and the general public. Hazard Mitigation Plan Presentation for Clover Park School District July 22, 2019
District Office Board and Conference Room
Planning Team member Randy Granum presented the history of this project, the All Hazard Mitigation Plan Requirements, the Plan process, the Plan benefits, and a list of the participating jurisdictions to the Board of Directors of the Clover Park School District and the general public.
Table 1-32 Elected Official’s Meetings – Special Purpose District Group
Hazard Mitigation Plan Presentation for Riviera Community Club (Water Utility) 3/30/2019
Riviera Community Administration Building
Planning Team member John Cammon presented the history of this project, the All Hazard Mitigation Plan Requirements, the Plan process, the Plan benefits, and a list of the participating jurisdictions to the Riviera Community Club Board of Directors and the general public. Hazard Mitigation Plan Presentation for Crystal River Ranch Association February 6, 2020
Crystal River Village Homeowners Association
Gary Castell presented the history of this project, the All Hazard Mitigation Plan Requirements, the Plan process, the Plan benefits, and a list of the participating jurisdictions to the Crystal River Ranch HOA Board of Directors and the general public Hazard Mitigation Plan Presentation for Taylor Bay Beach Club PAGE 1-47 REGION 5 ALL HAZARD MITIGATION PLAN – 2020-2025 EDITION BASE PLAN
June 8, 2019
Taylor Bay Beach Club
Planning Team member Don Tjossem presented the history of this project, the All Hazard Mitigation Plan Requirements, the Plan process, the Plan benefits, and a list of the participating jurisdictions to the Board of Directors of Taylor Bay Beach Club and the general public.
Table 1-33 Elected Official’s Meetings – Utility Group
Hazard Mitigation Plan Presentation for Mt View-Edgewood Water Company January 16, 2019
Mt View-Edgewood Water Headquarters
Planning Team member Mike Craig presented the history of this project, the All Hazard Mitigation Plan Requirements, the Plan process, the Plan benefits, and a list of the participating jurisdictions to the Board of Directors of Mt View-Edgewood Water Company and the general public. Hazard Mitigation Plan Presentation for Fruitland Mutual Water Company March 19, 2019
Fruitland Mutual Water Headquarters
Planning Team member Ted Hardiman presented the history of this project, the All Hazard Mitigation Plan Requirements, the Plan process, the Plan benefits, and a list of the participating jurisdictions to the Fruitland Water Company Board of Directors and the general public. Hazard Mitigation Plan Presentation for Valley Water District April 2, 2019
Valley Water Headquarters
Planning Team member Sean Vance presented the history of this project, the All Hazard Mitigation Plan Requirements, the Plan process, the Plan benefits, and a list of the participating jurisdictions to the Valley Water Board of Directors and the general public. Hazard Mitigation Plan Presentation for Clear Lake Water District June 23, 2020
Clear Lake Water Headquarters
Planning Team member Robert Popek presented the history of this project, the All Hazard Mitigation Plan Requirements, the Plan process, the Plan benefits, and a list of the participating jurisdictions to the Board of Directors of Clear Lake Water District and the general public. Hazard Mitigation Plan Presentation for Spanaway Water Company June 24, 2020
Lakeview Light & Power Headquarters
Planning Team member Mark Hamon presented the history of this project, the All Hazard Mitigation Plan Requirements, the Plan process, the Plan benefits, and a list of the participating jurisdictions to the Board of Directors of Lakeview Light & Power and the general public.
PAGE 1-48 REGION 5 ALL HAZARD MITIGATION PLAN – 2020-2025 EDITION BASE PLAN
Hazard Mitigation Plan Presentation for Firgrove Mutual June 13, 2019
Firgrove Mutual Headquarters
Planning Team member Larry Jones and Steve Sacksteder presented the history of this project, the All Hazard Mitigation Plan Requirements, the Plan process, the Plan benefits, and a list of the participating jurisdictions to the Firgrove Mutual Board of Directors and the general public. Hazard Mitigation Plan Presentation for Peninsula Light Company September 9, 2019
Peninsula Light Company Headquarters
Planning Team member Amy Grice presented the history of this project, the All Hazard Mitigation Plan Requirements, the Plan process, the Plan benefits, and a list of the participating jurisdictions to the Peninsula Light Company Board of Directors and the general public. Hazard Mitigation Plan Presentation for Parkland Light & Water Company May 29, 2019
Parkland Light & Water Company Headquarters
Planning Team member Susan Cutrell presented the history of this project, the All Hazard Mitigation Plan Requirements, the Plan process, the Plan benefits, and a list of the participating jurisdictions to the Parkland Light & Water Board of Directors and the general public. Hazard Mitigation Plan Presentation for Lakewood Light & Power June 24, 2020
Lakewood Light & Power Headquarters
Planning Team member Mark Hadman presented the history of this project, the All Hazard Mitigation Plan Requirements, the Plan process, the Plan benefits, and a list of the participating jurisdictions to the Board of Directors of Lakewood Light & Power and the general public
Table 1-34 Elected Official’s Meetings – Medical Group
Hazard Mitigation Plan Presentation for Western State Hospital June 5, 2019
Western State Hospital
Planning Team member Linda Horey presented the history of this project, the All Hazard Mitigation Plan Requirements, the Plan process, the Plan benefits, and a list of the participating jurisdictions to the Western State Hospital Board of Directors and the general public. Hazard Mitigation Plan Presentation for Kaiser Permanente September 27, 2019
Kaiser Permanente
Planning Team member Alex Truchot presented the history of this project, the All Hazard Mitigation Plan Requirements, the Plan process, the Plan benefits, and a list of the participating jurisdictions to the Kaiser Permanente Board of Directors and the general public. PAGE 1-49 REGION 5 ALL HAZARD MITIGATION PLAN – 2020-2025 EDITION BASE PLAN
Planning Team member presented the history of this project, the All Hazard Mitigation Plan Requirements, the Plan process, the Plan benefits, and a list of the participating jurisdictions to the Tacoma-Pierce County Health Department Board of Directors and the general public.
Final Elected Official’s Meetings The Final Elected Official’s Meetings serve as a part of the pre-adoption review process. These meetings were done close to the end of the process to review all the draft documentation with the Elected Officials prior to submitting the plans for approval to Washington State Emergency Management Division (EMD) and FEMA. Once the plans are approved by State EMD and FEMA, each jurisdiction will pass a resolution adopting their plan.
Public Comment Pierce County Department of Emergency Management (PCDEM) coordinated the plan process that involved 76 jurisdictions. This design allowed for a greater level of inter-jurisdictional coordination and involvement. The Planning Team used the Pierce County Hazard Mitigation Forum distribution list to notify all jurisdictions about the plan status and updates. The Planning Team provided many opportunities for public comment throughout the ongoing and open process. Beginning in March 2019, the Planning Team published information about the process on the Plan’s PCDEM Webpage2 where it notified the public of the process, the progress, and any changes or upcoming meetings. The Planning Team also published information on the Plan process by way of links to jurisdiction websites where available. The Planning Team held informational meetings to provide a further opportunity for intrajurisdictional public involvement and to solidify the support of each jurisdiction. Representatives from each jurisdiction and from PCDEM presented the Hazard Mitigation Plan Requirements, the plan process, the plan benefits, and the various jurisdictions’ area plan status. Pierce County Emergency Management developed the Community Preparedness Survey to determine how prepared a jurisdiction’s citizens are and collect any suggestions provided for mitigating local hazards. The Community Preparedness Survey has been available since November 11, 2019 and continues to all residents of Pierce County. The first question in the survey asks residents what jurisdiction they live in so that individual’s responses can be counted for a specific jurisdiction. Pierce County Department of Emergency Management has access to the database of survey results and monitors them regularly to provide updates to jurisdictions that have advertised the link on their website and/or social media. This method of public outreach provides a more inclusive approach to communities that may not be able to attend inperson meetings like traditional outreach events that have been held in the past. Providing both a physical meeting and an online option ensures that the whole community is being involved in the planning process for each of the jurisdictions. Each jurisdiction was tasked with providing their own public outreach for public comment of their mitigation plan and they occurred in many different ways. Capitalizing on scheduled PAGE 1-50 REGION 5 ALL HAZARD MITIGATION PLAN – 2020-2025 EDITION BASE PLAN
events within their communities ensured an audience to engage the public in the mitigation plan update. Hazard maps were prepared for many jurisdictions to post at these events to make citizens aware of the hazards within their community and to engage them in conversations on how to best prepare for these hazards and ways to mitigate them. These events ranged from Preparedness Fairs, Farmers Markets, National Night Out, Farm Tours and even in the foyer of City Council meetings. Each jurisdiction documented these outreach events in their mitigation plans any many provided pictures and brochures advertising the event. The documentation can be found in the Process Section of individual jurisdictional plans as well as Appendix E which was created for additional documentation of these events.
Profile Process The Profile Section of the base plan covers Region 5. Since Region 5 is synonymous with Pierce County, the Profile Section utilizes Pierce County data to paint a portrait in narrative form of the Region. Compiling information from many sources the Profile section covers the Region’s demographics, geography, geology, climate, land use, transportation, and economy. Since each jurisdiction covered in the plan is part of the overall Region and since many of the hazards affect every jurisdiction it is necessary to understand their relationship to each other across the Region. Within each individual jurisdiction’s plan the Profile Section paints a comprehensive picture of the jurisdiction through a series of tables, a base map, and the jurisdiction’s Mission and/or Vision Statement. Information came from documents, information provided by the jurisdiction, collaboration with other agencies, and internet research as appropriate. Each jurisdiction supplied their Mission and/or Vision Statement, a list of the services they provide, an infrastructure summary, and some budgetary information. Other information was acquired leveraging existing County documents. All of this information was reviewed and updated according to any new information brought forth by each jurisdiction.
Services Summary In regard to the services provided, the cities, towns, and fire districts were given a survey to fill out regarding their particular jurisdiction. For the School Group, a statement was compiled using base information from the Washington Office of the Superintendent for Public Instruction (OSPI). This information was put into narrative format and each of the school districts in the Planning Group agreed that it was an appropriate picture of the services they provide. This statement was then reproduced in the school group’s profiles. A statement was compiled by like purveyors such as Water Districts, Water Companies, and Power and Light Companies. The Planning Team created a draft and worked until all agreed with the final product. Because some of the utilities are private, non-profit, and some are utility districts, the services statements can vary somewhat but each jurisdiction arrived at a services statement. Each of the jurisdictions in the Special Purpose Districts was tasked to develop a services statement that most clearly brought forth a clear picture of the services they provide. Some of these changed considerably from the original plans for these jurisdictions. Pacific Lutheran PAGE 1-51 REGION 5 ALL HAZARD MITIGATION PLAN – 2020-2025 EDITION BASE PLAN
University developed a comprehensive services statement speaking to their curriculum. And the Port of Tacoma used their media relations people to draft an appropriate statement regarding their various services. Each jurisdiction provides specific services which they documented for their individual profile sections. For the unincorporated areas of Pierce County and Pierce County Government, an extensive list of services provided was developed much like those of the Cities and Towns. These are portrayed in a chart in their plan. Most of these services did not change extensively but were reviewed with the 2019 update.
Geo-Political Summary The Geo-Political Summary information was derived from the Pierce County GIS application, CountyView Pro (2019/2020). The Base Map that follows is also a product of CountyView Pro (2019/2020). Updated information on individual jurisdiction’s boundaries was incorporated to create the current maps and to provide the most current information for this review.
Population Summary Data from the 2010 census was used for the demographics and from the 2007 County Buildable Lands Report for the 2022 projections. The Special Populations numbers were derived from the Pierce County GIS application, CountyView Pro also using the 2010 census. With this update many jurisdictions had issues with our using the 2010 Census data because they are so old. Unfortunately it is the best available data until the 2020 census is released sometime in 2021. At that time many of the analysis data can be updated to reflect more current numbers. A Demographic Profile Section was added so that jurisdictions could reflect more accurate population number they service with this update. This also included developing a more accurate portrayal of their special populations to include more than just an age group. For school districts this allowed them to capture their student, teacher, administrative staff and others more accurately than taking population numbers based off their district boundaries. Demographic information for Fire and Utility Groups was obtained through the Pierce County GIS application, CountyView Pro (2019/2020) using a geoprocessing derivative. Through a process of special analysis using parcels within the jurisdiction and calculating the information from those parcels, we were able to obtain base information for each jurisdiction. This includes Special Populations information. As for other Special Populations (Table 2-5 with each jurisdictional addendum), in the case of School Districts, the numbers are derived from tax parcels whose centers are within selected jurisdictions in the planning process. Using specific geoprocessing, it was possible to determine these figures. All data is taken from the 2010 Census for Pierce County. For the Special Purpose Districts such as the universities, the Port of Tacoma and Pierce Transit, information was obtained through the Pierce County GIS application, CountyView Pro (2019/2020) using a geoprocessing derivative. This was also the case for Special Populations. In some cases such as the Homeowners’ Associations we were able to get exact population information from them as well as using the Pierce County GIS application for enhanced data. PAGE 1-52 REGION 5 ALL HAZARD MITIGATION PLAN – 2020-2025 EDITION BASE PLAN
Infrastructure Summary General The number of parcels and value in each case was derived from the Pierce County GIS application CountyView Pro (2019/2020). In the case of Cities and Towns it is directly from the mapping process. In the case of the other jurisdictions, the information is derived from mapping the tax parcels whose centers are within selected jurisdictions. The Housing Summary is exactly the same and it should be noted there is more specific housing information available for the Cities and Towns. In the case of Cities and Towns, the housing information is from Census 2010, Washington State Office of Financial of Management (OFM). For all other jurisdictions, the information is derived from mapping the tax parcels whose centers are within selected jurisdictions and using geoprocessing to calculate housing numbers. All of this data was recalculated using new Census Data and most current information from other cited sources. Jurisdiction Infrastructure3 A small table of owned infrastructure for each jurisdiction was originally derived from the very comprehensive infrastructure survey and site visits that were completed for each jurisdiction for the previous plans. Each jurisdiction reviewed this information very carefully because many changes take place in infrastructure in a five-year period; infrastructure destroyed or removed; new structures added. Because of the sensitive nature of this information, only the total number of infrastructures identified is shown, basic categories of those structures, and total value as provided by the individual jurisdiction. These categories are based on the Department of Homeland Security Infrastructure Sectors.
Land Use Maps Because of the Land Use authority for Cities and Towns, these maps have been included in those profiles only. Current information was provided by the individual Cities and Towns for use in this project, but similar information is not available for the other jurisdictions.
Economic Summary The Fiscal Summary information was provided by the jurisdiction where available. This is the same among each of the groups. In addition, an Employment Profile and Unemployment table are provided for Cities and Towns only and the information is derived from the Census 2010, OFM. This information is not available for other types of jurisdictions.
Capability Identification Process The Disaster Mitigation Act 2000 requires a “review and incorporation, if appropriate, of existing plans, studies, reports, and technical information.” For the purposes of this plan, these elements are referred to as capabilities and their “review and incorporation” as a capability PAGE 1-53 REGION 5 ALL HAZARD MITIGATION PLAN – 2020-2025 EDITION BASE PLAN
identification. The capability identification provides a scope for what mitigation measures can and cannot be implemented and identifies specific capabilities that each jurisdiction has which may help in the implementation of mitigation measures. Further it identifies those actions already undertaken that mitigate hazards, whether labeled as such or not. The identification therefore canvases all aspects of each jurisdiction’s governance that relate both directly and indirectly to mitigation activities. The ability of a jurisdiction to develop an effective hazard mitigation plan depends upon its capability to implement policy and programs. The FEMA 386-34 publication describes a capability assessment and outlines the types of capabilities that should be considered: Legal and Regulatory Administrative and Technical Fiscal In the original development of this plan the categories were broken out, and that remains true for this update. Forms were developed and passed out to the local jurisdictions with five categories of capabilities identified. Some of the material on the lists was taken from previous mitigation plans and others from studies conducted by the Municipal Research and Services Center of Washington and other resources as noted. These were: Legal and Regulatory Capabilities Administrative Capabilities Technical Capabilities Fiscal Capabilities Specific Capabilities Since the lists are specifically targeted at local capabilities the planning team amassed information on federal and state programs, grants, and other assistance that would supplement the local capabilities. Each jurisdiction was asked to answer yes or no to the type of capability listed. Quite a bit of work was done on most of these lists to make them more comprehensive for our purposes. For the final page on Specific Capabilities they were asked to fill in the blanks on the name of the capability for their jurisdiction. Some jurisdictions did not have any specific capabilities that were not already listed, but many were able to enhance their lists using this category. Once the information was reviewed and received from the local jurisdictions it was compiled in the tables in the individual jurisdiction’s sections and then finalized with them.
Risk Assessment Process PAGE 1-54 REGION 5 ALL HAZARD MITIGATION PLAN – 2020-2025 EDITION BASE PLAN
Various methodologies are available to facilitate risk assessment. A common approach was needed to enable the setting of mitigation priorities both within and among jurisdictions. The Region 5 planning team originally developed a framework that assesses risk as a function of threat, vulnerability, and consequence and that framework was utilized in this review as well. What follows is a description of the methodology of hazard/threat identification, vulnerability analysis, and consequence analysis.
Hazard Identification A primary part of the Region 5 Risk Assessment is identifying the Region’s hazards. The hazard identification process used for this assessment is derived from the PCDEM Hazard Identification and Risk Assessment (HIRA) Process. The HIRA uses Risk Assessments from individual jurisdictions, Pierce County’s computer mapping software, scientific studies and papers, and interviews with local hazard experts and Region 5 officials to develop a list of hazards and the risk they pose for the individual jurisdictions. The process actually began after Congress passed the DMA 2000; PCDEM began updating its Hazard Identification Vulnerability Assessment (HIVA) using “best available science and information.” In early October 2001, DEM convened a series of 1-2-hour workshops over a two-day period, during which prominent regional earth scientists, and other professionals, presented current information about known hazards, and facilitated discussion of mitigation measures. This process was repeated in the HIRA October of 2015 with a full day workshop and again in May of 2019 (for additional details on the 2019 workshop refer to page 1-33). Each of the 19 hazards was discussed and validated for their frequency of occurrence, impact to area and economic impacts. In addition focused discussions centered on health/safety, environmental impacts and operational preparedness/vulnerabilities for each of the hazards. The workshops increased the participants’ understanding of the devastating potential of some hazards, e.g., lahars, and raised the issue of providing an adequate definition for “hazards”. Some natural conditions have the potential to cause loss of life, property damage, environmental impacts, but may not become “disasters”. As a result, the following definitions were developed and confirmed to determine which natural hazards should be addressed by the original mitigation plan. •
Hazard: a condition, natural or human-caused, which has the potential to threaten human life, property, and the environment.
•
Vulnerability: the probability that any physical, structural, socioeconomic, or environmental element will be damaged, destroyed, or lost to a natural or human-caused hazard.
•
Disaster: occurs when a hazard impacts a community and outstrips that community’s ability to cope with injury, death, property damage, environmental impacts, or disruption to essential functions. It is the intersection of a hazard with the human environment that produces a disaster.
Since the purpose of the plan is to mitigate disaster, DEM reduced the hazard list to: PAGE 1-55 REGION 5 ALL HAZARD MITIGATION PLAN – 2020-2025 EDITION BASE PLAN
•
Single, infrequent events which cannot be anticipated or predicted, and whose potential for loss of life, property, and environment is significant to the community, and;
•
Repetitive events that can be predicted with reliability within days or hours, and cause injury or death, property damage, or environmental impacts.
After assessing new hazard maps produced by Pierce County’s computer mapping software and interviews with County officials and local hazard experts5, the list of potentially disastrous natural hazards to the County was updated to the following ten natural hazards: •
Avalanche
•
Climate Change
•
Drought
•
Earthquake
•
Flood
•
Landslide
•
Severe Weather
•
Tsunami and Seiche
•
Volcano
•
Wildland/Urban Interface Fire
In addition, this update continues the technological/man-made hazards in the County within Addendum plans. Those nine technological hazards identified within the County are as follows: •
Abandoned Mines
•
Civil Unrest or Disturbance
•
Dam Failure
•
Energy Emergency
•
Epidemics and Pandemics
•
Hazardous Materials
•
Pipeline Hazards
•
Terrorist Incidents PAGE 1-56 REGION 5 ALL HAZARD MITIGATION PLAN – 2020-2025 EDITION BASE PLAN
•
Transportation Accidents
Evaluating the hazards that were listed and consolidating the storms section into one category was decided on by the planning group. Once the decision was made on which hazards to cover, extensive research was done to further update the HIRA with the latest information available. The decision was also made to add material on Climate Change as a natural hazard even though it is not something we can mitigate very easily. The Planning Team believes that the various officials’ experiences within the area, as well as their capabilities to derive reasonable estimates of the geographic area at risk and the potential impacts of the hazard, is adequate for the purposes of this planning effort. The recurrence probabilities were based on best available science, historic records when available, and information from local hazard experts. For some hazards, like severe weather or floods, historic records are more frequent. For others, like volcanic eruptions or spontaneous lahars, the record has to be read from the geologic evidence and therefore the recurrence rate can only be determined over time by scientific inquiry. Recurrence of technological hazards is difficult to predict as they are immediate and even though there is a history of these hazards in the County, it would be impossible to know very far into the future when they might occur again. After each hazard was profiled in the Risk Assessment, a consequence analysis of its effects on different portions of the County was added. That section asks seven questions that evaluated the overall impact on the Region. These are: •
How is the health and safety of persons in the affected area at the time of the incident affected?
•
How is the health and safety of personnel responding to the incident affected?
•
How is the jurisdictions continuity of operations affected and can it continue to deliver services to the impacted area?
•
What is the effect on the jurisdiction’s property, facilities and infrastructure?
•
What are the effects on the environment?
•
How will the economic/financial environment be impacted?
•
How will the public’s confidence in a jurisdiction be impacted or changed?
The Jurisdictions Hazard Identification Once the updated Hazard Identification was completed, the hazard evaluations were done for the individual jurisdictions. New Hazard maps were produced for those hazards that had adequate information to do so and matched against the jurisdictions. The Planning Team PAGE 1-57 REGION 5 ALL HAZARD MITIGATION PLAN – 2020-2025 EDITION BASE PLAN
produced the maps using data from the following agencies: U.S. Geological Survey (USGS); National Oceanic and Atmospheric Administration (NOAA); Pierce County Water Programs; Pierce County Planning and Land Service, FEMA; Washington State Department of Ecology (DOE); Washington State Department of Natural Resources (DNR), and any maps provided by the individual jurisdictions. Spatial analysis was completed for each jurisdiction when possible and the threat to the population, land, and improved property was placed on tables in each jurisdiction’s section. Using a table format, this section portrays the threats via a table of past incidents and declarations per specific hazard. This information includes impacts to property, facilities, and infrastructure in the entire jurisdiction whether or not owned by the jurisdiction. Four decisions were made that affect the tables in the Risk Section of each jurisdiction’s addendum. First, the earthquake threat section of the table is determined by the soft or liquefiable soils. It should be noted that the entire County has an earthquake threat, but that will not show up on the table only the expected areas that will experience enhanced shaking. Second, the tables showing the volcano threat are looking at the lahar threat, not the threat from other volcanic hazards like tephra. The potential area threatened by tephra will also include the entire Region. Third, the entire County would be affected by Climate Change and although real, this is not a hazard whose consequences can be mapped at this time. Finally, the tables show the Wildland Urban Interface (WUI) threat as a “N/A” due to the lack of current data to substantiate and produce jurisdictional hazard maps or “Insufficient GIS data to draw numbers from at this time or map susceptible areas”. This does not imply the hazard does not exist within Pierce County. Currently the best available science data only identifies two checker boarded WUI areas in the Ashford and McKenna area, along with a small area around Greenwater. This data is from the Department of Natural Resources with the theme based on data from the current National Fire Protection Association (NFPA 299), risk assessment. The publication is dated September 2004 and multiple Fire Chiefs within Piece County have expressed concern that this is outdated and does not accurately portray the WUI hazard within their fire districts. Pierce County Emergency Management is trying to secure the funding to update this data and will work with the necessary agencies to ensure the accuracy and relevancy of the data collected for future identification of WUI hazard areas within Pierce County. As a result there may be jurisdictions currently that identify WUI as a hazard they are vulnerable to and develop mitigation measures accordingly to mitigate their hazard. Following the hazard identification and mapping, jurisdictions were then asked to put contents to the maps and tables created of their risks and how do these hazards affect their critical infrastructure and population. What have they experienced within these hazards already? How can they be reduced in the future? Are there things they can do now to lessen or eliminate the risk? All critical questions that will help guide in the development of mitigation strategies and substantiate the necessity of them. Vulnerability The vulnerabilities are portrayed using information derived from the Pierce County mapping system County View Pro and determining the following information for each jurisdiction by hazard or threat: •
General Exposure PAGE 1-58 REGION 5 ALL HAZARD MITIGATION PLAN – 2020-2025 EDITION BASE PLAN
•
Population Exposure
•
Infrastructure Exposure
Due to the variable nature of many hazards some jurisdictions, like the City of Gig Harbor may be at risk from a tsunami but have no risk from a lahar. In contrast, for some others, like Fire District #18, the risk from these two hazards is the exact opposite. Yet both jurisdictions have similar risks from severe weather. To determine the vulnerability of a jurisdiction, the location and extent of each hazard was applied spatially to the jurisdiction profile. The analysis describes exposure of population, both generally and categorically, to each hazard. The analysis also describes exposure of general infrastructure, in terms of property and value, to each hazard. Using this spatial analysis, a jurisdiction can track the overall effects of vulnerability reduction measures by determining the change in exposure of population and property to specific hazards. These data were reviewed for changes and new information. The risk assessment considers all three components of risk and is conducted at three levels: the jurisdiction level, the population level, and the infrastructure level. At the jurisdiction level, the assessment considers the fundamental characteristics of the population and property within the jurisdiction to determine vulnerability and consequence of a given threat. Table 4-2 in each addendum shows the area in square miles of the jurisdiction and the parcels and then breaks down those numbers by the hazards or threats that affect that jurisdiction. Added here are the additional technological hazards as identified. At the population level, Table 4-3 in each addendum shows the total population of the jurisdiction and then breaks down the population by specific hazard or threat. This information has been updated according to the 2010 Census and to include the new threats were possible. At the infrastructure level, the assessment considers the land value, improved value, and total assessed value of the jurisdiction and using GIS information calculates for each hazard or threat in the given jurisdiction. Table 4-4 in each plan shows the updated general infrastructure exposure. The Planning Team conducted a vulnerability assessment for each jurisdiction. Both threatbased and asset-based methods were used to determine the vulnerability of infrastructure to hazards. To determine the threat-based vulnerability, the location, extent, and historical impact of each hazard is applied to the infrastructure. The result is a determination of the infrastructure’s exposure and previous experience in relation to each hazard. This is found in the Infrastructure Hazard Vulnerability Analysis Table found in each jurisdiction’s Risk Assessment Section. Consequence Analysis Consequence Analysis asks: How would the identified hazard events damage or disrupt each jurisdiction? When discussing the effects of an incident one must include not just the immediate damage, but the consequences of the disruption both short and long term. The seven questions in the Base Risk Assessment also form the basis of the consequence analysis in the individual jurisdiction’s Risk Assessment. In this case for each of the ten natural PAGE 1-59 REGION 5 ALL HAZARD MITIGATION PLAN – 2020-2025 EDITION BASE PLAN
hazards and nine technological hazards profiled a “yes” or “no” answer was asked for each of the following: •
Impact to the Public?
•
Impact to the Responders?
•
Impact to COG or COOP in the Jurisdiction?
•
Impact to Property, Facilities and Infrastructure?
•
Impact to the Environment?
•
Impact to the Jurisdiction’s Economic Condition?
•
Impact to the Public Confidence in the Jurisdiction’s Governance?
The results of this are shown in the Consequence Analysis Chart that appears in Tables 4-5a, 4-5b and 4-5c in each jurisdiction’s addendum.
Hazus-MH Overview of Hazus-MH The Planning Team decided to incorporate Hazus-MH 2.1 for further earthquake risk analysis. Hazus-MH is a nationally applicable standardized methodology that contains models for estimating potential losses from earthquakes, floods, and hurricanes. Hazus-MH uses Geographic Information Systems (GIS) technology to estimate physical, economic, and social impacts of disasters. Hazus-MH was developed by the Federal Emergency Management Agency (FEMA) under contact with the National Institute of Building Sciences (NIBS). NIBS maintain committees of wind, flood, earthquake and software experts to provide technical oversight and guidance to Hazus-MH development. Loss estimates produced by Hazus-MH are based on current scientific and engineering knowledge of the effects of hurricane winds, floods, and earthquake. Estimating losses is essential to decision-making at all levels of government, providing a basis for developing mitigation plans and policies, emergency preparedness, and response and recovery. Hazus-MH uses state-of-the-art GIS software to map and display hazard data and the results of damage and economic loss estimates for buildings and infrastructure. Hazus-MH provides for three levels of analysis: •
A Level 1 analysis yields a rough estimate based on the nationwide database and is a great way to begin the risk assessment process and prioritize high-risk communities.
•
A Level 2 analysis requires the input of additional or refined data and hazard maps that will produce more accurate risk and loss estimates. Assistance from local emergency PAGE 1-60 REGION 5 ALL HAZARD MITIGATION PLAN – 2020-2025 EDITION BASE PLAN
management personnel, city planners, GIS professionals, and others may be necessary for this level of analysis. •
A Level 3 analysis yields the most accurate estimate of loss and typically requires the involvement of technical experts such as structural and geotechnical engineers who can modify loss parameters based on to the specific conditions of a community. This level analysis will allow users to supply their own techniques to study special conditions such as dam breaks and tsunamis. Engineering and other expertise is needed at this level.
Hazus-MH Earthquake Model The Hazus-MH Earthquake model provides loss estimates of damage and loss to buildings, essential facilities, transportation and utility lifelines, and population based on scenario or probabilistic earthquakes. The model addresses debris generation, fire-following, casualties, and shelter contents, inventory, and building interiors. The earthquake model also includes the Advanced Engineering Building Module for single-and-group-building mitigation analysis. The Planning Team chose three earthquake scenarios to model using the Hazus-MH Earthquake model program with a Level 2 analysis; a 7.1M earthquake on the Tacoma Fault, 7.2M earthquake on the Nisqually Fault and a 7.2M earthquake on the SeaTac Fault. The Tacoma Fault will directly impact Pierce County as the fault runs horizontally and diagonally through the County. Additionally the Nisqually Fault and the SeaTac Fault were chosen to model as these faults will also impact the county. Hazus-MH incorporates ShakeMaps into the earthquake model. ShakeMaps are a representation of ground shaking produced by an earthquake and focus on the ground shaking produced by the earthquake whereas earthquake magnitude and epicenter are describing the parameters of the earthquake source. Scenario ShakeMaps produced by U.S. Geological Survey (USGS) were used in these three scenarios. After running the earthquake scenarios the planning team decided to model the Direct Economic Loss for the general building stock in Pierce County for each earthquake scenario and these maps are located in Appendix D of the jurisdictional plans with the exception of the Hospital Plans. Theirs are located in Appendix E. The total dollar values are based on the 2010 census tract level for Pierce County and represent the dollar loss per census tract. Additionally, maps of the Essential Facilities which include, fire stations, police stations, hospitals and schools were created for each of the jurisdiction within the City/Town group and care located in their Appendix D for each modeled scenario event. These maps are based on the percent of functionality that a facility will be operational. The Planning Team decided to use a 90% confidence level for all modeling and the maps display all four essential facilities within their boundaries if in existence. Not all the cities and towns had hospitals, schools, fire stations or police stations within their jurisdictional boundaries. All 76 jurisdictions within this same appendix also have the essential facilities for Pierce County mapped and based on the 90% functionality per single Essential Facility per each modeled earthquake scenario. This allowed for a broader spectrum to analyze that data and potential damage to neighboring cities or towns for future planning purposes. PAGE 1-61 REGION 5 ALL HAZARD MITIGATION PLAN – 2020-2025 EDITION BASE PLAN
Future Hazus Flood Modeling will be done for the City of Orting, City of Sumner, City of Puyallup and the City of Fife. Once the analysis is complete a detailed overview will be included within this Process Section and Risk Section of the mitigation plan.
Mitigation Strategy Process Region 5 Mitigation Goals The hazard mitigation strategy includes a description of mitigation goals to reduce or avoid long-term vulnerabilities to the hazards identified, natural and man-made, in the Risk Assessment. The mitigation strategy identifies and analyzes a comprehensive range of specific mitigation measures to reduce the effects of each hazard. The development of a mitigation strategy begins with a thorough study of the hazards and subsequent risk identified in each jurisdiction specific to their citizens, infrastructure and facilities. Cities and towns have taxing authority and other streams of revenue that other jurisdictions in the planning project do not have available to them. We found the goals for a city and a school district to be somewhat similar to those of a water district or a special purpose district. All serve citizens, all have significant infrastructure and those that depend upon it and all have concerns regarding safety, security, prevention of loss and education regarding hazards. Each of the jurisdictions had the opportunity for input to rank the goals in the order that was appropriate for them. The goals the group has selected for the Region 5 All Hazard Mitigation Plan are as follows: Protect Life and Property Ensure Continuity of Operations Establish and Strengthen Partnerships for Implementation Protect the Environment Increase Public Preparedness for Disasters Promote a Sustainable Economy
These goals are keeping in alignment with FEMA goal categories and the mitigation goals from Washington State EMD. FEMA Mitigation Goal Categories
Washington State Mitigation Goals
Prevention
Protect Life
Property Protection
Protect Property
Public Education and Awareness
Promote a Sustainable Economy
Natural Resource Protection
Protect the Environment
PAGE 1-62 REGION 5 ALL HAZARD MITIGATION PLAN – 2020-2025 EDITION BASE PLAN
Emergency Services
Increase Public Preparedness for Disasters
Structural Projects The FEMA categories of “Prevention,” “Property Protection,” and “Structural Projects” were combined to a broader goal of “Protect Life and Property.” The remaining three categories generally remained. The County also added two other categories: “Establish and Strengthen Partnerships for Implementation” and “Promote a Sustainable Economy.” Because Pierce County is a “home rule” county, partnerships for implementation are important in ensuring that a coordinated effort in mitigation planning and implementation be undertaken and the sharing of geo-political boundaries. And because of Pierce County’s unique vulnerabilities, this Plan contains a goal for economic sustainability. Each of the jurisdictions considered their mission statement, community education, public understanding of risks, the impact to the environment and their ability to fund and implement mitigation measures. Over the course of several meetings the jurisdictions also learned how to prioritize the mitigation measures that they developed. Because of the way projects are funded, the jurisdictions were strongly encouraged to make every effort to have several ‘shovel-ready’ projects ready to go in the event short-term funding opportunities became available.
Region 5 Mitigation Objectives In the past, our Mitigation Plans have been weak in the development of objectives. Because this project is a review of existing plans, we believe it is important to revisit this process and improve on those practices used in the past to establish objectives to meet the goals we have selected. Unlike goals, objectives are specific, measurable, and narrower in scope. We asked the Planning Teams to consider the following in developing their objectives: •
These are your jurisdictions objectives
•
What are the hazards that your jurisdiction is threatened by?
•
What are you trying to protect?
•
Who are you trying to protect?
•
Who do you provide service to?
•
Who do you rely on for service?
•
Consider existing plans (comprehensive, facilities plan, etc.). We don’t want to create objectives that are contradicting an existing element of your jurisdiction
•
Think in terms of action verbs!
In addition to providing some type of framework to address the above questions we offered specific solid example objectives and potential mitigation measures so the jurisdictions could then develop their own objectives based off these criteria. Doing this provided consistency PAGE 1-63 REGION 5 ALL HAZARD MITIGATION PLAN – 2020-2025 EDITION BASE PLAN
amongst the jurisdictions on a broader scale yet allowed for individual jurisdictions to develop their own objectives taking into consideration all their factors. To Protect Life and Property •
Implement activities that assist in protecting lives by making homes, businesses, infrastructure, critical facilities, and other property more resistant to all hazards.
•
Reduce losses and repetitive damages for chronic hazard events while promoting insurance coverage for catastrophic hazards.
•
Improve hazard assessment information to make recommendations for encouraging preventative measures for existing development in areas vulnerable to all hazards.
Mitigation Measures: 1. Develop Emergency Management Program 2. Retrofit/replace vulnerable buildings. 3. Emergency Home Repair Program. 4. Build to a building code. To Provide/Ensure Emergency Services •
Establish policy to ensure mitigation projects for critical facilities, services, and infrastructure.
•
Strengthen emergency operations by increasing collaboration and coordination among public agencies, non-profit organizations, business, and industry.
•
Coordinate and integrate hazard mitigation activities, where appropriate, with emergency operations plans and procedures.
Mitigation Measures: 1. Developing Emergency Response Plans 2. Implementing a mass casualty incident plan 3. Install siren warning system To Increase Public Awareness and Education/To Increase Public Preparedness for Disasters •
Develop and implement education and outreach programs to increase public awareness of the risks associated with all hazards.
•
Provide information on tools, partnership opportunities, and funding resources to assist in implementing mitigation activities.
Mitigation Measures: PAGE 1-64 REGION 5 ALL HAZARD MITIGATION PLAN – 2020-2025 EDITION BASE PLAN
1. Dispense preparedness guidebooks. 2. Promote NOAA Weather Radios. 3. PCNET/CERT communities. To Establish and Strengthen Partnerships for Implementation •
Strengthen communication and coordinate participation among and within public agencies, citizens, non-profit organizations, business, and industry to gain a vested interest in implementation.
•
Encourage leadership within public and private sector organizations to prioritize and implement local, county, and regional hazard mitigation activities.
Mitigation Measures: 1. Work with Pierce County and other jurisdictions on implementing flood mitigation measures. 2. Work with jurisdictions with land use authority to reduce vulnerability to all hazards. 3. Coordinate lahar and tsunami evacuation planning and route maintenance with responsible jurisdictions. To Restore/Protect/Preserve Natural Resources •
Balance watershed planning, natural resource management, and land use planning with hazard mitigation to protect life, property, and the environment.
•
Preserve, rehabilitate, and enhance natural systems to serve hazard mitigation functions.
Mitigation Measures: 1. Salmon habitat and wetland protection. 2. Preserving cultural/historical resources. 3. Forestry improvements. To Promote a Sustainable Economy • •
Provide incentives and resources for mitigation planning Continue critical business operations
Mitigation Measures 1. Help critical businesses develop continuity of operations plans. Some objectives may not be based solely on the results of the loss estimation, but also on social and environmental values, political desires, historic preservation concerns, and/or state PAGE 1-65 REGION 5 ALL HAZARD MITIGATION PLAN – 2020-2025 EDITION BASE PLAN
mitigation priorities and funding opportunities. For example, a community with a large tourism industry may be more interested in protecting historic or commercial assets first rather than protecting other assets that demonstrate a higher vulnerability to hazards. The format that was chosen for the Goals and Objectives for each jurisdiction is as follows: Goal #1: Explanation of first goal. Objectives: • • •
List of objectives that accomplish Goal #1. List of objectives that accomplish Goal #1. List of objectives that accomplish Goal #1.
Goal #2: Objectives: Explanation of second goal. • • •
List of objectives that accomplish Goal #2. List of objectives that accomplish Goal #2. List of objectives that accomplish Goal #2.
Region 5 Mitigation Measures: Identification and Evaluation The Mitigation Strategy includes components that identify and analyze a comprehensive range of specific mitigation measures that reduce the effects of one or more hazards. Based upon their objectives and aided by the Risk Assessment and Capability Identification done and reviewed for each jurisdiction, the individual jurisdiction Planning Team members reviewed their identified jurisdiction-specific mitigation measures. To help achieve each of the planning goals, the Plan identifies original and updated mitigation measures–specific actions or projects that help mitigate risk for each jurisdiction. The planning process of data-collection, research, and public participation leads to the development of these measures. This process ensures that the measures speak to the risks and that these measures be implementable. The Risk Assessment is central to the process of selecting mitigation measures from the Plan’s goals; especially in this review where we have added technological hazards. The outcomes of the Risk Assessment illustrate the hazards to which each jurisdiction has the most vulnerability. The Risk Assessment provides focus for the Plan’s goals through identification of the jurisdiction’s vulnerability to specific hazards. A review of existing mitigation measures was conducted to determine those measures that were accomplished in the past five years and to assess new or additional measures that should be added in this review process. After hazards are identified using Pierce County Department of Emergency Management’s GIS Mapping Program, each jurisdiction is assigned and therefore responsible to identify a planning PAGE 1-66 REGION 5 ALL HAZARD MITIGATION PLAN – 2020-2025 EDITION BASE PLAN
team and potential mitigation measures. Specific information on the existing Mitigation Planning Team is located in Appendix B for each of the 76 jurisdictions. Once the measures are identified, they are further defined in terms of the goals they address as well as the hazards they mitigate. Evaluation of the measures follows their identification and definition. Using the Capability Identification, the Planning Team evaluated the list of measures with regards to each measure’s ability to be implemented. Through meetings and review of other local mitigation plans, the Planning Team, in addition to the hazards addressed, selected the following eight categories to comprehensively evaluate each measure: 1. Goal(s) Addressed What mitigation goals, as developed by each jurisdiction, does the measure address? 2. Cost of Measure How much will the measure cost to implement? 3. Funding Source and Situation What is the potential funding source? Choose the statement(s) below that most accurately defines the funding situation for the proposal: •
Funding could be obtained through local budget.
•
Funding could be obtained through state or federal grants.
•
Funding could be accomplished with local budgets or grants.
•
No potential funding sources can be readily identified.
4. Timeline How long will it take to implement? Measures include ongoing, short-term, and long-term activities. Each measure includes an estimate of the timeline for implementation: •
Ongoing measures are activities which the jurisdiction is already implementing.
•
Short-term measures are activities which the jurisdiction is capable of implementing with existing resources and authorities within one to two years.
•
Long-term measures may require new or additional resources or authorities and may take between one and five years to implement.
5. Benefit Does it benefit all jurisdictions and/or is it Facility Specific? 6. Life Expectancy of Measure PAGE 1-67 REGION 5 ALL HAZARD MITIGATION PLAN – 2020-2025 EDITION BASE PLAN
How long will the measure last? 7. Community Reaction Choose the statement(s) that most accurately describes how the community would react to the implementation of the proposal: • • • • •
The proposal is likely to be endorsed by the entire community. The proposal would benefit those affected, with no adverse reaction from others. The proposal would be somewhat controversial. The proposal would be strongly opposed by most. The proposal would be strongly opposed by nearly all.
A measure’s ability to be implemented is illustrated in Categories 2 (Cost of Measure), 3 (Funding Source and Situation), and 4 (Timeline). The extent to which a measure would mitigate one or multiple hazards is addressed in Category 1 (Goals Addressed) which further helps to encapsulate the jurisdiction’s unique vulnerabilities and needs. The issue of the number of hazards addressed is also inherent in Category 5 (Benefit). For cost-benefit review, categories 2, 3, and 5 directly address cost. Category 6 (Life Expectancy of Measure) directly address benefit. Category 7 (Community Reaction) indirectly considers both potential costs and potential benefits of the measure in terms of public opinion. The evaluation process involved meetings in which the Planning Team discussed the measures with specific attention paid to their definitions, the ability of the measures to be implemented, the extent to which they address the hazards in the jurisdictions, and their cost-effectiveness. In addition for 2019 update, tables were added below each mitigation strategy so that an update status could be provide whether a measure was completed, ongoing, partially completed or being deferred. A comment section was provided for explanation of progress in the strategy. If the measure is completed or deferred it was removed from the jurisdictions Section 5 plan and placed in Appendix E. This was a new appendix created for this purpose to retain historical records of progress in their plans. Deferred strategies can be placed back in Section 5 at any time the jurisdictions choose. This allows Section 5 to stay an active relevant working document for the jurisdiction to work from while retaining records of completed strategies. Following the evaluation of mitigation measures is their prioritization.
Mitigation Measures: Prioritization The updated measures having been identified, defined, and evaluated; the rest of the process involves prioritization. The process relies upon the identified risks and vulnerabilities, the planning team’s local expertise, public participation, each jurisdiction’s needs and capabilities, a cost/benefit review, and input from the chief elected officials. Over the course of several weeks, the Planning Team presented, outlined, categorically defined, and prioritized each mitigation measure. This is represented in the updated plan using a coding system, as well as having the mitigation measures in priority order in the plans. PAGE 1-68 REGION 5 ALL HAZARD MITIGATION PLAN – 2020-2025 EDITION BASE PLAN
In order to promote implementation of the measures, they are grouped based on the level at which they will be implemented, as described in the Plan Maintenance Section. These levels are: • • • •
Startup Mitigation Measures: Those mitigation measures already in existence within the jurisdiction and including the maintenance of the mitigation plan. Hazard Mitigation Forum (HMF): Multi-jurisdictional implementation mechanism. Jurisdiction-Wide Mitigation Measures: Mechanism depends on jurisdiction. Public Education Mitigation Measures: Localized level based on targeted communities and their needs and vulnerabilities.
The measures are prioritized within each implementation category. In order to provide consistency, the evaluation process, including the eight categories, was used as the basis for the prioritization of measures. This allows for emphasis on the extent to which each measure is cost-effective. While it may be important to emphasize a positive benefit-cost review in the prioritizing of mitigation measures, it is also important to emphasize the influence of local political factors, community needs and values, historic properties, and habitat and environmental issues upon the selection of specific mitigation measures. Therefore, the prioritization process addresses each jurisdiction’s unique needs, expressed here in terms of the measure’s ability to be implemented and the extent to which it would mitigate one or more relevant hazards. After presentation and discussion, the Planning Team members from each jurisdiction prioritized their existing and new mitigation measures based on goals addressed, with special attention paid to the measure’s benefit-cost review, its ability to be implemented, and the extent to which it would mitigate one or multiple relevant hazards. Following the public meeting and any necessary changes, the new and updated mitigation measures were included in the plan. In so doing, the public, the respective chief elected officials, and the Planning Team aided in the development of a long-term, cost-effective, environmentally sound, and sustainable mitigation strategy.
Infrastructure Summary Process The infrastructure section is not a required element of the local hazard mitigation plan but is instead optional. The Planning Team determined that this section should be developed in order to make the plan a more comprehensive blueprint for reducing the potential losses identified in the plan’s risk assessment. Consequently, the existing Infrastructure Sections were updated in this current review. The infrastructure section is exempt from public disclosure pursuant to RCW 42.56.420. Requests for public disclosure of this section or parts thereof should be referred immediately to the appropriate representative as shown in Tables 1-1 through 1-7 of this section.
Definition PAGE 1-69 REGION 5 ALL HAZARD MITIGATION PLAN – 2020-2025 EDITION BASE PLAN
The Planning Team determined that the plan should include, but not be limited to, those infrastructures that fit FEMA’s definition of a “critical facility.”6 Other infrastructures that are not necessarily critical will play a role in disaster response and recovery. Each jurisdiction further included infrastructure that should not fail, or will be important for the community’s welfare, such as sewage treatment plants, or infrastructures necessary for the functioning of the jurisdiction, such as schools (which can also be shelters).
Identification Individual jurisdictions were asked to review the infrastructure they had identified in their original plan and determine if any changes needed to be made. A lot can change in five years in all of our planning groups; buildings can be torn down or abandoned and new structures built. A template modified from “Mitigation 20/20" was created for each jurisdiction to use in listing their infrastructure and revisited during this review. Members of the Planning Team and facility representatives filled out the templates for any new structures or systems and identified those that should be removed from the plans. This in turn helped develop the updated hazard identification and risk information for given locations. This assessment was intended to rely on the best judgment of the representative about the facility, its environment, and its functioning. Each jurisdiction has review and updated their critical infrastructure with the 2019 upate.
Profile Fundamental information was required for each piece of infrastructure. In order to gather the information a template was developed to identify the individual pieces of infrastructure. It includes the following information: • • • • • • • • • • •
Address of infrastructure Shelter: Yes or No Auxiliary Power Source Year Built Number of floors if structure Major remodels, upgrades or additions Insured value Occupancy day and night Population served Homeland Security Infrastructure Category7 Critical within 72 hours or not
Once the infrastructure had been identified, the Planning Team originally visited each jurisdiction, met with the representative, took a tour of each location with respect to photographing the infrastructure, and identified the hazard vulnerability of the infrastructure. The assessment was not intended to require detailed engineering information or studies, or to necessarily require onsite inspections or measurements. It was simply intended to rely on the best judgment of individual(s) with knowledge about the building or system, its environment, and its function. For the review of this section, infrastructure was not revisited but we relied on the representative and the use of detailed maps to determine risk and hazard vulnerability. PAGE 1-70 REGION 5 ALL HAZARD MITIGATION PLAN – 2020-2025 EDITION BASE PLAN
Infrastructure Summary Each Infrastructure Section begins with a summary table of total infrastructure and total value as assigned by the jurisdiction through their budgetary process and found in Table 6-1 for each of the addendums. This value was updated according to current infrastructure listed and current assessed value or insured value.
Infrastructure Category Summary Using the primary Homeland Security Infrastructure Segments, the infrastructure from each jurisdiction was categorized and listed according to the primary category of each location. In some cases, categories were broken down further into type of infrastructure within a category. This information is depicted in Table 6-2 for each of the addendums. This table was also updated according to current information.
Infrastructure Dependency Summary A table was compiled using the six primary dependencies for any jurisdiction: Emergency Services, Power, Sewer, Telecommunication, Transportation, and Water. When the site visits took place, each piece of infrastructure was evaluated on the basis of these six categories. New structures or infrastructure has also been evaluated using these six categories. Table 6-3 for each of the addendums is a summary of how many pieces of infrastructure fall into each category and assigns percentages as well.
Infrastructure Hazard Summary Another table was compiled using all hazards identified for Region 5 in this planning effort; including the new hazards where applicable. When the site visits were originally completed, each piece of infrastructure was evaluated on the basis of the nine hazards. We have now reassessed these structures and any additional infrastructure in the light of all hazards now being used in our Risk Assessment. Table 6-4 for each of the addendums is a summary of how many pieces of infrastructure fall into each category and assigns percentages to those hazard categories.
Dependency In addition to the four categories of capabilities for each jurisdiction, there is an additional table, Table 6-5 for each of the addendums, which illustrates the primary external departments, agencies, and organizations the individual jurisdictions depend upon to do business on a daily basis. These charts have been updated to reflect any changes in services.
Vulnerability Assessment The Planning Team also conducted numerous vulnerability assessments during the planning period. These assessments built on the nine hazards previously identified, the additional hazards added in this document, and the risk they pose to each jurisdiction’s infrastructure. The vulnerability assessment process examines more specifically how the identified hazard events would damage or disrupt the currently identified facilities. PAGE 1-71 REGION 5 ALL HAZARD MITIGATION PLAN – 2020-2025 EDITION BASE PLAN
The Planning Team developed a form based on “Mitigation 20/20” routines to conduct vulnerability assessments for the various pieces of infrastructure. A total of twenty-five qualitative numeric criteria were utilized in the assessments. This meant that each of the identified infrastructures was evaluated with respect to all identified hazards and the six primary dependencies utilized in this plan review. Each piece of infrastructure was given a rating for each hazard and dependency of from 0 to 3 with 0 being no vulnerability to that particular and 3 being the highest vulnerability. These ratings were listed in the large infrastructure matrix, Table 6-6 for each of the addendums, and also a complete list of the basis for these ratings is shown in Tables 6-7 and 6-8 for each of the addendums also. The following scale was devised for the ratings. 0-1
→
Low Hazard/Dependency Vulnerability Rating
(L)
2
→
Medium Hazard/Dependency Vulnerability Rating
(M)
3
→
High Hazard/Dependency Vulnerability Rating
(H)
The Infrastructure Section is a summary product compiled and updated by the infrastructure owners and the Planning Team showing the composite vulnerabilities score and ratings of each piece of infrastructure in the respective jurisdictions. For some infrastructure, information was unavailable due to time restraints and fiscal resources. This information will be gathered in the next five years. A “TBD” (To Be Determined) is used to show that the infrastructure information will be gathered in the future.
Plan Maintenance Process The planning process is the foundation of breaking the disaster cycle. For each jurisdiction the plan that has been developed, reviewed, and updated is a beginning; a beginning on the path to a disaster resistant community. However it is essential that a plan be a living document, evaluated, updated or revised as necessary. The Plan Maintenance process is a means to do this. The initial review of the plan will be a “Pre-Adoption Review” allowed by State EMD and FEMA. State EMD and FEMA will review the Region 5 Hazard Mitigation Plan and either approve it subject to adoption or require some changes along with adoption prior to final approval. Once this is complete, each jurisdiction will then formally adopt the newly updated plan and resubmit it for final approval. The Plan Maintenance Section details the formal process that will guarantee the plan remains an active and relevant document. It includes: • • • •
Documentation of the plan’s formal adoption (Each jurisdiction’s Appendix A); A schedule of monitoring, evaluating, and updating within a five-year cycle; A process for submitting the plan to State EMD and FEMA at the end of the five-year cycle in 2020; An explanation of how each jurisdiction intends to incorporate the mitigation strategies outlined in the plan into existing mechanisms; and PAGE 1-72 REGION 5 ALL HAZARD MITIGATION PLAN – 2020-2025 EDITION BASE PLAN
•
A process for integrating public participation into plan maintenance procedures.
PAGE 1-73 REGION 5 ALL HAZARD MITIGATION PLAN – 2020-2025 EDITION BASE PLAN
PAGE 1-74 REGION 5 ALL HAZARD MITIGATION PLAN – 2020-2025 EDITION BASE PLAN
PAGE 1-75 REGION 5 ALL HAZARD MITIGATION PLAN – 2020-2025 EDITION BASE PLAN
Endnotes i
State and Local Mitigation Planning How-to Guide, Getting Started: building support for mitigation planning, FEMA 386-1, September 2002, p. 3-1. 2
https://my.co.pierce.wa.us/3180/Hazard-Mitigation-Plan-Update - Hosted by Pierce County Department of Emergency Management 3
The Infrastructure Section is exempt from public disclosure pursuant to RCW 42.56.420. Request for public disclosure of this document or parts thereof should be referred immediately to the Person identified in the local jurisdiction’s Annex. 4
FEMA 386-3 State and Local Mitigation Planning How-to Guide: Developing the Mitigation Plan: Identifying Mitigation Actions and Implementation Strategies, April 2003, P.2-6 5
Individual hazard experts and emergency officials referenced in the Hazards Workshop include: Cindy Miron
Tacoma Pierce County Health Department
Richard Smith
U.S. Army Corps of Engineers
Helmut Schmidt
P.C. Planning and Public Works – Surface Water Management Division
Brynne Walker
P.C. Planning and Public Works – Surface Water Management Division
Kathy Vatter
Washington State Department of Transportation
Ashley Blazina
Washington DNR
Mitchell Hillman
Critical Infrastructure Cyber Security Consultants
Stephen Slaughter
Washington DNR
Dave Byers
Washington State Department of Ecology
Corina Forson
Washington DNR
Crystal Raymond
University of Washington Climate impacts Group
6
Critical Facilities: Can be broken into 5 categories: Essential Facilities are critical to the health and welfare of the population and that are especially important following hazard events. They include hospitals and other medical facilities, police and fire stations, EOCs, evacuation centers, and schools. Transportation Systems include airways – airports, heliports; highways – bridges, tunnels, roadbeds, overpasses, transfer centers; railways – trackage, tunnels, bridges, rail yards, depots; and waterways – canals, locks, seaports, ferries, harbors, dry-docks, and piers. Lifeline Utility Systems include potable water, wastewater, oil, natural gas, electric power and communication systems. High Potential Loss Facilities include such things as dams, nuclear power plants and military installations. Hazardous Materials Facilities include facilities housing industrial/hazardous materials. State and Local Mitigation Planning: Understanding Your Risks” Publication 386-2, August 2001, p. 3-9 PAGE 1-76 REGION 5 ALL HAZARD MITIGATION PLAN – 2020-2025 EDITION BASE PLAN
7
Not all Homeland Security Categories were given as options, only those that the jurisdictions would fall under. These included: Emergency Services, Telecommunications, Transportation, Water, Energy, Government, and Commercial.
PAGE 1-77 REGION 5 ALL HAZARD MITIGATION PLAN – 2020-2025 EDITION BASE PLAN
(This page left blank intentionally)
PAGE 1-78 REGION 5 ALL HAZARD MITIGATION PLAN – 2020-2025 EDITION BASE PLAN
SECTION 2 REGION 5 HAZARD MITIGATION PLAN 2020-2025 EDITION PROFILE SECTION Table of Contents TABLE OF CONTENTS .............................................................................................1 HISTORY .................................................................................................................2 DEMOGRAPHICS .....................................................................................................3 LANGUAGES .................................................................................................................... 4
TRANSPORTATION ..................................................................................................8 SIX TYPES OF DISABILITY MEASURED .................................................................................... 9
EDUCATION .......................................................................................................... 11 GEOLOGY ............................................................................................................. 11 GEOGRAPHY/TOPOGRAPHY .................................................................................. 12 CLIMATE ............................................................................................................... 14 ECONOMY ............................................................................................................. 14 RESOURCE DIRECTORY ........................................................................................ 16 LOCAL ..........................................................................................................................16 REGIONAL/STATE ............................................................................................................16 NATIONAL .....................................................................................................................16
ENDNOTES ............................................................................................................ 17
PAGE 2-1
REGION 5 ALL HAZARD MITIGATION PLAN – 2020-2025 EDITION BASE PLAN
History While Native Americans have lived in the Pierce County area for thousands of years, the recorded history of Pierce County dates back to the voyages of British Captain George Vancouver. He explored and mapped Puget Sound in 1792, spending time in Pierce County and naming its main geographic and geologic formation Mt. Rainier after his friend Peter Rainier. The Native American population had various names for the mountain amongst them “Tahoma," "Tacobet," "Tuwouk" and "Tacoba”.1 Later, beginning in 1833 the Hudson Bay Company initially established a fort and trading post near the mouth of the Nisqually River. This first structure was a 15x20 foot storehouse.2 In 1843 it was moved to a point on the high ground three miles north of the Nisqually River. A replica of Fort Nisqually, including two of the original buildings has been reconstructed at Point Defiance Park in Tacoma. Between the time of Vancouver’s voyages and the beginning of the Hudson Bay Company furtrading operations in the 1830s, the area remained largely unknown. Ft. Nisqually and Ft. Steilacoom were later established to provide protection to settlers. Ft. Steilacoom, established in 1849, was the first military base on Puget Sound and later, in 1854, became the first incorporated town in what later became Washington State. Immigration increased from the late 1840s onward. Agriculture and lumbering grew rapidly and on Dec. 22, 1852, the Territorial Legislature of Oregon created the County of Pierce out of Thurston County. Pierce County was named after the newly elected President Franklin Pierce. The Medicine Creek Treaty of 1854 took away many of the rights the Indians had to the land located in the Puget Sound Basin. This, combined with other complaints, led to open hostilities beginning in 1855 and lasting into 1856. One of the leaders of the Indian uprising was Chief Leschi. His arrest in 1856 for murder, and later his hanging in 1858 were controversial even at that time. A special historical court exonerated him of the charge in 2004, stating that as a combatant of war he “should not, as a matter of law, have been tried for the crime of murder.”3 In 1887, the Northern Pacific Railroad completed the first northern routed transcontinental railroad and located its western terminus at Tacoma. This event stimulated the shipping and manufacturing industries of the Puget Sound area, particularly Tacoma. Tacoma also became the headquarters for the Weyerhaeuser Company and a major Pacific shipping center. Lumber and farming fueled much of the early economy. The old growth forests of the Pacific Northwest were logged and the trees were either made into lumber used to construct the homes, businesses and much of the early infrastructure of the County, or in many cases, burned for fuel.4 Much of the lumber and raw logs were shipped to other cities or later overseas. Coal seams located in eastern Pierce County were mined beginning in the late 1870s and supported the development of a number of small towns on the outskirts of Mount Rainier. Eventually the cost of mining, combined with the use of oil as a major fuel, brought about the demise of the coal industry in Pierce County. PAGE 2-2
REGION 5 ALL HAZARD MITIGATION PLAN – 2020-2025 EDITION BASE PLAN
Farming, while initially for subsistence, eventually moved into the commercial realm. Ranging from small family farms to large scale businesses, they have included vegetables, berries, hops, rhubarb, egg producers and dairy cattle. Interest in the recreational potential in Pierce County began early. In 1883, James Longmire camped near several soda and iron springs at the base of Mt. Rainier. Longmire, seeing the economic potential, established Mount Rainier's first hotel at that site. Touting the value of the spring water and mineral water baths as a medical cure-all, his advertisements reached far and wide. Many came to be cured and found the peaceful scenery and surroundings just as wonderful. Finally on March 2, 1899, President McKinley signed an act establishing Mount Rainier National Park, the nation's fifth national park. The development of a substantial military complex has had a significant impact on the economy of Pierce County. Ft. Lewis was established in 1917 and McChord Air Force Base in 1938. Effective February 1st, 2010, these have now been transformed into Joint Base Lewis/McChord. In addition to a substantial active duty military population, many military personnel have returned to the area as permanent residents after completion of their military service. Towns and cities developed around the local economic structure, whether that was logging, coal, farming, lumber, shipping or the military. Today, much of this is changing. Coal is no longer mined; many farms have given way to industrial warehousing; and, lumber, while still a major contributor to the local economy is no longer the king that it once was.
Demographics Pierce County is the second most populous county in Washington, with twelve percent of the state’s population. Pierce County’s estimated population on April 1, 2019 was 888,300 based on data from the Washington State Office of Financial Management (OFM) (see Table 2-1 Pierce County Population Breakdown 2019). This population estimate is used for the allocation of selected State revenues and differs from the U.S. Census population estimate. For the purpose of hazard mitigation planning, the 2010 U.S. Census population estimate was 795,225 with 428,487 (54%) persons residing in the 24 incorporated cities and 366,738 (46%) residing in the unincorporated communities and areas. From the last update Pierce County’s population has grown 9.7% (77,000 people). Gig Harbor is the fasting growing city with a 44.8% increase since 2010. Using 2010 census data we find that 45%5 of Pierce County’s population now resides within 10 miles of Commencement Bay and the Port of Tacoma, the shipping and industrial hub of the County, see Map 2-4. This is down from 62.1% in 2000. This includes the Cities of Tacoma, Puyallup, Fife, Fircrest, University Place, Sumner, Gig Harbor and Lakewood. As population pressure has increased and land in close to the main economic centers has become more expensive and difficult to find there continues to be a gradual shift in population to what are
PAGE 2-3
REGION 5 ALL HAZARD MITIGATION PLAN – 2020-2025 EDITION BASE PLAN
more rural areas of the County. As the 2020 census data becomes available new maps will be created from an enlarged shift in rural population growth areas. According to the 2019 Point-In-Time Count for Pierce County, there were approximately 1,486 persons experiencing homelessness. Not all persons experiencing homelessness sleep outside (47 percent were in an emergency shelter, 28 percent were outdoors (tent, street), 11 percent were in transitional housing, 14 percent were in a vehicle, abandoned building, or other). Table 2-1 Pierce County Population 20196 *
Auburn Bonney Lake Buckley Carbonado DuPont Eatonville Edgewood Enumclaw** Fife Fircrest Gig Harbor Lakewood Milton* Orting Pacific* Puyallup Roy Ruston South Prairie Steilacoom Sumner Tacoma University Place Wilkeson Incorporated City Subtotal Unincorporated Pierce County Total
9,980 21,060 4,885 665 9,425 2,970 11,390 0 10,140 6,770 10,770 59,670 6,735 8,380 35 41,570 820 1,005 480 6,450 10,120 211,400 33,090 490 468,300 420,000 888,300
The 2010 census data show the following age distribution of people in the County: Table 2-2 Pierce County Population
Under 20 20-24 25-44 45-64 65 and over
25% 10% 28% 26% 11%
Languages There are 77 different languages spoken in Pierce County. RCW 43.62.030 states that the Office of Financial Management (OFM) shall annually determine the April 1 populations of all cities and towns of the state.
Department of Homeland Security (DHS) uses “safe harbor” provisions to recommend the threshold at which vital information should be translated for a language group. “Safe harbor” language *Portions of Pacific, Milton, Auburn and Enumclaw are located groups constitute five percent or 1,000 in Pierce County, while other sections are in King County. This people, whichever is less, of the brings the total number of incorporated cities with at least some population of persons eligible to be property in Pierce County to 24. Populations listed for the individual cities and towns are for Pierce County only and do not include King served or likely to be affected or County populations. encountered. Fewer than 50 persons in a **Although there are currently no residents of the Town of language group that reaches the five Enumclaw residing in Pierce County the City does have some park percent trigger must be provided written property within the boundaries of Pierce County. notice in the primary language of the LEP group of the right to receive competent oral interpretation of written public information, free of cost. PAGE 2-4
REGION 5 ALL HAZARD MITIGATION PLAN – 2020-2025 EDITION BASE PLAN
A population needs assessment was conducted in 2017. This assessment determined the selected languages and the ranking order of frequency for Pierce County. To make certain that the languages selected were accurate and verifiably representative of the limited English proficient populations in the County, the determination of the selected languages was a collaborative effort vetted by key stakeholders and several County departments that provide services to LEP populations on a regular basis. After evaluating the data sets, the selected languages are7: • • • • • • • • • • •
Spanish Korean Russian Vietnamese Cambodian (Khmer) Samoan Tagalog Ukrainian German; and Chinese (traditional and simplified) American Sign Language
PAGE 2-5
REGION 5 ALL HAZARD MITIGATION PLAN – 2020-2025 EDITION BASE PLAN
Map 2-1 Pierce County Population Concentration
PAGE 2-6
REGION 5 ALL HAZARD MITIGATION PLAN – 2020-2025 EDITION BASE PLAN
Map 2-2 Percent Speaking English Less Than Very Well: Pierce County 8
PAGE 2-7
REGION 5 ALL HAZARD MITIGATION PLAN – 2020-2025 EDITION BASE PLAN
Transportation Major transportation routes tend to run, with a few exceptions, close to the Port of Tacoma. The movement of goods to and from Pierce County is by water, rail, and road with a very limited amount by air. Interstate 5 and Highway 99 run north and south through the County and State Highway 16 connects the western portions of the County across the Tacoma Narrows with the rest of the County. State Highway 410 runs east through Sumner, Bonney Lake, and Buckley and then climbs over the Cascades to Yakima. Highway 512 acts as a loop highway, moving traffic around the more congested portions of the County, to Puyallup where it merges with Highway 167. Highway 167 initially begins at the southeast edge of Tacoma and follows the south side of the Puyallup River to Puyallup. Once joined by Highway 512 it continues east to Sumner and then into King County. Many other arterials and minor highways move traffic through the rest of the County. Rail lines follow three routes out of the County. The first follows the coast south to the Nisqually River and then south to Oregon and California. The second follows the Puyallup Valley first to the east and then north into King County and points north. The third runs south through the hills to Elbe on the Nisqually River. It crosses the river there into Lewis County and continues south to Morton. Two transcontinental railroad systems connect the County with the rest of the nation as do 30 interstate trucking companies.9 Airline transportation is 25 miles away, at Seattle/Tacoma International Airport, or at the small Tacoma Narrows Airport on the Kitsap Peninsula. There are also seven public airfields in the county. Transportation by water runs up Puget Sound either by large cargo ship or barges. Ferry service is necessary both for commuting and for the transportation of goods. Washington State Department of Transportation (WSDOT) and Pierce County operate ferries to Vashon Island, Anderson Island, and Ketron Island. The Washington State Department of Corrections operates both the McNeil Island Ferry and the McNeil Island Barge and Tug. Herron Island is serviced by a private ferry service. Regional transportation includes bus service extending from the state capital, Olympia, to the City of Seattle. The major transit hub near the Tacoma Dome connects the County with jurisdictions to the north and south. Also included in the Tacoma Dome Station is the Sounder which is light rail operated by Sound Transit from Tacoma to Seattle with stops in Puyallup, Sumner, Auburn, Kent, and Tukwila. About 5 percent of Pierce County households are car-free (as reported by the Puyallup Watershed Initiative Active Transportation using data from the Puget Sound Regional Council).
PAGE 2-8
REGION 5 ALL HAZARD MITIGATION PLAN – 2020-2025 EDITION BASE PLAN
83 percent of healthcare providers surveyed in Pierce County indicate that transportation to health care appointments is a problem for their patients (2014-15 Pierce County Aging and Disability Resources Area Plan Update, Special Needs Transportation Issue Area). Survey respondents reported transportation as one of the top three needs for older adults (49 percent) and people with disabilities (54 percent).10
Six types of disability measured Using data from the 2016 Behavioral Risk Factor Surveillance System (BRFSS), this is the first CDC report of the percentage of adults across six disability types: • • • • • •
Mobility (serious difficulty walking or climbing stairs) Cognition (serious difficulty concentrating, remembering, or making decisions) Hearing (serious difficulty hearing) Vision (serious difficulty seeing) Independent living (difficulty doing errands alone) Self-care (difficulty dressing or bathing)
One in four U.S. adults – 61 million Americans – have a disability that impacts major life activities, according to a report in CDC’s Morbidity and Mortality Weekly Report. The most common disability type, mobility, affects one in seven adults. With age, disability becomes more common, affecting about 2 in 5 adults age 65 and older.
PAGE 2-9
REGION 5 ALL HAZARD MITIGATION PLAN – 2020-2025 EDITION BASE PLAN
Map 2-3 Percent with a Disability: Pierce County
PAGE 2-10
REGION 5 ALL HAZARD MITIGATION PLAN – 2020-2025 EDITION BASE PLAN
Map 2–4 Electrical Dependencies – Health and Human Services empower Map 3.011
o
Education According to the US Census data public and private schools (K-12) account for 136,675 students during the 2014 school year, of which 128,409 are in the public school system and 8,266 enrolled in private schools.12 These numbers include two public schools located in Pierce County although the districts reside in other counties (King and Thurston).
Geology In the western and central area of the county, the upper crustal materials are predominantly glacial deposits (called drift) consisting of sediments laid down during the several cycles of glacial advance and retreat which have occurred during the past millennium. Vashon Age deposits cover the entire western and central areas with the exception of the walls and floors of
PAGE 2-11
REGION 5 ALL HAZARD MITIGATION PLAN – 2020-2025 EDITION BASE PLAN
the major valleys. These consist of isolated mudflow deposits and peat bogs. Bedrock, with a thin mantle of outwash and sand material, predominates within the eastern portion of the county. The Vashon Drift consists of water laid, stratified, granular material deposited in front of the advancing glacier (advance outwash) overlain by unsorted clay, silt, sand and gravel (till); in turn, overlapped by another blanket of granular stream deposits (recessional outwash). During the retreat of the glacier, glacial damming formed large temporary lakes. One of these ice-dammed lakes, occupying the Puyallup and White River valleys during the retreat of the Vashon ice, apparently discharged water and material across the plain between Tacoma and Eatonville. Deep channels as much as a mile wide were carved by the torrential discharge streams and a layer of coarse–grained poorly sorted material was laid down in a fan-shaped area from Chambers and Clover Creeks on the north to the Nisqually River and Muck Creek on the south.
Geography/Topography Pierce County’s extremely varied topography ranges from sea level to 14,411 feet at the summit of Mt. Rainier. The county is located in the west central part of the state and has a land area of 1,157,120 acres or 1,808 square miles. There are 118 square miles of water in the county excluding Puget Sound. Puget Sound divides the County, with the portion west of the Sound located on the Kitsap Peninsula. In addition, a number of islands in the southern Sound are incorporated in the county. The Puyallup and White River valleys are fertile regions comprising one of the most intensively cultivated areas in the state. This is, however, gradually giving away to commercial expansion. The water from all major rivers with headwaters on Mt. Rainier, with the exception of the Cowlitz and its tributaries draining the southeast corner of the mountain, flows into Puget Sound. They are the Puyallup, White, Nisqually, Mowich and Carbon Rivers. Of these, only the Nisqually and Puyallup actually enter Puget Sound. The White, Carbon and Mowich Rivers are all tributaries of the Puyallup and join it before it enters the Sound. The White River borders Pierce County to the north and drains the east side of the mountain. The Nisqually forms the southern border of the County and drains the south side of the mountain. With its tributaries, the Mowich and the Carbon, the Puyallup River contains the runoff from both the north and west sides of Mt. Rainier. It discharges their combined waters into Commencement Bay. There are numerous other rivers and creeks throughout the County. Commencement Bay, Pierce County’s principal port, is an arm of Puget Sound that allows easy access to the sea. The developed portions of the County are located near Puget Sound on gently rolling terrain formed from glacial outwash and till. The eastern portion of the County consists of foothills rising up to the crest of the Cascade Range, includes Mount Rainier National Park and is utilized primarily for timber production and recreation.
PAGE 2-12
REGION 5 ALL HAZARD MITIGATION PLAN – 2020-2025 EDITION BASE PLAN
The State and Federal governments control four large parcels of land within the County for a total of 436,776 acres or 38% of the total land area. (See Table Profile -1 Federal & State Large land Parcels in Pierce County.) In addition to these four, they also have a number of smaller parcels, such as the Washington State Soldiers’ Home and Colony in Orting, the Veterans Hospital at American Lake, and Mud Mountain Dam under control of the Army Corps of Engineers. Table 2-3 Federal & State Large Land Parcels in Pierce County
Joint Base Lewis/McChord
91,616 Acres
Snoqualmie National Forest (Pierce County Portion)
144,749 Acres
Mt. Rainier National Park (Pierce County Portion)
196,168 Acres
Included within the boundaries of Pierce County are 361 lakes greater than one acre in size. One hundred and sixty-two of these are above 2,500 feet in elevation. National forests, 225 miles of saltwater shoreline, the abundance of lakes and other recreational opportunities contribute to an excellent quality of life in Pierce County.
Anderson Island, McNeil Island and Fox Island are the three major islands within the county and McNeil Island 4,243 Acres lie west of Tacoma and Steilacoom. Anderson and McNeil Islands can be reached only by ferry or boat. There is a connecting bridge to Fox Island. Anderson Island has a resident population of only a few hundred people, but during the summer months, this population can swell to several thousand people. There are no medical facilities on either Anderson or Fox Islands. However, emergency medical technicians and paramedics are available through the resident fire service. McNeil Island is a state correctional facility.
PAGE 2-13
REGION 5 ALL HAZARD MITIGATION PLAN – 2020-2025 EDITION BASE PLAN
Climate The climate of Pierce County is generally mild. The Cascade Mountains to the east block cold winter air and the Willapa Hills and the Olympic Mountains to the west remove much of the moisture from many Pacific storms before they reach the lowland areas of the County. Definite seasons are evident, with the rainy season generally from October through April. Precipitation on the western and central portions of the County is usually in the form of rain, with occasional snow during the winter, while the eastern portion of the County is subject to a very heavy winter snowpack. This snowpack melts each spring with the exception of the upper slopes of Mt. Rainier, where snow remains year–round, locked up in an extensive glacier system. Tacoma’s average rainfall is approximately 37 inches per year, most of which falls between October and April. Average daily high temperatures range between 46.6 degrees in December and 76.6 degrees in August.13 Precipitation in the mountainous areas of the eastern part of the county is well over 100 inches per year. See Climate Change chapter for more information.
Economy Tacoma, the county seat, is the third largest city in the state, Pierce County’s principal center for urban concentration and functions as the primary center for industry and trade. It is served by three major transcontinental railroads, federal and state highways and a deep-water port. Pierce County is well situated for industrial, commercial and residential growth. The primary industries in the Pierce County economy are aerospace, government, healthcare, manufacturing, military, transportation and logistics. The lumbering and wood products industry has become more sophisticated with plywood and paper production increasing in importance. Military support activity has fluctuated in the past. The newly created Joint Base Lewis/McChord points to continued strength in this sector. The impact of the military, state and local government, the school system and the health services system can be seen in Table Profile3 Pierce County Top 20 Employers – 2018. These few areas make up the top twenty employers in the County. As in the rest of the country, the service sector has grown over the past few decades. Much effort has been expanded in recent years in developing a more broadly-based economy. The Port of Tacoma has attracted many new industries, as well as major shipping firms. However, the ship and boat building industry waned somewhat during the final decade of the 20th century. Shipping, general commerce, and agriculture, with its heavy seasonal employment in the berry and bulb crops, are important contributors to the economy. However, as our local economy continues to shift from an agricultural to a manufacturing and service economy, the ratios will change. PAGE 2-14
REGION 5 ALL HAZARD MITIGATION PLAN – 2020-2025 EDITION BASE PLAN
Pierce County has long been the home of the University of Puget Sound and Pacific Lutheran University. The Evergreen State College Tacoma Campus, Tacoma Community College, Pierce College and the University of Washington-Tacoma provide additional educational opportunities, as do several private business colleges and vocational technical schools. Table 2-4 Pierce County Top 20 Employers – 201814
Rank 1 2 3 4 5 6 7 8 9 10 11 12 13 14 15 16 17 18 19 20
Organization
Employees
Industry
Joint Base Lewis McChord
53,000
Military
MultiCare Health System
7,705
Healthcare
State of Washington
7,621
Government
CHI Franciscan Health System
6,786
Healthcare
City of Tacoma and Tacoma Public Utilities
3,591
Tacoma Public Schools
3,333
Government and Utility Services Education
Puyallup Tribe and Emerald Queen Casino
3,312
Government and Gaming
Pierce County Government
3,089
Government
Puyallup School District
2,190
Education
Bethel School District
2,028
Education
State Farm
1,637
Insurance
Boeing
1,550
Aerospace Manufacturing
Clover Park School District
1,446
Education
United States Postal Service
1,336
Government
DaVita
1,184
Healthcare
Milgard Manufacturing
990
Manufacturing
Kaiser Permanente
755
Healthcare
Columbia Bank
704
Banking
Regence
565
Healthcare
Toray Composite Materials, America
565
Retail
Source: Tacoma Pierce County Economic Development Board
The continued expansion of the wood products industry, manufacturing, food processing, industrial development, and service industries combined with the expansion of the Port of Tacoma, are expected to cause substantial future population growth in Pierce County. U.S. Census 2017 estimate figures show that the median Pierce County household income was $63,881, which was $2,293 lower than the median for Washington State. Low income also shows 10.2 percent of Pierce County household residents were below the poverty level. This is .1 percent below the State average.15
PAGE 2-15
REGION 5 ALL HAZARD MITIGATION PLAN – 2020-2025 EDITION BASE PLAN
Resource Directory Local o Economic Development Board for Tacoma-Pierce County http://www.edbtacomapierce.org/Default.aspx
o Pierce County http://www.co.pierce.wa.us/index.aspx?NID=27
o Tacoma-Pierce County Chamber of Commerce http://www.tacomachamber.org/index.aspx
Regional/State o Office of Financial Management http://www.ofm.wa.gov/default.asp
o Puget Sound Regional Council https://www.psrc.org/sites/default/files/trend-population-201808.pdf
o Washington Tracking Network https://fortress.wa.gov/doh/wtnibl/WTNIBL/
National o DATA USA https://datausa.io/profile/geo/pierce-county-wa/
o Health and Human Services https://empowermap.hhs.gov/
o National Agricultural Statistics Service https://quickstats.nass.usda.gov/
o National Climatic Data Center http://www.ncdc.noaa.gov/
o U.S. Census Bureau http://www.census.gov
PAGE 2-16
REGION 5 ALL HAZARD MITIGATION PLAN – 2020-2025 EDITION BASE PLAN
Endnotes 1
How Mount Tacoma became (sic) Mount Rainier, Rob Carson, The News Tribune, originally published 1999, online 10/25/07, updated 02/16/2009, http://www.thenewstribune.com/2007/10/08/174144/how-mount-tacomabacame-mount.html 2 Fort Nisqually Living History Museum, Metro Parks Tacoma, http://www.metroparkstacoma.org/page.php?id=825 3 Nisqually Chief Leschi is hanged on February 19, 1858, HistoryLink.org Essay 5145, at http://www.historylink.org/index.cfm?DisplayPage=output.cfm&file_id=5145 4 Pierce County – Thumbnail History, HistoryLink.org Essay 8001, http://www.historylink.org/index.cfm?DisplayPage=output.cfm&file_id=8001 5
Of the 795,225 Pierce County residents reported on the 2010 census 357,870 or 45% live within 10 miles of the Port of Tacoma administration building. Information from http://www.ofm.wa.gov/ 6
Forecasting & Research Division Office of Financial Management. (November 2014). State of Washington 2014 Population Trends. Retrieved March 14, 2015 from http://www.ofm.wa.gov/pop/april1/poptrends.pdf Population determinations contained in this document are developed by the Office of Financial Management (OFM) and represent the state’s official population figures. 7
The determination of the selected languages was a collaborative effort that was vetted by various stakeholders and several County departments including: the Assigned Council, Communications, Community Connections, the Family Justice Center, Human Resources, and the Interpreter Services Office (representing the courts). Input was also given by the City of Tacoma, the Tacoma/Pierce County Health Department, the Washington State Emergency Management Division, and Dynamic Language. Limited English proficiency strategy document published separately. 8
Figure was provided by Washington Department of Health and Social Services.
9
Ibid. p. 18.
10
2015 Pierce County Aging and Disability Resources Survey. Health and Human Services. HHS empower Map 3.0. Accessed April 28, 2020 from www.Empowermap.hhs.gov 12 Office of the Superintendent of Public Instruction (OSPI) 2014 student enrollment, October Enrollment Report http://www.k12.wa.us/DataAdmin/default.aspx 13 Average Annual Weather for Tacoma & Pierce County, Washington, by The Tacoma Regional Convention & Visitor Bureau, at http://www.traveltacoma.com/static/index.cfm?contentID=311 14 Pierce County Major Employers modified to reflect the change in Joint Base Lewis/McCord and the loss of the Russell Investment Firm to King County, Economic Development Board for Tacoma-Pierce County, http://www.edbtacomapierce.org/Default.aspx 15 Source U.S. Census Bureau: State and County QuickFacts. Data derived from Population Estimates, American Community Survey, Census of Population and Housing, State and County Housing Unit Estimates, County Business Patterns, Non employer Statistics, Economic Census, Survey of Business Owners, Building Permits. Last Revised: Thursday, 05-Feb-2015 13:17:49 EST Retrieved March 13, 2015 from http://quickfacts.census.gov/qfd/states/53/53053.html 11
PAGE 2-17
REGION 5 ALL HAZARD MITIGATION PLAN – 2020-2025 EDITION BASE PLAN
(This page left blank intentionally)
PAGE 2-18 REGION 5 ALL HAZARD MITIGATION PLAN – 2020-2025 EDITION BASE PLAN
Section 3 Capability Identification Requirements Planning Process---Requirement §201.6(b): An open public involvement process is essential to the development of an effective plan. Documentation of the Planning Process---Requirements §201.6(b): In order to develop a more comprehensive approach to reducing the effects of natural disasters, the planning process shall include: (3) Review and incorporation, if appropriate, of existing plans, studies, reports, and technical information. • Does the planning process describe the review and incorporation, if appropriate, of existing plans, studies, reports, and technical information? Assessing Vulnerability: Analyzing Development Trends---Requirement §201.6(c)(2) (ii)(C): [The plan should describe vulnerability in terms of] providing a general description of land uses and development trends within the community so that mitigation options can be considered in future land use decisions.] •
Does the plan describe land uses and development trends?
Identification and Analysis of Mitigation Actions: National Flood Insurance Program (NFIP) Compliance--Requirement §201.6(c)(3)(ii): [The mitigation strategy] must also address the jurisdiction’s participation in the National Flood Insurance Program (NFIP), and continued compliance with NFIP requirements, as appropriate. •
Does the new or updated plan describe the jurisdiction(s) participation in the NFIP?
PAGE 3-1 REGION 5 ALL HAZARD MITIGATION PLAN – 2020-2025 EDITION BASE PLAN
SECTION 3 REGION 5 ALL HAZARD MITIGATION PLAN 2020-2025 EDITION CAPABILITY IDENTIFICATION Table of Contents CAPABILITY IDENTIFICATION REQUIREMENTS.............................................. 1 TABLE OF CONTENTS ........................................................................................ 2 CAPABILITY IDENTIFICATION PROCESS ......................................................... 3 TYPES OF CAPABILITIES........................................................................................................................3 EXTRA-LOCAL FISCAL RESOURCES ...........................................................................................................5
FEDERAL CAPABILITIES ................................................................................... 6 STATE CAPABILITIES ...................................................................................... 12 LOCAL CAPABILITIES ..................................................................................... 13
PAGE 3-2 REGION 5 ALL HAZARD MITIGATION PLAN – 2020-2025 EDITION BASE PLAN
Capability Identification Process The Disaster Mitigation Act 2000 requires a “review and incorporation, if appropriate, of existing plans, studies, reports, and technical information.” For the purposes of these 76 jurisdictional plans, these elements are referred to as capabilities and their “review and incorporation” as a capability identification. The capability identification provides a scope to help determine the ease with which mitigation measures can and cannot be implemented. It identifies specific capabilities available for each jurisdiction that may help in the implementation of mitigation measures. This includes not just those that are specific to the jurisdiction, but also those that come from different levels of government such as the County, State, Tribal or Federal Government. For some jurisdictions it also identifies those actions already undertaken that mitigate hazards, whether labeled as such or not. The identification therefore canvasses all aspects of each jurisdiction’s government that relate both directly and indirectly to mitigation activities. For the update of the Base Plan, and the 76 Addenda under the Base Plan, a complete review was done for each capability section. In the previous plans a system of charts was developed whereby each group created an appropriate list of plans, studies, reports, and technical information. Because of the diversity of the planning groups, some of these charts required some updating and improvements to be more appropriate to the specific planning group.
Types of Capabilities The ability of a jurisdiction to develop an effective hazard mitigation plan depends upon its capability to implement policy and programs which is dependent on the type of jurisdiction. This ability comes from the different types of capabilities that a jurisdiction maintains. The FEMA 386 publication describes a capability assessment and outlines the types of capabilities that should be considered: • • •
Legal and Regulatory Administrative and Technical Fiscal
Legal and regulatory capabilities refer to the laws, regulations, authorities, and policies that govern current and potential mitigation measures. This can be broken down into two basic areas, local and extra-local. Local are those generated by the local governing agency that the jurisdiction has control over. Extra-local laws, regulations, etc. are those from a different level of government. Administrative and technical capabilities refer to a jurisdiction’s staff and technical resources, as well as completed plans and studies that have considered, directly or indirectly, the mitigation of natural hazards. Technical capabilities also include the existing electronic and systemic resources. Fiscal capabilities refer to the financial resources available to achieve the identified mitigation strategies. •
For the organizational purposes of this plan, administrative capabilities are organizations, agencies or departments responsible for implementing or partnering to PAGE 3-3 REGION 5 ALL HAZARD MITIGATION PLAN – 2020-2025 EDITION BASE PLAN
implement mitigation measures. The fiscal capabilities at the City level are thus correlated to the budgets and expenditures of these departments as well as the separate funds available for mitigation-related activities. •
For special purpose districts, fiscal capabilities center on levies, contracts, and grants.
For the purposes of this Plan the 76 jurisdictions have been placed into seven categories or groups of jurisdictions: Cities/Towns, Fire Districts, School Districts, Special Purpose Districts, Utility Providers, Health and Medical Organizations and Unincorporated Pierce County Government. In this update of the original Region 5 Hazard Mitigation Plan we have moved from the original 48 jurisdictions to include all jurisdictions that have completed mitigation plans within the past five years and are now being incorporated as Addenda to the original document. This brings the total plans for Region 5 to 76. Each of the jurisdictions has filled out a series of tables, specific to the individual group, listing different capabilities that they may have at the local level. A number of jurisdictions had capabilities that went beyond those on the tables. They then added their own capabilities either to that list or placed them on a final table labeled Specific Capabilities. The tables were: •
Local Legal and Regulatory: This section illustrates the legal parameters within which the seven categories of jurisdictions operate. For cities and towns and the County there is particular emphasis on the Comprehensive Plans and Development Regulations as these guide land use and building decisions. For special purpose districts, these authorities are much more limited and rely on the land use and development regulations enacted in the cities or County where they do business.
•
Local Administrative: This section identifies those segments of a jurisdiction that conduct activities related to mitigation and the studies, programs and projects in which the jurisdiction is engaged. A comprehensive list includes regional and local associations and relationships developed and collaborative programs with shared resources.
•
Local Technical: Identified here are the plans, studies, and reports that may have addressed risk and mitigation either directly or indirectly as technical capabilities. These can provide a mechanism through which mitigation measures can be implemented in the future.
•
Local Fiscal: For cities and towns and the County, this section deals with fiscal capabilities as well as department budgets, and project funding dictates much of what is accomplished. For special purpose districts, the scope is one of designating future responsibility with funding largely dependent on securing grants or issuing levies or bonds.
•
Local Specific: Each individual jurisdiction has listed in each of their respective plans some of their own specific capabilities, if applicable. The order of the individual jurisdiction capabilities follows that of the general capability identification and PAGE 3-4 REGION 5 ALL HAZARD MITIGATION PLAN – 2020-2025 EDITION BASE PLAN
follows the same format as these initial four types of capabilities: Legal and Regulatory, Administrative, Technical and Fiscal. In addition to the initial four tables or lists for each jurisdiction, there are State, and Federal Capabilities These are the regulations that dictate what a specified jurisdiction in Washington can and cannot pursue with regards to mitigation, as well as what assistance may be available. They essentially cover the same 4 capability areas that are covered in local capabilities: Legal and Regulatory, Administrative, Technical, and Fiscal. These capabilities are not listed with the individual jurisdictional plans. Rather they are contained in this Section of the Basic Plan and begin on Page 6 of this document. Many of these capabilities identify or modify those mechanisms that provide the basis for that which follows at the local level. The tables in the individual jurisdiction’s capabilities include many items, like land use regulations and building codes, that are mitigation measures in their own right. Many of these can be used as steppingstones to enable other projects that might not be possible without these initial capabilities. In summary, the information gathered by each jurisdiction in their capability section develops and identifies some current mitigation measures, identifies potential funding sources of new measures, identifies support mechanisms for implementation, and ensures agreement with existing plans, policies and studies. With this update, Region 5 has made efforts to develop a compendium of both natural and manmade capabilities to make the Region disaster resilient. The information gathered from these 76 jurisdictions is just the start of that process and we will continue to fine tune these capabilities going forward.
Extra-Local Fiscal Resources One of the key issues in implementing mitigation measures is finding sufficient monetary resources to do it. Fiscal resources in the form of grants are available to jurisdictions in pursuing hazard reduction activities. Grants may be administered from the federal or state level, and in some instances may be administered by the private or non-profit sector. Each grant has specific requirements and uses varying elements to conduct benefit-cost analysis. The purpose of the benefit-cost analysis is to determine if the benefits of the project exceed the costs of the project. Jurisdictions should coordinate with the administering agency to understand the program-specific requirements and conduct the required analyses. For example, if either Hazard Mitigation Grant Program (HMGP) or Pre-Disaster Mitigation (PDM) funding is involved in a hazard mitigation project, the jurisdiction involved will conduct a benefit-cost analysis based on guidelines provided by U.S. Department of Homeland Security, FEMA, and Washington Emergency Management Division on how to determine costeffectiveness of mitigation projects and how to calculate the benefit-cost ratio. Both the HMGP and PDM require a benefit-cost ratio of at least 1.0 for a project to be considered for funding. PAGE 3-5 REGION 5 ALL HAZARD MITIGATION PLAN – 2020-2025 EDITION BASE PLAN
Contained on the following pages are some of the major federal resources that currently may be used to secure funding to pursue implementation of mitigation measures. In addition there is a list of State agencies that have mitigation capabilities and, in some cases, have funds that can assist with mitigation projects. Because the funding source, available funding, requirements, and type and number of grants is constantly changing, this assessment will outline neither all potential grants nor the detailed requirements of those grants that are mentioned. The websites listed here were accessed and confirmed just prior to the finalization of this document.
Federal Capabilities The Federal Emergency Management Agency’s (FEMA) Mitigation Grant programs provide funding for eligible mitigation activities that reduce disaster losses and protect life and property from future disaster damages. Currently, FEMA administers the Hazard Mitigation Grant Program (HMGP), the Flood Mitigation Assistance (FMA) program, and the Pre-Disaster Mitigation (PDM) program, the Repetitive Flood Claims (RFC) program, and the Severe Repetitive Loss (SRL) program. FEMA's mitigation grants are provided to eligible Applicant States/Tribes/Territories that, in turn, provide sub-grants to local governments. The Applicant selects and prioritizes applications developed and submitted to them by local jurisdictions to submit to FEMA for grant funds. Prospective Sub-applicants should consult the official designated point of contact for their Applicant State/Tribe/Territory for further information regarding specific program and application requirements. For more information on the mitigation grant programs, see below:
Pre-Disaster Mitigation Grant Program (PDM) http://www.fema.gov/pre-disaster-mitigation-grant-program The PDM program provides funds to states, territories, Indian tribal governments, communities, and universities for hazard mitigation planning and the implementation of mitigation projects prior to a disaster event. Funding these plans and projects reduces overall risks to the population and structures, while also reducing reliance on funding from actual disaster declarations. PDM grants are to be awarded on a competitive basis and without reference to state allocations, quotas, or other formula-based allocation of funds.
Hazard Mitigation Grant Program (HMGP) http://www.fema.gov/hazard-mitigation-grant-program-hmgp The HMGP provides grants to States and local governments to implement long-term hazard mitigation measures after a major disaster declaration. The purpose of the HMGP is to reduce the loss of life and property due to natural disasters and to enable mitigation measures to be implemented during the immediate recovery from a disaster. The HMGP is authorized under Section 404 of the Robert T. Stafford Disaster Relief and Emergency Assistance Act.
PAGE 3-6 REGION 5 ALL HAZARD MITIGATION PLAN – 2020-2025 EDITION BASE PLAN
Flood Mitigation Assistance (FMA) Program http://www.fema.gov/flood-mitigation-assistance-program The FMA program was created as part of the National Flood Insurance Reform Act (NFIRA) of 1994 (42 U.S.C. 4101) with the goal of reducing or eliminating claims under the National Flood Insurance Program (NFIP). FEMA provides FMA funds to assist States and communities implement measures that reduce or eliminate the long-term risk of flood damage to buildings, manufactured homes, and other structures insurable under the National Flood Insurance Program.
Repetitive Flood Claims Program (RFC) http://www.fema.gov/repetitive-flood-claims-program The RFC grant program was authorized by the Bunning-Bereuter-Blumenauer Flood Insurance Reform Act of 2004 (P.L. 108–264), which amended the National Flood Insurance Act (NFIA) of 1968 (42 U.S.C. 4001, et al). Up to $10 million is available annually for FEMA to provide RFC funds to assist States and communities reduce flood damages to insured properties that have had one or more claims to the National Flood Insurance Program (NFIP).
Severe Repetitive Loss Program (SRL) http://www.fema.gov/severe-repetitive-loss-program The SRL grant program was authorized by the Bunning-Bereuter-Blumenauer Flood Insurance Reform Act of 2004, which amended the National Flood Insurance Act of 1968 to provide funding to reduce or eliminate the long-term risk of flood damage to severe repetitive loss (SRL) structures insured under the National Flood Insurance Program. The definition of severe repetitive loss as applied to this program was established in section 1361A of the National Flood Insurance Act, as amended (NFIA), 42 U.S.C. 4102a. An SRL property is defined as a residential property that is covered under an NFIP flood insurance policy and: (a) That has at least four NFIP claim payments (including building and contents) over $5,000 each, and the cumulative amount of such claims payments exceeds $20,000; or (b) For which at least two separate claims payments (building payments only) have been made with the cumulative amount of the building portion of such claims exceeding the market value of the building. For both (a) and (b) above, at least two of the referenced claims must have occurred within any ten-year period, and must be greater than 10 days apart.
AFGP Fire Prevention & Safety Grants (DHS) www.fema.gov/firegrants/fpsgrants/index.shtm The Fire Prevention and Safety Grants (FP&S) are part of the Assistance to Firefighters Grants (AFG) and are under the purview of the Grant Programs Directorate in the Federal Emergency Management Agency. FP&S grants support projects that enhance the safety of the public and firefighters from fire and related hazards. The primary goal is to target high-risk populations and mitigate high incidences of death and injury. Examples of the types of projects supported by PAGE 3-7 REGION 5 ALL HAZARD MITIGATION PLAN – 2020-2025 EDITION BASE PLAN
FP&S include fire prevention and public safety education campaigns, juvenile firesetter interventions, media campaigns, and arson prevention and awareness programs. In fiscal year 2005, Congress reauthorized funding for FP&S and expanded the eligible uses of funds to include Firefighter Safety Research and Development.
Fire Prevention and Safety Grants http://www.firegrantshelp.com/search-grants/453560-fire-prevention-and-safety-fp-sgrants/ FP&S offers grants to support activities in two categories: •
activities designed to reach high-risk target groups and mitigate incidences of death and injuries caused by fire and fire-related hazards (“Fire Prevention and Safety Activity”);
•
research and development activities aimed at improving firefighter safety (“Firefighter Safety Research and Development Activity”).
Buffer Zone Protection Program (BZPP) http://www.dhs.gov/files/programs/gc_1265397547397.shtm BZPP provides grants to build security and risk-management capabilities at the State and local level in order to secure pre-designated Tier I and Tier II critical infrastructure sites, including chemical facilities, financial institutions, nuclear and electric power plants, dams, stadiums, and other high-risk/high-consequence facilities.
Community Development Block Grants (CDBG) http://www.hud.gov/offices/cpd/communitydevelopment/programs/ These grants are a source of funding for hazard mitigation initiatives. The objective of the CDBG program is to assist communities in rehabilitating substandard dwelling structures and to expand economic opportunities, primarily for low-to-moderate-income families. Following a Presidential declared disaster, CDBG funds may be used for long-term needs such as acquisition, reconstruction, and redevelopment of disaster-affected areas.
Disaster Preparedness and Response for Schools and Universities http://www.edfacilities.org/rl/disaster.cfm National Clearinghouse for Educational Facilities (NCEF’s) resource list of links, books, and journal articles on building or retrofitting schools to withstand natural disasters and terrorism, developing emergency preparedness plans, and using school buildings to shelter community members during emergencies.
Emergency Management Program Grants (EMPG) http://www.fema.gov/non-disaster-grant-management-system The EMPG program provides resources to assist State and local governments to sustain and enhance all-hazards emergency management capabilities. States have the opportunity to use PAGE 3-8 REGION 5 ALL HAZARD MITIGATION PLAN – 2020-2025 EDITION BASE PLAN
EMPG funds to further strengthen their ability to support emergency management activities while simultaneously addressing issues of national concern as identified in the National Priorities of the National Preparedness Guidelines. EMPG has a 50 percent Federal and 50 percent State cost-share cash or in-kind match requirement.
Environmental Protection Agency’s National Estuary Program http://www.epa.gov/nep/ The EPA's National Estuary Program was established by Congress in 1987 to improve the quality of estuaries of national importance. The Clean Water Act Section 320 directs EPA to develop plans for attaining or maintaining water quality in an estuary. This includes protection of public water supplies and the protection and propagation of a balanced, indigenous population of shellfish, fish, and wildlife, and allows recreational activities, in and on water, requires that control of point and nonpoint sources of pollution to supplement existing controls of pollution. In several cases, more than one State is participating in a National Estuary Program. Each program establishes a Comprehensive Conservation and Management Plan to meet the goals of Section 320.
Hazardous Materials Emergency Preparedness (HMEP) Grant Program http://hazmat.dot.gov/training/state/hmep/hmep.htm The Hazardous Materials Emergency Preparedness (HMEP) grant program is intended to provide financial and technical assistance as well as national direction and guidance to enhance State, Territorial, Tribal, and local hazardous materials emergency planning and training. The HMEP Grant Program distributes fees collected from shippers and carriers of hazardous materials to emergency responders for hazmat training and to Local Emergency Planning Committees (LEPCs) for hazmat planning.
Homeland Security Grant Program http://www.fema.gov/government/grant/hsgp/index.shtm This core assistance program provides funds to build capabilities at the State and local levels through planning, organization, equipment, training, and exercise activities. State Homeland Security Program (SHSP) also supports the implementation of State homeland security strategies and key elements of the national preparedness architecture, including the National Preparedness Guidelines, the National Incident Management System and the National Response Framework. The Homeland Security Grant Program (HSGP) plays an important role in the implementation of Presidential Policy Directive – 8 (PPD-8) by supporting the development and sustainment of core capabilities to fulfill the National Preparedness Goal (NPG). HSGP is comprised of three interconnected grant programs: • State Homeland Security Program (SHSP) •
Urban Areas Security Initiative (UASI) •
Operation Stonegarden (OPSG)
PAGE 3-9 REGION 5 ALL HAZARD MITIGATION PLAN – 2020-2025 EDITION BASE PLAN
Together, these grant programs fund a range of preparedness activities, including planning, organization, equipment purchase, training, exercises, and management and administration.
National Earthquake Hazards Reduction Program http://www.nehrp.gov/index.htm The National Earthquake Hazards Reduction Program (NEHRP) was established by the U.S. Congress when it passed the Earthquake Hazards Reduction Act of 1977, Public Law (PL) 95– 124. At the time of its creation, Congress' stated purpose for NEHRP was "to reduce the risks of life and property from future earthquakes in the United States through the establishment and maintenance of an effective earthquake hazards reduction program." In establishing NEHRP, Congress recognized that earthquake-related losses could be reduced through improved design and construction methods and practices, land use controls and redevelopment, prediction techniques and early-warning systems, coordinated emergency preparedness plans, and public education and involvement programs.
National Weather Service
http://www.weather.gov/ The National Weather Service (NWS) provides weather, hydrologic, and climate forecasts and warnings for the United States, its territories, adjacent waters and ocean areas, for the protection of life and property and the enhancement of the national economy. NWS data and products form a national information database and infrastructure which can be used by other governmental agencies, the private sector, the public, and the global community.
Port Security Grant Program (PSGP) http://www.fema.gov/port-security-grant-program The PSGP provides grant funding to port areas for the protection of critical port infrastructure from terrorism. PSGP funds help ports enhance their risk management capabilities, domain awareness, training and exercises, and capabilities to prevent, detect, respond to, and recover from attacks involving improvised explosive devices and other non-conventional weapons.
Urban Areas Security Initiative Nonprofit Security Grant Program http://www.fema.gov/preparedness-non-disaster-grants/urban-areas-security-initiativenonprofit-security-grant-program Nonprofit Security Grants Program (NSGP) provides funding support for target hardening and other physical security enhancements and activities to nonprofit organizations that are at high risk of a terrorist attack and located within one of the specific FY 2012 UASI-eligible urban areas. The FY 2012 NSGP plays an important role in the implementation of the Presidential Policy Directive – 8 by supporting the development and sustainment of core capabilities to fulfill the National Preparedness Goal.
PAGE 3-10 REGION 5 ALL HAZARD MITIGATION PLAN – 2020-2025 EDITION BASE PLAN
Problem Solving Partnerships Grant Program (COPS) http://www.cops.usdoj.gov/ The COPS Office has distributed over $12 billion to advance community policing since it was created in 1994. This funding supports a wide range of activities. COPS funding helps local law enforcement agencies hire, equip, and train new community policing professionals. COPS funding helps redeploy existing officers into their communities and studies ways to maximize the impact they have on the people who live there. COPS funds a wide variety of strategies to advance community policing through innovative techniques and technologies.
Transit Security Grant Program http://www.fema.gov/transit-security-grant-program TSGP provides funds to owners and operators of transit systems (which include intracity bus, commuter bus, ferries, and all forms of passenger rail) to protect critical surface transportation infrastructure and the traveling public from acts of terrorism and to increase the resilience of transit infrastructure. The TSGP plays an important role in the implementation of PPD-8 by supporting the development and sustainment of core capabilities to fulfill the National Preparedness Goal (NPG).
Rural Development-Housing & Community Facilities Programs http://www.rurdev.usda.gov/rhs/cf/brief_cp_grant.htm Community Programs provides grants to assist in the development of essential community facilities in rural areas and towns of up to 20,000 in population. Grants are authorized on a graduated scale. Applicants located in small communities with low populations and low incomes will receive a higher percentage of grants. Grants are available to public entities such as municipalities, counties, and special-purpose districts, as well as non-profit corporations and tribal governments. Grant funds may be used to assist in the development of essential community facilities. Grant funds can be used to construct, enlarge, or improve community facilities for health care, public safety, and community and public services. This can include the purchase of equipment required for a facility's operation. A grant may be made in combination with other Community Facilities financial assistance such as a direct or guaranteed loan, applicant contributions, or loans and grants from other sources.
Volunteers in Police Service (VIPS) Program http://www.policevolunteers.org/ The VIPS Program provides support and resources for agencies interested in developing or enhancing a volunteer program and for citizens who wish to volunteer their time and skills with a community law enforcement agency. The program’s ultimate goal is to enhance the capacity of state and local law enforcement to utilize volunteers.
PAGE 3-11 REGION 5 ALL HAZARD MITIGATION PLAN – 2020-2025 EDITION BASE PLAN
Western Regional Climate Action Initiative http://www.westernclimateinitiative.org/ The Western Climate Initiative (WCI) is a collaboration which was launched in February 2007 by the Governors of Arizona, California, New Mexico, Oregon and Washington to develop regional strategies to address climate change. WCI is identifying, evaluating and implementing collective and cooperative ways to reduce greenhouse gases in the region.
State Capabilities Various law and rules have been identified in Washington State as supporting hazard mitigation. These can be found in Revised Code of Washington (RCW) and Washington Administrative Code (WAC). Washington State Constitution further identifies who does what and the basic rights in the State. Various State of Washington State Agencies/Departments have mitigation capabilities: o o
o
o o o o o o
Community, Trade, Economic Development http://www.cted.wa.gov/ Department of Fish and Wildlife http://wdfw.wa.gov/ Department of Ecology http://www.ecy.wa.gov/ Department of Labor and Industries http://www.lni.wa.gov/ Department of Natural Resource http://www.dnr.wa.gov/ Department of Transportation http://www.wsdot.wa.gov/ Governor’s Office http://www.governor.wa.gov/ Military Department (Emergency Management Division) http://www.emd.wa.gov/ Office of Superintendent of Public Instruction http://www.k12.wa.us/ Washington State Patrol http://www.wsp.wa.gov/
Other various capabilities in Washington State: o o o o o
Association of Washington Cities http://www.awcnet.org/ Association of Washington Counties http://www.wacounties.org/ Cascade Land Conservancy http://www.cascadeland.org/ Master Builders Association www.mbapierce.com/ Municipal Research of Washington http://www.mrsc.org/ PAGE 3-12 REGION 5 ALL HAZARD MITIGATION PLAN – 2020-2025 EDITION BASE PLAN
o
O o o o o o o o o o
Structural Engineers Association of Washington http://www.seaw.org/ WA Association of Building Officials http://wabo.org/ WA Association of Fire Chiefs http://www.wsafc.org/ WA Association of Maintenance & Operations Administrators http://www.wamoa.org/ WA Association of Sheriffs & Police Chiefs http://www.waspc.org/ WA Emergency Management Association http://www.wsema.com/ WA Firefighter Association http://www.wsffa.org/ WA Fire Commissioners Association http://www.wfca.wa.gov/default.asp Washington Public Ports Administration http://www.washingtonports.org/ Washington Schools Risk Management Pool http://www.wsrmp.com/
Local Capabilities As previously mentioned in this document, each of the 76 individual jurisdictions has extensive local capabilities that are listed in their individual documents. Any websites associated with these local capabilities will be found within the 76 jurisdictions’ addenda.
PAGE 3-13 REGION 5 ALL HAZARD MITIGATION PLAN – 2020-2025 EDITION BASE PLAN
(This page left blank intentionally)
PAGE 3-14 REGION 5 ALL HAZARD MITIGATION PLAN – 2020-2025 EDITION BASE PLAN
Section 4 Risk Assessment Requirements Identifying Hazards--- Requirement §201.6(c)(2)(i): [The risk assessment shall include a] description of the type … of all natural hazards that can affect the jurisdiction. • Does the new or updated plan include a description of the types of all natural hazards that affect the jurisdiction? Profiling Hazards---Requirement §201.6(c)(2)(i): [The risk assessment shall include a] description of the … location and extent of all natural hazards that can affect the jurisdiction. The plan shall include information on previous occurrences of hazard events and on the probability of future hazard events. • Does the risk assessment identify (i.e., geographic area affected) of each hazard being addressed in the new or updated plan? • Does the risk assessment identify the extent (i.e., magnitude or severity) of each hazard addressed in the new or updated plan? • Does the plan provide information on previous occurrences of each hazard addressed in the new or updated plan? • Does the plan include the probability of future events (i.e., chance of occurrence) for each hazard addressed in the new or updated plan? Assessing Vulnerability: Overview---Requirement §201.6(c)(2) (ii): [The risk assessment shall include a] description of the jurisdiction’s vulnerability to the hazards described in paragraph (c)(2)(i) of this section. This description shall include an overall summary of each hazard and its impact on the community. • Does the new or updated plan include an overall summary description of the jurisdiction’s vulnerability to each hazard? • Does the new or updated plan address the impacts of each hazard on the jurisdiction? Assessing Vulnerability: Addressing Repetitive Loss Properties---Requirement §201.6(c)(2) (ii): [The risk assessment] must also address the National Flood Insurance Program (NFIP) insured structures that have been repetitively damaged by floods. • Does the new or updated plan describe vulnerability in terms of the types and numbers of repetitive loss properties located in the identified hazard areas? Assessing Vulnerability: Identifying Structures---Requirement §201.6(c)(2) (ii)(A): The plan should describe vulnerability in terms of the types and numbers of existing and future buildings, infrastructure, and critical facilities located in the identified hazard areas…
• Does the new or updated plan describe vulnerability in terms of the types and numbers of existing buildings, infrastructure, and critical facilities located in the identified hazard areas? • Does the new or updated plan describe vulnerability in terms of the types and numbers of future buildings, infrastructure, and critical facilities located in the identified hazard areas? Assessing Vulnerability: Estimating Potential Losses---Requirement §201.6(c)(2) (ii)(B): [The plan should describe vulnerability in terms of an] estimate of the potential dollar losses to vulnerable structures identified in paragraph (c)(2)(ii)(A) of this section and a description of the methodology used to prepare the estimate… • Does the new or updated plan estimate potential dollar losses for vulnerable structures? • Does the new or updated plan describe the methodology used to prepare the estimate? PAGE 4-1 REGION 5 ALL HAZARD MITIGATION PLAN – 2020-2025 EDITION BASE PLAN
Assessing Vulnerability: Analyzing Development Trends---Requirement §201.6(c)(2) (ii)(c): [The plan should describe vulnerability in terms of] providing a general description of land uses and development trends within the community so that mitigation options can be considered in future land use decisions. • Does the new or updated plan describe land uses and development trends?
PAGE 4-2 REGION 5 ALL HAZARD MITIGATION PLAN – 2020-2025 EDITION BASE PLAN
SECTION 4 REGION 5 ALL HAZARD MITIGATION PLAN 2015-2020 EDITION RISK ASSESSMENT Table of Contents SECTION 4 ........................................................................................................ 1 RISK ASSESSMENT REQUIREMENTS ................................................................ 1 TABLE OF CONTENTS ........................................................................................ 3 HAZARD SUB-SECTIONS ................................................................................. 10 HAZUS-MH ...................................................................................................... 16 GEOLOGICAL ................................................................................................... 21 AVALANCHE 4.1G ............................................................................................ 21 IDENTIFICATION DESCRIPTION ............................................................................................................. 21 DEFINITION .................................................................................................................................... 21 TYPES............................................................................................................................................ 21
PROFILE .......................................................................................................... 23 LOCATION AND EXTENT ...................................................................................................................... 23 OCCURRENCES ................................................................................................................................. 25 IMPACTS......................................................................................................................................... 26
GEOLOGICAL ................................................................................................... 29 EARTHQUAKE 4.2G ......................................................................................... 29 IDENTIFICATION DESCRIPTION ............................................................................................................. 29 DEFINITION .................................................................................................................................... 29 TYPES............................................................................................................................................ 29 SECONDARY HAZARDS: ....................................................................................................................... 32
PROFILE .......................................................................................................... 34 LOCATION AND EXTENT ...................................................................................................................... 34 OCCURRENCES ................................................................................................................................. 41 IMPACTS......................................................................................................................................... 44
GEOLOGICAL ................................................................................................... 55 LANDSLIDE 4.3G ............................................................................................. 55 IDENTIFICATION DESCRIPTION ............................................................................................................. 55 DEFINITION .................................................................................................................................... 55 TYPES............................................................................................................................................ 55
PROFILE .......................................................................................................... 56 LOCATION AND EXTENT ...................................................................................................................... 56 OCCURRENCES ................................................................................................................................. 61 IMPACTS......................................................................................................................................... 63 PAGE 4-3 REGION 5 ALL HAZARD MITIGATION PLAN – 2020-2025 EDITION BASE PLAN
GEOLOGICAL ................................................................................................... 67 TSUNAMI 4.4G ................................................................................................ 67 IDENTIFICATION DESCRIPTION ............................................................................................................. 67 DEFINITION .................................................................................................................................... 67 TYPES............................................................................................................................................ 68
PROFILE .......................................................................................................... 69 LOCATION AND EXTENT ...................................................................................................................... 69 OCCURRENCES ................................................................................................................................. 74 IMPACTS......................................................................................................................................... 77
GEOLOGICAL ................................................................................................... 83 VOLCANIC HAZARD 4.5G ................................................................................ 83 IDENTIFICATION DESCRIPTION ............................................................................................................. 83 DEFINITION .................................................................................................................................... 83 TYPES............................................................................................................................................ 84
PROFILE .......................................................................................................... 85 LOCATION AND EXTENT ...................................................................................................................... 85 OCCURRENCES ................................................................................................................................. 90 IMPACTS......................................................................................................................................... 93
METEOROLOGICAL........................................................................................ 105 CLIMATE CHANGE 4.1M ................................................................................ 105 IDENTIFICATION DESCRIPTION ........................................................................................................... 105 DEFINITION .................................................................................................................................. 106 TYPES.......................................................................................................................................... 107
PROFILE ........................................................................................................ 107 PROJECTIONS ................................................................................................................................ 109 OCCURRENCES ............................................................................................................................... 114 IMPACTS....................................................................................................................................... 116
METEOROLOGICAL........................................................................................ 123 DROUGHT HAZARD 4.2M .............................................................................. 123 IDENTIFICATION DESCRIPTION ........................................................................................................... 123 DEFINITION .................................................................................................................................. 123 TYPES.......................................................................................................................................... 123
PROFILE ........................................................................................................ 125 LOCATION AND EXTENT .................................................................................................................... 125 OCCURRENCES ............................................................................................................................... 127 IMPACTS....................................................................................................................................... 130
METEOROLOGICAL........................................................................................ 141 FLOOD HAZARD 4.3M ................................................................................... 141 IDENTIFICATION DESCRIPTION ........................................................................................................... 141 TYPES.......................................................................................................................................... 141
PROFILE ........................................................................................................ 141 LOCATION..................................................................................................................................... 141 PAGE 4-4 REGION 5 ALL HAZARD MITIGATION PLAN – 2020-2025 EDITION BASE PLAN
PUYALLUP RIVER .......................................................................................... 142 LOWER PUYALLUP RIVER ............................................................................. 142 PUYALLUP RIVER EXTENT AND OCCURRENCES ........................................................................................ 144 PROBABILITY OF FUTURE HAZARDS ..................................................................................................... 144 PUYALLUP RIVER IMPACTS ................................................................................................................ 145
MIDDLE PUYALLUP RIVER ............................................................................ 148 MIDDLE PUYALLUP RIVER EXTENT AND OCCURRENCES ............................................................................. 150 PROBABILITY OF FUTURE HAZARDS ..................................................................................................... 150 MIDDLE PUYALLUP RIVER IMPACTS...................................................................................................... 151
UPPER PUYALLUP RIVER .............................................................................. 157 UPPER PUYALLUP EXTENT AND OCCURRENCES ........................................................................................ 159 PROBABILITY OF FUTURE HAZARDS ..................................................................................................... 159 UPPER PUYALLUP RIVER IMPACTS ....................................................................................................... 160
WHITE RIVER................................................................................................ 171 LOWER WHITE RIVER................................................................................... 171 LOWER WHITE RIVER EXTENT AND OCCURRENCES .................................................................................. 173 PROBABILITY OF FUTURE HAZARDS ..................................................................................................... 174 WHITE RIVER IMPACTS .................................................................................................................... 174
UPPER WHITE RIVER .................................................................................... 177 UPPER WHITE RIVER EXTENT AND OCCURRENCES ................................................................................... 179 PROBABILITY OF FUTURE HAZARDS ..................................................................................................... 179 UPPER WHITE RIVER IMPACTS ........................................................................................................... 180
GREENWATER RIVER .................................................................................... 182 GREENWATER RIVER EXTENT AND OCCURRENCES.................................................................................... 184 PROBABILITY OF FUTURE HAZARDS ..................................................................................................... 184 GREENWATER RIVER IMPACTS ............................................................................................................ 184
CARBON RIVER ............................................................................................. 186 CARBON RIVER EXTENT AND OCCURRENCES .......................................................................................... 188 PROBABILITY OF FUTURE HAZARDS ..................................................................................................... 188
SOUTH PRAIRIE CREEK ................................................................................ 199 SOUTH PRAIRIE CREEK EXTENT AND OCCURRENCES................................................................................. 201 SOUTH PRAIRIE CREEK IMPACTS ......................................................................................................... 202
NISQUALLY RIVER ........................................................................................ 203 MIDDLE NISQUALLY ..................................................................................... 203 NISQUALLY RIVER EXTENT AND OCCURRENCES ....................................................................................... 205 PROBABILITY OF FUTURE HAZARDS ..................................................................................................... 205 MIDDLE NISQUALLY RIVER IMPACTS .................................................................................................... 206
UPPER NISQUALLY RIVER ............................................................................ 206 UPPER NISQUALLY RIVER EXTENT AND OCCURRENCES.............................................................................. 209 PROBABILITY OF FUTURE HAZARDS ..................................................................................................... 209 UPPER NISQUALLY RIVER IMPACTS ...................................................................................................... 210
MASHEL RIVER ............................................................................................. 212 PAGE 4-5 REGION 5 ALL HAZARD MITIGATION PLAN – 2020-2025 EDITION BASE PLAN
MASHEL RIVER EXTENT AND OCCURRENCES........................................................................................... 214 PROBABILITY OF FUTURE HAZARDS ..................................................................................................... 214 MASHEL RIVER IMPACTS ................................................................................................................... 214
ENVIRONMENTAL IMPACTS ......................................................................... 218 MINIMIZING WATER QUALITY IMPACTS OF FLOODING .............................................................................. 218 IMPACTS ON WATER QUALITY, FISH AND WILDLIFE, AND HABITAT .............................................................. 219 REPETITIVE FLOODING ..................................................................................................................... 219
ADDITIONAL FLOOD HAZARDS IN PIERCE COUNTY.................................... 220 COASTAL FLOOD HAZARD ................................................................................................................. 220 URBAN/STREAM FLOOD HAZARD......................................................................................................... 220 GROUNDWATER FLOODING ................................................................................................................ 220
COMMUNITY OUTREACH .............................................................................. 220 IMPLEMENTATION AND PARTNERSHIPS ..................................................... 221 FLOOD CONTROL ZONE DISTRICT ....................................................................................................... 221 FLOODPLAINS FOR THE FUTURE .......................................................................................................... 221
METEOROLOGICAL........................................................................................ 223 SEVERE WEATHER 4.4M ............................................................................... 223 DEFINITION .................................................................................................................................. 223 TYPES.......................................................................................................................................... 223
PROFILE ........................................................................................................ 226 LOCATION AND EXTENT .................................................................................................................... 226 OCCURRENCES ............................................................................................................................... 229 IMPACTS....................................................................................................................................... 233
METEOROLOGICAL........................................................................................ 245 WILDLAND/URBAN INTERFACE FIRE HAZARD 4.5M ................................... 245 IDENTIFICATION DESCRIPTION ........................................................................................................... 245 DEFINITION .................................................................................................................................. 245 TYPES.......................................................................................................................................... 245
PROFILE ........................................................................................................ 245 LOCATION AND EXTENT .................................................................................................................... 245 OCCURRENCES ............................................................................................................................... 249 IMPACTS....................................................................................................................................... 255
TECHNOLOGICAL .......................................................................................... 259 ABANDONED UNDERGROUND MINES HAZARD 4.1T.................................... 259 IDENTIFICATION DESCRIPTION ........................................................................................................... 259 DEFINITION .................................................................................................................................. 259 TYPES.......................................................................................................................................... 259
PROFILE ........................................................................................................ 260 LOCATION AND EXTENT .................................................................................................................... 260 OCCURRENCES ............................................................................................................................... 263 IMPACTS....................................................................................................................................... 263
TECHNOLOGICAL .......................................................................................... 269 ACTIVE THREAT / ATTACK TACTICS 4.2T ..................................................... 269 PAGE 4-6 REGION 5 ALL HAZARD MITIGATION PLAN – 2020-2025 EDITION BASE PLAN
IDENTIFICATION AND DESCRIPTION .......................................................... 269 DEFINITION .................................................................................................................................. 269 TYPES.......................................................................................................................................... 269
PROFILE ........................................................................................................ 269 LOCATION AND EXTENT .................................................................................................................... 269 OCCURRENCES ............................................................................................................................... 274 IMPACTS....................................................................................................................................... 275
TECHNOLOGICAL .......................................................................................... 279 CIVIL DISTURBANCE HAZARD 4.3T ............................................................. 279 IDENTIFICATION DESCRIPTION ........................................................................................................... 279 DEFINITION .................................................................................................................................. 279 TYPES.......................................................................................................................................... 279
PROFILE ........................................................................................................ 279 LOCATION AND EXTENT .................................................................................................................... 279
TECHNOLOGICAL .......................................................................................... 287 CYBER-ATTACK HAZARD 4.4T ...................................................................... 287 IDENTIFICATION AND DESCRIPTION ..................................................................................................... 287 DEFINITION .................................................................................................................................. 287 TYPES.......................................................................................................................................... 287 LOCATION AND EXTENT .................................................................................................................... 287 OCCURRENCES ............................................................................................................................... 288 IMPACTS....................................................................................................................................... 289
TECHNOLOGICAL .......................................................................................... 293 DAM FAILURE HAZARD 4.5T ......................................................................... 293 IDENTIFICATION DESCRIPTION ........................................................................................................... 293 DEFINITION .................................................................................................................................. 293 TYPES.......................................................................................................................................... 293
PROFILE ........................................................................................................ 293 LOCATION AND EXTENT .................................................................................................................... 293 OCCURRENCES ............................................................................................................................... 299 IMPACTS....................................................................................................................................... 300
TECHNOLOGICAL .......................................................................................... 305 ENERGY EMERGENCY HAZARD 4.6T ............................................................. 305 IDENTIFICATION DESCRIPTION ........................................................................................................... 305 DEFINITION .................................................................................................................................. 305 TYPES.......................................................................................................................................... 305
PROFILE ........................................................................................................ 305 LOCATION AND EXTENT .................................................................................................................... 305 OCCURRENCES ............................................................................................................................... 306 IMPACTS....................................................................................................................................... 309
TECHNOLOGICAL .......................................................................................... 315 EPIDEMIC/PANDEMIC HAZARD 4.7T ........................................................... 315 IDENTIFICATION DESCRIPTION ........................................................................................................... 315 PAGE 4-7 REGION 5 ALL HAZARD MITIGATION PLAN – 2020-2025 EDITION BASE PLAN
DEFINITION .................................................................................................................................. 315 TYPES.......................................................................................................................................... 315
PROFILE ........................................................................................................ 315 LOCATION AND EXTENT .................................................................................................................... 315 OCCURRENCES ............................................................................................................................... 316 IMPACTS....................................................................................................................................... 317
TECHNOLOGICAL .......................................................................................... 321 HAZARDOUS MATERIAL 4.8T ........................................................................ 321 IDENTIFICATION DESCRIPTION ........................................................................................................... 321 DEFINITION .................................................................................................................................. 321 TYPES.......................................................................................................................................... 321 PROFILE ....................................................................................................................................... 321 LOCATION AND EXTENT .................................................................................................................... 321 OCCURRENCES ............................................................................................................................... 323 IMPACTS....................................................................................................................................... 324
TECHNOLOGICAL .......................................................................................... 329 PIPELINES HAZARD 4.9T .............................................................................. 329 IDENTIFICATION DESCRIPTION ........................................................................................................... 329 DEFINITION .................................................................................................................................. 329 TYPES.......................................................................................................................................... 329
PROFILE ........................................................................................................ 329 LOCATION AND EXTENT .................................................................................................................... 329 OCCURRENCES ............................................................................................................................... 330 IMPACTS....................................................................................................................................... 333
TECHNOLOGICAL .......................................................................................... 339 TERRORISM HAZARD 4.10T ......................................................................... 339 IDENTIFICATION DESCRIPTION ........................................................................................................... 339 DEFINITION .................................................................................................................................. 339
PROFILE ........................................................................................................ 340 LOCATION AND EXTENT .................................................................................................................... 340 OCCURRENCES ............................................................................................................................... 341 IMPACTS....................................................................................................................................... 343
TECHNOLOGICAL .......................................................................................... 345 TRANSPORTATION ACCIDENTS HAZARD 4.11T ........................................... 345 IDENTIFICATION DESCRIPTION ........................................................................................................... 345 DEFINITION .................................................................................................................................. 345 TYPES.......................................................................................................................................... 345
PROFILE ........................................................................................................ 346 LOCATION AND EXTENT .................................................................................................................... 346 OCCURRENCES ............................................................................................................................... 347 IMPACTS....................................................................................................................................... 350
RESOURCE DIRECTORY ................................................................................ 355 ENDNOTES .................................................................................................... 356 PAGE 4-8 REGION 5 ALL HAZARD MITIGATION PLAN – 2020-2025 EDITION BASE PLAN
RISK Various methodologies are available to facilitate risk assessment. A common approach based on an understanding of existing methodologies is needed to enable the setting of mitigation priorities across infrastructure sectors, both within and among jurisdictions. The first element of this approach was to establish a common definition and process for analysis of the basic factors of risk. In the context of homeland security, the Region 5 Planning Team developed a framework that assesses risk as a function of threat, vulnerability, and consequence. Threat: The likelihood or probability that a jurisdiction’s assets, infrastructure, citizens or environment will suffer from a particular hazard. • Vulnerability: The susceptibility of a jurisdiction, its assets, infrastructure, citizens or environment to damage, destruction, or incapacitation from a particular hazard. The likelihood is primarily dependent upon the location and extent of the hazard in relation to the infrastructure and/or jurisdiction. • Consequence: The negative effects on public health and safety, the economy, public confidence in institutions, and the functioning of government, both direct and indirect, that can be expected if infrastructure is damaged, destroyed or disrupted by the impact of an individual hazard. The extent of these consequences depends on the level of mitigation that has taken place to decrease the threat, reduce the vulnerability, or negate the consequences. •
RISK
Threat
Vulnerability
Consequence
For the purposes of this plan the Risk Assessment portrays the threats of natural hazards, the vulnerabilities of a jurisdiction to those hazards, and the consequences of those hazards on the individual communities or jurisdictions. Thus the components of the Risk Assessment are: hazard/threat identification, vulnerability analysis, and consequence analysis. Not only does DMA 2000 require a risk assessment, but Chapter 118-30 Washington Administrative Code requires that emergency management plans be based on a written assessment and listing of the hazards to which the political subdivisions are vulnerable. In addition, state law requires each political subdivision to be part of an emergency management organization, and to have an emergency management plan. Over twenty years ago Pierce County Department of Emergency Management (PCDEM) began identifying the County’s natural hazards to assist with its emergency planning. Eventually information on these hazards was PAGE 4-9 REGION 5 ALL HAZARD MITIGATION PLAN – 2020-2025 EDITION BASE PLAN
compiled in its Hazard Identification and Vulnerability Analysis (HIVA) and then in 2009 the Hazard Identification and Risk Assessment (HIRA). This document, revised from time to time, has been used as the basis for emergency response and operations planning for the County. Because Pierce County is congruent with Region 5, the Pierce County HIRA provided a broad scope for looking at the hazards that affect the Region’s jurisdictions. Since most jurisdictions within Region 5 rely on the County for coordination in emergencies or disasters, the County’s HIRA also forms the basis for much of their emergency planning.
Hazard Sub-Sections The Risk Assessment portrays the risks and vulnerabilities and is divided by natural hazard type. In alphabetical order, separated by Geological (G), Meteorological (M), and Technological (T) Hazards, the Region 5 Hazard Mitigation Plan addresses the following hazards: Geological • • • • •
Avalanche Hazard (Sub-Section 4G.1), Earthquake Hazard (Sub-Section 4G.2), Landslide Hazard (Sub-Section 4G.3, Tsunami Hazard (Sub-Section 4G.4), Volcanic Hazard (Sub-Section 4G.5),
Meteorological • • • • •
Climate Change Hazard (Sub-Section 4M.1), Drought Hazard (Sub-Section 4M.2), Flood Hazard (Sub-Section 4M.3), Severe Weather Hazard (Sub-Section 4M.4), and Wildland/Urban Interface (WUI) Fire Hazard (Sub-Section 4M.5).
Technological • • • • • • • • • • •
Abandoned Mines (Sub-Section 4T.1), Active Threat / Attack Tactics (Sub-Section 4T.2), Civil Disturbance (Sub-Section 4T.3), Cyber-Attack (Sub-Section 4T.4), Dam Failure (Sub-Section 4T.5), Energy Emergency (Sub-Section 4T.6, Epidemic/Pandemic (Sub-Section 4T.7, Hazardous Materials (Sub-Section 4T.8), Pipeline (Sub-Section 4T.9), Terrorism (Sub-Section 4T.10), Transportation Accidents (Sub-Section 4T.11).
Each hazard is discussed through an Identification Description (which includes the definition and types), a Profile (which includes the location and extent of the hazard, occurrences and the impacts), and includes a Resource Directory. Using this analysis, the Plan then describes each jurisdiction’s vulnerability to each hazard. The specific vulnerabilities of each of the PAGE 4-10 REGION 5 ALL HAZARD MITIGATION PLAN – 2020-2025 EDITION BASE PLAN
jurisdiction’s specific infrastructure are discussed in the Risk Assessment (Section 4) and Infrastructure Section (Section 6) of each individual jurisdiction plan. The following tables, charts and maps summarize the risk assessment processes: • • • • • •
Table 4-1a WA Region 5 Hazard Identification Summary – Geological Table 4-1b WA Region 5 Hazard Identification Summary – Meteorological Table 4-1c WA Region 5 Hazard Identification Summary – Technological Map 4-1a Scenario ShakeMap 7.1M Tacoma Fault Map 4-1b Scenario ShakeMap 7.2M SeaTac Fault Map 4-1c Scenario ShakeMap 7.2M Nisqually Fault
PAGE 4-11 REGION 5 ALL HAZARD MITIGATION PLAN – 2020-2025 EDITION BASE PLAN
Table 4-1a Region 5 Hazard Identification Summary - Geological
HAZARD
DECLARATION # DATE/PLACE
AVALANCHE
Not Applicable
EARTHQUAKE
N/A--7/22/2001 Nisqually Delta N/A--6/10/2001 Satsop DR-1361-WA--2/2001 Nisqually N/A--7/2/1999 Satsop DR-196-WA--4/29/1965 Maury Island, South Puget Sound N/A--4/13/1949 South Puget Sound N/A--2/14/1946 Maury Island
PROBABILITY/ RECURRENCE
MAPS, FIGURES AND TABLES
Yearly in the mountainous areas of the County including Mt. Rainier National Park and the Cascades. 40 years or less occurrence Historical record—about every 23 years for intraplate earthquakes.
Slab Avalanche Areas Vulnerable to Avalanche Pierce County Avalanches of Record Types of Earthquakes Major Faults in the Puget Sound Basin Seattle and Tacoma Fault Segments Pierce County Seismic Hazard Major Pacific Northwest Earthquakes Notable Earthquakes Felt in Pierce County Salmon Beach, Tacoma Washington following Feb 2001 Earthquake Liquefaction Niigata Japan-1964 Lateral Spreading – March 2001
DR-1671-WA--2006 DR-1361-WA--2001 DR-1159-WA--12/96-2/1997 DR-852-WA--1/1990 DR-545-WA--12/1977 State proclamations: 20-02 – 01/20/2020 17-08 – 05/18/2017 SR 410
Slides with minor impact (damage to five or less developed properties or $1,000,000 or less damage) 10 years or less.
Northeast Tacoma Landslide January 2007 Pierce County Landslide Deposits, Scarps and Flanks, and Susceptibility Landslide Facts for Pierce County – Shallow Landslide Susceptibility Pierce County Deep Landslide Hazard Area Pierce County Shallow Landslide Hazard Area Pierce County Slope Stability Areas Pierce County Comparison of Landslide Susceptible Areas Notable Landslides in Pierce County Ski Park Road – Landslide January 2003 SR-165 Bridge Along Carbon River – Landslide February 1996 Aldercrest Drive – Landslide
TSUNAMI
N/A--A.D. 900 Seattle Fault EQ Sourced Tsunami N/A--1894 Puyallup River Delta N/A--1949 Tacoma Narrows
Due to the limited historic record, until further research can provide a better estimate a recurrence rate of plus or minus 100-200 years will be used.
Hawaii 1957 – Residents Explore Ocean Floor Before Tsunami Hawaii 1949 – Wave Overtakes a Seawall Tsunamis in Washington State Tsunami Inundation and Current Based on Earthquake Scenario Notable Tsunamis in Pierce County Salmon Beach, Pierce County 1949 – Tsunamigenic Subaerial Landslide Salmon Beach, Pierce County 1949 – Tsunamigenic Subaerial Landslide Damage in Tacoma from 1894 Tsunami
VOLCANIC
DR-623-WA--5/1980
The recurrence rate for either a major lahar (Case I or Case II) or a major tephra eruption is 500 to 1000 years. The recurrence rate for either a major lahar (Case I or Case II) or a major tephra eruption is 500 to 1000 years.
Volcano Hazards Tephra Types and Sizes Lahars, Lava Flows and Pyroclastic Hazards of Mt. Rainier Estimated Lahar Travel Times for Lahars 107 to 108 Cubic Meters in Volume Pierce County Eruptive Events and Lahars
Geological
LANDSLIDE
Slides with significant impact (damage to six or more developed properties or $1,000,000 or greater damage) 100 years or less.
PAGE 4-12 REGION 5 ALL HAZARD MITIGATION PLAN – 2020-2025 EDITION BASE PLAN
Table 4-1b Region 5 Hazard Identification Summary - Meteorological
HAZARD CLIMATE CHANGE
DROUGHT
Meteorological
FLOOD
DECLARATION # DATE/PLACE
PROBABILITY/ RECURRENCE
Not Applicable
Not Applicable
Many dry seasons but no declarations State proclamations: 18-05--7/31/2018
50 years or less occurrence
DR-WA 1817--01/2009 DR-1734-WA--12/2007 DR-1671-WA--11/2006 DR-1499-WA--10/2003 DR-1159-WA--12/96-2/97 DR-1100-WA--1-2/1996 DR-1079-WA--11-12/1995 DR-896-WA--12/1990 DR-883-WA--11/1990 DR-852-WA--1/1990 DR-784-WA--11/1986 DR-545-WA--12/1977 DR-492-WA--12/1975 DR-328-WA--2/1972 DR-185-WA--12/1964
5 years or less occurrence Best available science--the frequency of the repetitive loss claims indicates there is approximately a 33 percent chance of flooding occurring each year.
MAPS, FIGURES AND TABLES IPCC Models on Global Temperature Change: 1900 to 2100 Recent and Projected Temperatures for the Pacific Northwest Puget Sound Projected Warming Puget Sound Projected Precipitation Change Projected Decline in Snowpack Projected Sea Level Risk – Tacoma Sea Level Rise Inundation Area in 2100 Tacoma Tideflats Climate Impacts and Natural Hazards Comparison of the South Cascade Glacier: 1928 to 2003 Lower Nisqually Glacier Retreat: 1912 to 2001 Sequence of Drought Impacts Palmer Drought Severity Index Pierce County Watersheds %Area of Basin in Drought Conditions Since 1895 %Time in Severe to Extreme Drought: 1895-2004 %Time in Severe to Extreme Drought: 1985-1995 Notable Droughts Affecting Pierce County Columbia River Basin USDA Climate Zones – Washington State Lower Puyallup River Historical Flooding in Lower Puyallup River Levees and Revetments in the Lower Puyallup River Summary of Damages to Lower Puyallup River Facilities Middle Puyallup River Historical Flooding in Middle Puyallup River Levees and Revetments in the Middle Puyallup River Summary of Damages to Lower Middle River Facilities Upper Puyallup River Historical Flooding in Upper Puyallup River Levees and Revetments in the Upper Puyallup River Summary of Damages to Upper Puyallup River Facilities Lower White River Historical Flooding in Lower White River Levees and Revetments in the Lower White River Summary of Damages to Lower White River Facilities Upper White River Historical Flooding in Upper White River Levees and Revetments in the Upper White River Summary of Damages to Upper White River Facilities Greenwater River Historical Flooding in Greenwater River Carbon River Historical Flooding in Carbon River South Prairie Creek Historical Flooding in South Prairie Creek Middle Nisqually River Historical Flooding in Middle Nisqually River Upper Nisqually River Historical Flooding in Upper Nisqually River Levees and Revetments in the Upper Nisqually River
PAGE 4-13 REGION 5 ALL HAZARD MITIGATION PLAN – 2020-2025 EDITION BASE PLAN
Meteorological
SEVERE WEATHER
WUI FIRE
DR-4056-WA – 01/2012 DR-1825- WA – 12/2008 – 01/2009 DR-1682-WA--12/2006 DR-1159-WA--12/96-2/1997 DR-1152-WA--11/19/1996 DR-981-WA--1/1993 Inauguration Day Storm DR-137-WA--10/1962 Columbus Day Storm State proclamations: 19-06--02/15/2019 (Dec. 2018 Winter Storm) 19-05--02/14/2019 Winter Storm Maya 17-08--5/18/2017 Severe rain 17-03--3/14/2017 17-02--1/19/2017 Winter Storm 15-18--12/24/2015 Windstorms and Flooding EM-3372-WA Aug-Sept. 2015 State proclamations: 17-12--9/2/2017 Norse Peak Fire 15-11--6/26/2015
The recurrence rate for all types of severe storms is 5 years or less.
Based on information from WA DNR the probability of recurrence for WUI fire hazard to Pierce County is 5 years or less.
Summary of Damages to Upper Nisqually River Facilities Mashel River Historical Flooding in Mashel River Nov 2006 Flooding River Park Estates – Along Puyallup River Fujita Tornado Damage Scale Windstorm Tracks Pierce County Severe Weather Wind Hazard – South Wind Event Pierce County Severe Weather Wind Hazard – Enumclaw East Wind Event Notable Severe Weather in Pierce County Snowstorm January 2004 Downtown Tacoma Satellite Image – Hanukkah Eve Windstorm Before/After Tornado Damage Greensburg KS May 2007 County Road December 2006 Windstorm Tacoma Narrows Bridge – November 1940 Windstorm
Washington State Fire Hazard Map Pierce County Forest Canopy Industrial Fire Precaution Level Shutdown Zones Carbon Copy Fire August 2006 Washington State DNR Wildland Fire Statistics: 1973-2007 DNR Wildland Response South Puget Sound Region: 2002-2007 Pierce County DNR Fires
PAGE 4-14 REGION 5 ALL HAZARD MITIGATION PLAN – 2020-2025 EDITION BASE PLAN
Table 4-1c Region 5 Hazard Mitigation Identification Summary – Technological
HAZARD ABANDONED MINES
FEMA DECLARATION # DATE/PLACE Not Applicable
CIVIL DISTURBANCE
Not Applicable
DAM FAILURE
Not Applicable
PROBABILITY/RECURRENCE
MAPS, FIGURES AND TABLES
Based on information from WA DNR. The Pierce County Sheriff’s Department reports that they have had very few incidents of citizens entering the abandoned mines in east Pierce Co.
Pierce County – Mine Hazard Areas Map Based on WA DNR Information Schasse, Koler, Eberle, and Christie, The Washington State Coal Mine Map Collection: A Catalog, Index, and User’s Guide, Open File Report 94-7, June 1984 Pierce County 2014 HIRA
Isolated issues of minor subsidence have occurred, typically following flood events i.e. 2009/2010. In the past 150 + years there have been eleven major incidents giving a recurrence rate of every seven years. No occurrences in Pierce County
Technological
50+ years recurrence for WA State
ENERGY EMERGENCY
Not Applicable
EPIDEMIC / PANDEMIC
EM-3507-WA 03/12/2020
Power outages are the most frequent energy incident, via natural hazards (storms, ice) Recurrence rate – every five years (storms) Recurrence rate – 50+ years (major) Epidemic: • 1976-2014 Ebola outbreaks • Flu occurs annually Pandemics: • 2009-2010 “Swine Flu” recurrence rate – 20 years • Dalco Passage oil spill of October 13, 2004 • Chlorine Spill Port of Tacoma February 12, 2007 Large incidents five-year recurrence Small incidents one-week recurrence
HAZARDOUS MATERIALS
Not Applicable
PIPELINE FAILURE
Not Applicable
• Northwest Pipeline Corporation natural gas incident May 1st, 2003, in Sumner 10 years recurrence
TERRORISM ACTIVE THREAT CYBER ATTACK
Not Applicable
Minor incident –recurrence 1-year Major Incident – recurrence 10 years
TRANSPORTATION ACCIDENT
Not Applicable State proclamations: 17-13--12/18/2017Amtrak derailment 15-05--4/16/2015 SR 410 Bridge 15-04--3/11/15 Damage to I-5 Overpass
Minor incidents – recurrence daily Major incidents - recurrence 10 years
Pierce County Civil Disturbance High Probability Locations Map Pierce County Civil Disturbance High Probability Locations Zoomed in Map Reasons for Dam Failures Nationally PC Dams that Pose a High or Significant Risk to the Public Pierce County High and Significant Risk Dams Dam Failures in WA State Mud Mt. Dam Intake Tacoma Power Outage 1929, USS Lexington provides power
Individuals hoping to avoid contacting disease
List of constituents or ingredients found in Bakken crude oil Environmental Protection Agency’s Identified Top Five Facilities Exxon Valdez Oil Spill, 1989 Pierce County Spill data from May 2018 to May 2019 Dalco Passage oil spill (October 13, 2004) Cities and Towns with interstate pipelines within, or within 1 mile of city limits Olympic Pipeline Rupture 06/10/99 Pierce County Pipelines Whatcom Falls Park, 2003 250 Active Shooter Incidents in the U.S. from 2000-2017: Incidents per year 250 Active Shooter Incidents in the U.S. from 2000-2017: Casualty Breakdown per year 250 Active Shooter Incidents in the U.S. from 2000-2017: Location Categories Occurrences in the Puget Sound Airports in Pierce County Ferry Services in Pierce County Transportation Accidents/Catastrophic Failures in Pierce County
PAGE 4-15 REGION 5 ALL HAZARD MITIGATION PLAN – 2020-2025 EDITION BASE PLAN
Hazus-MH Hazus Estimated Loss Information Loss estimates provided into Risk Summary Report were developed using the FEMA risk assessment modeling tool, Hazus-MH, Earthquake Model in conjunction with ArcGIS. Hazus estimates losses by combining information about the built environment with information about the location and magnitude of the hazard. The risk summary report primarily uses specific risk analysis methods which are summarized below:
Scenario Loss Estimates: The Pierce County risk assessments utilized ShakeMaps produced by the U.S. Geological Survey and scientists for three scenario earthquakes. The scenario ShakeMaps used for this analysis have estimated intensities and ground motions for events on faults that have ruptured in the past or have a likelihood of rupturing in the future. The purpose is for understanding the potential consequences of future large earthquakes. These earthquake scenarios are not predictions of future earthquakes. With this knowledge and the ShakeMap tool the information then is combined with detailed information on the built environment such as building type, age, and seismic upgrades which has been input into Hazus and estimate potential losses for each scenario. The risk assessment contains Hazus estimated combined losses for the following: • Residential Asset Loss - These include direct building loses (estimated costs to repair or replace the damage caused to the building) for all classes of residential structutreerd including single family, multifamily, manufactured housing, group housing, and nursing homes. This value also incluldes content losses. •
Commercial Asset Loss – These include direct building losses for all classes of commercial buildings including retail, wholesale, repair, profeccssional services, banks, hospitals, entertainment, and parking facilities. This value also includes content and inventory losses.
•
OtherAsset Loss – This includes losses for facilities generically categorized as industrial, agricultural, religious, government, etc. This value also includes content and inventory losses.
Scenario modeled maps were developed for Pierce County based on a combined direct building loss of residential, commercial and other asset losses. These maps and others are located in Appendix D of the jurisdicitonal plans with the exception of the hospitals which are located in Appendix E. In addition, the Hazus-MH Earthquake Model looks at the percent of confidence level that essential facilities will be functional on Day 1, Day 3, Day 7, Day 14, Day 30 and Day 90 of the earthquake event. Essential facilities includes; hospitals, schools, fire departments and police stations. The Planning Team chose Day 1 and Day 7 to model with a 90% confidence level that the facility will be operational following each of the scenario earthquake events. Maps were then PAGE 4-16 REGION 5 ALL HAZARD MITIGATION PLAN – 2020-2025 EDITION BASE PLAN
created from the analysis out put for each of the earthquake scenarios based on the functionality for each of the essential facilities for Pierce County. These maps are included in Appendix D for all the jurisdictions except the Hospital Group which is located in Appendix E. The Planning team decided to combine all essential facilities together and scale the information down to a jurisdictional level for the City and Town group and develop maps for each of the earthquake scenarios. These additional maps are also located in Appendix D. Scenario ShakeMaps An earthquake of similar magnitude to the earthquake scenario ShakeMaps struck the southern Puget Sound area about 1,100 years ago and scientists believe similar earthquakes are inevetiable to strike the region again. With a population density centered within the Puget Sound area hundreds of thousand peoples lives are at risk for ground shaking, landslides, liquefaction, and tsunamis from earthquakes of this magnitude. Modeled scenario shakemaps are produced for the purpose of emergency planners and community members to plan and become more reslient to future earthquake events. Three modeled scenario ShakeMaps were chosen to incorporate into Hazus-MH, to further develop Pierce County’s earthquake risk assessment. The Tacoma Fault with a magnitude of 7.1, Nisqually Fault with a magnitude of 7.2 and the SeaTac Fault also with a magnitude of 7.2. Because both the Nisqually Fault and SeaTac Fault will significantly affect Pierce County they were included within the mitigation plan . The ground motions derived for these shakemaps were generated using computer models with inputs from geological and geophysical observations specific to the region and the fault zone.
PAGE 4-17 REGION 5 ALL HAZARD MITIGATION PLAN – 2020-2025 EDITION BASE PLAN
Map 4-1 ShakeMap M7.1 Tacoma Fault Zone
The Tacoma Fault scenario hypothetically models the ground motion amplitudes of a rupture along the Tacoma Fault plane that extends from the surface to 9 miles (15 km) deep and is 35 miles (56 km) in length, from Belfair through Vashon Island extending near Federal Way. With this surface breaking earthquake scenario extensive damage is predicted which would be followed by many potential damaging aftershocks.
PAGE 4-18 REGION 5 ALL HAZARD MITIGATION PLAN – 2020-2025 EDITION BASE PLAN
Map 4-2 ShakeMap M7.2 SeaTac Fault Zone
The SeaTac Fault scenario hypothetically models the ground motion amplitudes of a rupture along the SeaTac Fault with a depth of 52 0km (83 miles).
PAGE 4-19 REGION 5 ALL HAZARD MITIGATION PLAN – 2020-2025 EDITION BASE PLAN
Map 4-3 ShakeMap M7.2 Nisqually Fault
The Nisqually Fault scenario hypothetically models the ground motion amplitudes of a rupture along the Nisqually Fault with a depth of 52 0km (83 miles).
PAGE 4-20 REGION 5 ALL HAZARD MITIGATION PLAN – 2020-2025 EDITION BASE PLAN
Geological Avalanche 4.1G Identification Description Definition An avalanche is a mass of loosened snow or ice that suddenly, and usually swiftly, slides down a mountain, growing by collecting additional material as it descends. Avalanches can occur whenever snow falls on slopes steeper than approximately 20 to 30 degrees. In Washington State avalanches exist solely in mountainous areas.
Types There are two basic types of avalanches, loose-snow avalanches and slab avalanches. Although the most dangerous avalanche is the slab avalanche, loose-snow slides can and do produce injury and death.
Loose-Snow Avalanche Loose-snow avalanches occur when grains of snow on a slope greater than a critical angle of repose cannot hold onto a slope and begin sliding downhill picking up more snow and fanning out in an inverted V. The source of the slide could be set off by a piece of falling rock or ice or any sort of disruption at the point of origin. A small loose-snow avalanche is frequently called a sluff. The largest and most destructive loose-snow avalanches are the large powder avalanches. The United States Department of Agriculture, Avalanche Handbook explains the process that creates loose-snow avalanches: (1) The layer is disturbed by any of several natural or artificial processes: overloading, from the added weight of newly fallen snow or a skier; vibration, from an earth tremor or explosive force; or, most important, internal changes such as the warming of the layer to a state of drastic loss of cohesion. (2) A small piece of the layer slips out; the piece can be as small as a single grain but is typically the size of a small snowball. (3) The loose piece either comes to rest at a new angle of repose or imparts enough energy to the snow in its track to cause an avalanche.1 Characteristics These avalanches may be either wet or dry. Since they are triggered at the surface it is largely dependent on the current weather. Cold weather not allowing melting close to the surface will result in dry loose-snow avalanches, while warm weather especially with intense sunshine will tend to melt the bonds between snow crystals within the upper layers of snow and create a wet avalanche.
AVALANCHE PAGE 4-21 REGION 5 ALL HAZARD MITIGATION PLAN – 2020-2025 EDITION BASE PLAN
A small slide composed of windblown snow cascading down a slope, but seldom accumulating much new snow as it goes, is often referred to as a spindrift avalanche. Spindrift avalanches are always dry.
Slab Avalanche Slab avalanches occur when a cohesive mass of snow breaks away from the slope all at once. There is a fracture line entirely surrounding the mass of snow that forms almost instantaneously. Based on their different characteristics, slab avalanches can be divided into two main categories: soft slab and hard slab avalanches. In addition, these avalanches can be sub-characterized by the type of contact they have with the underlying layers, the amount of water content in the snow and the triggering method. In this case they can be distinguished as dry or wet slab avalanches. Figure 4.1-1 Slab Avalanche Slab avalanches occur when the stresses on a slab overcome the internal strength of the slab and its attachment to the underlying snow or ground. A decrease in strength may be produced through warming, melting snow, rain, the metamorphosis of snow crystals in a layer, an increase in stress produced by the weight of additional snowfall, or a break in the bonds holding the slope together, see Figure 4.1-1. These avalanches can be triggered spontaneously by natural triggers or by a skier or a snowmobiler.
Soft Slab Soft slab avalanches are characterized by a lack of internal cohesion as they descend the slope. While the initial slab structure of a sequence of blocks is apparent when the slide begins the individual blocks rapidly break up into individual particles and the resulting mass may tend to resemble the consistency of a loose-snow avalanche. Hard Slab In contrast to soft slab avalanches, hard slab avalanches will continue to have a degree of cohesiveness throughout the descent. Sections will maintain themselves as independent blocks
AVALANCHE PAGE 4-22 REGION 5 ALL HAZARD MITIGATION PLAN – 2020-2025 EDITION BASE PLAN
within the mass of moving snow. These could be small along the lines of a couple of feet up to some that may be several meters across. Characteristics Like loose snow avalanches the differing characteristics of slab avalanches have to do with the amount of free water content within the slab. However, there are distinct differences. Dry slab avalanches tend to happen when there is a breakdown between bonds that are holding the layers of snow together. This can happen when extra weight is added to a slope, such as additional heavy snowfall. Skiers, snowmobilers, or a falling cornice can trigger this type of avalanche. The internal lack of cohesion in the snowpack may have a number of causes. These include the deposition of a layer of hoarfrost, or graupel, or the development of a layer of crystals that have metamorphosed into a layer with very weak bonds between the individual crystals. These layers may be so weak that they partially collapse creating a space in the snowpack between the different layers. Wet slab avalanches occur when water percolating through the top slab finds a layer of discontinuity where it can flow along, weakening or dissolving the bond between the layers, decreasing the ability of the lower layer to hold on to the upper layer or slab. This layer of discontinuity can be between actual snow layers or even between the snowpack and the underlying ground surface. This water moving through the snowpack increases the density of the snow, breaks the bonds holding the snow crystals together, and lubricates the intersection between the layers. Combined, these factors increase the chances of an avalanche. This type of avalanche is most prevalent in the spring when extra sun on the snowpack allows free water to percolate throughout the snowpack.
Profile Location and Extent Avalanches directly affect only mountainous areas of Pierce County. Areas in Pierce County that have potential for avalanches include Mount Rainier National Park, Crystal Mountain and other slopes of the Cascade Mountain Range. Avalanche season begins in November and runs through early summer for all mountain areas of the state; in high alpine areas of the Cascade Range, the season is year-round. In Pierce County, this is limited to Mount Rainier. The low elevation of the majority of the county’s mountainous terrain combined with dense forestation precludes a high probability of avalanches in most areas. Areas where avalanches are most likely to occur are: • • • •
Recreation areas in the Cascade Mountains, Slopes of Mount Rainier, Chinook Pass, SR 410 (closed to traffic in winter), and Cayuse Pass, SR 123 (closed to traffic in winter).
AVALANCHE PAGE 4-23 REGION 5 ALL HAZARD MITIGATION PLAN – 2020-2025 EDITION BASE PLAN
While not the case historically, most avalanche victims today are participating in recreational activities in the backcountry where there is no avalanche control. The primary cause of these avalanches is the weight of the victim or someone in the victim’s party on the slab of snow. Only one-tenth of one percent of avalanche fatalities occur on open runs at ski areas or on highways2. Based on the location of key transportation routes and recreational areas threatened by avalanche, the Washington State Hazard Mitigation Plan identifies Pierce County as one of the counties in the state with areas at risk from avalanches; see Map 4.1-1 Areas Vulnerable to Avalanche. However, it should be pointed out that the only jurisdictions with infrastructure directly affected by avalanches in Pierce County are the County, Washington State, Puyallup Tribe and the US Government. None of the others have any infrastructure or resident population located within the current avalanche hazard areas. Map 4.1-1 Areas Vulnerable to Avalanche
A number of weather and terrain factors determine avalanche danger: Weather • •
Storms – A vast majority of all snow avalanches occur during or shortly after storm periods.3 Wind – Wind is a re-distributor of snow, creating some areas with a thin snow pack and others with a deep snow pack. Snow is picked up from windward slopes and redeposited on
AVALANCHE PAGE 4-24 REGION 5 ALL HAZARD MITIGATION PLAN – 2020-2025 EDITION BASE PLAN
leeward slopes. Snow is carried from areas with strong wind to areas of little wind by three methods; rolling, saltation, or turbulent suspension. Rolling them along the ground, picking them up and bouncing them along (saltation) or picking them up and carrying them along in turbulent suspension tends to break down or pulverize the individual crystals into smaller particles. When this happens, the deposition creates a much denser mass that tends to solidify quickly into a slab. • • •
Rate of snowfall – Snow falling at a rate of one inch or more per hour rapidly increases avalanche danger. Temperature – Storms starting with low temperatures and dry snow, followed by rising temperatures and wetter snow, are more likely to cause avalanches than storms that start warm and then cool with snowfall. Wet snow – Rainstorms or spring weather with warm, moist winds and cloudy nights can warm the snow cover resulting in wet snow avalanches. Wet snow avalanches are more likely on sun-exposed terrain (south-facing slopes) and under exposed rocks or cliffs.
Terrain • • •
•
Ground cover – Large rocks, trees and heavy shrubs help anchor snow. Slope profile – Dangerous slab avalanches are more likely to occur on convex slopes; however they can occur on concave slopes. Slope aspect – Leeward slopes are dangerous because windblown snow adds depth and creates dense slabs. In the Cascades, these tend to be the north and east facing slopes. Due to the large amount of solar radiation increasing the percentage of free water in the snowpack, south facing slopes become more dangerous in the springtime. Slope steepness – Snow avalanches are most common on slopes of 30 to 45 degrees.
Occurrences Avalanches occur frequently in the backcountry of the Cascade Range, often without any impact to people, transportation routes, other infrastructure or development. Some slopes are prone to avalanche every year there is a significant snowfall. Others only do so when there is an unusual amount of snow combined with other weather variables and a trigger of some sort, like a skier crossing the slope. Crystal Mountain Ski Resort will also purposely trigger avalanches on the slopes controlled by the resort before the snow load gets large enough and unstable enough to threaten skiers or others spending time in the mountains. Mount Rainier is the primary location for avalanches in Pierce County. Since record keeping began in 1887, avalanches in Mount Rainier National Park have claimed approximately 95 lives. Recorded information (see Table 4.1-1 Pierce County Avalanches of Record) shows the more recent avalanches in Pierce County that resulted in fatalities. Table 4.1-1 Pierce County Fatal Avalanches of Record4
DATE
LOCATION
05/30/2014 06/06/2010 12/18/2007 05/02/2007
Mt. Rainier Mt. Rainier – Ingraham Mount Rainer - Edith Creek Basin Crystal Mountain
FATALITY/CASUALTY 6 fatalities 1 fatality 1 fatality 1 fatality
AVALANCHE PAGE 4-25 REGION 5 ALL HAZARD MITIGATION PLAN – 2020-2025 EDITION BASE PLAN
02/24/2007 10/24/2004 06/13/2004 01/16/2000 06/11/1998 1992 1988 06/21/1981 1958
Mount Rainier, Park Place near Crystal Mountain Mount Rainier – Ingraham Glacier Mount. Rainier – Liberty Ridge Crystal Mountain Mount Rainier Mount Rainier Mount Rainier Mount Rainier – Ingraham Glacier Silver Creek
1 fatality 1 fatality 2 fatalities 1 fatality 1 fatality, several injured 2 fatalities 3 fatalities 11 fatalities, serac collapse5 1 fatality
Recurrence Rate The recurrence rate for avalanches in Pierce County is yearly. Most of those that will cause fatalities, injuries or other damage happen within Mount Rainier National Park. There is some potential for slides to happen in the areas around Crystal Mountain. Outside of these two areas, Pierce County does not have roads that are open into avalanche terrain during the winter. As such, the potential for impact to a developed area or major road is extremely limited. Skiers, snowmobilers, snowshoers, climbers and other back country travelers, or those who access the roads which are closed in the winter will continue to be the individuals involved in avalanche incidents in the future. This is based on information from past avalanche occurrences, and a review of Pierce County topography and road infrastructure.
Impacts Health and Safety of Persons in the Affected Area at the Time of the Incident The impacts include the injury and possible death to persons in the affected area. Death may result from suffocation or traumatic injury. Injury may result either from impact with objects in the avalanche path, tumbling, or burial in the snow for a period of time. Those who survive the initial slide could suffer mental impairment from oxygen deprivation, hypothermia and/or frostbite prior to being rescued. There should be little, if any, long term effects to anyone not directly impacted by the avalanche.
Health and Safety of Personnel Responding to the Incident The impacts to response personnel include the possibility of secondary avalanches in the response area causing injury or death, as well as cold weather injuries like hypothermia and frostbite.
Continuity of Operations and Delivery of Services Due to the very limited nature of avalanches in Pierce County there should be no impact to the continuity of operations for any jurisdiction within the County. Roads impacted by the avalanche hazard within Pierce County are either within Mount Rainier National Park or closed during the majority of the avalanche season. None of those impacted roads affect the delivery of services to citizens of the County. Other infrastructure is not affected by the threat of avalanches.
AVALANCHE PAGE 4-26 REGION 5 ALL HAZARD MITIGATION PLAN – 2020-2025 EDITION BASE PLAN
Property, Facilities, and Infrastructure Due to the very limited nature of avalanches in Pierce County, and the closure of roads in the high avalanche areas, there should be no impact to the property, facilities and infrastructure of any jurisdiction within Pierce County.
The Environment Most avalanches follow the same paths that they have in the past, beginning high on mountain sides and descending slopes, frequently funneling into gullies. Impacts to the environment include damage to hillsides, an increase in erosion potential, death and injury to local animals, and in some case the actual destruction of forested areas.
Economic and Financial Condition Economically, avalanches in Pierce County may impact logging revenues, by either downing trees and/or damaging or closing roads that lead to logging areas on Crystal Mountain or by damaging facilities at the Crystal Mountain Ski Resort. While this may impact individual businesses for a short period of time, avalanches should not cause a major economic impact to any jurisdiction within Pierce County.
Public Confidence in the Jurisdiction’s Governance Due to the prevention of damage from avalanches either by control activities at the ski resorts or by the closing of roads, there should be no major avalanche impacts on citizens of Pierce County. The result is that public confidence in the governance of the County and other jurisdictions within it should not be dampened by the occasional avalanche injury or fatality due to the person being in the wrong place at the wrong time. These are all due to individual choice: the choice to climb, ski, snowmobile or snowshoe in areas that have an avalanche potential.
AVALANCHE PAGE 4-27 REGION 5 ALL HAZARD MITIGATION PLAN – 2020-2025 EDITION BASE PLAN
(This page intentionally left blank)
AVALANCHE PAGE 4-28 REGION 5 ALL HAZARD MITIGATION PLAN – 2020-2025 EDITION BASE PLAN
Geological Earthquake 4.2G Identification Description Definition6 An earthquake is what happens when two blocks of the earth suddenly slip past one another. The surface where they slip is called the fault or fault plane. The location below the earth’s surface where the earthquake starts is called the hypocenter, and the location directly above it on the surface of the earth is called the epicenter. Sometimes an earthquake has foreshocks. These are smaller earthquakes that happen in the same place as the larger earthquake that follows. Scientists can’t tell that an earthquake is a foreshock until the larger earthquake happens. The largest, main earthquake is called the mainshock. Mainshocks always have aftershocks that follow. These are smaller earthquakes that occur afterwards in the same place as the mainshock. Depending on the size of the mainshock, aftershocks can continue for weeks, months, and even years after the mainshock! Figure 4.2-1What is an Earthquake?7
Types8 Washington is situated at the collisional boundary of two primary tectonic plates. The boundary where these two plates converge, the Cascadia Subduction Zone, lies approximately 50 miles offshore and extends from the middle of Vancouver Island in British Columbia to northern California. As it collides with North America, the Juan de Fuca plate slides (or subducts) beneath the continent and sinks into the earth’s mantle. The collision of the Juan de Fuca and North American Plates produces the three main types of earthquakes discussed below and illustrated in EARTHQUAKE PAGE 4-29 REGION 5 ALL HAZARD MITIGATION PLAN – 2020-2025 EDITION BASE PLAN
Figure 4.2.-2 A fourth type of earthquake not covered in detail here is produced by the movement of magma inside a volcano. Such as those happening at Mt. St. Helens. Figure 4.2-2 Types of Earthquakes9
Deep Earthquakes (Benioff Zone) Intraplate, or Benioff Zone earthquakes in the Pacific Northwest are commonly referred to as deep earthquakes. They are capable of magnitudes 6.0 – 7.5, they typically occur between approximately 15 to 60 miles in depth and are within the subducting Juan de Fuca (oceanic) Plate. Most of the ones that impact Pierce County occur near or in an area where the Juan de Fuca Plate bends slightly as it slips beneath the North American (continental) Plate. These deep events typically have few, if any aftershocks. Deep earthquakes are the most frequent large events that strike Pierce County. The Nisqually earthquake is the most recent example that impacted Pierce County.
Crustal Fault Earthquakes Shallow crustal earthquakes occur primarily in western Washington, the northeastern flanks of the Cascade Range, and in the Columbia Plateau. These earthquakes are associated with movement on a fault. These earthquakes occur primarily at depths of 20 miles or less. Since 1992, there is rapidly accumulating evidence that large crustal earthquakes occur on the Seattle EARTHQUAKE PAGE 4-30 REGION 5 ALL HAZARD MITIGATION PLAN – 2020-2025 EDITION BASE PLAN
Fault in areas of high population. Active faults in the greater Pierce county area include Tacoma, Seattle, and the Rattlesnake Mountain Fault zone are capable of magnitudes 6.0 – 7.5 (Map 4.21). In Pierce County there is ongoing research to understand the history and threat posed by the Tacoma Fault.10 As research continues, developing information on the nature of the risk from the Tacoma Fault will have a significant effect on hazard assessments for Pierce County. Map 4.2-1 Pierce County Earthquake Sources: Active Faults (Czajkowki and Bowman, 2014)11
Cascadia Subduction Zone Earthquakes The Cascadia Subduction Zone (CSZ) "megathrust" fault is a 1,000 km long dipping fault that stretches from Northern Vancouver Island to Cape Mendocino California. It separates the Juan de Fuca and North America plates. The Juan de Fuca plate moves toward, and eventually is shoved beneath, the continent (North American plate). Cascadia Subduction zone (interplate) earthquakes occur less frequently than intraplate (deep) events, but probably more frequently than large crustal earthquakes. Great Subduction Zone earthquakes are the largest earthquakes in the world and are the only source zones that can produce earthquakes greater than M8.5. The CSZ has produced magnitude 9.0 or greater earthquakes in the past, and undoubtedly will in the future. The last known megathrust earthquake in the northwest was in January 1700, just over 300 years ago. Geological evidence indicates that such great earthquakes have occurred at least seven times in the last 3,500 years, a return interval of 400 to 600 years. To learn more about the history of the Cascadia Subduction Zone and the science that led to the discovery of it, delve into land level changes and turbidites created by the CSZ earthquakes. For more about the EARTHQUAKE PAGE 4-31 REGION 5 ALL HAZARD MITIGATION PLAN – 2020-2025 EDITION BASE PLAN
Cascadia Subduction Zone, visit the USGS webpage discussing this topic. Because Cascadia earthquakes have a very large source (the fault could rupture along its entire length from Vancouver Island to northern California) the ground motion may last for three-six minutes in Pierce County and be of lower frequency than motions from earthquakes like the Nisqually (February 28, 2001). These long periods of sustained ground motion, especially when combined with long period waves and soft soils, may be more damaging to large structures such as the Tacoma Narrows Bridge. Ground motion can be especially damaging to large buildings with complex designs, and also to many smaller buildings and homes.
Secondary hazards: •
Liquefaction - Soft soils or human-made fills can subside or experience liquefaction or lateral spreading in an earthquake. Liquefaction commonly causes lack of support for structures located on the liquefiable soils. Earthquake shaking can cause ground failures, ground cracking or boils from layers of sand sometimes located a number of meters under the surface. Lateral spreading is in fact a landslide that occurs on very shallow slopes due to the liquefiable nature of the soil. Noteworthy liquefaction took place in Puyallup during the 1949 earthquake and there were examples of it in both the 1965 and 2001 earthquakes. Liquefaction is directly related to the level of soil saturation combined with layers of sand. The sands that failed in Pierce County in many cases were sand deposits from Mount Rainier lahars (Map 4.2-6 Liquefaction in the Puget Sound Basin.)
•
Landslides, Avalanches, Mudflows - These can be triggered on steep slopes. Earthquakes have caused large and disastrous landslides, including debris flows from volcanoes. Loss of strength in sensitive, clay-rich soils can also cause landslides and other ground failures; see the Landslide and Volcanic Hazard Chapters of the Pierce County HIRA.
•
Dam Failure - This is also a possibility during an earthquake. Likely causes are either a fracture of the retention wall or the failure of the soils under the structure. The Department of Ecology’s inventory of dams lists 56 dams in Pierce County that, at peak storage, hold over ten acre-feet of water. This includes Mud Mountain Dam on the Pierce/King County border. In addition, Howard Hanson Dam on the Green River in King County could impact portions of Pierce County if it had a catastrophic collapse.
•
Levee Failure - Levees in their role as a flood control feature exist to protect the land and the facilities on it from flood waters. Being largely built on liquefiable valley soils, damage to the levees is a real possibility. If an earthquake with resulting damage to levees happens during flood season, extensive flooding could occur before the levees were repaired. The real threat here is not to the levees themselves but if the river floods before the levee damage can be corrected the resulting threat is to the population, facilities and infrastructure situated behind those levees.
o Tsunamis and Seiches - Vertical ground displacement, co-seismic subsidence, or earthquake induced landslides can all cause tsunamis and seiches; see Tsunami Hazard Chapter of the HIRA.12 o Fires - Fire following earthquake (FFE) scenarios are not fully yet up to the standards that can be used by city authorities for decision making. Limited structural analyses of EARTHQUAKE PAGE 4-32 REGION 5 ALL HAZARD MITIGATION PLAN – 2020-2025 EDITION BASE PLAN
individual buildings under FFE scenarios have been completed. Results show that the drift demand on the building frame increases during post-earthquake fires. Causes of FFE “ignitions and the consequent conflagrations can be listed as follows: ▪ Natural gas, as a flammable fuel, can be the cause of 20-50 percent of the total postearthquake fire ignitions (SSC, 2002). ▪ Local fire ignitions can spread through vegetation and inadequate building separation. ▪ Chaos following an earthquake, blocked transportation or communications, and reduced water supplies lower response time of the firefighters. Following an earthquake, firefighters also have to respond to structural collapses and medical emergencies. ▪ Tall buildings would also be at risk and the presence of a sprinkler system does not guarantee fire prevention after an earthquake (Taylor, 2003): • Higher occupancy load, limited exit ways, increased escape path length and a high level of reliance on active fire-fighting measures put tall buildings at a high risk of damage due to FFE. • In tall buildings, if the active firefighting system does not activate, fire can spread fast. • Building occupants may be at higher risk of loss of life, as potential damage to passive and active fire protections, possible damage to exit ways or obstacles on the way and delayed response of firefighters. • It is, in general, harder to have an effective fire intervention in a tall building because of inaccessibility to reach inside the building, especially upper floors. • Wind forces at upper floors, and potential natural air movement, can cause fire and smoke movement and fire spread. For example, there were fatalities in the Las Vegas MGM fire due to smoke inhalation at floors above the fire location. Vertical fire spread is also possible through exterior façade (such as the First Interstate Bank in Los Angeles). • Compartmentation is important in controlling the fire. Damage to walls and partitions can cause loss of integrity of fire separations, which leads to spread of fire.”13
EARTHQUAKE PAGE 4-33 REGION 5 ALL HAZARD MITIGATION PLAN – 2020-2025 EDITION BASE PLAN
Profile Location and Extent Earthquakes directly and indirectly affect all of Pierce County. Two measurements that describe the size of an earthquake are intensity (a measure of the degree of earthquake shaking at a given locale based on the amount of damage) and magnitude (estimates the amount of energy released at the source of the earthquake).14 To illustrate the earthquake risk in the County and region, Figure 4.2-1, on page 3, shows the location of the various types of earthquakes that affect the Pacific Northwest. Map EQ-1 shows the major faults in the Puget Sound. Map 4.2-5 shows the seismic hazard areas throughout Pierce County as defined by areas of liquefiable soils. For more information see the Washington Department of Natural Resources Seismic Scenarios Catalog.15 Pierce County could experience earthquakes from all three sources (subduction zone, crustal fault, and deep earthquakes) and therefore the entire region is at risk to the earthquake hazards described in this chapter. Light Detection and Ranging (LIDAR) mapping “uses light in the form of a pulsed laser to measure ranges (variable distances) to the Earth.”16 New data (such as lidar, geologic mapping, geophysical studies, and paleoseismology) help scientists to better understand earthquake sources. Map 4.2-2 Seattle and Tacoma Fault Segments
The Modified Mercalli Intensity (MMI) Scale describes the observed effects of ground shaking at each corresponding shaking intensity level, designated by Roman Numerals. This scale is used for estimating the intensity of shaking for different earthquake scenarios and can be generated after a major earthquake to show where the shaking was the strongest.
EARTHQUAKE PAGE 4-34 REGION 5 ALL HAZARD MITIGATION PLAN – 2020-2025 EDITION BASE PLAN
Below is a scale published in January 2015 that was developed for the purpose of a 2016 Magnitude 9.0 Cascadia Rising (subduction zone) earthquake exercise. Damage descriptions were based upon modeling of a seismic event of a particular magnitude, location, and faulting mechanism. They should not be read as a definitive statement of likely damages from any one of many possible Cascadia Subduction Zone events. This scale and earthquake measurement tool is useful because it depicts what a person could experience from an earthquake. The magnitude scale is based on energy released. For example you could have a deep magnitude 7 earthquake and people living above the epicenter may feel MMI intensity III (weak shaking), and a magnitude 7 in the same area but on a shallow crustal fault could have a MMI of V-VIII (strongvery strong shaking). The descriptions of intensity are as follows: •
I shaking not felt except by very few under favorable conditions;
•
II weak shaking felt only by a few persons at rest, especially on upper floors of buildings;
•
III weak shaking felt noticeable by persons indoors, especially on upper floors of buildings, many people do not recognize it as an earthquake, standing motor cars may rock slightly, vibrations similar to the passing of a truck, duration estimated;
•
IV light shaking felt indoors by many, outdoors by few during the day, at night, some awakened, dishes, windows, doors disturbed, walls make cracking sound, sensation like heavy truck striking building, standing motor cars rocked noticeably;
•
V moderate shaking felt by nearly everyone, many awakened, some dishes, windows broken, unstable objects overturned pendulum clocks may stop;
•
VI strong shaking felt by all, many frightened, some heavy furniture moved, a few instances of fallen plaster, damage slight;
•
VII very strong shaking damage negligible in buildings of good design and construction, slight to moderate in well-built ordinary structures, considerable damage in poorly built or badly designed structures, some chimneys broken;
•
VIII severe damage slightly in specially designed structures, considerable damage in ordinary substantial buildings with partial collapse, damage great in poorly built structures, fall of chimneys, factory stacks, columns, monuments, walls, heavy furniture overturned;
•
IX violent damage considerable in specially designed structures, well-designed frame structures thrown out of plumb, damage great in substantial buildings with partial collapse, buildings shifted off foundations;
•
X extreme damage some well-built wooden structures destroyed, most masonry and frame structures destroyed with foundations, rails bent.
EARTHQUAKE PAGE 4-35 REGION 5 ALL HAZARD MITIGATION PLAN – 2020-2025 EDITION BASE PLAN
Maps 4.2-3 through 5 below show the shake maps developed by USGS, with scenario modeling for the Tacoma Fault, Seattle Fault, and Cascadia Subduction Zone respectively. Map 4.2-3 Magnitude 6.9 Scenario Earthquake – Tacoma Fault Zone 9.0 km depth
EARTHQUAKE PAGE 4-36 REGION 5 ALL HAZARD MITIGATION PLAN – 2020-2025 EDITION BASE PLAN
Map 4.2-4 Magnitude 7.2 Scenario Earthquake – Seattle Fault Zone – Northern 9.0 km depth
EARTHQUAKE PAGE 4-37 REGION 5 ALL HAZARD MITIGATION PLAN – 2020-2025 EDITION BASE PLAN
Map 4.2-5 Magnitude 9.3 Scenario Earthquake – Cascadia Megathrust – 21.4km depth
EARTHQUAKE PAGE 4-38 REGION 5 ALL HAZARD MITIGATION PLAN – 2020-2025 EDITION BASE PLAN
Map 4.2-6 (next page) illustrates the location and extent of Pierce County’s liquefaction susceptibility/hazard. As illustrated, the majority of liquefiable soils in Pierce County are located in the County’s river valleys. The largest area of liquefiable soils is the Puyallup River Valley while the Carbon, White, and Nisqually River Valleys are also liquefaction hazard areas. The areas with the highest liquefaction hazard are located in both incorporated and unincorporated areas of the County. Auburn, Buckley, Eatonville, Fife, Milton, Puyallup, Orting, South Prairie, Sumner, and Tacoma all have at least some of their land located in these areas. Another earthquake risk is in areas of high landslide susceptibility and potential. Earthquake shaking can induce landslides as a secondary hazard. This can be especially true during periods when the soils are saturated. In Pierce County this can go from October through June depending on the fall and winter weather. The landslide potential can be seen in the Landslide chapter on maps L-1 and L-2. Earthquakes directly and indirectly affect all of Pierce County. To illustrate the earthquake risk in the County, Figure 4.2-1, shows the location of the various types of earthquakes that affect the Pacific Northwest. Figure 4.2-3 shows the major faults in the Puget Sound. Map 4.2-2 shows the location of the Seattle Fault and the various branches of the Tacoma Fault and Map 4.2-3 shows the seismic hazard areas throughout Pierce County as defined by areas of liquefiable soils. The scientific studies that have been done that created these maps state that the entire region is at risk to the earthquake hazard. Continuing updated information on the Tacoma Fault is revealing it and the surrounding geologic structure in greater detail yearly. One of the methods has been through the use of Light Detection and Ranging (LIDAR) mapping. The documented examples of these land-level changes date to about 1,100 years ago, though much remains to be learned about its extent and shape. As can be seen from Map 4.2-1 the various segments of the fault appear to run westward and northwestward from Tacoma across the Kitsap Peninsula17 Ongoing research will continue to change our understanding of the Tacoma Fault and other local faults and their potential for a damaging earthquake to affect Pierce County. While the entire County experiences shaking during earthquakes, areas of liquefaction experience even greater shaking. Map 4.2-6 illustrates the location and extent of Pierce County’s seismic hazard based on areas of liquefaction. As illustrated, the majority of liquefiable soils in Pierce County are located in the County’s river valleys. The largest area of liquefiable soils is the areas. The areas with the highest liquefaction hazard are located in both incorporated and unincorporated areas of the County. Auburn, Buckley, Eatonville, Fife, Milton, Puyallup, Orting, South Prairie, Sumner, and Tacoma all have at least some of their land located in these areas. The other area of earthquake risk is in the area of landslide potential. Earthquakes tend to create landslides as a secondary hazard. This can be especially true during periods when the soils are saturated. In Pierce County this can go from October through June depending on the fall and winter weather. The landslide potential can be seen in the Landslide section on maps 4.3-1 and 4.3-2.
EARTHQUAKE PAGE 4-39 REGION 5 ALL HAZARD MITIGATION PLAN – 2020-2025 EDITION BASE PLAN
Map 4.2-6 Pierce County Liquefaction Susceptibility Hazard
EARTHQUAKE – PAGE 4-40 REGION 5 HAZARD MITIGATION PLAN – 2020-2025 EDITION
Occurrences18 Over the last 100 years, a large area of the state has experienced earthquake damage. The majority of the largest earthquakes felt in Washington have occurred in the Puget Sound region between Olympia and the Canadian border, in the Cascade Mountains, and along the Washington-Oregon border. Medium to large magnitude earthquakes (greater than 5.0) have occurred repeatedly in the Puget Sound region. Map 4.2-7 shows the location, date, and magnitude of major earthquakes since 1872 in the Pacific Northwest.
Map 4.2-7 Major Pacific Northwest Earthquakes1
In addition, Table 4.2-1 lists some of the notable earthquakes felt in Pierce County and is followed by a discussion of occurrences by type of earthquake. Intraplate (Benioff Zone19) Earthquakes20 The magnitude 6.8 Nisqually earthquake on February 28, 2001 caused extensive non-structural damage throughout the region. Loss estimates from this event are greater than $350 million statewide. The large earthquakes of 1965 (magnitude 6.5), 1949 (magnitude 7.1), and 1946 (magnitude 6.3) killed 17 people and caused more than $340 million (2002 dollars) in property damage in several counties. Since 1870 there have been six significant intraplate earthquakes in the Puget Sound basin.21 Table 4.2-1 Notable Earthquakes, Magnitude 5.0 or Greater, Felt in Pierce County22, DATE YY/MM/DD
(UTC)TIME HH:MM:SS
LATITUDE (N)
LONGITUDE (W)
DEPTH (KM)
MAG
COMMENTS
1872/12/15
05:40:00
47.75N
119.87W
0.0
6.8
14.5 KM SE OF CHELAN, WA
1880/12/12
20:40:00
47.50N
122.50W
0.0
6.0
12.3 KM SE OF BREMERTON, WA
1882/04/30
10:40:00
47.40N
122.59W
0.0
5.7
18.7 KM S OF BREMERTON, WA
EARTHQUAKE – PAGE 4-41 REGION 5 ALL HAZARD MITIGATION PLAN – 2020-2025 EDITION BASE PLAN
DATE YY/MM/DD
(UTC)TIME HH:MM:SS
LATITUDE (N)
LONGITUDE (W)
DEPTH (KM)
MAG
1891/03/07
07:40:00
47.50N
121.75W
0.0
5.0
2.7 KM E OF NORTH BEND, WA
1891/11/29
23:21:00
48.00N
123.50W
0.0
5.6
13.5 KM SSW OF PORT ANGELES, WA
1904/03/17
04:20:00
47.79N
123.00W
0.0
5.3
27.6 KM WNW OF POULSBO, WA
1931/12/31
15:25:00
47.50N
123.00W
0.0
5.0
28.9 KM WSW OF BREMERTON, WA
1932/07/18
06:01:00
48.00N
121.80W
0.0
5.7
15.6 KM SE OF GRANITE FALLS, WA
1932/08/06
22:16:00
47.70N
122.30W
0.0
5.0
7.2 KM WNW OF KIRKLAND, WA
1939/11/13
07:45:54
47.40N
122.59W
31.0
6.2
18.7 KM S OF BREMERTON, WA
1945/04/29
20:16:17
47.40N
121.69W
0.0
5. 7
12.5 KM SSE OF NORTH BEND, WA
1945/04/30
07:45:45
47.40N
121.69W
0.0
5.0
12.5 KM SSE OF NORTH BEND, WA
1946/02/15
03:17:47
47.29N
122.90W
25.0
5.8
28.4 KM N OF OLYMPIA, WA
1946/02/15
12:17:15
46.86N
122.26W
0.0
5.0
0.3 KM NW OF EATONVILLE, WA
1946/02/23
08:54:53
47.04N
122.88W
0.0
5.0
0.0 KM SE OF OLYMPIA, WA
1946/06/23
15:13:00
49.80N
125.30W
0.0
7.4
26.3 KM WNW OF COURTENAY, BC
1948/09/24
22:35:00
47.85N
122.58W
0.0
5.0
14.0 KM NNE OF POULSBO, WA
1949/04/13
19:55:43
47.09N
122.75W
54.0
7.1
12.3 KM ENE OF OLYMPIA, WA
1954/05/15
13:02:32
47.40N
122.50W
0.0
5.0
18.9 KM NNW OF TACOMA, WA
1965/04/29
15:28:43
47.40N
122.40W
57.0
6.5
18.3 KM N OF TACOMA, WA
1980/05/18
15:32:11
46.20N
122.18W
2.8
5.7
1.0 KM NNE OF MT ST HELENS, WA
1981/02/14
06:09:27
46.34N
122.23W
7.3
5.2
1.8 KM N OF ELK LAKE, WA
1981/05/28
09:10:45
46.52N
121.39W
3.2
5.0
4.4 KM ENE OF GOAT ROCKS, WA
1990/04/14
05:33:26
48.84N
122.16W
12.6
5.0
4.7 KM ENE OF DEMING, WA
1995/01/29
03:11:22
47.38N
122.36W
15.8
5.0
17.5 KM NNE OF TACOMA, WA
1996/05/03
04:04:22
47.76N
121.87W
4.3
5.4
8.5 KM ENE OF DUVALL, WA
1999/07/03
01:43:54
47.07N
123.46W
40.7
5.8
8.0 KM N OF SATSOP, WA
2001/02/28
18:54:32
47.14N
122.72W
51.9
6.8
2001/06/10
13:19:11
47.16N
123.50W
40.7
5.0
17.0 KM NE OF OLYMPIA, WA 1361-DRWA 18.3 KM N OF SATSOP, WA
COMMENTS
EARTHQUAKE – PAGE 4-42 REGION 5 ALL HAZARD MITIGATION PLAN – 2020-2025 EDITION BASE PLAN
Crustal Earthquakes23 Best available science indicates that on the Tacoma Fault uplift to the north and subsidence to the south occurred most recently in A.D. 800–1200, not necessarily in a single year. The age range of this uplift on the north side of the Tacoma Fault includes times of coseismal uplift and subsidence at many sites around Puget Sound.24 It must be understood that damage could also come from earthquakes on other crustal faults from both within and outside Pierce County. Of particular concern are the Seattle Fault and the West Rainier Seismic Zone. Other small localized faults like the Burnett, Wilkeson, Miller and Devereaux faults in the eastern portion of the County might cause some localized problems but are not expected to cause widespread damage. Cascade Subduction Zone Earthquakes25 In addition to crustal and intraplate earthquakes, research indicates that the Cascadia Subduction Zone (CSZ) offshore Washington, Oregon, California, and British Columbia has generated great earthquakes in the past and will do so again the future. These earthquakes estimated to be in the range of magnitude 8 to 9 appear to have occurred at uneven intervals over the past several thousand years. At least 41 great subduction earthquakes may have occurred in the Pacific Northwest over the past 10,000 years. The most recent great subduction earthquake in Washington State occurred over 300 years ago on January 26, 1700. Currently, it appears that the mean recurrence rate for CSZ events is about 550 years. The actual recurrence rate is highly variable with the shortest time period between them being around 100 years, and the longest time span being around 1,100 years.26 Recurrence Rate For each of these earthquake sources (crustal, deep, and subduction zone), the largest earthquakes recur at poorly known, probably irregular, intervals. On average, the intervals are on the order of decades for the intraplate (deep) earthquakes on the Juan de Fuca Plate, millennia for the best-known of the upper-plate faults (the Seattle Fault), and centuries for the subduction zone. Although the earthquake record in Washington State is relatively short to form precise estimates of the recurrence rate for earthquakes, the record we do have allows at least an estimate of the overall rate. Realizing the fact that earthquakes happen daily in Washington, we are only interested in the ones that potentially cause damage. Taking into account the three different types of earthquakes listed above and the past occurrences we know of, we find that for the short historical record we have the intraplate earthquakes are the ones with by far the shortest recurrence rate. It must be realized that the 36-year period between the 1965 quake and the 2001 earthquake may be closer to the real average and that the 23-year average from the record may be a little short. So, until better scientific evidence allows an improved estimate of the actual recurrence rate, we will list the probability of recurrence for the earthquake hazard in Pierce County to be less than 40 years.
EARTHQUAKE – PAGE 4-43 REGION 5 ALL HAZARD MITIGATION PLAN – 2020-2025 EDITION BASE PLAN
Impacts All discussion of the impacts of an earthquake must take into account the magnitude, epicenter and focus of the earthquake. This includes whether it is a subduction quake on the junction of the Juan de Fuca and North American plates off the coast of Washington, a deep earthquake like the 2001 Nisqually quake or one on either the Seattle or Tacoma faults. Other variables outside the obvious impact of magnitude of the quake include aftershocks, weather both before and after the earthquake, the time of day, time of year, and the percentage of older buildings of construction techniques that are not up to current building code standards. For the purposes of this section, preliminary impacts will be from the Scenario for a Magnitude 7.2 Earthquake on the Seattle Fault.27
Health and Safety of Persons in the Affected Area at the Time of the Incident Depending on the size and location of the earthquake, the effect on persons in the impacted area is expected to range from a repeat of the Nisqually quake of 2001 up to those from a hypothetical 6.7 or larger earthquake on one of the major faults in Puget Sound or a large subduction quake located off the coast of Washington. The magnitude 6.8 Nisqually Earthquake of February 28, 2001 resulted in one death and approximately 400 recorded injuries, including a dozen that were serious, throughout the Puget Sound Basin; (Figure 4.2-3 Salmon Beach Damage.28). The expectation is that a similar quake would produce similar results. The effects of a surface rupture on the Seattle or Tacoma faults could lead to a much greater loss of life and injuries due to stronger ground shaking, surface rupture, and potential tsunami impacts. Losses are estimated to be equivalent to those from the Northridge California quake of 1994. However, in Northridge, the time of day dramatically decreased the actual number of casualties. That earthquake, striking at 4:30 in the morning, did not cause the number of deaths and injuries that would have happened at a later hour. At that time the number of people on the roads and bridges that collapsed was very low as were the staff in the buildings that collapsed. In contrast, a model from 2005 estimated losses here in the Puget Sound Basin (based on 2000 Census data) following a magnitude 6.7 Seattle Fault earthquake with an expected 1,600+ fatalities and 24,000+ injuries.29 A variation on this either up or down in the magnitude could have a significant effect on the outcome. In discussing a subduction quake, it must be understood that while the State has experienced quakes of this type possibly as high as magnitude 9, all of them were prior to settlers with a written language entering the State of Washington. The violent shaking expected with a surface quake on the Tacoma or Seattle faults will be attenuated to a certain extent by the distance from the actual fracture zone. Located off the Washington coast, the earthquake waves will have to travel over 100 miles to reach Pierce County. On the other hand, “(T)his particular type of earthquake is especially hazardous to tall buildings, which could lead to significant fatalities in downtown areas.”30
EARTHQUAKE – PAGE 4-44 REGION 5 ALL HAZARD MITIGATION PLAN – 2020-2025 EDITION BASE PLAN
In previous large earthquakes, the potential for an outbreak of disease appears to increase. This can be caused by polluted water sources, the eating of spoiled food, and the inhalation of dust kicked up by the quake. In addition, here in Pierce County, there could be environmental injuries such as hypothermia if the earthquake happened during the winter months. Figure 4.2-3 Salmon Beach, Tacoma Washington – Following Feb. 2001 Earthquake
Health and Safety of Personnel Responding to the Incident Responders are subject to a number of hazards in the response phase of the emergency. Damaged fire stations could prevent fire personnel from utilizing all the equipment with which they are used to responding. Already damaged structures could collapse during search and rescue operations, especially during aftershocks. Response personnel, by the very nature of their work are putting themselves in harm’s way, not just from structural collapse during aftershocks but also from further landslide activity and respiratory problems due to the inhaling of quantities of dust and microbes stirred up by the earthquake. In addition, they can be exposed to bacteria and chemicals in the environment they are working in, sometimes without realizing what the particular dangers are. “Following the Loma Prieta earthquake, about 20% of post-earthquake injuries were caused by toxic materials.”31 For those who are caught in the dust cloud created by an earthquake the respiratory problems could be similar to those experienced by first responders to the World Trade Center collapse in 2001.32 This can be shown to be a problem across many different emergency responses. It correlates with the amount of toxins and dust that are in the environment, for example approximately 80% of Red Cross responders who went to work on Hurricane Katrina response returned home with respiratory infections.33
EARTHQUAKE – PAGE 4-45 REGION 5 ALL HAZARD MITIGATION PLAN – 2020-2025 EDITION BASE PLAN
First responders frequently have adverse psychological reactions to trauma and especially disasters. Long term psychological impacts were noticed years ago, such as after the collapse of the Hyatt Regency Hotel walkway in Kansas City, Missouri in 1981, and eventually led to the development of Critical Incident Stress Management. Divorce and suicide rates are higher than the normal population in the first responder community and even greater after a major event.34 “(S)tress is not like a light switch—the images of such tragic events often haunt the responder into his or her home life, piling more pressure on other events. Ill health effects can include high blood pressure, sleep disorders, alcohol or sleeping aid abuse, anger, withdrawal from family members, over protectiveness for family members, and even paranoia.”35,36
Continuity of Operations and Delivery of Services For a large earthquake impacting Pierce County, continuity of operations will be severely taxed for many, if not most, of the agencies and jurisdictions located therein. The impacts affecting continuity of operations include: o o o o o o
Death or injury to staff limiting the number of staff able to fill normal operational duties; Inability of staff to respond to their work sites due to road closures from debris on the roads, liquefaction or lateral spreading damaging the roads, and bridges or overpasses damaged closing arterials in particular; Staff absenteeism while checking on or taking care of family, and handling damage to home or other personal property; Damage to communications systems will limit organizations’ ability to coordinate their own resources, and it will also limit their ability to pull together a full picture of the damage suffered in their jurisdiction and to request assistance if needed Damage to facilities and equipment; and Damage to the water, energy and sewer systems connected to agency facilities will not allow operations to continue in their normal manner.
Due to the limitations mentioned above, delivery of services will be heavily impacted by a large earthquake. Infrastructure damage or destruction combined with lack of staff will obstruct the delivery of normal governmental services. Law enforcement operations will be taxed to the maximum. Road closures, prevention of citizens entering hazardous areas, control of looting, responding to search and rescue operations, etc. combined with a decrease in available staff due to all the factors listed above will severely limit normal day-to-day operations. Most individual law enforcement officers operate independently of others in their jurisdiction. Since many of them have their equipment with them, including cars, they may be able to assist at least in the area they are at when the earthquake happens. Fire response will be impacted in a similar vein, however for many of them they will have to report to a station where they can respond from. Between the inability to get to their station and the possibility that the stations and equipment may be damaged or destroyed the response will be compromised. Many fire stations, especially the older ones, even though they have survived previous moderate quakes may not survive a large one. Even if a station is not destroyed or collapsed, a racking of the walls could jam the bay doors closed. EARTHQUAKE – PAGE 4-46 REGION 5 ALL HAZARD MITIGATION PLAN – 2020-2025 EDITION BASE PLAN
Public works and utilities will not have the ability to have services back up and operational, in many cases, for days, weeks or even months. Repair of roads, bridges, water and sewer lines, the electric grid and telephone lines and towers will tax these utilities to the maximum. Even with the importation of mutual aid and other assistance from other portions of the state and other states, the service delivery will be slow to develop and spotty at best for some time. Schools will be unable to fulfill normal expectations. Damage to schools’ infrastructure as well as the public infrastructure of roads and utilities will close down schools at least temporarily. Those that might be able to be operational will, in many cases, have to act as temporary shelters for those displaced by the earthquake. Immediately after the earthquake, if school is in session, they may have to house students for days until parents are able to retrieve them.
Property, Facilities, and Infrastructure Any large earthquake on the Seattle or Tacoma Faults or from many other faults in Washington State will create damage to the property, facilities and infrastructure either owned by jurisdictions in Pierce County or needed to support their economy and citizens. This includes damage to buildings, electrical grids, telephone service, including cellular phone operations, water and sewer utilities, port facilities, transportation systems, and both natural gas and liquid fuel pipelines. Several factors will determine the effect of ground shaking on the building stock and infrastructure of any area. These include soil composition, age of the facilities, focus (depth of the quake), epicenter (point on the earth’s surface directly over the focus), and weather previous to the event surface faulting subsidence and uplift. First, is soil composition. Soft and liquefiable soils will both intensify ground shaking and in the case of liquefiable soils lose structural integrity. Earthquake waves moving along the surface of the ground have different characteristics depending on the soil composition they encounter. These surface waves, when they progress from one soil type to another change. They tend to travel slower through soft soils than they do through hard soils or bedrock. Yet the energy contained in the wave stays the same. The result is that as the wave changes speed the amplitude will change in relation to it, increasing in soft soils and decreasing in hard soils. This increase in wave amplitude in soft soils can damage structures, especially unreinforced masonry and pre1970 tilt up structures.37 When the soil loses structural integrity, liquefaction or lateral spreading may be the result. This is especially prevalent in areas of artificial fill like on the Tacoma Tide Flats and the valley bottoms like the Puyallup and Nisqually where thousands of years of silt and sand washing down the river combined with lahar debris has created soils prone to it. In cases like this, buildings or portions of buildings built on it may sink (Figure 4.2-4 Liquefaction, Niigata Japan, 196438). In the case of lateral spreading, it can move railroad tracks, bend or collapse roads, move cranes or do other damage associated with the soil under the facility moving (Figure 4.2-5 Lateral spreading along North Deschutes Parkway in Thurston County39). This damage, while in many cases not as spectacular looking as buildings tipped over by liquefaction, can have a major impact on the community. For emergency operations it limits the ability of emergency workers EARTHQUAKE – PAGE 4-47 REGION 5 ALL HAZARD MITIGATION PLAN – 2020-2025 EDITION BASE PLAN
to respond to incidents throughout the community and it can prevent people from bringing the community back to normal and developing its economic base until this portion of the infrastructure has been repaired. Secondly, much of the building stock that exists in Pierce County was built before current earthquake codes were put into place and before there was much of an understanding of the actual hazard that exists from earthquakes in Washington State. It was only towards the end of the 1980s that geologists began to understand some of the processes that cause earthquakes in the Pacific Northwest, and decades later when the earthquake hazards were incorporated into the building code. Since that time both geologic research into our local earthquake hazard as well as engineering studies of building response in earthquakes has shown that some of the older building stock could have major structural problems, possibly to the point of collapse. The third and fourth factors that will have a major bearing on the damage done to a community and to its ability to recoup from its losses Figure 4.2-4 Liquefaction, Niigata Japan 1964 are the depth of the earthquake (focus) and the location of its epicenter in relation to the rest of the County. An intraplate earthquake located inside the Juan de Fuca Plate as it dives under the North American Plate will be deep enough that the waves it generates will be attenuated or lose some energy as they propagate outwards from the focus. In such a situation, even if the earthquake’s epicenter is located in Pierce County the damage will not be too catastrophic. This was the case with the 2001, 1965 and 1949 earthquakes all of which had epicenters close to or in Pierce County, see Table 4.2-1 Notable Earthquakes Magnitude 5.0 or Greater Felt in Pierce County. Taking the same size earthquakes, with magnitudes 6.8, 6.5, and 7.1 respectively, and moving them close to the surface could have caused damage similar to the Northridge, California (6.7), Loma Prieta, California, (7.1), or Kobe, Japan (6.8) earthquakes. In each of these cases with the epicenter of the quake, 2001 (Anderson Figure 4.2-5 Lateral Spreading –March 2001 Island), 1965 (Des Moines) and 1949 (Nisqually Delta), deaths and injuries would have been much more prevalent. Buildings would have collapsed, fires would have started, bridges and freeway overpasses would have been more heavily damaged and other lifelines would have been in disarray or out of commission for long periods of time.
EARTHQUAKE – PAGE 4-48 REGION 5 ALL HAZARD MITIGATION PLAN – 2020-2025 EDITION BASE PLAN
This is the scenario that Pierce County is looking at if there was an earthquake of that size on the Tacoma Fault. In addition, any earthquake on a surface fault close to Pierce County like the Seattle or Olympia faults will cause damage in Pierce County although probably to a lesser degree, being some distance away. A subduction zone earthquake will be located further away from Pierce County than the surface quakes mentioned above and so the waves will be attenuated somewhat by the time they get to Pierce County compared to their size on the coast. However, the shaking could run for multiple minutes. This shaking could continue for a much longer time than the intraplate earthquakes we have historically had. While all of Pierce County is vulnerable to this type of earthquake, the most vulnerable areas will be those containing soft soils; both natural and those created by artificial fill. The next factor that can influence the outcome of an earthquake is the weather. The weather previous to the earthquake will have an effect on the eventual outcome. Rain saturating the ground can increase both the potential for earthquake generated landslides and the probability that liquefaction or lateral spreading will occur. This could increase the probability that pipes could break. Lateral spreading under roads, railroad tracks and port facilities would increase disrupting transportation and there could be an increase to building damage due to liquefaction. The other area that could cause damage is actual surface disruption either from surface faulting, or subsidence and uplift. Fault ruptures breaking the surface can rip buildings apart, destroy bridges, offset roads, break pipelines, destroy sewer lines, and stretch or break transmission lines. The same can be said for subsidence and uplift. Having a building, road or any other piece of infrastructure where a portion of it either rises or falls in relation to the rest will break or destroy it. Any piece of infrastructure either in the ground or on its surface can be broken or destroyed by any of these three effects. Changes in the ground can affect the water table. Wells may change their water levels or go dry. Stream flows may be altered and on a macro scale landslides or other ground deformation may change the course of streams or rivers.
The Environment Impacts, or damage, to the environment may be thought of as two different processes. There is direct change to the environment caused by the earthquake. This incorporates all the natural damages such as landslides, coastal uplift, inundation of low-lying areas with coastal subsidence and tsunami damage. In contrast, the other process involves the pollution that becomes endemic in the aftermath of an earthquake that strikes an urban area or some part of the infrastructure today. Traditional environmental changes due to earthquakes, while many times damaging in the short term, can sometimes be overcome with time as the local ecosystem absorbs them. These types of environmental effects have been happening for as long as the land that is now Pierce County has been around. These types of impacts include:
EARTHQUAKE – PAGE 4-49 REGION 5 ALL HAZARD MITIGATION PLAN – 2020-2025 EDITION BASE PLAN
•
• •
•
Landslides – Landslides will sometimes block streams or rivers forcing them to reroute, occasionally causing lakes that swamp the local vegetation leaving a ghost forest standing in the water. Landslides can increase erosion affecting fish habitats. They can cause tsunamis that can damage coastlines. Coastal uplift – Can cause raised sections of the near shore marine environment above the tide line, killing all near shore tidal life in the area raised above the tide line. Coastal subsidence – Are responsible for dropping areas of beach and near beach land so that water now covers land that was recently dry. This can drown plants and animals in newly submerged areas and in some areas lead to saltwater intrusion into the local ground water supply. Tsunamis – Tsunamis cause local erosion of the beaches, direct damage to plants and animals living on the beach, and possible saltwater damage to non-salt tolerant species away from the beach.
Today, however, there is another type of environmental damage that is the result of human intervention. That is the damage caused by the release of hazardous chemicals and/or large quantities of sewage. These can be released from many different sources including but not limited to industrial plants, pipelines, overturned trucks, damaged ships or barges, railcars and even school chemistry labs. These impacts to the environment include: •
•
•
•
Air pollution - Some chemicals released as gasses can cause immediate damage to plants, animals and humans. Tanks filled with, for example, chlorine, ammonia or any other hazardous gas can harm or kill animals, birds, and plants, not just in the area of the spill but for some distance downwind depending on the chemical involved and the size of the release. The damage will usually be temporary and physical recovery to the environment will begin as soon as the gas dissipates. Chemical Spills - Chemicals that spill either directly into or that could drain into lakes, ponds, streams, rivers, or even drainage ditches could kill or create birth defects in fish and marine mammals. In some areas they would pollute drinking water. Depending on the chemicals involved and their ability to be either absorbed by the environment or break down quickly the environment may either recuperate quickly or be impacted for years or even decades. Damage to port facilities could create spills into the waterways that tidal currents could spread throughout the coastal areas of Puget Sound causing damage into Kitsap, King, Pierce, and Thurston Counties. Damaged Wastewater Treatment Facilities - The pollution of sewers, pump stations, etc. could lead to spills of sewage or the inability of the treatment plant to process waste allowing it to flow untreated into the local environment. This would have the same effect as many other hazardous chemicals, polluting the environment for possibly weeks, but also creating conditions that could with bacterial contamination lead to disease in both animals and humans. Soil Absorption - Spills onto land can, depending again on the type of chemical, either temporarily, as with the case with many caustics or acids or permanently, as with spills of heavy metals or many radioactive materials damage soils. Related to this is the absorption of material by the soil may allow it to pollute groundwater and be transferred for some distance causing damage. Depending on the ability of water and the chemical to leach EARTHQUAKE – PAGE 4-50 REGION 5 ALL HAZARD MITIGATION PLAN – 2020-2025 EDITION BASE PLAN
through the underlying layers of soil, clay, rock, etc. it could eventually reach and pollute the aquifer.
Economic and Financial Condition The economic effects from a large damaging earthquake will be extensive and the overall financial condition of most businesses, as well as local governments in Pierce County, will be compromised. Economic factors will be impacted first by the direct damage to homes, businesses and the infrastructure. A number of factors come into play here. First, the housing stock will be affected, and while some people have earthquake insurance, the majority do not. Most home construction built to contemporary earthquake standards will probably not collapse, however damage could be extensive to older structures especially those not connected to their foundations. While assistance from FEMA and the Small Business Administration (SBA) will help with reconstruction, there will still be a large gap in what is needed to get families back into their homes. Looking at the results of other earthquakes both in the Pacific Northwest and California, it can be seen that many businesses’ building stock will be damaged. This will be especially prevalent in the areas of soft soils and older building stock. Combining this with the loss of water, electricity, and natural gas means that much of the local industry and businesses will not be able to continue operations in their normal manner. Most will be closed for at least a nominal portion of time. This will mean lost wages. In an escalating sequence of events the wage earner will not be able to buy necessities or pay bills that come due, including mortgages. This can lead to foreclosures and the further displacement of the population. The loss of the transportation corridors including roads, rail transport and the damage to the Port of Tacoma will make it nearly impossible to both import needed supplies and to ship goods to market in the near term. Some of these facilities may take years to recover. A detailed resiliency assessment on Washington State transportation systems (DHS, 2019) provides timeframes depending on what is broken. For instance, in 2017 the Port of Tacoma identified that if the port cranes collapse, not only could it block the waterway but could take up to six months to remove40 (Figure 4.2 – 6 Bridge Seismic Screening Tool (BSST) Projected Reopening Times of Highway Bridges in WA After the CSZ Scenario Earthquake).
EARTHQUAKE – PAGE 4-51 REGION 5 ALL HAZARD MITIGATION PLAN – 2020-2025 EDITION BASE PLAN
Figure 4.2 – 6 Bridge Seismic Screening Tool (BSST) Projected Reopening Times of Highway Bridges in WA After the CSZ Scenario Earthquake41
EARTHQUAKE – PAGE 4-52 REGION 5 ALL HAZARD MITIGATION PLAN – 2020-2025 EDITION BASE PLAN
Other economic factors impacting businesses include loss of inventory, or for those businesses that operate on a “just in time” re-supply schedule and do not have an inventory, the loss of their ability to be re-supplied may denote the end of their business. A contributing factor includes the inability of staff to report to their work. This will be due in some cases to injury, while for others they could be looking after their own homes and families. Another factor leading to staff absenteeism is the damage done to the transportation corridors. The damage to homes, industry and other businesses will also have a direct impact on the longterm operation of government and the public infrastructure. With the loss of a percentage of the tax base due to damage, and the exorbitant cost of bringing the infrastructure back to normal, there will not be funds available for many of the services that citizens have grown to expect. This will have a compounding effect of not attracting other business to the County which then continues to limit the tax base. A Cascadia Subduction zone earthquake today is estimated to cause ~49 billion dollars in damage. In 1949 the magnitude 7 earthquake near Olympia killed eight people and 40% of households and businesses damaged. In 1965 the magnitude 6.5 earthquake killed 7 people and costed $12 million in property damage. The Nisqually 2001 magnitude 6.8 earthquake injured 400 people and cost billions in property damage.
Public Confidence in the Jurisdiction’s Governance How the aftereffects of the earthquake are handled will have a great deal to do with the public’s confidence in the jurisdiction. For smaller size quakes there should be little or no decrease in the public’s confidence about government’s ability to act. However, as the size of the earthquake increases and as the parameters that could lead to major damage increase, such as depth, epicenter, rainy weather, etc., then the possibility of the public finding fault with local jurisdictions or agencies increases. Local agencies and governments must be able to respond quickly to revive any portions of the infrastructure that have been impacted by the earthquake. The longer the delay in service restoration, the more the public loses confidence in an agency’s or government’s ability to handle the situation. Since many of the long-term effects of an earthquake have social and economic consequences, the more the public perceives that government is ignoring their plight or unable to respond to it, the more the public will lose confidence in it. Eventually, any perceived lack of ability, or slow response will result in finger pointing and acrimony.
EARTHQUAKE – PAGE 4-53 REGION 5 ALL HAZARD MITIGATION PLAN – 2020-2025 EDITION BASE PLAN
(This page intentionally left blank)
EARTHQUAKE – PAGE 4-54 REGION 5 ALL HAZARD MITIGATION PLAN – 2020-2025 EDITION BASE PLAN
Geological Landslide 4.3G Identification Description Definition42 A landslide is the gravity-driven downslope movement of a sliding mass composed of rock, soil, and vegetation. It can pick up and include anything else that might be in its path whether part of the natural or the developed environment. A landslide occurs when the downslope weight of the slide mass exceeds the strength of the soil along the slip surface. That is, when the driving force (downslope weight) exceeds the resisting force (soil strength). Factors influencing the stability of a slope include: Figure 4.3-1 Northeast Tacoma – Landslide 01/2007 • • • • • • • •
Steepness of slope, Composition of soil and rock, Groundwater conditions, Recent precipitation patterns, Slope aspect, Earthquake, Vegetation on slope, and Anthropogenic activities (land clearing, grading, etc.).
Types43 There are five broad categories of landslides that commonly occur in Pierce County and they are outlined below.
Shallow bluff Shallow bluff failures occur on the steep Puget Sound marine bluffs. These landslides are limited in area (usually less than 1-2 acres). The removal of vegetation from the marine bluff, usually done to improve views, can lead to serious slope erosion and instability. These landslides are typically fast moving.
Deep Seated Landslides Deep landslides can be as large as tens to hundreds of acres and can occur on slopes with a gradient as low as 15%. Deep landslides are those that fail below the rooting depth of trees and vegetation. and can be reactivations of older, pre-historic failures. They are often slow moving but can also move rapidly. Often associated with extended periods of precipitation (months to years) this is typically a structural/infrastructure hazard.
LANDSLIDE – PAGE 4-55 REGION 5 ALL HAZARD MITIGATION PLAN – 2020-2025 EDITION BASE PLAN
Shallow Landslides Shallow landslides involve movement of a relatively thin layer of slope material and have a shallow failure plane (generally less than 10-15 feet deep). This type of landslide is Pierce County’s most common and is often associated with land use or intense rain events. Shallow landslides can block roadways, damage homes, and threaten life and safety.
Debris flows Debris flows are water-saturated masses of soil, rock, and debris (tree trunks, limbs, etc.) that usually occur in steep gullies, move very rapidly, and can travel for many miles. Debris flows are typically triggered by intense rainfall and can run long distances when confined to a channel. Slopes where vegetation has been removed by fire or humans are at greater risk for debris flows and many other types of landslides. These landslides provide little or no warning and are more dangerous because of their speed. They can cause both property damage and loss of life. For a more detailed description of this type of landslide and vulnerabilities to it, see the Volcanic SubSection 4G.5.
Submarine Landslides Submarine landslides (landslides that occur primarily underwater) have also occurred in Pierce County on the delta of the Puyallup River. Triggering factors for submarine landslides include: • • • • •
Rapid sedimentation resulting in an over-steepened and unstable slope, Loss of soil strength due to static liquefaction caused by rapid drop in water level at high to low tide transition, Loss of slope support because of bottom current erosion of material at the base of the delta slope, Additional loading at top of the delta slope (e.g., artificial fill) increases the down-slope weight of the soil (driving force), and Earthquake shaking causing loss of soil strength (liquefaction) and increase in downslope force on soil mass.
Large submarine landslides in the Pacific Northwest typically occur on the deltas of major rivers or streams, which can lead to tsunamis, see Tsunami Sub-Section 4G.4.
Profile Location and Extent
LANDSLIDE – PAGE 4-56 REGION 5 ALL HAZARD MITIGATION PLAN – 2020-2025 EDITION BASE PLAN
Landslides directly and indirectly affect a small portion of the developed areas in the County. Map 4.3-1 shows the deep landslide hazard areas for Pierce County. Map 4.3-2 shows the shallow landslide hazard area for the County. The landslide hazard areas within the County include the walls of the major river valleys, the more mountainous regions, the coastal areas, and parts of the peninsula. Map 4.3-3 illustrates the slope stability of the coastal zones within the County. The most unstable coastal slopes are located on a small portion of the Kitsap peninsula, on the southwestern side of Fox Island, at Salmon Beach, and at various areas near DuPont. The landslide inventory for Pierce County contains 1,276 landslides. A detailed landslide analysis was performed by the Washington Geologic Survey for 60 percent (1,092 square miles) of the county in areas that have high population density and infrastructure. Landslide facts for Pierce County’s detailed landslide analysis as of May 2019.44 • •
628 deep landslides mapped Built on existing landslides: o 2.4 miles of highway o 29.5 miles of arterial roads o 1 bridge (University Place) o 3.9 miles of rail o 21.6 miles of tax parcels ($371M estimated value) o 1,658 buildings o 0 fire, police, and hospitals o 1 school play field is on a landslide (Eatonville) o 0 miles of high-tension transmission lines, 0 high tension towers
Figure 4.3-2: Pierce County Landslide Deposits, Scarps and Flanks, and Susceptibility Source: Image taken on July 30, 2019.45 Table 4.3-1 Landslide Facts for Pierce County – Shallow Landslide Susceptibility
High hazard areas
Moderate hazard areas
1,4195 buildings .8 miles of rail 9.0 miles of road 120 bridges 48.2 miles of tax parcels ($1.6B estimated value)
71,225 buildings 89.3 miles of rail 646.3 miles of road 215 bridge 96.0 miles of tax parcel ($10B estimated value)
LANDSLIDE – PAGE 4-57 REGION 5 ALL HAZARD MITIGATION PLAN – 2020-2025 EDITION BASE PLAN
Map 4.3-1 Pierce County Deep Landslide Hazard Area
LANDSLIDE – PAGE 4-58 REGION 5 ALL HAZARD MITIGATION PLAN – 2020-2025 EDITION BASE PLAN
Map 4.3-2 Pierce County Shallow Landslide Hazard Area
LANDSLIDE – PAGE 4-59 REGION 5 ALL HAZARD MITIGATION PLAN – 2020-2025 EDITION BASE PLAN
Map 4.3-3 Pierce County Slope Stability Areas46
LANDSLIDE – PAGE 4-60 REGION 5 ALL HAZARD MITIGATION PLAN – 2020-2025 EDITION BASE PLAN
The Washington Geologic Survey (WGS) landslide hazards program is in the process of updating their maps across the state. These include landslide inventory mapping (where landslides have occurred) and susceptibility mapping (where landslides may occur in the future). A comparison of the existing Pierce County unstable slopes map to the WGS landslide and susceptibility maps resulted in a 51% reduction in landslide susceptible areas (see figure 4.3-3 below). Pierce County had over 90% false positives (38,000 tax parcels were removed and 1,000 that were not previously identified were added). Figure 4.3-3: Pierce County Comparison of Landslide Susceptible Areas
Occurrences47 Topographic and geologic factors cause certain areas of Pierce County to be highly susceptible to land sliding. Ground saturation and variability in rainfall patterns are also important factors affecting slope stability in areas susceptible to landslides. Strong earthquake shaking can cause landslides on slopes that are otherwise stable. There is a history of landslides throughout Pierce County. In 1996, severe storms and flooding led to landslides occurring just west of Tacoma, and along Pioneer Avenue East, causing damage to homes and infrastructure. Examples of large, deep seated landslides can be found in Pierce County on Fox Island, between Brown and Dash Points, along the Tacoma Narrows, and in the Dupont area. Table 4.3-2 lists some of notable and destructive landslides within Pierce County. As of August 2016, the Washington Geologic Survey mapped 1,276 landslides in Pierce County.48
LANDSLIDE – PAGE 4-61 REGION 5 ALL HAZARD MITIGATION PLAN – 2020-2025 EDITION BASE PLAN
Table 4.3-2 Notable Landslides in Pierce County
DATE 2006 (Federal Disaster #1671)
2006 2001 (Federal Disaster #1361)
1996 (Federal Disaster #1159)
1991
1984
1949
1894
DESCRIPTION Estimated ten plus inches of rain in the lowlands (4-5 day period) and 18 plus inches up on Mt. Rainier (36 hr period). The Carbon River experienced numerous slides in the vicinity- East of Orting and North of 177th. Major landslides also occurred in Mt. Rainier National Park closing the Park. After receiving rain for 31 of 33 days in January and February landslides occurred in various areas throughout the County. During the February 28th earthquake, a portion of the hillside above Salmon Beach slid down the hill, damaging a number of homes and destroying electric service and physical access to the community. Combined with heavy rain and flooding, about 20-30 landslides occurred in the region. The slides damaged or destroyed eight homes and damaged utility lines; a landslide south of DuPont pushed two locomotives and two rail cars into Puget Sound, spilling 3,000 gallons of fuel; damaged State Route 165 and undermined a bridge abutment at the Carbon River near Carbonado. A slide occurred along the lower portion of the Nisqually River near Fort Lewis, blocking the River with debris. The River backed up, temporarily changed course, and flowed through a forested section that abutted up against the opposing wall of the slide. The river-flow gradually eroded the remains of the slide. This gradual erosion prevented a sudden release of water, possibly preventing flooding down-river. Ground gave way below railroad tracks in the area south of DuPont resulting in a derailment of several cars of an Amtrak carrying passengers. The train engineer suffered a non-fatal heart attack soon after the event. Several people sustained minor injuries requiring transportation and treatment. This occurred three days after the 1949 Olympia earthquake. Water saturated ground broke immediately to the north of Salmon Beach below Fort Nisqually and slid into the Tacoma Narrows. The slide generated a tsunami in the Tacoma Narrows. The slide missed waterfront homes, but the tsunami damaged them. A submarine landslide in the Puyallup River delta caused a damaging tsunami that killed two people.
LANDSLIDE – PAGE 4-62 REGION 5 ALL HAZARD MITIGATION PLAN – 2020-2025 EDITION BASE PLAN
Recurrence Rate
Figure 4.3-4 Ski Park Road – Landslide 01/31/03
Small landslides happen in Pierce County every year. Since very few of them have any effect on the citizens they are irrelevant for determining the recurrence rate. Landslides with minor impact are defined as landslides impacting five or less developed properties or causing $1,000,000 or less damage. Significant landslides are those that begin to have a major impact on the fabric of a local community. For the purposes of this assessment they are defined as being six or more developed properties or damages greater than $1,000,000. The probability of recurrence for minor landslides in Pierce County could be ten years or less with the potential for significant slides being 100 years or less. This is based on information from past landslide occurrences and information from local hazard experts.
Impacts Health and Safety of Persons in the Affected Area at the Time of the Incident The impacts include the injury and possibly death to persons in the affected area. Death may result from suffocation from being buried by the landslide debris, traumatic injury from the impact of sliding material, or the collapse of structures by the landslide. In some areas there is the possibility that a structure could be pushed into a water feature like a lake, river or the Puget Sound. In these cases, it is possible that a person could be trapped inside the structure and actually drown as a result of the slide. The other impact relating to landslides has to do with underwater landslides. In this case the possibility exists that an underwater landslide could initiate a tsunami that could affect the surrounding areas, in particular Commencement Bay. This issue is covered in the Tsunami Hazard Section of the Plan. Personnel responding to the scene of a landslide must be aware of the potential for more land to collapse while they are attempting to respond or rescue persons from the slide impacted area. Other secondary hazards include ruptured gas lines and charged electrical wires. Also, hazardous chemicals associated with the damaged facility could have spilled and be in the environment.
Continuity of Operations and Delivery of Services Due to the very limited terrain covered by any individual landside in Pierce County, unless the landslide has a major effect on some portion of the infrastructure, its impacts to the continuity of operations for any jurisdiction should be limited. The interruption in the delivery of services should be very localized, if at all, and in most circumstances, of short duration. Individual departments or organizations, especially ones with infrastructure tied to the landscape like sewer utilities, water purveyors, and others could have their delivery of services compromised on a very local level but seldom on a large scale. Even a LANDSLIDE - PAGE 4-63 REGION 5 ALL HAZARD MITIGATION PLAN – 2020-2025 EDITION BASE PLAN
major landslide knocking out the City of Tacoma’s water pipeline from King County would have a work around from the City’s well system that could cover the lack of water until the pipeline was repaired. There is the potential for a limited number of areas to be temporarily cut off from the rest of the County by landslides. The majority of these are located in the more rural areas of Pierce County. For example, a landslide located under the north end of the Home Bridge on the Key Peninsula can cut off the entire lower end of the Longbranch Peninsula. The same can be said for Ski Park Road on the east side of Ohop Lake. In the latter case they are cut off from much of the rest of the County every few years by landslides. The overall effects would be limited, and the roads should be opened within a short period of time. Generally, during normal years, most landslides are taken care of quickly, however in the advent of an earthquake generating a number of landslides throughout the County, as well as other damage affecting the infrastructure; it could be weeks before some areas are accessible for emergency vehicles and crews. Figure 4.3-5 SR-165 Bridge along Carbon
Property, Facilities, and Infrastructure
River – Landslide 2/1996
Due to their probable location in the less settled portions of Pierce County, many of the landslides will have no effect on the developed property. However, in the developed areas there is a danger of roads, railroad tracks, gas, water and sewer lines either being buried, broken, or in some cases swept away when undercut by a slide as in Figure 4.3-549. Private property has the same problem. While many of the landslides will not be large enough to affect large numbers of homes or businesses many could affect individual parcels of private property. It is also possible that damage to water and gas lines will increase danger from fire.
The Environment The impacts are generally local and would not include large scale damage to the environment. Generally, the slides will affect individual hillsides, possibly blocking rivers or streams. This can cause a backup of water that once it breaks through could cause a flashflood downstream. The possibilities exist that a major slide in a river could damage spawning beds or create an obstacle to fish migration. Any landslide that breaks pipelines, sewer lines, etc. or impacts the transportation or storage of hazardous chemicals could cause considerable environmental damage that could take decades to correct.
Economic and Financial Condition Due to the very limited terrain covered by any individual landside in Pierce County, the impacts to the economy for any jurisdiction affected should be limited. The biggest potential problem economically could come from a major slide taking out a section of railroad track along the coast. This could impact the transportation of goods into and out of the Port of Tacoma for a short time until either the tracks are repaired or a work around is established.
LANDSLIDE - PAGE 4-64 REGION 5 ALL HAZARD MITIGATION PLAN – 2020-2025 EDITION BASE PLAN
Financially, while a landslide within the boundaries of any jurisdiction could cause some strain, the limited area covered should restrict the actual financial hardship to the local jurisdiction. There are areas that slide on a regular basis in both the unincorporated areas of the County and within the City of Tacoma. These are handled yearly with the local budgets and to date have not stressed those budgets. If any area of Pierce County were to experience a landslide of the proportions of the Aldercrest-Banyon landslide in Kelso and the subsequent Haussler Road Landslides on the opposite side of the ridge in 1999, it could cause financial difficulties due to the streets and other utilities affected or destroyed; see Figure 4.3-6. All geologic hazards can be insured except landslide and earth movement. For those with landslide damage, property litigation is often the only
Figure 4.3-6 Aldercrest Drive – Landslide 1/1999
recourse.
50
Public Confidence in the Jurisdiction’s Governance Many landslides that occur each year in Pierce County do not affect homes, businesses or infrastructure to the extent that there is any lasting impact noticed by the public. That could take a turn in another direction if Pierce County has a landslide that destroys several homes or a major arterial that could take months to reopen. If several homes are destroyed and if people are killed or injured, there will be questions asked as to why people were allowed to build on unstable slopes.
LANDSLIDE - PAGE 4-65 REGION 5 ALL HAZARD MITIGATION PLAN – 2020-2025 EDITION BASE PLAN
(This page intentionally left blank)
LANDSLIDE - PAGE 4-66 REGION 5 ALL HAZARD MITIGATION PLAN – 2020-2025 EDITION BASE PLAN
Geological Tsunami 4.4G Identification Description Definition Tsunami The term tsunami itself is a Japanese word, meaning "large wave in harbor," and comes from the Japanese observation that such waves tend to be especially large and dangerous after they enter harbors. A tsunami, sometimes called a tidal wave, consists of a series of high-energy waves that radiate outward like pond ripples from the area in which the generating event occurred. They also build in height as they move into shallow water, just before striking the open shore or reaching the heads of bays, and then inundating the low-lying areas near the shore. Often, a quick recession of the water precedes the first wave crest. Figure 4.4-1 Hawaii, 1957—Residents Explore Ocean Floor Before Tsunami51
It is unusual for tsunamis to resemble the icon used to depict them, a towering wave with a breaking crest. While they can have that form it is more usual for them to resemble a series of quickly rising tides, or a surge of water. When they withdraw, they do so with currents much like those of a river. Swift currents commonly cause much of the damage from tsunamis either from impacting objects directly or from the material picked up and transported along with the water, such as logs, cars, or parts of buildings. They also pick up pollutants like oil, gas, sewage, etc. that can cause further damage as well as long term environmental problems. Figure 4.4-2 Hawaii, 1949--Waves Overtake A Seawall52
TSUNAMI - PAGE 4-67 REGION 5 ALL HAZARD MITIGATION PLAN – 2020-2025 EDITION BASE PLAN
Seiche Seiches are water waves generated in enclosed or partly enclosed bodies of water such as reservoirs, lakes, bays and rivers by the passage of seismic waves (ground shaking) caused by earthquakes. Sedimentary basins beneath the body of water can amplify a seismic seiche. Seismic waves also can amplify water waves by exciting the natural sloshing action in a body of water or focusing water waves onto a section of shoreline.53
Types54 Tsunamis are a secondary hazard, the result of geological events. Typically, tsunami and seiches are triggered by earthquakes and landslides; see Earthquake and Landslide Hazard Chapters of this plan. These sources are discussed below.
Earthquake Source Sudden raising or lowering of a portion of the Earth’s crust during earthquakes generally causes a tsunami, although landslides and underwater volcanic eruptions can generate them as well. Movements of the sea floor or lakebed, or rock fall into an enclosed body of water displace the water column setting off a series of waves that radiate outward like pond ripples. The two main Washington earthquake scenarios that may generate a tsunami are a Cascadia subduction zone event around a Magnitude 9 (reoccurrence ~500-600 years) and a shallow crustal earthquake such as the Tacoma or Seattle Faults around a Magnitude 7 (reoccurrence 100s-1000s of years).
TSUNAMI - PAGE 4-68 REGION 5 ALL HAZARD MITIGATION PLAN – 2020-2025 EDITION BASE PLAN
Landslide Source An earthquake is possible deep in the mantle in the Benioff Zone. These earthquakes are typically around a M7 and occur every 30-50 years. However, these earthquakes do not directly cause a tsunami as they do not displace the sea surface, but they can trigger landslides that do. The 2001 Nisqually earthquake is an example of a Benioff earthquake. Three distinct landslide situations could result in a significant tsunami or seiche affecting local communities bordering Puget Sound: submarine landslides on delta fronts, submarine slides elsewhere in the Sound, and slides from adjacent uplands. For more information see Landslide chapter.
Local Source Tsunami Usually generated by an earthquake, but can also be caused by a landslide, volcanic eruption, meteorological events, or meteor impact. Tsunami wave arrival within minutes. Shaking is your warning.
Distant Source Tsunami A tsunami originating from a faraway source, generally more than 600 miles or more than three hours of tsunami travel time from its source. Warning must be distributed.
Profile Location and Extent In Washington State, the Pacific Coast, Strait of Juan de Fuca, and Puget Sound are all at risk from tsunamis. In addition, large lakes and other enclosed bodies of water, like Puget Sound south of the Tacoma Narrows, could be affected by a seiche. Projected increases in sea level due to climate change combined with subsidence in portions of Puget Sound will exacerbate these problems. Tsunami history in Washington State is shown on Figure 4.4-3 below.
TSUNAMI - PAGE 4-69 REGION 5 ALL HAZARD MITIGATION PLAN – 2020-2025 EDITION BASE PLAN
Figure 4.4-3 Tsunamis in Washington State55
Earthquake Source Geologic record in tidal marshes can extend the modern tsunami record prior to written records. What can be seen are distinct clean marine-derived sand layers preserved in the stratigraphy from previously unrecorded tsunami events. Researchers have been able to constrain ages of these sand layers based on radiocarbon dating the soil above and below. The dates of these layers suggest that large tsunamigenic earthquakes have occurred for the last 3,500 years directly offshore of Washington. The tsunami record has been extended even further when looking at additional geologic records on the seafloor. During an earthquake event, the shaking triggers turbidity currents, or submarine landslides. Based on the both the tidal marsh and seafloor record, the Washington State Department of Natural Resources have discovered that Cascadia has been actively rupturing for the past 10,000 years. There have been at least 40 events. TSUNAMI - PAGE 4-70 REGION 5 ALL HAZARD MITIGATION PLAN – 2020-2025 EDITION BASE PLAN
Figure 4.4-4 identifies the maximum inundation (a, c, e) and maximum wave speeds (b, d, f) for each earthquake source scenario. Most inundation occurs within low-lying, relatively flat regions of the study area such as the Port of Tacoma harbor in Commencement Bay. Minimal inundation occurs along steep topographical slopes. Consequently, the inundation is determined primarily by local topography rather than offshore wave dynamics. The Seattle Fault scenario creates the most inundation and highest currents within the study area due to the large displacement of water in the deepest and widest region of Puget Sound. The Tacoma Fault scenario has significant inundation in the Port of Tacoma region, but with smaller amplitudes. This scenario causes less inundation overall since much less water is displaced in the narrower and shallower regions of Carr Inlet, Colvos Passage, and East Passage. The Rosedaledominant Tacoma Fault scenario causes the least inundation and lowest current speeds due to relatively small displacements in the regional channels.56 A more detailed rendition of the Tacoma and Seattle Faults is shown in Map 4.4-1. In addition, this shows those areas that have a history of uplift and subsidence in previous earthquake events, probably leading to tsunami generation. Displacement along both the Tacoma and Seattle faults happened approximately 1,100 years ago.57 Map 4.4-1 Seattle and Tacoma Faults58
TSUNAMI - PAGE 4-71 REGION 5 ALL HAZARD MITIGATION PLAN – 2020-2025 EDITION BASE PLAN
Figure 4.4-4 identifies the maximum inundation (a, c, e) and maximum wave speeds (b, d, f) for each earthquake source scenario. Most inundation occurs within low-lying, relatively flat regions of the study area such as the Port of Tacoma harbor in Commencement Bay. Minimal inundation occurs along steep topographical slopes. Consequently, the inundation is determined primarily by local topography rather than offshore wave dynamics. The Seattle Fault scenario creates the most inundation and highest currents within the study area due to the large displacement of water in the deepest and widest region of Puget Sound. The Tacoma Fault scenario has significant inundation in the Port of Tacoma region, but with smaller amplitudes. This scenario causes less inundation overall since much less water is displaced in the narrower and shallower regions of Carr Inlet, Colvos Passage, and East Passage. The Rosedaledominant Tacoma Fault scenario causes the least inundation and lowest current speeds due to relatively small displacements in the regional channels.59
TSUNAMI - PAGE 4-72 REGION 5 ALL HAZARD MITIGATION PLAN – 2020-2025 EDITION BASE PLAN
Figure 4.4-4 Tsunami Inundation and Current-Based on Earthquake Scenario60
TSUNAMI - PAGE 4-73 REGION 5 ALL HAZARD MITIGATION PLAN – 2020-2025 EDITION BASE PLAN
Earthquakes could also lead to landslide-induced tsunamis, the location and extent of which are described below.
Landslide Source Landslides can occur on most bluffs throughout the coastal regions of Pierce County, including the islands and the peninsula. Landslides can also originate on the delta slopes of major rivers flowing into the Sound. In Pierce County, this has happened primarily on the Puyallup River delta leading into Commencement Bay. Either of these instances can induce a tsunami.
Occurrences In 2011 Japan experienced a triple disaster, a subduction zone earthquake with a magnitude of 9.0 that triggered the devastating tsunami which in turn caused a cooling system failure at Fukushima’s Nuclear plant.61 There were 21,000 people left dead or missing and 202,000 buildings/homes were totally or partially damaged. Around 500,000 people were left homeless after this event.62 Following the triple disaster there was a shift in the job market, while many were left suspended or displaced from work, there was an increase in new jobs. Construction, engineering, and technical based jobs surfaced in an abundance relating to post disaster recovery. Though this sounds promising, there was a disbalance of the type of work available and the work citizens were seeking. There were not enough workers skilled in construction, engineering, and technical fields to fulfill the jobs. The largest field damaged by this event was manufacturing, specifically the fishery occupation. This was reported over a year after the event and predicted to have lasting effects. There was also a clear increase in emigration numbers from 2010 to 2011, there was an increase of 30,799 emigrants. This was directly linked to the triple disaster in Japan.63 In 2018 Indonesia was struck by multiple tsunamis, one in September triggered by an earthquake that with the combined effect of the earthquake and following landslides left more than 2000 people dead and around 200,000 displaced.64 This is one such event where communities’ resources were limited, and it kept many people trapped and without necessities. Many people were desperately seeking a way out, but fuel shortages and rations made it impossible. This event also brought some reports of communities’ crime rates increasing.65 In December of 2018 Indonesia experienced another tsunami, this one much more shocking. This tsunami was triggered by an underwater landslide believed to be a result of distant volcanic activity. Indonesian tsunami warning systems where based on tracking earthquakes and were not equipped to read underwater landslides.66 This event left around 400 dead and around 40,000 displaced and damage brought to 1,300 homes.67 The recorded history of tsunamis is short, and research is currently being conducted to develop a chronicle of past occurrences of tsunamis in Puget Sound. Below is a descriptive narrative of each occurrence organized by the tsunami’s source.68
TSUNAMI - PAGE 4-74 REGION 5 ALL HAZARD MITIGATION PLAN – 2020-2025 EDITION BASE PLAN
Table 4.4-1 Notable Tsunamis in Pierce County
DATE
A.D. 900
April 16, 1949
1894
DESCRIPTION EARTHQUAKE SOURCE The earthquake on the Seattle fault caused uplift that triggered a tsunami in central Puget Sound that, because of the geography of the Sound waterways, may have reached Pierce County. LANDSLIDE SOURCE A six to eight-foot-tall tsunami was caused by a landslide on the north end of Salmon Beach, Tacoma after a large earthquake in the Juan de Fuca plate. A 400 ft. high cliff gave way and slid into the Puget Sound. Water receded 20-25 feet from the normal tideline, and an eight foot wave rushed back against the beach, smashing boats, docks, a wooden boardwalk, and other waterfront installations in the Salmon Beach area.69 It moved both directions within The Narrows causing damage at Salmon Beach, Gig Harbor, and as far south as Day Island. Shortly after the earthquake geologists had noticed that cracks had formed at the top of the slope and had notified residents that a slide was possible. Many people evacuated their property and while the slide itself did not damage the homes there was damage from the tsunami itself. A large submarine landslide occurred at night on the Puyallup River delta in Commencement Bay; triggering a tsunami. This resulted in two fatalities and the destruction of 300 feet of the Northern Pacific freight docks and other port facilities. It also created at least a ten-foot wave in the Old Town section of Tacoma, which washed over homes on the tide flats.
TSUNAMI - PAGE 4-75 REGION 5 ALL HAZARD MITIGATION PLAN – 2020-2025 EDITION BASE PLAN
Figure 4.4-5 Salmon Beach, Pierce County, 1949—Tsunamigenic Subaerial Landslide70
Recurrence Rate Tsunamis have been a part of Pierce County long before there was a written record of their existence. Data from field studies shows that both the Seattle and Tacoma faults that run under Puget Sound had displacement around 1,100 years ago.71 These would have resulted in tsunamis impacting the coastal areas of the County. Recent locally generated tsunamis from the various sources mentioned above have impacted Pierce County three times in the last 120 years. There were earthquake generated tsunamis (1,100 years ago) as well as ones from landslides into Puget Sound (1949) and from an underwater landslide (1894). There is too short of a historic record to give a definitive answer for a recurrence rate. Taking these into consideration, until further research can provide a better estimate a tentative recurrence rate of plus or minus 100 years will be used.
TSUNAMI - PAGE 4-76 REGION 5 ALL HAZARD MITIGATION PLAN – 2020-2025 EDITION BASE PLAN
Impacts With earthquakes and landslides as a source, see the respective chapters for impacts not directly related to tsunamis.
Health and Safety of Persons in the Affected Area at the Time of the Incident Warning signs of an approaching tsunami include: feel the ground shaking severely, see a rapid fall or rise in sea level, hear a loud roar coming from the open water, or receive alert from Channel 16, NOAA Weather Radio, Emergency Alert System (EAS), Wireless Emergency Alert (WEA), or sirens.72 Depending on the location, direction that the wave propagates, time of day and even time of year, fatalities and casualties from any tsunami could be high within the impacted area. Swift currents commonly cause much of the damage from tsunamis either from impacting objects directly or from carrying materials along with the water such as boats, logs, cars, parts of buildings, and pollutants like oil, gas and sewage. This was the situation with the 1894 tsunami discussed above; see Figure TS-6 Damage in Tacoma from the 1894 Tsunami. One of the factors limiting fatalities and casualties in 1894 was the occurrence of the tsunami at night when the waterfront population was low. Today, a repeat of the 1894 tsunami could damage berthed ships and cause major damage to the restaurants and businesses located on pilings along Ruston Way. Evacuation routes could be blocked as a result of the source of the tsunami such as landslides, power lines, or other debris. People could be trapped in damaged buildings along the waterfront and not be able to evacuate before a tsunami arrives. Puget Sound tsunamis could damage both facilities located along the coast and rail cars traveling along the coastal tracks. Many of these contain hazardous materials that could be released in the water and surrounding environment. Depending on the chemicals released, this could pose a threat to citizen’s health for weeks or even longer. It is possible that bridges and ferry docks hit by the tsunami could be damaged; either partially or fully destroyed. This would limit the ability of citizens to evacuate the individual islands in Pierce County and in the case of the Purdy Bridge limit access to the Gig Harbor Key Peninsula communities. In the 2004 Indonesian tsunami and the 2011 Japanese tsunami, crime rates were reported as lower.73 Many sources report that disasters bring a stronger sense of community as seen in Japan.74 There is acknowledgement of the possibility that crime is not being reported as much in times of disaster recovery. Community destruction can lead to law enforcement groups to prioritize their efforts and it is possibly that some crime reports are pushed aside to handle greater more pressing matters.75 After such events, communities can still face a lot of devastation and/or despair. While it may not be true that crime necessarily grows or increases long term for every event, it is apparent through reports that crime can change somewhat. When communities are struck by disaster that leaves them with shortages of food water and materials looting crimes become more popular. Following Japan’s triple disaster there were also reports of scamming in order to receive money.76 TSUNAMI - PAGE 4-77 REGION 5 ALL HAZARD MITIGATION PLAN – 2020-2025 EDITION BASE PLAN
Figure 4.4-6 Damage in Tacoma from the 1894 Tsunami77
Health and Safety of Personnel Responding to the Incident Response personnel located within the affected area will have the same threats as the general population during the actual period of time that the waves are active and dangerous.
Continuity of Operations and Delivery of Services The adverse impact to jurisdictions within Pierce County for a non-earthquake generated tsunami, in maintaining normal day-to-day operations, will be limited. Damage and response will both be limited due to the small size and localized effect of the tsunami. For tsunamis associated with a local earthquake on either the Tacoma or Seattle fault, computer modeling shows wave action and related currents moving deep into Gig Harbor, the Port of Tacoma, Fife, and reaching over five kilometers up the Puyallup River;78 see Figure TS-4 Tsunami Inundation and Current-Based on Earthquake Scenario. It is probable that one of these tsunamis would impact and damage the infrastructure and equipment in the Port of Tacoma and some other coastal jurisdiction; see Property, Facilities, and Infrastructure section below. Damage to cranes, docks, and even the Port Administration Building are all possible from a large locally generated tsunami. In this case the Port would not have the ability to maintain normal operations. For other jurisdictions the tsunami may have less direct effect on their ability to maintain operations. Instead any operational continuity will be impacted more from the earthquake itself. The impact to a jurisdiction’s ability to deliver services is directly related to their proximity to Puget Sound. Damage throughout the coastline of Pierce County will not usually impact the delivery of services to citizens, residences, or businesses with a few exceptions. Damage to the ferries, ferry docks, or bridges to the islands will prevent normal County services, possibly for an extended period of time. There could be damage to the City of Tacoma’s fire facilities including fire boats and the two stations located on Ruston Way and the Foss Waterway. TSUNAMI - PAGE 4-78 REGION 5 ALL HAZARD MITIGATION PLAN – 2020-2025 EDITION BASE PLAN
Loss of power due to damage to electric power stations is possible, especially to the Bonneville Power Administration substation located at the south end of the Hylebos Waterway. Rail lines in the Port and along Ruston Way and running south from Salmon Beach could sustain damage. Sewage treatment plants located at or near tidewater have a high probability of damage. In this case the City of Tacoma’s treatment plant on the Tacoma tide flats could be damaged by a tsunami. In addition, the underside of bridges sometimes support water, gas, and other lines that cross the Puyallup River and a high wave could damage these. Within the City of Tacoma, Marine View Drive/Hwy 509, Ruston Way, Schuster Parkway, and Lincoln Avenue Bridge are all major routes that could sustain tsunami damage. Portland Avenue running along the Puyallup River and Dock Street on the Foss Waterway could be inundated. All of these routes mentioned, if damaged, destroyed, or impassable would have a negative impact on the delivery of services to the community. Due to local topography, University Place, Steilacoom and DuPont, while all located along the coast, only have a small portion of their populations within reach of a tsunami. Sunset Beach and Day Island in University Place are the two areas most likely to sustain damage. A tsunami inundating either area could damage or destroy most of the houses, and in the case of Day Island, the marina as well. Gig Harbor is slightly different from the standpoint that much of the downtown or economic core of the City is located along the shore of the Harbor. The Harbor with its narrow entrance opening into a wider bay may in some cases dissipate some of the waves that enter it. However, recent research suggests that an earthquake along the Tacoma Fault could send a 5.5-foot wave into the Harbor.79 An earthquake along the Seattle Fault can do even more damage to Gig Harbor. Computer modeling shows that an earthquake on the Seattle Fault could send a 11.5-foot wave into downtown Gig Harbor.80 While a 5.5-foot wave would cause some damage within the Harbor, especially to boats and docks, it is doubtful that it would cause further damage within the City itself. A 11.5-foot wave on the other hand will not only wreak havoc among the boats moored within the Harbor itself, but also along the streets paralleling the shoreline blocking them with debris, disrupting power and making response very difficult. Due to the rapid increase in elevation by the landscape above the waterfront, services should not be impaired by the tsunami itself throughout most of the City. Newer preliminary data for a Cascadia Subduction Zone event shows an estimated 8-foot wave at the northern tip of Gig Harbor into Crescent Creek Park, an estimated 7-foot wave at the entrance of Gig Harbor overtops Lighthouse Beach, and an estimated 5-7-foot wave on shoreline of Gig Harbor.81 The other area that could have problems with the delivery of services is the City of Fife. While not a coastal community, its proximity to the coast, the Blair and Hylebos waterways extending almost to its borders, its position on the Puyallup River and its low elevation all leave it susceptible to damage from tsunamis.
Property, Facilities, and Infrastructure Property, facility and infrastructure impacts from a tsunami could range from minor to extreme. For example, a small tsunami generated by a landslide off the steep hillsides in the southern portion of the Sound either in or south of the Tacoma Narrows would affect only a small population that live right along the waterfront and a few businesses like the Day Island Yacht Harbor. Even with a small tsunami there could be damage to the rail tracks. It would put a TSUNAMI - PAGE 4-79 REGION 5 ALL HAZARD MITIGATION PLAN – 2020-2025 EDITION BASE PLAN
temporary stop to rail traffic, both cargo and passenger, between Seattle and Portland if not further. In contrast, a large earthquake generated on the Tacoma or Seattle faults could send a tsunami throughout the entire Port of Tacoma area as well as up the Puyallup River, through Fife, overtopping the levees along sections of the Puyallup River causing further flooding along sections of the lower Puyallup. In addition, due to the volumes of water there would be extensive damage from currents along not just the waterways, but also inland as the water flowed back to the Sound carrying debris with it. Damaged property and infrastructure in this case would not just be the private property and businesses, but roads, both local and major like Highways SR-509, SR-99 and possibly I-5. Damage to the levees along the Puyallup could cause further problems with flooding in future storms. Ships docked in the Port could be damaged as they are moved by the waves and currents. Chemical companies would be damaged, possibly including spills of large quantities of hazardous chemicals that could spread pollution over a large area. Bonneville Power Administration has a major electric power substation located at the south end of the Hylebos Waterway that could have major damage if it was inundated by a high wave (5 foot or higher) of saltwater. Rail lines in the Port could be damaged. The City of Tacoma’s sewer treatment plant is vulnerable as are water, gas, and other lines that cross the Puyallup River on the underside of bridges. Roads along the waterways could be heavily damaged. These include Marine View Drive, Ruston Way and Schuster Parkway. Businesses along these roads could be destroyed or heavily damaged. This includes the restaurants and others along Ruston Way, the grain elevator and loading facilities on Schuster and the marinas currently home to hundreds of boats. In these scenarios, Gig Harbor will also receive a wave causing damage to docks, boats, and businesses as will portions of the rest of the Sound south of the Narrows.
The Environment The environmental impacts from a tsunami striking Pierce County could range from very minor to catastrophic. A small tsunami, like the 1949 wave, would cause very limited environmental damage unless it caused a significant chemical spill. This could happen if it derailed a train carrying hazardous chemicals traveling along the waterfront. In most cases the damage would be to the beach covering at the point of the landslide and the animals that reside there, erosion from the wave action, and damage to the vegetation directly in the path of the wave’s run-up. At the other extreme, a tsunami originating either in Commencement Bay, perhaps from a rupture of the Tacoma Fault, or a large one traveling down Puget Sound from a rupture on the Seattle Fault could damage ships in port. It could destroy the oil and gas tanks at the entrance to the Foss Waterway and damage a number of other properties throughout the port, many of which have quantities of hazardous chemicals. Tides could carry those chemicals throughout not just Commencement Bay, but into other portions of Puget Sound as well. In this case the damage could be catastrophic and depending on the type and quantity of chemical(s) released the environmental damage could last for years if not decades.
TSUNAMI - PAGE 4-80 REGION 5 ALL HAZARD MITIGATION PLAN – 2020-2025 EDITION BASE PLAN
Water overtopping the levees will leave a residue of salt, and possibly other chemicals picked up by the water’s passage through the Port could affect agriculture for years if not decades.
Economic and Financial Condition An example of how a local tsunami and distant tsunami may differ in severity at ports is best shown from a recent subduction zone event off Japan: the 2011 Magnitude 9.0 Tohoku earthquake and tsunami. In Japan, the tsunami was locally sourced and destroyed 28,000 ships, 26 large freighters, 319 ports and created a significant economic loss of 3.9 billion per day. Also, the same tsunami crossed the Pacific and struck the western US as well. In California this distant tsunami destroyed or severely damaged 24 harbors causing 100M in damages. These ports took up to a year to open causing significant impact to the local economy. We can also break the potential for tsunami economic impacts into three groups by size. While there is no exact size parameters, we will use the 1949, 1894, and a tsunami generated by either the Tacoma or Seattle faults. Small tsunamis similar to 1949 or smaller would have very limited or no impact on the economic or financial condition of the jurisdictions located in Pierce County. Their area of impact will be restricted because the volume of water displaced is very limited. There could be more damage from the actual landslide than from the tsunami itself depending on where the slide occurs. A repeat of 1894 could cause greater damage with a wave damaging or destroying many of the businesses along both Ruston Way and Marine View Drive as well as some in the Port of Tacoma and the Foss Waterway. In this case, damage could run into the millions. The third scenario would be a large tsunami from a quake on either the Tacoma or Seattle fault. The developing tsunami could devastate large portions of the Pierce County coastline. In a situation of this magnitude, actual losses from the tsunami itself could be many times that of the previous scenarios. The damage to businesses located in the Port of Tacoma, perhaps as far as Fife, combined with the losses along Ruston Way, Gig Harbor and other points along the coast could set back the economic base for years. Many businesses and a large portion of the industrial base of the County would be damaged. Thousands of jobs would be lost, and tax revenues would drop. It could take years to repair all the infrastructure and only then could the economy begin to rebuild to pre-earthquake/tsunami levels.
Public Confidence in the Jurisdiction’s Governance Depending on the amount of damage, from a locally generated tsunami, the public’s confidence in the jurisdiction’s governance could be sustained or adversely affected. A large tsunami generated by either the Tacoma or Seattle faults could cause extensive damage all along the Pierce County coastline, throughout the Port of Tacoma, and possibly some distance up the Puyallup River. Even with a case like this the public’s confidence in a jurisdiction would be governed by people’s perceptions of how well the response and recovery went. A wellcoordinated, visible, response and recovery effort will increase citizen confidence in their local government. In contrast, a poorly coordinated one will decrease the public confidence in the local jurisdiction’s competence.
TSUNAMI - PAGE 4-81 REGION 5 ALL HAZARD MITIGATION PLAN – 2020-2025 EDITION BASE PLAN
(This page intentionally left blank)
TSUNAMI - PAGE 4-82 REGION 5 ALL HAZARD MITIGATION PLAN – 2020-2025 EDITION BASE PLAN
Geological Volcanic Hazard 4.5G Identification Description Definition82 A volcano is a vent in the earth’s crust through which molten rock (lava), rock fragments, gases, and/or ash can be ejected from the earth’s interior (see Figure 4.5-1). Volcanic hazards within Pierce County include all hazards associated with individual volcanoes in the Cascade Mountain Range. This includes tephra, landslides, lahars, pyroclastic flows, lava, and acid rain, see Figure 4.5-1. Figure 4.5-1 Volcanic Hazards83
Volcanoes have a number of hazards that have to be considered in any mitigation plan. Many of these will only affect areas close to the volcano, but others like lahars and tephra can cause damage many miles away.
VOLCANIC - PAGE 4-83 REGION 5 ALL HAZARD MITIGATION PLAN – 2020-2025 EDITION BASE PLAN
Types Volcanic hazards can occur with or without an actual eruption. The U.S. Geological Survey (USGS) differentiates volcanic activity into two types. In the case of non-eruptive events (no magma), such as the generation of debris flows or lahars, there is generally no movement of magma and there may not be any detectable precursors to the event (minutes to tens of minutes of warning). Hazards associated with an eruption (magmatic activity) can usually be detected through volcano monitoring, so there is generally some warning prior to a magmatic event.
Non-magmatic Volcanic Hazards Debris Flows Debris flows of glacial ice and rock debris may be set in motion by explosions, earthquakes, and heat-induced melting of ice and snow, or the sudden release of water held within a glacier called a glacial outburst flood. A debris flow is a type of landslide that moves at high speeds. Most debris flows at Mt. Rainier are confined to areas either within the park or in a few instances extending to areas just outside the park boundary. Lahars Lahars are volcanic mudflows consisting of dense mixtures of water-saturated debris that move down-valley, looking and behaving much like flowing concrete. They involve much greater quantities of material than do the normal debris flows and can cover many square miles of the valley bottom with mud and other debris many meters deep. Over 60 postglacial (since the last ice age) lahars have been identified as coming from Mt. Rainier.84 Lahars not triggered by an eruption are called spontaneous lahars. Toxic Gases Pockets or clouds of toxic gases may develop on or near both active and inactive volcanoes. Their chemical poisons can cause internal and external burns, or asphyxiation through oxygen starvation. Gases that may be present include Carbon dioxide, sulfur compounds, carbon monoxide, chlorine, fluorine, boron, ammonia and various other compounds. Except for inside the summit caves these generally are dissipated rapidly by wind.85 Landslide Landslides from the sides of the volcano may be large or small, but all can have effects on valleys downstream. Small landslides are common on Mt. Rainier whereas large landslides occur occasionally. Depending on the size of the slide and the consistency and temperature of the material, some of them may transform into lahars.
Magmatic Volcanic Hazards Volcanic Earthquakes Earthquakes associated with volcanic activity at Mount Rainier will not directly cause major damage to areas surrounding the volcano, but they will give scientists important information about magma movement beneath the volcano. They could, however, potentially trigger landslides, which might result in debris flows or lahars that could cause widespread damage to population centers, like the City of Orting, in the valleys surrounding the volcano.
VOLCANIC - PAGE 4-84 REGION 5 ALL HAZARD MITIGATION PLAN – 2020-2025 EDITION BASE PLAN
Lava flows Lava flows are masses of hot, partially molten to molten rock that flow downslope, generally following valleys. Much of Mt. Rainier is composed of andesite lava flows. The term "andesite" refers to the chemical composition of the rock. Andesite lavas tend to be moderately viscous86 and rather slow moving: on gentle slopes, they may move much more slowly than a person can walk. Lava flow from the Cascade volcanoes tend to have high viscosity. Mt. Rainier lava flows have high silica content and tend to be more thick and sticky than those with low silica content. As such they tend to stay close to the volcano rather than extending down valleys long distances. Many of the Mt. Rainier lava flows in prehistoric times tended to flow down valleys, frequently beside glaciers. Table 4.5-1 Tephra Types and Sizes Tephra Tephra Types and Sizes87 Tephra is the general term now used by Fine Ash <1/16 mm volcanologists for airborne volcanic ejecta of any Coarse ash 1/16 mm – 2 mm size. Table 4.5-1 identifies tephra types and Lapilli 2 – 64 mm related sizes. Blocks and Bombs >64 mm
Pyroclastic Flows and Surges Pyroclastic flows and surges can occur during explosive eruptions. Pyroclastic flows are avalanches of hot ash, rock fragments, and gas that move at high speeds down the sides of a volcano during explosive eruptions or when the edge of a thick, viscous lava flow or dome breaks apart or collapses. Such flows can be as hot as 800 degrees Celsius, and are capable of burning and destroying everything in their paths. Pyroclastic flows are rare at Mt. Rainier. As pyroclastic flows descend glaciers they are transformed into a lahar (this has happened many times at Mt Rainier).
Profile Location and Extent88 Tephra Mt. Rainier erupts explosively to produce small to moderate volumes of tephra. Future tephra and ash rich eruptions will distribute the products downwind, most often toward the east, away from Puget Sound's large population centers. Airborne plumes of volcanic ash can greatly endanger aircraft in flight and seriously disrupt aviation operations. Although seldom life threatening, volcanic ash falling on the ground can be a nuisance to residents, affect utility and transportation systems, and entail substantial clean-up costs. Another possibility is that Pierce County could be affected by tephra from other volcanoes in the Cascade chain. This probability, while possible, is also very small. Besides Mt. Rainier, Mt. St. Helens has the highest probability of distributing ash across Pierce County. Eruptions New eruptions of Mount Rainier will most likely start with steam and ash explosions at the summit, and progress to the effusion of a small lava flow or the disintegration of steeply sloping
VOLCANIC - PAGE 4-85 REGION 5 ALL HAZARD MITIGATION PLAN – 2020-2025 EDITION BASE PLAN
lava flows as avalanches of hot rock and gas called a pyroclastic flow. Either type of eruption will probably create lahars that can reach heavily populated areas.89 Lahar As illustrated on map 4.5-1, the lahar hazard covers a great deal of the County as each of the major river valleys comprises a portion of the lahar run out zone. USGS volcanologists and Washington Department of Natural Resources (DNR) geologists identify Mt. Rainier as being in an active eruptive window. From the magnitude of past events, they surmise that the consequences of a lahar or debris flow down the populated river valleys will be catastrophic and could potentially result in a tremendous loss of life and property. Over 150,000 inhabitants of the river valleys work and reside on the deposits of prehistoric and historic debris flows.
VOLCANIC - PAGE 4-86 REGION 5 ALL HAZARD MITIGATION PLAN – 2020-2025 EDITION BASE PLAN
Map 4.5-1 Lahars, Lava Flows, and Pyroclastic Hazards of Mt. Rainier90
VOLCANIC - PAGE 4-87 REGION 5 ALL HAZARD MITIGATION PLAN – 2020-2025 EDITION BASE PLAN
Lahars are categorized by both cohesiveness and size. Case M, I, II, and III lahars are outlined below by their recurrence intervals:91 •
Case M Lahars- The largest lahar to occur in the past 10,000 years is the Osceola Mudflow. It formed about 5,600 years ago when a massive debris avalanche of weak, chemically altered rock transformed into a lahar. Osceola deposits cover an area of about 212 square miles in the Puget Sound lowland, extending at least as far as Kent and to Commencement Bay in Tacoma. The communities of Orting, Buckley, Sumner, Puyallup, Enumclaw, and Auburn are wholly or partly located on top of deposits of the Osceola Mudflow. This lahar is at least 10 times larger than any other known lahar from Mount Rainier. Geologists believe flows of this magnitude occur far less frequently than once every 1,000 years.
•
Case I Lahars- Cohesive lahars originate as enormous avalanches of weak, chemically altered rock from the volcano. They can occur with or without eruptive activity. Most Case I flows have reached some part of the Puget Sound lowland. The Electron Mudflow reached the lowland about 600 years ago along the Puyallup River. Its deposits at Orting are as much as 18 feet thick and contain remnants of an old-growth forest. Average recurrence rate for Case I lahars on Mt. Rainier is about 500 to 1,000 years.
•
Case II Lahars- Usually relatively large non-cohesive lahars, most commonly are caused by melting of snow and glacier ice by hot rock fragments during eruption, but which can also have a non-eruptive origin. More than a dozen lahars of this type have occurred in the past 6,000 years. A few have reached the Puget Sound lowland, including the National Lahar, which occurred about 2,000 years ago. It inundated the Nisqually River valley to depths of 30 to 120 feet and flowed all the way to Puget Sound. About 1,200 years ago, another lahar filled valleys of both forks of the White River to depths of 60 to 90 feet and flowed 60 miles to Auburn. The average time interval between Case II lahars from Mt. Rainier is near the lower end of the 100 to 500 year range.
•
Case III Lahars- This class of flows includes small debris avalanches as well as debris flows triggered by sudden, unpredictable release of water stored by glaciers. These debris flows are largely restricted to the slopes of the volcano, rarely moving beyond the National Park boundary; since 1926, outburst floods destroyed or damaged bridges, roads, and national park visitor facilities on about 10 occasions. Glacial outburst floods are unrelated to volcanic activity and typically coincide with periods of unusually high temperatures or unusually heavy rain in summer or early autumn. About three dozen such flows occurred during the 20th century. Case III lahars occur at an average time interval at Mt. Rainier of about 1 to 100 years.
There were nine large lahars in last 5600 years, eight of which were associated with eruptions. The most likely scenario is a large lahar occurring during unrest/eruption. The approximate timeframe for a large lahar to reach the Nisqually entrance to the park is ~10 minutes, Ashford ~20 minutes, and Orting ~60 minutes.92 These areas include many large population centers, transportation infrastructure such as highways (I-5) and rail (passenger and freight), and the Port of Tacoma (the County’s economic and industrial base). See the profile chapter for more information.
VOLCANIC - PAGE 4-88 REGION 5 ALL HAZARD MITIGATION PLAN – 2020-2025 EDITION BASE PLAN
Table 4.5-2 Estimated Lahar Travel Times for Lahars 107 to108 Cubic Meters in Volume (Approaching a Case I Lahar in Size)93 is based on information from geologists at the Cascade Volcano Observatory (CVO). Table 4.5-2 Estimated Lahar Travel Times for Lahars 107 to108 For the Puyallup and Carbon, Cubic Meters in Volume they are based on the time it Estimated Travel River Basin Time in hours takes for the lahar to travel from Carbon River the point where the lahars are Carbonado 0.2 recognized by the monitors that Wilkeson 0.3 are part of the lahar warning Orting 0.7 system in those valleys. Puyallup River Because they have no lahar Orting 0.7 Sumner 1.1 warning system, estimates on Puyallup 1.3 the White and Nisqually Rivers Commencement Bay 1.8 are from the actual release of Nisqually River* material from the volcano’s Alder Lake 1.0 edifice. La Grande 1.5 th
Haggedorn Road & 526 St 2.0 New studies show that the White River** process of hydrothermal Greenwater <1 alteration is unevenly Mud Mt. Dam overtopping ca. 2 weakening the inside of Mt. Travel times on the Puyallup and Carbon Rivers are from Dr. Pierson and are based on the time it would take for the lahar to travel from the lahar recognition points. These are Rainier. This is a process monitors that will pick up a seismic signal from the lahar and broadcast it to the State whereby the interior portions of and County. Travel times on the Nisqually and White Rivers are from the Pierce County cartography work of Karen Truman. the mountain are being *The Nisqually River lahar entering Alder and La Grande Lakes will displace the water chemically altered by contact column, pushing it over their tops, therefore travel times downstream from the dams will more closely follow the time patterns of a catastrophic flood. with hot, acidic water. This **The White River has the Mud Mountain Flood Control Dam on it that can work very makes the slopes more well at containing a Case II lahar and most of a Case I lahar. This is why all times below the dam are assumed to be 2 hours or greater. It is dependent on the amount of water susceptible for failure, behind the dam. It is empty most of the year. increasing both the possibility and size of lahars. The slopes above the Puyallup River drainage are weaker than those above other river drainages originating from Mt. Rainier. The least-stable source of a collapse-driven lahar is St. Andrew’s Rock located above the South Tahoma Glacier, Tahoma Glacier and Puyallup Glaciers with an estimated size of 260 M m3 debris avalanche.94
VOLCANIC - PAGE 4-89 REGION 5 ALL HAZARD MITIGATION PLAN – 2020-2025 EDITION BASE PLAN
Occurrences Tephra Largest eruption in last 10,000 years was 2,200 years ago. Map 4.5-2 Probability of Measurable Ashfall in Tacoma from Rainier modeling uses wind field data for 1,000 random days. Found there was a 3% chance of 1 mm ash (0.25 inches) in Puyallup if there is another biggest Rainier eruption. Map 4.5-2 Probability of Measurable Ashfall in Tacoma from Rainier
VOLCANIC - PAGE 4-90 REGION 5 ALL HAZARD MITIGATION PLAN – 2020-2025 EDITION BASE PLAN
Table 4.5-3 Mt. Rainier Identified Tephra, last 10,000 Years
During the past 10,000 years there have been 11 identified tephra eruptions, from Mt. Rainier, ranging in size from 0.001 to 0.3 km3.95 See Table 4.5-3, Mt. Rainier Identified Tephras from the last 10,000 years.96 Notice that none of them begins to come close to the magnitude of ash deposited from the Mt. Saint Helens eruption of 1980.97 The St. Helens eruption of 1980 deposited approximately 1.01 cubic kilometers of material or a little over three times the amount from the largest
Rainier eruption shown on the table. Table 4.5-4 provides a list of past occurrences of debris flows on the various river valleys in Pierce County.
VOLCANIC - PAGE 4-91 REGION 5 ALL HAZARD MITIGATION PLAN – 2020-2025 EDITION BASE PLAN
Table 4.5-4 Pierce County River Valley Debris Flow History
PUYALLUP RIVER DEBRIS FLOW HISTORY TYPE OF FLOW Electron Mudflow Lahar Round Pass Mudflow Lahar runout “Pre-Y” Lahar Lahar runout
AGE OR DATE 530-550 BP* ~ 1000 BP* ~2,600 BP* < 3400 BP* < 3500 BP* >3500 BP*
AREA REACHED Puget Sound Lowland, possibly to Puget Sound Puget Sound Lowland Probably to the Puget Sound Lowland Puget Sound Lowland Puget Sound Lowland Puget Sound Lowland
NISQUALLY RIVER DEBRIS FLOW HISTORY TYPE OF FLOW Kautz Glacier/Van Trump Creek Debris Flows Outburst flow on Kautz Creek
AGE OR DATE
Tahoma Lahar
Post 1480 AD
Lahar runout Lahar runout National Lahar Round Pass Mudflow Lahar runout Large lahar runout Paradise Lahar
< 2500 BP* < 2500 BP* ~ 2200 BP* ~ 2,600 BP* < 3400 BP* < 3400 BP* 4,500-5,000 BP*
August 2001 1947 AD
AREA REACHED Near the Park boundary Below confluence with Nisqually River Below the confluence of Tahoma Creek & the Nisqually River At least to Elbe At least to Elbe Puget Sound At least to National At least to Ashford Probably to Puget Sound Lowland At least to Elbe
WHITE RIVER (INCLUDING WEST FORK) DEBRIS FLOW HISTORY TYPE OF FLOW Debris Avalanche Gravel-rich flow At least one lahar Lahar in West Fork Lahar (TBD) Many lahars At least 5 lahars Osceola Mudflow Greenwater Lahar
AGE OR DATE 1963 ~ 1550 AD > 1480 AD < 2200 BP* < 2200 BP* < 2200 BP* < 4500 BP* ~ 5000 BP* ~ 5000 BP*
AREA REACHED Within 1 km of the White River Campground At least to Mud Mountain Reservoir At least 5-10 miles outside of Park boundary At least to confluence of forks Probably to Puget Sound Probably to Puget Sound Probably to edge of Puget Sound Lowland Puget Sound Lowland Puget Sound Lowland
CARBON RIVER DEBRIS FLOW HISTORY TYPE OF FLOW Lahar runout Lahar runout
AGE OR DATE Post 1480 AD Pre 1480 AD
AREA REACHED At least 5 km below end of glacier 8-10 km beyond end of glacier
*Carbon 14 years before present, working from a base line of 1950 Recurrence Rate While Mt. Rainier had a few small steam or very small tephra eruptions during the 1800s, these were not eruptions to cause concern. The same can be said about the small mudflows down Tahoma Creek over the past 40 years, or even the larger Kautz mudflow of 1947. The geologic history of the volcano, as shown in the above tables, shows 11 volcanic tephra eruptions over the past 9,000 years. In addition, the history of lahars in the valleys shows their time frames to be variable with some long periods, occasionally over 1,000 years, between them. Research from USGS scientists and others points to an VOLCANIC - PAGE 4-92 REGION 5 ALL HAZARD MITIGATION PLAN – 2020-2025 EDITION BASE PLAN
annual probability of 1 in 500 to 1,000 for a significant landslide driven lahar. In addition, the “annual probability of eruption-triggered lahars is basically the same as the eruption probability because most eruptions will create lahars of some magnitude –1 in 100 to 500, but probably more toward the 500 end.”98 Taking all this into consideration, it is estimated the recurrence rate for damaging volcanic activity, be it a damaging tephra eruption or a lahar coming down a valley, to be a 500 to 1,000 year occurrence.
Impacts Impacts discussed here will cover tephra and lahars, both eruptions triggered and spontaneous. Unless stated otherwise, lahar damage will be based on the potential for a Case I lahar traveling down the various valleys from Mt. Rainier. It will be assumed that general impacts are the same across the four main valleys (Carbon, Puyallup, Nisqually, and White) unless stated otherwise. Impacts from a lahar descending the Cowlitz River, the other river with its headwaters on Mt. Rainier and located partially in Pierce County, will have no direct effect on the County once it has exited the Park into Lewis County. There will be no further discussion of it. Most of the impacts from a lahar will be determined by the volume of the lahar and which valley or valleys it descends. Next is whether there is a recognizable sequence of volcanic events leading up to its initiation. Whether it is a spontaneous lahar or the result of other developing volcanic convulsions leading to, or part of, an eruption will have a major impact on the response and the recovery. For the purposes of this section we will assume an Electron size and type flow and for most impacts look at the difference between the two basic scenarios of an eruption or magmatic triggered lahar and a spontaneous lahar.
Health and Safety of Persons in the Affected Area at the Time of the Incident Tephra As mentioned above most of the tephra or ash from a volcanic eruption of Mt. Rainier should leave western Washington and be deposited east of the Cascades. However, the wind patterns may not always blow in that direction. If not, then ash could be deposited over portions of Pierce County. If so, a number of problems will arise. Thick deposits of ash can collapse buildings. This is especially true if it is raining. A oneinch layer of ash weighs between five and ten pounds per square foot. This weight can increase dramatically with rain, because ash will hold the water. The weight can increase to 10 to 15lbs per square foot, leading to collapse in some cases.99 Persons inside those buildings have a significant chance of being killed or injured by the collapsing structure. Persons located in areas with falling ash can experience eye, nose and throat problems. Patients with bronchitis, emphysema and asthma are at even greater risk. Breathing similar material in mines and quarries by workers can lead to silicosis over many years. Short term breathing of small quantities of ash particles is not known to cause long-term VOLCANIC - PAGE 4-93 REGION 5 ALL HAZARD MITIGATION PLAN – 2020-2025 EDITION BASE PLAN
problems. The decrease in visibility and increase in darkness in those areas heavily impacted by the tephra will disrupt outdoor activities and, in some cases, cause psychological distress. Thin ash layers can make roads slick leading to an increase in accidents. It can also clog up air intake systems for automobiles and destroy the engine rendering the car useless for evacuation if necessary. Lahars A lahar coming down one or more valleys from Mt. Rainier has the potential to cause the highest number of fatalities and casualties of any hazard treated in this risk assessment. The difference in the impact on the population will be highly dependent on whether the lahar was a result of increasing volcanic activity or is due to the spontaneous collapse of a portion of the mountain. Lahars can be devastating in their consequences. The lahar that inundated the town of Armero in Columbia on November 13, 1985 was relatively small compared to some of the ones that have descended Mt. Rainier. That lahar, from the volcano Nevado del Ruiz, killed over 23,000 people and injured about 5,000 people.100 In this case, the main wave of mud that demolished the town ranged in depth from 6.5 to 16 feet. There could be a similar percentage of injured and killed in a lahar from Mt. Rainier. The method of destruction, burying entire communities in a flow of dense mud, does not allow most people caught in it a chance of survival. Magmatic or Eruption Triggered Lahar With a lahar that begins when the volcano enters an eruptive stage, there will usually be many hours, if not days or weeks of increasing volcanic unrest. During this time, the citizens that live in the valley areas surrounding the mountain will be put on a high alert that a lahar is possible. Memories of Mt. St. Helens and the lahar from it should inspire people in the valleys close to the volcano to prepare to evacuate or even self-evacuate early in the eruption process. The more distant from the volcano they live or work, the less preparation there will be overall, even for those who are directly in the path. As the situation deteriorates, monitoring of the volcano will increase. Any needed warnings from the State, the County, or the Cascades Volcano Observatory will be broadcast to inform and warn residents in the potential paths to prepare for and evacuate, if able, well before any lahar is created. Having a percentage of the people leave the valleys early allows for a quicker evacuation when it becomes necessary. Much of the response for an early evacuation will depend on the perceived security of property left behind. If local government does not provide adequate security, many people will not leave their property behind, but will rather gamble that they can get out in time if necessary. For those who did leave early, the perception that there is a lack of security for their property will bring them back. The other factor that will bring people back is if the volcano does not erupt or send down a lahar over time. People’s patience will rapidly wear thin and they will want to move back home. VOLCANIC - PAGE 4-94 REGION 5 ALL HAZARD MITIGATION PLAN – 2020-2025 EDITION BASE PLAN
Overall though, having knowledge ahead of time that the volcano is coming back to life and that a lahar could happen at any time will allow many people to get themselves and many of their belongings out of harm’s way before the mud arrives. This could save many lives and a great deal of personal belongings and property. Spontaneous Lahar A spontaneous lahar is most likely to happen due to the collapse of a portion of the headwall above the Tahoma Glacier on the west flank of Mt. Rainier. The Mt. Rainier Lahar Warning System composed of sensors to detect the lahar, and radio transmitters to send that information back to Pierce County and Washington State warning points is in place help prevent a lahar coming down either the Puyallup or Carbon Rivers from taking the communities by surprise. Once it has become known that a lahar is descending down either of the valleys additional notifications will be pushed out through the Emergency Alert System (EAS), the Wireless Emergency Alert (WEA), NOAA weather radios, and other notification systems operated by locals. Having a warning system in place does not mean that everyone will be able to evacuate the valley bottoms in time. The short time between the warning and the inundation of homes, schools, roads and businesses will not allow the entire population to escape. In the upper valley south of the confluence of the Puyallup and Carbon Rivers there could be many fatalities.
Health and Safety of Personnel Responding to the Incident Tephra As pointed out above, thick depositions of tephra can collapse buildings, especially if it is raining. Persons inside those buildings have a significant chance of being killed or at least injured by the collapsing structure. Responders may wind up working for long periods of time in areas with ash. The problems of eye, nose and throat irritation could impact their ability to work in those conditions. It is not known if this has long-term, negative health consequences. Personnel responding to incidents will find that thin ash layers can make roads slick leading to an increase in accidents. Emergency equipment will break and ash can clog up air intake systems and destroy engines for rescue vehicles like helicopters, fixed wing aircraft and automobiles. This is not just a maintenance problem. It could lead to crashes of response vehicles. Lahars Because of the enormity of the event, initial response to a lahar will be limited to saving response resources and assisting citizens to get to high ground, all while attempting to keep themselves safe. What will be a problem for the safety and health of responders is that the lahar will leave citizens stranded at various places throughout the valley. They could be on buildings that did not collapse or in trees that were not knocked down or VOLCANIC - PAGE 4-95 REGION 5 ALL HAZARD MITIGATION PLAN – 2020-2025 EDITION BASE PLAN
highway overpasses. Essentially, people could be on any structure, tall enough to be above the mud and strong enough to survive being inundated by it. Since the mud will in many cases be too deep to drive or walk through directly, helicopter rescues might be necessary. This has all the dangers inherent in that type of operation. In addition, hazardous chemicals and sewage will contaminate some areas rendering them hazardous to anyone working there. There is also the possibility of more mud flows inundating the valley floor. A contributing factor is rain. Rain could pick up more of the material left in the higher parts of the valley and transport it down to the lower valley and deposit it as a new layer on the earlier flow. During the initial build up to an eruption, when the Cascade Volcanoes Observatory warns about an upcoming event and warns citizens that they might want to evacuate, all local police forces will be put in the position of controlling access to those areas deemed hazardous. This could include both the Nisqually and Puyallup Valleys. Irate citizens, demanding access to their properties could create hazardous situations for these forces. There could be attempts to push through barricades, threats to officers or others staffing those barricades, or even if the area is shut down for a long period of time, riots. After a major lahar, responders from public works and utilities will not be able to do any initial work in the lahar zone to restore the damaged area. The lahar will totally block access to the area and will have taken out the utilities and roads; in effect, the entire surface infrastructure. Utilities that were underground to begin with, like pipelines, may be buried under the mud but may still be operational. As the mud solidifies over time, public works and utility providers may be able to work back out into the devastated areas. As they do so, they will have to be aware of any hazards that might still be in the environment. Magmatic or Eruption Triggered Lahar With the knowledge that the volcano is threatening to erupt, first responders will be able to move critical equipment to high ground well ahead of time. Since the public will know what is happening as the volcano awakens and, in some cases, self-evacuate ahead of time, the problems relating to a spontaneous mass evacuation will diminish. Barricades and police services will be in position ahead of time to conduct evacuees rapidly out of the valleys should a lahar start. Close monitoring of the mountain should give the warning points quicker notification when a lahar does begin. The number of people needing assistance should decrease. This should decrease the number of technical rescues that will need to be done once the lahar has finished moving through the valleys. Problems could be compounded if there is a lot of tephra due to the eruption at the same time. Spontaneous Lahar With a spontaneous lahar, any responders in the affected valleys will be in the same position as other citizens. They will have to get themselves and any vital equipment to high ground as quickly as possible. In those areas some distance away from the volcano, like Fife and Puyallup, there should be enough time for a few first responders to assist with the evacuations of some citizens. In those areas closer to the volcano like Orting, VOLCANIC - PAGE 4-96 REGION 5 ALL HAZARD MITIGATION PLAN – 2020-2025 EDITION BASE PLAN
that will be out of the question. It is possible that when a spontaneous lahar sets off the volcanic warning system or one is heard coming down either the White or Nisqually rivers that the ensuing panic could by itself injure, kill or trap in the lahar zone, those who would normally respond.
Continuity of Operations Tephra Small tephra explosions should not have an effect on the continuity of operations for jurisdictions or agencies in the County unless the wind patterns are perfect for dropping it directly on their service area. Large tephra eruptions are different. Due to the amount of material dropped on an area, operations can be strained. Damage to communications equipment, roofs of buildings collapsing, roads closed, etc. can all limit the ability of an agency to maintain day-to-day operations. If the volcano has a large tephra eruption and conditions are right to deposit the ash across portions of Pierce County, there could be difficulty finding alternate facilities, getting staff to work and having necessary equipment in operational shape. However, the probability that this will be the case is relatively low. As mentioned above, Mt. Rainier’s eruptions tend to have low quantities of tephra and when an eruption does occur the normal wind directions over Pierce County should distribute it to eastern Washington. While possible, it is unlikely that tephra, by itself, will dramatically alter or limit the continuity of operations for agencies within Pierce County. Lahars Any major lahar coming down one or more of the valleys radiating from Mt. Rainier will dramatically alter the continuity of operations for local jurisdictions. However, depending on the level of preparedness and whether a lahar is the result of the buildup of volcanic activity or of a spontaneous sector collapse the continuity of operations for a jurisdiction or agency could be very different. Magmatic or Eruption Triggered Lahar Lahars triggered by a buildup and release of volcanic energy will have a lead in time, ranging from hours to weeks, for jurisdictions and agencies to prepare for the likelihood that a lahar may be forthcoming. Those entities with infrastructure in the path of the flow will be able to find alternate work sites and move at least some equipment to high ground out of the path. For those entities that are only partially within the lahar path this should work well. Even if the lahar does take out some of their infrastructure and property, they should still be able to maintain an operational posture, albeit reduced, for the rest of their jurisdiction or clients. For those entities entirely, or nearly entirely, within confines of the flow, things will probably be different. Even if they were able to initially remove equipment from the valley floor and protect all staff, normal day-to-day operations will be non-existent. With VOLCANIC - PAGE 4-97 REGION 5 ALL HAZARD MITIGATION PLAN – 2020-2025 EDITION BASE PLAN
no citizens, no tax base, no offices, no infrastructure and no community, there is no continuity of operations. Spontaneous Lahar For spontaneous lahars the impacts to the valleys, while identical, could have a different impact on the agencies and jurisdictions located there. Those that have operations located in the valley that are unable to get an alternate site from which to operate will have all the problems of those jurisdictions and agencies who have a warning but also many others. In addition, they may lose records, staff and equipment when the lahar overwhelms the valley. The possibility of maintaining operational continuity in this scenario is impossible. Those that have their operations run from outside the lahar inundation zone should be able to maintain operational continuity, albeit in a possibility reduced capacity.
Delivery of Services Delivery of services will be nonexistent in those areas of the County that are deeply buried by a lahar. With no homes, no businesses, and no infrastructure, there will not even be a reason to attempt delivery of services into the impacted area. Delivery of services into other areas will depend directly on the infrastructure that is left after the lahar has inundated the valley, combined with how much of the jurisdictions’ or agencies’ resources have been salvaged. If the lahar has destroyed one or more of the exits from Pierce County across the Puyallup and or Nisqually Rivers, then the ability to receive outside assistance will be delayed possibility for days. Re-supply of equipment, equipment parts, food or any of the necessities of life will be difficult. A lahar inundating the Puyallup Valley will cut the eastern part of the County from the rest. Bonney Lake, Buckley, Cascadia, the East Hill of Sumner and others would have to go through King County for assistance. Delivery of services to those areas from local agencies within these areas would go on, although some might be reduced. There can however be some differences between the delivery of services after a magmatic generated lahar and a spontaneous lahar. Magmatic or Eruption Triggered Lahar Just as with the continuity of operations, the disruption to the delivery of services would be reduced with an eruption generated lahar. The ability to get supplies stockpiled ahead of time, get equipment out of the lahar zone, set up sheltering system for thousands of people and develop immediate contingency plans will all assist with the delivery of services to those areas not destroyed by the lahar.
Spontaneous Lahar A worst-case scenario would include a lahar that begins with a sector collapse on the west side of the mountain above the headwaters of the Puyallup River. Such a lahar could VOLCANIC - PAGE 4-98 REGION 5 ALL HAZARD MITIGATION PLAN – 2020-2025 EDITION BASE PLAN
partially overtop the ridge separating the Puyallup River and Tahoma Creek that empties into the Nisqually River. This could cause delivery of services to be compromised in both watersheds. All the problems that exist with an eruption triggered lahar are also inherent with a spontaneous lahar. In addition, delivery of services to citizens will be even more compromised in the case of a spontaneous lahar because local agencies and jurisdictions will not have the lead up time to evacuate equipment, records, and supplies from the valley bottom. Those that normally have their equipment, supplies and records or backup copies, out of the impacted area will be able to respond with at least some service delivery to those areas not directly impacted by the lahar.
Property, Facilities, and Infrastructure Any Mt. Rainier major event, whether eruptive related or from a spontaneous lahar, will have a major impact on the property, facilities and infrastructure of jurisdictions and agencies within the confines of Pierce County as well as surrounding counties. Tephra101 Tephra can collapse roofs, destroy engines, make roads slippery, clog both water and air filtration systems, kill crops, clog drains, and short out electrical systems. All these can and will affect jurisdictions and their ability to operate on a day to day basis. Depending on the depth and distribution pattern of the ash, individual agencies or jurisdictions will be more or less impacted by it. With more than one cm of ash having the ability to disrupt traffic by closing down roads combined with the other damage listed above, it could take weeks for the local agencies and jurisdictions to get their individual infrastructures back to normal. Lahars Lahars are the primary force that will damage the infrastructure, property, and facilities. They will flatten buildings, destroy equipment, bury roads, take out power lines and destroy sewer pumping systems. A major lahar coming down any of the river systems from Mount Rainier will damage, destroy or bury all facilities, property and infrastructure that are above ground in the impacted area. Only those areas on the periphery or where the flow weakens, thins out and reduces in speed and volume will have any chance of survival. Current buried pipes, power lines, etc. should not be damaged directly; although where they rise to the surface, they can be damaged. However, having a sewer line buried under an extra 15 feet of mud in a community that no longer exists is essentially worthless. In areas where the lahar is shallow, many of these underground utilities may be able to be rehabilitated. The extent of damage will be directly correlated with the quantity of debris the volcano coughs up. Smaller lahars will not cover as much territory as the larger lahar would and VOLCANIC - PAGE 4-99 REGION 5 ALL HAZARD MITIGATION PLAN – 2020-2025 EDITION BASE PLAN
will cause less damage to those areas they do cover. This can be seen graphically on Map 4.5-1. Here the Case 1 lahars are inclusive of all the territory also contained in Case 2 lahars and in addition all the area highlighted in yellow. Magmatic or Eruption Triggered Lahar With a magmatic triggered lahar there will be time to evacuate records, supplies, and equipment from the lahar’s path. How much of the material will actually be evacuated depends on the length of time between when the volcano awakens and finally sends a lahar down the valley. This could be from a few hours to many days or weeks. The more time allowed the more that can be saved. Spontaneous Lahar With a spontaneous lahar, there will be very little that jurisdictions can do to protect their facilities, property or infrastructure located in its path. Those with resources further away from the volcano will have a little time once the warning has been disseminated, but it may be too little to make a major difference. Those agencies and jurisdictions will essentially have little or no time to evacuate anything of value. That which was not protected prior to the initiation of the lahar may be damaged or gone.
Environment Environmental impacts will be dramatic and, in some cases, long lasting. Tephra Small tephra eruptions will have limited environmental impacts. Large tephra eruptions could have dramatic impacts on the environment or ecology of large areas around Mt. Rainier. Because under normal circumstances the prevailing wind patterns will blow much of the tephra to the east impacting the upper White River and much of eastern Washington. In this scenario, plants and animals in the White River valley could suffocate under the ashfall. Tephra damage102 will partly depend on the size of the particles. Large pieces, one to two inches or greater in diameter, can be very damaging. However, lethal impact from falling tephra is likely only in the immediate vicinity of the volcano, generally within about six miles of the vent. Animals not protected in this area could be severely injured or killed by the large particles. Further away, the finer grains begin to fall and can cause respiratory and eye irritation to animals, burying plants and robbing the animals of their natural food supply. Ash washed down by the rain will tend to add to the rest of the silt in the rivers and some of it will settle out down stream possibly affecting the fish resources, including salmon that return up the various rivers. A large tephra eruption that blows in other than an easterly direction could cause extensive, long-term environmental damage to much of the County. Having the same types of damage mentioned above but spread over much of the County could cause environmental impacts that may take years to recover from. VOLCANIC - PAGE 4-100 REGION 5 ALL HAZARD MITIGATION PLAN – 2020-2025 EDITION BASE PLAN
Lahars Lahars are the primary damaging factor associated with Mt. Rainier. Lahars descending the valley will destroy and bury any and all plants and animals in their path. They can destroy forested areas and they will silt up rivers and change their channels. They will add pollutants or hazardous chemicals to the environment by the damage they do to manmade structures, vehicles, sewage treatment facilities, etc. The addition of mud to the valley bottom by winter rains bringing down more debris from upstream will continue to cause problems for the environment possibly for a few years after the initial mudflow. They may totally destroy salmon habitat, and the valley ecology in the areas they cover. Those that reach Puget Sound could cover the near shore environment with silt and possibility partially fill in Commencement Bay, and/or cover the shallow Nisqually delta and mud flats creating a new surface and killing the creatures that currently make it home. A new environmental balance will eventually be formed as plants and animals re-inhabit the area covered by the mud. While it may take years for nature to repair the damage, it will eventually reclaim those areas damaged by the lahar.
Economic and Financial Condition Economic and financial affects will be of two parts. First is the damage to property, buildings, inventories and equipment. Second is the loss of revenue due to the inability to get supplies through the damaged area, the loss of markets, the decrease in population and, in some cases, the loss of infrastructure to support the area economically. Tephra The damage to individual businesses, homes, and equipment could cause major financial losses for individuals and businesses throughout Pierce County, but only if the wind does not blow the ash to the east. If the wind does blow to the east as expected, then areas in the White River Valley will be the ones affected. In this case, the Crystal Mountain ski area, and the homes between it and the Greenwater area could be heavily damaged. The Greenwater businesses and the Fire Department could all have structural building damage and the damage to vehicle engines may prevent owners from evacuating to a safer area. Lahars Lahars have the potential to be the major destroyer of economic viability within Pierce County. Any major lahar coming down one of the valleys from Mt. Rainier will destroy the homes, businesses and much of the infrastructure within whichever valley it descends. Closer to the mountain, like in Ashford or Elbe, some of it will be related to the tourist trade, or other wilderness operations. Citizens there maintain their restaurants and shops along the mountain highway, work in the National Park, or in many cases work for logging corporations, any or all of which may be out of business because of a lahar.
VOLCANIC - PAGE 4-101 REGION 5 ALL HAZARD MITIGATION PLAN – 2020-2025 EDITION BASE PLAN
In other cases like the cities of Puyallup, Sumner and Orting, there are thriving communities that have been located on the valley floor for over 100 years, that have flourishing downtowns and whose citizens are involved in the full range of occupations that any city or bedroom community has in Washington. Many of them work in King County or the City of Tacoma. Many of them have their own businesses in town. There are schools, medical clinics, libraries, fire stations and the Puyallup Fair Grounds. Any lahar that inundates these areas will be destroying vibrant communities that have taken over a century to grow to their current size. Those portions of these communities on the valley floor, which includes most of Puyallup, almost all of Sumner and all of Orting could be destroyed totally with no viable way to regain their economic base. It is not a question of rebuilding a few destroyed buildings as it would be after an earthquake. With a lahar there may be no houses, no businesses and no infrastructure to begin the rebuilding process. The result will be that there will be no population base for an economic revival. People will have left the area. There will be no tax base for the cities to begin their rebuilding process. With many feet of mud in the valley, and the threat of further flooding and lahars, it will be awhile until people begin the rebuilding process. Magmatic or Eruption Triggered Lahar As the developing threat from the volcano is recognized by the scientists and they begin to warn the public there will be some time for some people and business to move some of their belongings, records and goods to higher ground. However, no matter how much they are able to save this way, the economic recovery will be long and hard. With the destruction of homes and the physical structures of the businesses in the valley, people will have no option except to leave the area and find homes and work elsewhere. Spontaneous Lahar With a spontaneous lahar almost no community in the pathway of the lahar will have the ability to adequately protect its assets. This is the worst-case scenario. There could be a total loss of homes and businesses in the impacted area. With buildings, equipment, records, inventories, and community infrastructure gone, no business in the lahar zone will be able to restart immediately. Even attempting to reestablish their business at a different location, outside the inundation zone, will, in many cases, fall short. With the exodus by many members of the community, numerous businesses will have little incentive to even attempt rebuilding in the valley.
Public Confidence in the Jurisdiction’s Governance The reputation of an agency or jurisdiction as well as the public’s confidence in it will depend to a great extent on the amount of planning and preparation that was done in anticipation of the eventual event. This, combined with the open distribution of information to the public regarding what is happening, could happen, and will happen during a volcanic event will greatly boost the public’s confidence in the agencies and jurisdictions effected by it.
VOLCANIC - PAGE 4-102 REGION 5 ALL HAZARD MITIGATION PLAN – 2020-2025 EDITION BASE PLAN
False alarms, alarmist pontificating, or confusion on what needs to be done will only lower the public’s perception of the entity. Premature warnings of impending danger, especially if leading to what is seen as unnecessary evacuation, will only weaken any entity’s authority. Mt. Rainier is a big enough problem that good faith efforts put forth by the agencies and jurisdictions will reap a good response from the public. Incompetence, however, will show through and will destroy any reputation that the entity had before. Lahars Good information provided prior to a lahar regarding what needs to be done to prepare, how to evacuate upon receiving a credible lahar warning, and limiting false alarms will maintain the public’s confidence in a jurisdictions ability. If, on the other hand, false alarms become the norm, sirens do not work, and there is confusion as to what people are supposed to do, the entity’s reputation will suffer. Any confidence the public has in that entity will be lost. Another factor affecting the eventual reputation is the ability to get infrastructure back up and running as soon as possible. The fact that some areas will be unavailable, perhaps for years, will take awhile for the public to accept. Even the visual clue of square miles of mud will not prevent some people from complaining that local, state and federal agencies are not doing enough to help them return to their pre-lahar state. Magmatic or Eruption Triggered Lahar A lahar triggered by an eruption will allow the local agencies more time to prepare for the eventual destruction associated with it. They will have time to move resources, set up assistance centers, evacuate people if necessary and be seen as leading the response, not just being reactive to the circumstances. In this case, those agencies and jurisdictions seen as preparing for the potential lahar will maintain credibility with the public. Where this could break down is if an evacuation is ordered based on the best geological evidence the scientists can provide and the mountain does not produce a lahar. In this case, there could be citizen unrest as they want to get back to their homes with the resulting loss of support for the actions of the local entity. Spontaneous Lahar In the case of a spontaneous lahar, the timely warning of an approaching lahar in the Puyallup Valley should help in the maintenance of the local entity’s reputation. Even with some loss of life, if the warning system operates as it is designed and all jurisdictions follow the Mt. Rainier Volcanic Hazards Response Plan, confidence in the jurisdictions will remain intact. This will not be the case if, without a warning, a spontaneous lahar descends upon either the Nisqually or the White River Valleys and impacts homes and businesses. In this situation, there would be many questions about why no warning system was regarded as necessary on the Nisqually or White River sides of the mountain and the reputation of government would be adversely affected. The short time frame from when a spontaneous VOLCANIC - PAGE 4-103 REGION 5 ALL HAZARD MITIGATION PLAN – 2020-2025 EDITION BASE PLAN
lahar is initiated to when it begins to impact citizens in the Nisqually or White River Valleys does not allow enough time to put out an EAS or telephone ringdown message to citizens in those valleys close to the mountain. Those further downstream may be able to be reached in time to allow evacuation.
VOLCANIC - PAGE 4-104 REGION 5 ALL HAZARD MITIGATION PLAN – 2020-2025 EDITION BASE PLAN
Meteorological Climate Change 4.1M Identification Description Climate change has received tremendous press recently due to the topic of global warming making it into the mainstream consciousness. Currently the expanding body of empirical data supports the basic premise that the long-term average temperature of the earth's atmosphere has been increasing for decades. This trend is continuing, and the scientific community generally agrees that it will continue for the foreseeable future unless dramatic steps are taken on a global scale to decrease the release of greenhouse gases (Figure 4.6-1 IPCC Models on Global Temperature Change: 1900 to 2100). This will create dramatic changes in the local environment of Pierce County. Today, questions revolve around the overall increases in local temperatures, precipitation, and wind patterns and their long-term effects. For Pierce County, climate change boils down to a few basic questions which can further be broken down into two categories of impact: natural causes and human causes. The questions regarding the natural environment include: • • • • • • •
How will the temperature change over the next few decades? How will the rain and snowfall patterns change? Will this exacerbate other problems in the environment? What new environmental problems will arise? What are the expected changes in the biological life zones? What will be the effect of sea-level rise on Pierce County’s coastline? How will climate change impact the ecology of Puget Sound?
CLIMATE CHANGE - PAGE 4-105 REGION 5 ALL HAZARD MITIGATION PLAN – 2020-2025 EDITION BASE PLAN
Figure 4.6-1 IPCC Models on Global Temperature Change: 1900 to 2100103
The second half asks: • How will these changes affect the citizens living here? • What changes to the infrastructure will be needed to accommodate the expected environmental changes? • What lifestyle changes will be necessary? • What are the economic consequences of property loss, especially to the port/industrial area? • How will individuals, business, and government respond to changes in lifestyle required by the changes in the local environment? Climate change is not a hazard. It is a hazard multiplier that will worsen most existing natural hazards.104
Definition Climate change is a significant and lasting change in the statistical distribution of weather patterns over periods ranging from decades to millions of years. It may be a change in average weather conditions or in the distribution of weather around the average conditions (i.e., more or fewer extreme weather events). Climate change encompasses the major influx in temperature, precipitation, or wind patterns.105 While climate change today is thought of as being synonymous with global warming, in reality global warming is a type of climate change. From another perspective, climate change is the variation in either regional or global environments over time. In this case time can refer to periods ranging in length from a few decades to other periods covering millions of years.106 CLIMATE CHANGE - PAGE 4-106 REGION 5 ALL HAZARD MITIGATION PLAN – 2020-2025 EDITION BASE PLAN
Today, much of the talk of climate change presupposes a rise in global temperature averages. Over the past 150 years good temperature records have allowed comparisons to be made of global temperatures from year-to-year. This has shown an overall increase of approximately 0.8o C during this period (Figure 4.6-1). Over the next century an increase of 6o C is expected due to the greenhouse gases already in the earth’s atmosphere. An increasing body of scientific evidence implies that the primary impetus driving climate change today, are human activities that increases the amount of atmospheric greenhouse gases.107 A number of circumstances can cause climate change including both natural and human causes. These natural factors may be solar cycles, volcanic eruptions, the changing of ocean current patterns, or even something as unusual as a methane release from the ocean floor.108 Those changes due to human activities are frequently called anthropogenic climate change which pertains to activities that alter the atmospheric composition.109 For natural causes the United Nations Framework Convention on Climate Change (UNFCCC) uses the term "climate variability" for non-human caused variations.110
Types There are two major classifications: global warming and global cooling. ▪ ▪
Global Cooling - A decrease in the average temperature of the earth's atmosphere, especially a sustained decrease enough to cause climatic change. Global Warming - An increase in the average temperature of the earth's atmosphere, especially a sustained increase enough to cause climatic change.
Profile With the primary direction of climate change today being global warming, Washington State and Pierce County will experience major changes during the next century. The expected further increases in temperature for Washington State are shown in Table 4.6-1. In this table we can see the projected temperature rise broken down by each year. Such increases will continue to dramatically affect the plants, animals, people and economy of Pierce County. The change in rain and snowfall patterns, life zone migration, and sealevel rise will all create a different County than we have today. Global warming, by itself, is only part of the overall problem, and is actually the result of a number of factors that are all combined into overall environmental degradation. The increase in greenhouse gases, the primary factor blamed for global temperature increase, comes from many divergent sources. Included in the current list are carbon dioxide from modern industry; the burning of fossil fuels; deforestation and cement manufacture; methane from cattle and other animals including such small animals as termites; and gases such as nitrous oxide, chlorofluorocarbons, and a host of other trace gases. While the increase of atmospheric carbon dioxide (CO2) is foremost in peoples’ minds when they think of global warming, some of the other gases have a much greater impact on global warming for the quantity released than does CO2. Methane is 20 to 30 times as CLIMATE CHANGE - PAGE 4-107 REGION 5 ALL HAZARD MITIGATION PLAN – 2020-2025 EDITION BASE PLAN
effective in its ability to absorb infrared radiation as CO2, and chlorofluorocarbons, while usually associated with the destruction of the atmospheric ozone layer, are also highly contributive to global warming. A single chlorofluorocarbon molecule is 20,000 times more effective as a greenhouse gas than is a carbon dioxide molecule. While a number of these other gases contribute a significant amount to the increase in global temperatures the main culprit for the foreseeable future, due to the sheer quantities released, will continue to be carbon dioxide. “Emissions of CO2 due to fossil fuel burning are virtually certain to be the dominant influence on the trends in atmospheric CO2 concentration during the 21st century.”111 With the advent of the industrial revolution, the quantity of atmospheric CO2 began to rise. For the 400,000 years prior to the industrial revolution, the atmospheric CO2 concentrations ranged between 200 and 280 parts per million (ppm). Since the beginning of the industrial revolution, this has increased to today’s levels of around 380 ppm and is continuing to increase about one percent per year. By the middle of the 21st century, these levels could reach 500 ppm and by the end of the century, 800 ppm. Historically there have been many ways that carbon dioxide has been absorbed by the planet. Plant and animal matter that have been buried in great quantities are eventually transformed into coal and oil. Plant material, especially trees, can absorb large quantities of carbon and the ocean acts as a natural carbon sink. The ocean contains approximately 50 times as much carbon as does the atmosphere. At the same time human activity continues to add more of it at an ever-increasing rate. Of all the fossil fuel carbon released to the atmosphere, about 48 percent of it currently ends up in the ocean.112 This continued absorption of carbon dioxide changes the chemistry of the ocean, and essentially affects all sea life. Computer modeling anticipates that this will increase the acidity of the ocean’s surface water by a drop of 0.4 pH units.113 How this will affect the sea life in Puget Sound and Pierce County in particular is still an open question requiring further research. The pace of some effects of global warming seems to be accelerating. Computer models of climate change from the 1990s appear to be already outdated in their predictions. The slowing of the Ocean Conveyor Belt and the destructiveness of storms appears to be increasing at a rate the models had predicted would happen much later in this century.114 Table 4.6 -1 Recent and Projected Temperatures for the Pacific Northwest115 1970-99 2020 Annual 47.0o F 48.9 oF (increase) 1.9 oF o Oct. – Mar. 36.1 F 37.8 oF (increase) 1.7 o F o Apr. – Sept. 57.9 F 60.0 oF (increase) 2.1 oF
2040 49.9oF 2.9 oF 38.6 oF 2.5 oF 61.2 oF 3.3 oF
Notes: Temperatures are averages across the Pacific NW and may vary significantly from region to region. The table compares observed temperatures for the 1970-99 periods with changes in temperatures averaged across 30 yr periods centered on the CLIMATE CHANGE - PAGE 4-108 REGION 5 ALL HAZARD MITIGATION PLAN – 2020-2025 EDITION BASE PLAN
2020s and 2040s projected by 10 global climate models’ two emission scenarios. The future temperatures are the averages calculated from changes projected by those climate models for the specified time periods.
Projections Figure 4.6-2 Puget Sound Projected Warming116
In general, warming is projected through the 21st century in all scenarios (although not all scenarios are shown in the above table) warming is expected in all seasons. Strong agreement among models that extreme heat events become more frequent. The size of the projected change is large compared to observed variability. The region is likely to experience average annual temps by mid-century that exceed what was observed in the 20th century. The 2050s table provides specifics to how much change is projected. This change is significant relative to annual average temperature observe in the 20th century.
CLIMATE CHANGE - PAGE 4-109 REGION 5 ALL HAZARD MITIGATION PLAN – 2020-2025 EDITION BASE PLAN
Figure 4.6-3 Puget Sound Projected Precipitation Change117
More frequent heavy rainfall events expected. The heaviest 24-hour rain events (e.g., atmospheric rivers) become +22% more intense (range: +5 to +34%) by the 2080s. Today’s 24-hour events occur more frequently, about 7 days/year by the 2080s compared to about 2 days per year historically (1970-99).118
CLIMATE CHANGE - PAGE 4-110 REGION 5 ALL HAZARD MITIGATION PLAN – 2020-2025 EDITION BASE PLAN
Figure 4.6-4 Puyallup River: Projected Change in Monthly Hydrograph
CLIMATE CHANGE - PAGE 4-111 REGION 5 ALL HAZARD MITIGATION PLAN – 2020-2025 EDITION BASE PLAN
Figure 4.6-5 Projected Decline in Snowpack119
Shown above (4.6-1 through 4.6-5) are the results of hydrologic model simulations under multi-model average future climate scenarios for A1B and B1 emissions (middle and bottom panels, respectively). All scenarios also indicate less snow in the mountains as a result of warming winter temperatures. As winter temps warm, more winter precipitation falls as rain rather than snow. The snow also melts earlier in the spring season. These changes simultaneously increase risk of winter flooding and summer drought in watersheds that currently accumulate snow. How much so will vary from watershed to watershed. The highest river flows are projected to increase +18% to +55%, on average, by the 2080s in the 12 largest Puget Sound rivers. Climate change is expected to increase the frequency, volume, and area of riverine flooding.120
CLIMATE CHANGE - PAGE 4-112 REGION 5 ALL HAZARD MITIGATION PLAN – 2020-2025 EDITION BASE PLAN
Table 4.6-2 Projected Sea Level Risk: Tacoma121
Figure 4.6-6 Sea Level Rise Inundation Area in 2100 Tacoma Tideflats
CLIMATE CHANGE - PAGE 4-113 REGION 5 ALL HAZARD MITIGATION PLAN – 2020-2025 EDITION BASE PLAN
By the 2040s, the median annual area burned in the Northwest could more than double relative to 1916-2006.122 Changes in the climate drivers of wildland fire are expected to lead to drier fuels and greater potential for wildfires. Increasing air temperature plus earlier snowmelt plus decreasing summer rain equals drier fuels and forests. Generally, expect an increase in the small and moderate fires. The really big fires are driven by extreme east winds. Climate change is expected to increase heavy rain events, decrease snowstorms, but not effect windstorms. Climate change is expected to increase the size and frequency of landslides. Landslide prone areas are expected to become less stable in winter with more winter precipitation as rain, heavier rainfall, and higher soil water content. Landslide frequency may increase with wildland fire.123
Occurrences Global climate change has been the norm for essentially the entire life of the planet. It has forced organisms to change with the changing climate either by migrating or evolving to fit the new weather patterns. Those that did not follow either of these paths either died out, or were reduced in their ranges, sometimes forming small insignificant communities perpetually on the verge of extinction. The last dramatically different climate that we are able to at least get a partial view of is the last ice age. As much as that climate contrasts with ours, we can see only traces of it today. Knowledge of it has gradually evolved through years of research. The covering of much of North America, Europe and parts of Asia with ice, in addition to the linking of the North American continent with Asia, the connecting of Malaysia with Sumatra and Borneo, and Australia with New Guinea, is outside the realm of personal experience. It doesn't influence our day to day thinking. The most recent lengthy episode for which we have detailed written records is the cooling of the Northern Hemisphere during what is called the “Little Ice Age”.124 While there were glacial advances, it was not a true ice age in that it did not last long enough for glaciers to significantly increase the percentage of land they covered. During this 500 to 600-year period temperatures dropped from 1-1.5o Celsius.125 This drop changed disease patterns, caused famine and led to social upheaval in some areas. In the more recent past, the 25-year temperature decrease from 1940 to 1965, impacted many individuals alive today (see Figure 4.6-1) and shows that even with an overall increase in global temperatures there will be periods when the average temperature will drop for extended periods of time. While there are wide variations from year to year in global temperatures, the overall trend since the beginning of the industrial revolution has been for a gradual increase. The forecasts are for this trend to continue into the indefinite future depending on the continued release of greenhouse gases, volcanic eruptions, etc. How much of a change in CLIMATE CHANGE - PAGE 4-114 REGION 5 ALL HAZARD MITIGATION PLAN – 2020-2025 EDITION BASE PLAN
temperature we can expect in the future is one of those debatable questions with estimates ranging from a degree or two up to ten or more degrees Celsius. Even with only a one or two degree increase there would be tremendous climatic changes. While a number of them are expected to be detrimental, there should be some positive changes as well. It is estimated that the worldwide temperature today is only three to five degrees Celsius more than it was during the last ice age, so this could easily double over the next century.
CLIMATE CHANGE - PAGE 4-115 REGION 5 ALL HAZARD MITIGATION PLAN – 2020-2025 EDITION BASE PLAN
Figure 4.6-7 Climate Impacts and Natural Hazards
Figure 4.6-7 demonstrates how confident scientists are about how our changing climate is impacting natural hazards.
Impacts Health and Safety of Persons in the Affected Area at the Time of the Incident The overall impacts from long term climate change are only beginning to be felt throughout Pierce County. Impacts on health would be gradually felt. As the average temperature rises gradually over the next few decades, the incidence of diseases normally associated with warmer climates will increase. There should be a slight decrease in cold related injuries in the winter months and an attendant increase in heat related injuries during the summer months. With both of these, the elderly will be among those affected the most.
Health and Safety of Personnel Responding to the Incident Unlike other emergencies, climate change will not have personnel responding to it as if it was an immediate emergency. Health related issues for personnel will be similar to those for the general population. CLIMATE CHANGE - PAGE 4-116 REGION 5 ALL HAZARD MITIGATION PLAN – 2020-2025 EDITION BASE PLAN
Continuity of Operations and the Delivery of Services While there will be changes in the environment throughout Pierce County, change will develop slow enough to maintain continuity of operations. It is not expected that climate change by itself will impact the delivery of services on a long-term basis. As the climate changes gradually from decade to decade, governmental offices, response organizations and personnel will gradually adapt to fit the new circumstance. Other changes in the environment, such as population growth, should impact delivery of services more than gradual climate change.
Property, Facilities, and Infrastructure Impacts to property, facilities and infrastructure could be considerable, depending on a number of factors, especially sea-level rise. Due to the extensive coastline in Pierce County, sea-level rise combined with subsidence in some areas will eventually damage a large number of properties; affect businesses, and damage local infrastructure. Individuals living along the coast of Puget Sound, especially those with low bank properties, will experience the rise in water levels first. Water will encroach into their yards and winter wave action will erode yards, expanding the beach inland. Areas like Salmon Beach, portions of Day Island, Wollochet Bay, Sunset Beach and others will have problems with high tides impacting homes directly. On the contrary, high bank areas could have problems with their hillsides being undercut by wave action leading to an increase in steep bank erosion or landslides, threatening the homes or property above. Marinas and other businesses, along Ruston Way, portions of Day Island, Gig Harbor, and the Port of Tacoma in many cases will be subject to damage from an increase in sea level combined with wave action. Most of them are currently high enough to avoid damage from winter storms; however, their margin of safety disappears due to rising water levels, and in some cases subsidence. In the event of an extreme low tide, the ferry system cannot run and increases the vulnerability of egress and ingress for Pierce County. Along much of Pierce County’s coastline are critical roads and railroad tracks that are essential to the County’s transportation system and furthermore functionality. An increase in sea level may require raising these to protect the movement of people and goods. With Pierce County’s industrial base located largely within the confines of the Port of Tacoma and adjacent properties, any significant rise in sea level will put portions of it in jeopardy. The potential is there to flood ports, tidewater industrial areas, river deltas, coastal wetlands and beachfront properties. Some of the homes in areas like Sunset Beach, Day Island and Salmon Beach that are currently just above the high-water mark will begin to be flooded during times of high tides. Either land will have to be raised with fill, massive seawalls built, or some industry or roads will have to be relocated to higher ground along with homes in the most threatened areas.
CLIMATE CHANGE - PAGE 4-117 REGION 5 ALL HAZARD MITIGATION PLAN – 2020-2025 EDITION BASE PLAN
In addition to coastal area flooding, wave action could increase the undercutting of high bank areas such as along the Tacoma Narrows. This could undermine homes and other buildings, or structures located along these bluff areas. When the combined coastal subsidence and sea-level rise are added to normal winter high tides and storm surge, damage could be extensive to current structures. Electric generation in Washington is primarily hydroelectric. It relies on a constant supply of water delivered to the dams and generating plants. A decrease in the amount or changes of the timing of streamflow in the winter/spring snowpack will impinge on the ability of electric generating plants to meet demand. Even further the demand during the summer for air conditioners, refrigeration units etc., when water levels will be at their lowest will exacerbate this problem. If water resources can no longer fill the need for electric generation then there could be an increase in the use of fossil fuels to generate electricity. This will create more air pollution problems. Due to the strain on the energy infrastructure, controlled brownouts will occur as a method to relieve the system. Otherwise blackouts would occur and greatly increase the likelihood of heat-related deaths especially among the elderly, those weakened by disease, and the poor.
The Environment Continued scientific research today shows major changes on a worldwide scale. They range from gradual sea-level rise to thinning of the arctic ice pack to a change in the amount of ice at mid-latitudes. Changes in the range of insects and the strength of storms are currently forecast for the present and near future. One of the major problems associated with global warming is the increase in sea-level. Over the past century, the global average sea-level rise has ranged from 1 to 2.5mm/year. In southern Puget Sound, sea-level rise is expected to have the largest global warming rise in the state, about 5mm/year.126 Sea level increased 8.6 inches at the Seattle tide gauge (1900-2008).127 This is a consequence of rising water levels combined with the gradual subsidence taking place in Pierce County and will change the nature of life along the shorelines. In 2001 research on southern Puget Sound showed the rate of subsidence in the Tacoma area to be 2.4 mm/year.128 This means that even without any sea-level rise, the land will sink around 9.5 inches over the next century. When we add in the minimum expected sea-level rise of up to 2.5mm/year this could lead to an effective increase of over 19 inches over the next century. Over the next several years we should begin to see its effects develop on the local scale. The potential is there to flood ports, tidewater industrial areas, river deltas, coastal wetlands and beachfront properties. Some of the homes in areas like Sunset Beach, Day Island and Salmon Beach that are currently just above the high-water mark will begin to be flooded during times of high tides. Either land will have to be raised with fill, massive seawalls built, or some industry or roads will have to be relocated to higher ground along with homes in the most threatened areas. All of these are extensive and expensive projects.
CLIMATE CHANGE - PAGE 4-118 REGION 5 ALL HAZARD MITIGATION PLAN – 2020-2025 EDITION BASE PLAN
In addition to coastal area flooding, wave action could increase the undercutting of high bank areas such as along the Tacoma Narrows. This could undermine homes and other buildings, or structures located along these bluff areas. When the combined coastal subsidence and sea-level rise are added to normal winter high tides and storm surge, damage could be extensive to current structures. One of the other possible effects that may happen due to a warming trend is the movement of saltwater into the coastal aquifers low lying near tidal zone areas, rendering wells in those areas useless. Others would include the expansion of saltwater marsh areas into areas where they do not currently exist. Locally in Pierce County we may see a cycle of warmer winters and drier summers. Puget Sound average annual temperature has increased 1.3F (1895-2011).129 Puget Sound nighttime air temperatures have increased 1.8F since 1895 and nighttime heat waves have increased. Washington Cascades snowpack decreased ~25% between the mid-20th century & 2006.130 If the snowpack is not accumulating, this will cause a lack of available stream water in the summer. Drier summers means an increase in forest fire danger, more stress on agriculture, water rationing, and the possible destruction of fish runs especially salmon, steelhead, and trout.131 As the climate gradually changes, we can expect an upward movement of lower elevation ecosystems. Those ecosystems, like the sub alpine and alpine that are located near the top of our mountains, may be pushed up by pressure of other species from lower elevations as the weather warms. This could lead to the extinction of many endemic species which have tenuous holds in these environments. Over time it could also lead to the migration of plants and animals’ endemic to areas further south like Oregon and Northern California moving into the Puget Sound basin. A decrease in river flows and lake levels especially during the summer months due to the lack of snow in the mountains is already becoming visible in the lack of glacier ice in the Cascades. Ice volumes have decreased dramatically as can be seen in Figure 4.6-8. The South Cascade Glacier in the North Cascades is one of the glaciers that has been studied for many years and has lost much of its ice volume over the past nearly 80 years; photo on left from 1928 and photo on right from 2003. A lack of permanent ice to feed the rivers when the rest of the snowpack melts in the spring could mean very low water levels in the rivers by the time late summer arrives. This would be offset by the possibility of heavier flows during the fall and winter. The decreased flows during the summer will create warmer rivers that are detrimental to already reduced salmon runs. In addition, the heavier flows during the winter could scour many of the river bottoms decreasing salmon habitat.
CLIMATE CHANGE - PAGE 4-119 REGION 5 ALL HAZARD MITIGATION PLAN – 2020-2025 EDITION BASE PLAN
Figure 4.6-8 Comparison of the South Cascade Glacier: 1928 to 2003132
On Mt. Rainier in Pierce County, many of the same issues are confronted with the retreat of its glaciers. Over the past 40 years, due to glacier shrinking of the Paradise and Williwakas Glaciers, the Paradise ice caves, a popular spot for tourists to view the underside of a glacier up close, have disappeared. Other glaciers in the park have also retreated, in some cases long distances up valley. The Nisqually Glacier, shown in Figure 4.7-9, has retreated approximately one mile upstream since 1912 and evidence in the valley shows that the first chronicle mentioning the glacier in 1857 had the ice considerably further down valley, well below the current bridge across the Nisqually River.133 Other environmental changes might include a loss of forest resources due to changing patterns of precipitation and an increase in temperatures during the summers. Forests could be depleted through changing growth patterns due to weather changes, an increase in insect infestations or an increase in forest fires.134 A decrease in the amount of winter precipitation locked up as snow in the Cascades means that a higher percentage of our normal precipitation will be available to cause winter flooding in the County. Currently the mountain snowpack acts as a natural water reservoir. As the annual snowpack decreases due to warmer winters the amount of precipitation that normally falls will raise stream and river levels. This could increase Pierce County’s flood potential.
CLIMATE CHANGE - PAGE 4-120 REGION 5 ALL HAZARD MITIGATION PLAN – 2020-2025 EDITION BASE PLAN
Figure 4.6-9 Lower Nisqually Glacier Retreat: 1912 to 2001135
Other potential effects include new diseases, that while endemic to warmer climates could migrate to Pierce County; a longer growing season for some crops; and a change in the recreational possibilities available for both residents and visitors.
Economic and Financial Condition The changing climate will affect nearly every portion of the County’s economy. Examples include: •
• • • • • •
Energy usage will change. Warmer temperatures will reduce the need for electricity and other energy sources for home heating in the winter, but increase it during the summer months when air conditioning needs will increase; The warmer temperatures with the rising snow levels could decrease the ski season at Crystal Mountain resort; Agricultural growing seasons should increase, as should their demand for water; New agricultural crops that have been grown in warmer climate zones may be added to the state’s agricultural base; Agricultural pests found in warmer climates could invade Pierce County and attack crops; The increase in forest fires due to dryer summers will increase the cost of firefighting; The lack of a large snowpack will decrease the amount of available water as the summer progresses. This will create a need for more water storage units to handle the increased need in late summer and early fall; CLIMATE CHANGE - PAGE 4-121 REGION 5 ALL HAZARD MITIGATION PLAN – 2020-2025 EDITION BASE PLAN
• • •
Increasing health care costs are expected in the areas of heat related illnesses, such as heat stroke, heat associated illnesses such as asthma, and infectious diseases that are associated with warmer weather like West Nile Virus; With the potential increase in flooding mentioned above there will be increased costs for responding to, and recovering from, these floods; and, The need for more energy efficient solutions to the climate change and global warming issues should increase the options for new business development.
Economic effects will be felt not only as a result to changes in the surface ecosystems, but also to changes in the marine environment. Some fish species that are used to the frequent cold waters of Washington are already close to disappearing, such as Pacific Cod. While overfishing assisted in the decline, scientists point to warmer water as a contributing factor in stifling their recovery.136 The fishing industry has had a difficult time for many years and the declining local species will continue to cause problems for the foreseeable future. However, at the same time that some species are decreasing, others like ocean sunfish, barracuda, sardines, striped bass and lizard fish are beginning to show up in Washington waters.137 In order to survive, the fishing industry may need to change some of the species that sustain it, moving from the traditional northwest species to ones that are moving into the area.
Public Confidence in the Jurisdiction’s Governance As the changes in the local environment accumulate over time the public could begin to demand that any problems that arise be mitigated. It may become difficult convincing citizens to accept the costs, including new taxes associated with mitigating the results, preventing damage through controls on land use, or the difficulty of accepting a change of lifestyle that might be required. Frustration could be expressed against local leaders and government agencies.
CLIMATE CHANGE - PAGE 4-122 REGION 5 ALL HAZARD MITIGATION PLAN – 2020-2025 EDITION BASE PLAN
Meteorological Drought Hazard 4.2M Identification Description Definition A drought is defined as "a period of abnormally dry weather sufficiently prolonged for the lack of water to cause serious hydrologic imbalance in an affected area."138 Unlike most states, Washington has a statutory definition of a drought emergency (Revised Code of Washington Chapter 43.83B.400 and Washington Administrative Code 173-166). According to state law, an area is in a drought condition when: • •
The water supply for the area is below 75 percent of normal. Water uses and users in the area will likely incur undue hardships because of the water shortage.
Drought is a natural part of the climate cycle. However, it can have a widespread impact on the environment and the economy. Both agriculture and certain industries that require a dependable, continuous supply of water can be affected by drought. Since the impacts of drought vary highly depending on the local environment, the type of agriculture and industry, and the type of social systems that have developed in an area, people can have very different ideas about drought. This can lead to a wide range of drought definitions. The two definitions listed above are both useful in their own way but are by no means the only possible definitions.
Types139 Because of the wide range of drought definitions available, ‘drought’ has been grouped into four main categories or types. The first three categories measure drought as a physical phenomenon and the last category measures drought in terms of supply and demand, tracking the effects of water shortfall as it ripples through socioeconomic systems. This process can be seen in Figure 4.7-1 Sequence of Drought Impacts.
Meteorological Drought This type of drought is defined as an expression of precipitation’s departure from normal over some period of time. These definitions are usually region-specific, and presumably based on a thorough understanding of regional climatology. Meteorological measurements are the first indicators of drought.
Agricultural Drought
DROUGHT - PAGE 4-123 REGION 5 ALL HAZARD MITIGATION PLAN – 2020-2025 EDITION BASE PLAN
This type of drought is defined as an occurrence in which there isn’t enough soil moisture to meet the needs of a particular crop at a particular time. Agricultural drought happens after meteorological drought, but before hydrological drought. Agriculture is usually the first economic sector to be affected by drought.
Hydrological Drought This type of drought is defined by the deficiencies in surface and subsurface water supplies. It is measured as stream flow and as lake, reservoir, and groundwater levels. There is a time lag between the lack of rain and decreasing quantities of water in streams, rivers, lakes, and reservoirs, so hydrological measurements are not the earliest indicators of drought. When precipitation is reduced, or deficient, over an extended period of time, this shortage will be reflected in declining surface and subsurface water levels.
Socioeconomic Drought This type of drought is defined as the occurrence when physical water shortage starts to affect people, individually and collectively. In more abstract terms, most socioeconomic definitions of drought associate it with the supply and demand of an economic good such as water, food grains, fish, or hydroelectric power. Figure 4.7-1 Sequence of Drought Impacts1
DROUGHT - PAGE 4-124 REGION 5 ALL HAZARD MITIGATION PLAN – 2020-2025 EDITION BASE PLAN
The severity of a drought is measured by the Palmer Drought Severity Index (PDSI) shown in Table 4.7-1. Developed by meteorologist Wayne Palmer for the Office of Climatology of the Weather Bureau, it combines temperature and rainfall in a formula to determine dryness. It is most effective in determining both long term droughts and wet periods. 0 is considered normal and the scale diverges from there.140 The index determines that an area with a -3.0 to -3.99 rating is in severe drought, while an area with -4.0 is in extreme drought. Table 4.7-1 Palmer Drought Severity Index
3.0 to 3.99 2.0 to 2.99 1.0 to 1.99 0.5 to 0.99 0.49 to -0.49 -0.5 to 0.99 -1.0 to -1.99 -2.0 to -2.99 -3.0 to -3.99 -4.0 or less
Very wet Moderately wet Slightly wet Incipient wet spell Near normal Incipient dry spell Mild drought Moderate drought Severe drought Extreme drought
Profile Location and Extent Drought directly and indirectly affects all of Pierce County. While the entire region experiences drought, specific natural resources are the most impacted. These resources include, but are not limited to rivers, streams, ponds, fish habitat, forests and other natural resources. The impact on resources will vary depending on how each watershed is affected. A watershed that contains a lot of snow late into the summer, will not be affected the same as one that has no snow at all. In Pierce County, the distribution of resources can be tracked by watershed and these are found on Map 4.7-1. The first noticeable indications of drought, besides lack of rain, are the decrease in soil moisture affecting the County’s agricultural base. As time progresses, the effects begin to be felt across the community. Normally available sources of water, like reservoirs and lakes will begin to dry up. Their ability to cover the precipitation deficit can only do so for a limited time. The other option, wells, relies on the amount of ground water and is dependent on the long-term maintenance of the aquifer. Short term drought, from three to six months, usually does not affect these. However, long term drought conditions can affect them, drying up lakes and depressing the water table. With the ending of drought conditions, the recovery will follow the same pattern. First to recover will be the soil water reserves and increases in stream flows. Reservoirs and lakes are next to refill, and finally, as water works its way down, the groundwater can be replenished. While the soil moisture content may rise rapidly following rain, the replenishment of groundwater may take many months or even years depending on the drought’s duration, its intensity and the quantity of new precipitation over time.141 DROUGHT - PAGE 4-125 REGION 5 ALL HAZARD MITIGATION PLAN – 2020-2025 EDITION BASE PLAN
Map 4.7-1 Pierce County Watersheds
DROUGHT - PAGE 4-126 REGION 5 ALL HAZARD MITIGATION PLAN – 2020-2025 EDITION BASE PLAN
Occurrences On average, the nationwide annual impact of drought is greater than the impacts of any other natural hazard. They are estimated to be between $6 billion and $8 billion annually in the United States and occur primarily in the agriculture, transportation, recreation and tourism, forestry, and energy sectors. Social and environmental impacts are also significant, although it is difficult to put a precise cost on these impacts. The National Drought Mitigation Center has compiled drought data for the period from 1895 to 1995 using the Palmer Drought Severity Index (PDSI). According to the data, the Pacific Northwest Basin, an area comprised of the states of Idaho and Washington, most of Oregon, and parts of Montana and Wyoming, has experienced severe to extreme drought multiple times in the last hundred years over a large area, see Figure 4.7-2. Figure 4.7-2 % Area of Basin in Drought Conditions Since 1895142
Portions of the County have experienced severe drought from five to ten percent of the time during the period from 1895 to 1995, see Map 4.7-2. For the decade from 1985 to 1995, the rate appears to have increased. During this period portions of the County had severe drought conditions between 10 and 20 percent of the time, see Map 4.7-3.143
DROUGHT - PAGE 4-127
REGION 5 ALL HAZARD MITIGATION PLAN – 2020-2025 EDITION BASE PLAN
Map 4.7-2 % of Time in Severe to Extreme Drought: 1895-1995
Map 4.7-3 % of Time in Severe to Extreme Drought 1985-1995
DROUGHT - PAGE 4-128
REGION 5 ALL HAZARD MITIGATION PLAN – 2020-2025 EDITION BASE PLAN
Historically, droughts have not usually been considered a problem in the area west of the Cascade Mountain Range. However, Pierce County and other west side communities have felt the effects of drought many times in the past and will continue to do so in the future. Table 4.7-2 catalogues a number of drought periods that have affected the County over the years. Note that several lasted for more than a single season and a few for more than a year. Table 4.7-3 Notable Droughts Affecting Pierce County144
DATE
DESCRIPTION
May 2019
April 17, 2015
November 2004 – Summer 2005
Drought Emergency declared by Governor Inslee that includes half the state. Pierce County’s intensity of drought ranges from abnormally dry to moderate drought. Abnormally dry impacts mean that the ski season is shortened, and visitation is lower. Moderate drought impacts include an increase in fire danger, possible dust storms, and river flow is low.145 Pierce watersheds added to Drought Declaration: Puyallup-White and Cowlitz. The winter of 2004-2005 was the driest winter in recorded history with record low snow packs of only 26% of average and stream flows as low as 22% of average. The drought conditions culminated in a February with no measurable precipitation in many parts of the state. Washington State declared a Drought Emergency on March 10, 2005.146
The second driest winter on record in 106 years and second worst January – March 2001 drought in State History. Stream flows approached the low levels of the 1976-1977 drought. October 1976 – September 1977
April 1934 – March 1937 July – August 1930 June 1928 – March 1929 July 1925 July - August 1921 August 1919 July – August 1902
The worst drought on record. Stream flows averaged between 30% and 70% of normal. Temperatures higher than normal resulted in algae growth and fish kills. Pierce County experienced severe-extreme drought conditions from 10-20 percent of the time. The longest drought in the region’s history with PDSI maintaining values less than -1.147 The driest periods were AprilAugust 1934, September–December 1935, and July-January 1936-37. Drought affected the entire state. Most weather stations averaged 10% or less of normal precipitation. Most stations averaged less than 20% of normal rainfall for August and September and less than 60% for 9 months Drought occurred in Washington State. Drought in all agricultural sections of Washington State. Drought and hot weather occurred in Western Washington. No measurable rainfall in Western Washington.
DROUGHT - PAGE 4-129
REGION 5 ALL HAZARD MITIGATION PLAN – 2020-2025 EDITION BASE PLAN
Recurrence Rate Scientists currently do not know how to predict drought more than a month in advance for most locations. Predicting drought depends on the ability to forecast precipitation and temperature. Anomalies of precipitation and temperature may last from several months to several decades. How long they last is dependent on interactions between the atmosphere and the oceans, soil moisture and land surface processes, topography, internal dynamics, and the accumulated influence of weather systems on the global scale. Based on the State’s history with drought from 1895 to 1995, as shown in Map 4.7-2, the state as a whole can expect severe or extreme drought at least five percent of the time in the future. Table 4.7-2 shows that since the beginning of the 20th Century, there have been ten droughts with major effects on Pierce County. However, only four of those have happened in the past 71 years with gaps of 39 and 24 years. This implies that Western Washington, including Pierce County, can expect severe or extreme drought from five to ten percent of the time. This is too short a period to make a definitive statement as to whether this is a change in frequency or not. So, to conservatively cover the variance, this chapter is defining the drought recurrence rate for Pierce County as being 50 years or less. The future intensity and patterns of drought in Pierce County could be altered due to the expected changes in the global climate. Warming trends that will deliver less snow to the mountainous areas, and threaten the possibility of drier summers could have a dramatic impact on the frequency and intensity of drought in Pierce County. The dwindling of the average annual snowpack will mean there is less available water for agriculture, the environment, citizens, businesses and industry, all leading to more frequent drought conditions. For a further discussion of this, see the Climate Change chapter.
Impacts148 The U.S. Drought Monitor (USDM) uses a five-category system, labeled Abnormally Dry or D0, (a precursor to drought, not actually drought), and Moderate (D1), Severe (D2), Extreme (D3) and Exceptional (D4) Drought. Drought categories show experts' assessments of conditions related to dryness and drought including observations of how much water is available in streams, lakes, and soils compared to usual for the same time of year.149 Depending upon its severity in Pierce County, drought typically does not result in loss of life or damage to property, as do other natural disasters. On the other hand, drought can lead to impacts on agriculture, water supply availability, the public’s health and economic condition (see figure 4.7-3). However, it can be a magnifier of other natural disasters like wildfires or crop diseases.
DROUGHT - PAGE 4-130
REGION 5 ALL HAZARD MITIGATION PLAN – 2020-2025 EDITION BASE PLAN
Figure 4.7-3 National Drought Mitigation Center Drought Impact Reporter Feb. 14-Mar 14. 2015150
Health and Safety of Persons in the Affected Area at the Time of the Incident In Pierce County, based on historical precedent, drought will not by itself cause a decrease in the health and safety of its citizens. Rather damage will be done to the environment, business, agriculture, etc. However, problems frequently associated with drought can influence the health and/or safety of local citizens. These would include: • • • • •
high temperatures leading to heat related injuries including some deaths; mental and physical stress which can lead to a susceptibility to other diseases, such as heart disease; low moisture content in the forest leading to an increase in the number of forest fires threatening homes, citizens and firefighters; conflicts between citizens and government over water usage; and conflicts between citizens over water usage.
Health and Safety of Personnel Responding to the Incident There should be no extra health or safety impacts from drought beyond those for the general public. Individual hazards exacerbated by the drought, such as an increase in wildfires, threaten the health and safety of responders; they are not a direct result of the drought.
Continuity of Operations and Delivery of Services
DROUGHT - PAGE 4-131
REGION 5 ALL HAZARD MITIGATION PLAN – 2020-2025 EDITION BASE PLAN
Drought, on the scale experienced in Pierce County, should not affect the ability of most agencies to continue operations. While services to the public for some operations may have to be cut back, the actual ability of agencies to continue operations in some form should not be compromised. Delivery of services to the public will probably not be considered a problem for most local law enforcement agencies. Any increase in public tension regarding limiting the use of water or caused by layoffs from industry dependent on water should be within the ability of departments to handle. For fire operations, however, impacts would be dependent on two factors, the actual quantity of water available and the dryness of the environment. If the drought is extreme enough and long lasting to the point that fire flow151 is affected then fire departments and districts will not be able to fulfill their mission in relation to fire suppression. Related is the dryness of the environment in general. As the water supply decreases the probability of large-scale fires, wildland, urban, or on the wildland/urban interface become more probable. An increase in the number of fires as well as their size could tax the ability of departments to respond, causing them to rely on mutual aid or going to state mobilization. In either case, their operations will continue, albeit with support from outside agencies and possibly at a reduced level. The ability to maintain service at a level required by the public can be threatened during drought for many utilities. Both electric and water utilities rely on a Map 4.7-4 Columbia River Basin steady supply of water throughout the year. The foundation of northwest electricity is hydroelectric. Without a steady supply of water supplying the dams, utilities will either have to cut back production, possibly causing brownouts, or buy expensive power from other areas that have an excess. Much of this supply originates in the mountain snowpack that normally exists in the Cascades and Olympics, or in the case of the Columbia River, an area incorporating portions of seven states and one Canadian province, see Map 4.74.152 Pierce County’s water purveyors receive their water either from mountain watersheds or wells locally supported by the purveyor. Short term drought has caused limited problems in the past, usually rectified by volunteer water rationing. As the population grows and the demand for water to support that population increases the need for more extreme measures may also increase. Lack of rain will directly affect the aquifers that many of the water purveyors rely on. Changes in the aquifers may require the drilling of new wells. Small water purveyors with wells that run dry
DROUGHT - PAGE 4-132
REGION 5 ALL HAZARD MITIGATION PLAN – 2020-2025 EDITION BASE PLAN
and no intertie with another system may have to temporarily bring in water either by truck or in bottles to supply customers. Lack of rain will also decrease the quantity of water flowing in the Green River, located in southern King County. The City of Tacoma relies on that supply for much of its water needs. While Tacoma also has a number of wells on its system, these could be taxed if the aquifer also begins to drop. The longer a drought continues the stronger its effects will be felt, not only from the Green River watershed, but also from the aquifers that could act as a backup. Eventually the point could be reached where in order to get water to the citizens not only would there be voluntary rationing, but also some mandatory controls implemented with fines for violators. Such controls would also affect industry. Many industrial processes require a quantity of water. To distribute enough water to citizens for health reasons, and critical infrastructure like fire hydrants and hospitals, some industry may have to either reduce or suspend operations.
Property, Facilities, and Infrastructure Drought is a slowly developing problem with little immediate impact on any property, public facilities or the infrastructure. Many built up properties such as buildings, highways, and transmission towers will not be adversely affected by drought in any form. As a drought progresses however, from a short-term inconvenience to a long-term problem, certain portions of the infrastructure will begin to be affected. The lack of water in the reservoirs, streams and rivers will restrict how it can be used. For example, the need to use it for agriculture will conflict with the need to maintain an adequate flow for fish. Confounding the problem will be industries’ need for a continuous supply and of the public for drinking, cooking and bathing water. The decreasing water level in reservoirs used for hydroelectric generation creates two obstacles that limit the output of electricity. First, drought limits the amount of water available for generation. Without water behind the dams, they cannot generate power. Second, the amount of electricity generated depends on the pressure of the water on the turbines or how much head there is behind the intakes to the turbines. So, as the water level behind the dams drops the pressure turning the turbines decreases. The result is that the dams are not getting as much electricity generated per cubic foot of water from a low water level as you would from a highwater level. The water distribution system could also be impacted. Water purveyors may find their normal sources drying up. Water from the Green River, currently used by the City of Tacoma, may no longer be adequate or dependable. As the water table drops, shallow wells distributed throughout the County used mostly by small water purveyors may begin to dry up. Most of these do not have interties with other purveyors. The result could be that they will have to bring in outside resources to assist with getting an adequate supply to citizens.
The Environment The environment that makes Pierce County an enjoyable place to live, work and play has its basis in the rainfall that supports the diverse ecosystems that exist across the County. Based as it is, on an abundance of water, the environment could be the most adversely affected portion of
DROUGHT - PAGE 4-133
REGION 5 ALL HAZARD MITIGATION PLAN – 2020-2025 EDITION BASE PLAN
the County by a drought, especially long-term drought. Impacts on the Pierce County environment include: • • •
a reduction in viable habitat for fish and wildlife, an increase in both plant and animal diseases, and an increase in wildfires.
Habitat Reduction Many of the plants, fish and wildlife native to Pierce County are used to periods of moderate drought which happens irregularly in Western Washington. However severe drought could stress the various environments or individual species within those environments. A decrease in rain and snow will not be uniform across any individual biotic zone and so the effects from a drought will not be universal throughout Pierce County. In some areas they could be much worse than in others. Pierce County resides in the following watersheds: Chambers-Clover, Cowlitz, Kitsap, Nisqually, and Puyallup, see Map 4.7-1. A watershed is a basin-shaped area that drains into a river, lake, or the ocean. It includes freshwater, both ground and surface waters, as well as the saltwater of Puget Sound. A Water Resource Inventory Area (WRIA)153 may include more than one watershed and may overlap into more than one county. All of the WRIAs in Pierce County with the exception of the Chambers Creek have a portion of their watershed located in other counties and homeland security regions. Water Resource Inventory Areas are important for looking at the availability of overall water resources and how a change in precipitation, either as rain or snow, will affect the other resources that depend on it. One of their key areas is looking at the availability of water to maintain fish habitats. The most obvious immediate impact from drought is on fish populations. Drought can have a variety of negative impacts on salmon and other fish populations at several points of their life cycles. Drought can dramatically affect the ability of fish to thrive and reproduce. Streams that lack a continuous source of water tend to dry up leaving only pools for the fish to live in until the next rain brings a new flow of water down the channel. Many fish are sensitive to an increase in water temperature and a low stream flow can allow the water temperature to rise well above normal. According to the Washington Department of Fish and Wildlife: The downstream migration of juvenile salmon in the spring is linked to the surge in stream flows created by runoff from melting snow in the mountains. With mountain snowpacks either well below average or completely gone, there could be some change on out-migration patterns as young fish attempt to reach saltwater to continue their life cycle. Adult salmon can have difficulties reaching upstream spawning grounds if river flows remain below normal. Some salmon species spawn in channel margins, side channels and smaller tributaries. Spawning would have to occur in mainstream waters if those other areas are unavailable
DROUGHT - PAGE 4-134
REGION 5 ALL HAZARD MITIGATION PLAN – 2020-2025 EDITION BASE PLAN
because of low flows. This could make salmon nests, known as redds, and the eggs incubating in them, more susceptible to bed scour during the fall and winter. In other cases, instream flow can drop after the salmon spawn. Salmon nests are then dewatered and the eggs within them are lost. Impacts of drought can result in depressed salmons runs three to five years later, when those fish would be returning as adults. Warmer-than-normal stream temperatures and low dissolved-oxygen levels in isolated pools can lead to fish deaths both in wild populations and at fish hatcheries154. Just as reduced water levels affect wild spawners, reduced water supply can lead to warmer water temperatures and thus result in increased fish disease, treatment costs and fish mortality. Some of the likely causes of problems are fungal and bacterial diseases, which can kill fish or lead to fewer fish eggs. Many of our hatcheries depend on a clean and consistent source of water. So, during a drought, hatcheries can be at risk because of lack of water of sufficient quality and quantity to rear fish. The Washington Department of Fish and Wildlife (WDFW) sometimes might be required to pump water from wells, which adds significant costs to operations155 However, it must also be pointed out that while drought may be detrimental to some species, it may not be detrimental to all. “During droughts, the in-stream habitat conditions can actually be favorable for some fish species, such as certain minnows and darters, as well as fry and fingerlings of larger species. Drought conditions allow these fish to compete with other fish, such as larger predators, which may be favored at higher flows. The result is a more robust and diverse fish community.”156 The impact on wildlife can also be dramatic and can vary considerably across the County. With topography ranging from sea level to over 14,000 feet there is a wide range of plants and animals that inhabit different areas. The United States Department of Agriculture (USDA) has developed climate zones (also called hardiness zones) based on temperature for the entire United States. These zones are based on the mean of the lowest temperature recorded each year. Pierce County is divided into various climate zones; see Map 4.7-5 USDA Climate Zones. Since these zones are based on temperature, other factors need to be taken into account when looking at the effects of drought on the County. Eastern Pierce County, as can be seen from the USDA Climate Zones map, has a very different range of temperatures from western Pierce County. Temperatures are cooler and because of the rise in elevation precipitation is much higher. This creates a different series of zones called life, or biotic zones. These zones are not just related to temperature, but include precipitation, are very variable, contain different animal and plant species and generally are located at different elevations. A number of different categorizations of life zones have been utilized or defined over the years. Some more detailed and others simpler. The one shown here has been in use for over 50 years and is a variation of one first developed in the late 1800s. DROUGHT - PAGE 4-135
REGION 5 ALL HAZARD MITIGATION PLAN – 2020-2025 EDITION BASE PLAN
Map 4.7-5 USDA Climate Zones – Washington State157
Pierce County has four of the seven Washington State biotic zones established within it.158 Listed from lowest elevation to highest elevation, these include: •
Coast Forest Zone - This zone encompasses the lowlands of Pierce County up to the foothills of the Cascades and climbing their lower slopes.
•
Mountain Forest Zone - This zone is also called the Canadian Zone. It includes the evergreen forests that range up to approximately 5,000 feet in elevation.
•
Sub-Alpine Zone - This zone includes the species that exist near tree line and ranges from 5,000 to 7,000 feet in elevation.
•
Alpine Zone - This zone includes all terrain above timberline. Most of this is located on Mt. Rainier; however, there is a portion of it lying along the highest portions of the Cascade crest.
The marine climate associated with these zones provides the moisture to maintain them. Within the different zones the various species of plants and animals are more or less tolerant of drought conditions. Animals that have an association with water resources, like amphibians (frogs, salamanders, etc.), ducks, geese, herons, and many others, will find their habitats drying up and will not have their normal food source available. Waterfowl and other birds have the ability to move elsewhere, however many smaller non-flying species do not. They in turn may attempt to migrate. While some may be successful others will not. Deer and elk will find their normal food sources decreasing and may have to change their normal migration patterns. Voles, mice and others will find their populations decreasing, a situation that can put stress on the predators that rely on them. As water sources dry up animals will tend to DROUGHT - PAGE 4-136
REGION 5 ALL HAZARD MITIGATION PLAN – 2020-2025 EDITION BASE PLAN
congregate near water sources that are still viable. This concentration leaves many of them vulnerable to predators also congregating at the water source. The result of extended drought in particular, is a total change in the distribution of the flora and fauna that currently inhabit Pierce County. This can push many species into conflict with people as they leave their normal habitats and migrate into more populated areas. The change in habitat limiting food and water can push some marginal species into localized decline or even eliminate them from the local environment decreasing the biodiversity. Plant and Animal Disease Maritime forests, like we have in Western Washington, in drought conditions tend to become stressed. Initial effects will be to the tree root system. Lack of water in the top 12-18 inches of the soil will begin to dry up and kill the root hairs that normally take up water. This causes a water deficit in the tree. Trees stressed like this are unable to grow properly, begin to lose their resistance to disease and also become susceptible to attacks by insects.159 This can lead to wide areas having diseased or dead trees all of which can increase the potential for wildfire. Research into the effects of drought on local environments shows that it can alter the effects of other disasters. A recent example is the loss of wetlands due to drought along the Gulf Coast. The weakening and killing of marsh grass by drought allowed periwinkle snails to further destroy the wetlands. This loss of coastal wetlands exacerbated the destructive tendencies of Hurricane Katrina. “It’s important to note that drought was the trigger that initiated these events – and because drought stress is becoming more extreme with global warming, events like this could become both more frequent and intense,”160 In drought conditions, the lack of water and food supply will put extra stress on wildlife. Because of this stress, the combination of dehydration, hunger and in some cases heat, many animals may become susceptible to disease.161 Wildfire The heavy forest growth, and resulting duff, existing on the west side of the Cascades has the potential during prolonged drought of creating conditions conducive to wildfires. Once started, the steep terrain combined with the heavy load of fuel can make these fires hard to put out. As with a wildfire in any part of the state, a large-scale wildfire within Pierce County could leave a lasting impression on the local environment that may not rebound for years if not decades or longer. Animal and fish habitat would be destroyed. The loss of the forest canopy would eliminate the shade needed for many species of both plant and animals. Streams would be polluted with burnt material and there would be an increase in erosion leading to silt deposits that could destroy fish habitat. In contrast, it must be understood that while fire is destructive, it opens up new environmental opportunities. Forests go through a cycle of growth, decay and destruction. Fire is a natural part of the forest ecology. Previous attempts to eliminate all fires proved counterproductive for a healthy environment. Burning the understory in many cases increases the health of a mature DROUGHT - PAGE 4-137
REGION 5 ALL HAZARD MITIGATION PLAN – 2020-2025 EDITION BASE PLAN
forest. The newly burnt landscape would allow the introduction of other species, tolerant of the open spaces and increased sunshine. Many plants are intolerant of the deep shade that exists in the heavily forested areas. These newly burned areas allow them an opportunity to thrive. With them will come animals that thrive on those particular plants. The result is a new ecological niche will have been created. Summary The impact of drought on the environment and County will follow a sequence of events. These begin with relatively minor inconveniences and as time progresses can get much worse leading to major environmental degradation. This can eventually lead either directly or as a result of fire to major changes in the local ecosystems that exist within Pierce County.
Economic and Financial Condition Drought will impact the agricultural and industrial bases as well as the population in Pierce County. Most previous periods of drought have been, at their worst, an inconvenience. However, a prolonged severe drought could impact the agricultural and industrial basis of the local economy. Economic impacts become apparent as we move from a strictly meteorological drought to an agricultural drought. Crops are damaged due to lack of water. These crops are highly variable in Pierce County, ranging from the rhubarb farms near the City of Sumner to the forests supporting our logging industry. As crops are damaged, farmers lose money, and the citizens who rely on these crops, either for jobs or part of their regular diet begin to feel the effects. Damaged crops and closed national forests mean that processors, including canneries and lumber mills, shippers and their staff who move agricultural products, as well as retailers, begin to lose business. Layoffs can begin leading to financial and mental, stress on individuals and families. Damaged crops may lead to a decrease in food quality as well quantity causing more food importation. This results in higher costs for the distributors and therefore higher food prices for consumers. Pierce County industries that rely on a large supply of water for manufacturing goods could have a similar predicament in that as supplies of water dwindle they may have to cut back some processes and also lay off workers with consequences down the chain of distribution. A lack of water in the rivers and streams will result in lower levels behind dams used for hydroelectric power generation. Power bought from other sources will be more costly than that locally generated. These costs will eventually be passed on to the consumer. Recreation will also be affected. As a drought intensifies, recreation resources will be closed to the public. Dry conditions creating fire danger will limit the use of National Forest and both State and National Park lands. Communities acting as entry points to the recreation areas would be affected by the National Forest and Park closures. As lakes dry up and the flow in rivers and streams decrease, water recreation will also diminish. Boat ramps and docks may be high and dry. Recreational fishing could be curtailed.
DROUGHT - PAGE 4-138
REGION 5 ALL HAZARD MITIGATION PLAN – 2020-2025 EDITION BASE PLAN
Public Confidence in the Jurisdiction’s Governance Public dissatisfaction with government regarding drought response can erode confidence in local governments. This is especially true if a portion of the public feels that it is being denied a legitimate share of the water available. Required rationing, while necessary, must be scrupulously carried out to ensure that no bias is felt by others, especially the low- or middleincome portions of the population. If this is not done, it can lead to a lack of confidence in either local utilities or local government or both. Eventually this can lead to unrest.
DROUGHT - PAGE 4-139
REGION 5 ALL HAZARD MITIGATION PLAN – 2020-2025 EDITION BASE PLAN
(This page intentionally left blank)
DROUGHT - PAGE 4-140
REGION 5 ALL HAZARD MITIGATION PLAN – 2020-2025 EDITION BASE PLAN
Meteorological Flood Hazard 4.3M Identification Description A flood is a general and temporary condition of partial or complete inundation of normally dry land areas. Floods can damage low lying property indiscriminately, but to mitigate for future events, it is necessary to understand the source of flooding. Pierce County recognizes four primary flood sources: riverine, coastal, groundwater and urban. Riverine and coastal flooding bring an added risk of erosion that can damage structures and transportation corridors that are above the base flood elevation.
Types Riverine hazards are when flood waters overtop the channel bank and extend into the floodplain. This behavior occurs on major rivers to small streams. Our interest in this section will be to describe the major river reaches in the county that have the capacity to do the most harm. This is not to discount that smaller creeks can still cause significant damage to a property. Riverine flooding presents life safety challenges where deep and or fast flowing water can sweep away people and cars. Erosive forces and dynamic sediment loads can also cause the river to migrate to new locations that may have been high ground but are occupied by the river following a highwater event. For these reasons Pierce County regulates areas of deep and fast flowing water and areas at severe risk of channel migration as a floodway to limit future development. Areas behind a levee present a unique situation where residents may feel protected from a flood since their low-lying property doesn’t flood as frequently as it did prior to levee construction. Levees can fail for many reasons (over-topping, breaching, sloughing, flanking, etc.) creating a situation where warning times are shorter and evacuation routes become uncertain for the resident who is suddenly at risk.
Profile Location The geographic scope includes the floodplains of the two major river systems in Pierce County (Puyallup and Nisqually Rivers). The Puyallup River and Nisqually River watersheds include forests, national parks, and wilderness areas in the upper watersheds; rural and agricultural uses in the mid to lower basin areas; and urban areas dispersed throughout the lower Puyallup watershed near the river mouth. To capture the full impact of the Pierce County river systems, this section has been divided into 11 planning areas: •
Puyallup River o Lower Puyallup River o Middle Puyallup River FLOOD – PAGE 4-141 REGION 5 ALL HAZARD MITIGATION PLAN – 2020-2025 EDITION BASE PLAN
•
• • • •
o Upper Puyallup River White River o Lower White River o Upper White River o Greenwater River Carbon River o South Prairie Creek Middle Nisqually River Upper Nisqually River Mashel River
Puyallup River The Puyallup River and its two main tributaries, the White River and Carbon River, drain a watershed of approximately 1,040 square miles and flow from the glaciers of Mount Rainier with an elevation of 14,410 feet to Commencement Bay and Puget Sound. The Puyallup River runs through the cities of Tacoma, Fife, Puyallup, Sumner, and Orting, and large areas of unincorporated Pierce County. The Puyallup Tribe of Indians owns the river bed within the 1873 survey area from approximately River Mile (RM) 1.4 to RM 7.2. The lower reaches of the Puyallup River were historically straightened with levees and revetments for flood control purposes. Mud Mountain Dam (MMD) on the White River at RM 29.6 provides storage of up to 106,000 acre-feet of water to reduce flooding on the lower Puyallup River and to a lesser extent the lower White River. The dam was authorized by Congress after the 1933 flood of record and was completed in 1948 after an extended work stoppage for WWII.
Lower Puyallup River The lower Puyallup River begins at its mouth in Commencement Bay at RM 0.00 and continues upstream to its confluence with the White River at RM 10.3. It flows through the cities of Sumner, Puyallup, Fife, and Tacoma and portions of unincorporated Pierce County. The Puyallup Tribe of Indians owns the riverbed, below the mean high-water line, within the 1873 survey area from approximately RM 1.4 to RM 7.2. The lower Puyallup River is primarily straight with levees on both the right bank, North Levee Road, and left bank, River Road. Surrounding land uses are mostly urban in the cities and a mixture of agricultural, rural, and urban in unincorporated Pierce County.
FLOOD – PAGE 4-142 REGION 5 ALL HAZARD MITIGATION PLAN – 2020-2025 EDITION BASE PLAN
FLOOD – PAGE 4-143 REGION 5 ALL HAZARD MITIGATION PLAN – 2020-2025 EDITION BASE PLAN
Puyallup River Extent and Occurrences Major flooding occurred in the lower Puyallup River in 1917, 1933, 1965, 1977, 1986, 1990, 1996, 2006, and 2009. The largest flood on record since construction of MMD occurred in January 2009, with a flow of 48,200 cubic feet per second (cfs), approximately a 100-year event, in the lower Puyallup River based on current flood frequency flow estimates (FEMA/NHC 2003). Flows in excess of 45,000 cfs are considered severe with significant flooding expected. Moderate flooding occurred in the lower Puyallup in November 2014, and again in October, November, and December 2015. Historical Flooding in Lower Puyallup River USGS 12101500 Puyallup River at Puyallup, WA 103 Records from 1914 - 2017 Water Year
Date
Stream Flow (cfs)
1934
December 10, 1933
57,000
2009
January 8, 2009
48,200*
1996
February 9. 1996
46,700*
1990
January 9, 1990
44,800*
1987
November 24, 1986
43,800*
1991
November 24, 1990
41,900*
1965
January 29, 1965
41,500*
1978
December 2, 1977
40,600*
1918
December 18, 1917
40,500
2016
December 9, 2015
39,800*
2007
November 7, 2006
39,700*
1935
October 25, 1934
39,500
1933
November 13, 1932
37,800
1956
December 12, 1955
37,600*
1984
January 25, 1984
37,100* *Post Mud Mountain Dam
Probability of Future Hazards In 2003 FEMA’s study, contractor Northwest Hydraulic Consultants (NHC) calculated peak flows that would be utilized for updating the FEMA flood insurance study and flood insurance rate maps. For the Puyallup River at the U.S. Geological Survey (USGS) gauge at Puyallup (12101500), the calculations for the 10-year, 50-year, 100-year and 500-year recurrence intervals are shown to be respectively: 41,000, 46,000, 48,000 and 63,000 cfs. With the thresholds for FLOOD – PAGE 4-144 REGION 5 ALL HAZARD MITIGATION PLAN – 2020-2025 EDITION BASE PLAN
moderate flooding (30,000-45,000 cfs) and severe flooding (greater than 45,000), the Lower Puyallup River valley can expect to experience moderate flooding every two to ten years and severe flooding every ten to 25 years over a long-term period (Risk Assessment, URS 2012). The Pierce County Climate Resiliency Plan anticipates that flood risks will increase with more extreme precipitation events and more of the precipitation falling as rain being captured in the upper watershed as snow. Sediment loading is expected to increase from rivers coming off Mount Rainier thereby decreasing flood carrying capacity and increasing the risk of channel migration.
Puyallup River Impacts Impact on Community Commercial and industrial properties comprise approximately 24 percent of the land use in the 100-year floodplain in the Lower Puyallup River Valley (URS 2012). A major flood event would result in the temporary loss of business for properties in this area. Short-term output, income, employment, and tax revenues may also decrease. If businesses were to close due to the financial effects of flooding, economic activity would be slow to recover, and long-term economic impacts would be experienced. Major businesses in this area include the Costco Wholesale warehouse, several large banks, and several large sporting goods warehouses. In addition, there are several storage facilities and a recycling distribution center in this area (URS 2012).
Land Purchases Since 2013, eighteen properties have been purchased totaling 61 acres. This brings the number of acquired acres in the Clear Creek area to an estimated 117 acres. Prior to 2013, twenty-one parcels totaling 16.24 acres were purchased by Pierce County in the lower Puyallup area. Many of the properties experienced repetitive flooding as a result of the backwatering of Clear Creek. The backwatering is caused by the closing of the flood gate at the mouth of the creek preventing the creek from draining into the Puyallup River. The flood gates are necessary to prevent the further rise of flood waters in the creek from the elevated flows of the Puyallup River.
River Management The lower Puyallup River is confined by nearly continuous levees and revetments from the river mouth at Commencement Bay to the Puyallup River’s confluence with the White River at RM 10.3. By restraining floodwaters from inundating the adjacent floodplain area, which includes residential, commercial, industrial, and port facilities within the cities of Tacoma, Fife, Puyallup, and Sumner, these flood risk reduction facilities collectively protect the highest land and improvement values in Pierce County. Substantial damage to these flood risk reduction facilities has the highest consequence and risk on the Puyallup River system. The taxable assessed value of property and improvements in the floodplain in the lower Puyallup is estimated at $1.8 billion (Entrix, Inc., 2010). The levees along the Puyallup River from RM 3.0 to 10.3 are owned and operated by Pierce County are summarized below.
FLOOD – PAGE 4-145 REGION 5 ALL HAZARD MITIGATION PLAN – 2020-2025 EDITION BASE PLAN
Levees and Revetments in the Lower Puyallup River Name
Location
Ownership
Port of Tacoma Revetment
RM 0.0 – RM 0.7
Port of Tacoma
COE Port of Tacoma Levee
RM 0.7 – RM 3.0
US Army Corps of Engineers
North Levee Road Levee
RM 3.0 – RM 8.1, PL 84-99
Pierce County
Murphy Levee
RM 8.1 – RM 8.6
Pierce County
Benston/Boatman Levee
RM 8.6 – RM 9.7
Pierce County
Old Cannery Levee
RM 9.7 – RM 10.3, PL 84-99
Pierce County
Simpson Revetment
RM 0.0 – RM 0.7
Simpson Tacoma Kraft Company
COE Portland Ave Levee
RM 0.7 – RM 2.8
US Army Corps of Engineers
River Road Levee
RM 2.8 – RM 7.4, PL 84-99
Pierce County
Tiffany’s Revetment
RM 7.4 – RM 8.6
Pierce County
Linden/Flashcube Revetment
RM 8.6 – 10.7
Pierce County
Right Bank
Left Bank
Damage to Facilities Flood damage to Lower Puyallup River flood risk reduction facilities have generally been mild over the past three decades. However, two substantial repairs have been made to repair damages due to erosion and one repair to fix fractured concrete panels. Damages from major floods and high-water events between 1990 – 2017 have resulted in approximately 24 identified damage locations comprising 0.6 mile of levees and revetments. Damages have been estimated at nearly $2.15 million dollars (based on 2017 dollars). The table listed below summarizes recorded levee and revetment damages. No significant flood damage is currently apparent along the lower Puyallup River reach. There are isolated locations along the reach where repairs have occurred. The system is approximately 100 years old and showing signs of its age. Pierce County maintenance crews annually inspect and monitor the reach and implement repairs when necessary. Summary of Damages to Lower Puyallup River Facilities (1996-2017) Storm Season
Segment Name
Bank
River Mile (RM)
Damage Lineal Feet
Damage
Tiffany's
Left
9.2
100
Toe and slope failure.
River Road
Left
7.2
540
Concrete panel repair.
1996 1996
2005 2005
FLOOD – PAGE 4-146 REGION 5 ALL HAZARD MITIGATION PLAN – 2020-2025 EDITION BASE PLAN
Summary of Damages to Lower Puyallup River Facilities (1996-2017) Storm Season
Segment Name
Bank
River Mile (RM)
Damage Lineal Feet
Damage
North Levee Road
Right
5.3
190
Silt bench repair – Dolos.
Benston/Boatman
Right
9.35
100
Moderate slumping.
2009 2009
2010 2010
Benston/Boatman
Right
9.35
200
Moderate slumping, major erosion; concrete panels collapsed.
2011
Benston/Boatman
Right
9.35
200
Four-foot deep slump. Exposed concrete at toe.
2011
Murphy
Right
8.47 8.54
390
Scour and minor cracking in silt bench. Scour five feet in areas.
2011
North Levee Road
Right
4.27
105
Four-foot slump.
2011
North Levee Road
Right
4.45
106
Sha Dadx Seepage Control Buttress and drainage.
2011
Old Cannery
Right
10.3
60
Toe rock failure.
2011
River Road
Left
6.4
30
Six-foot deep scour.
2012
Murphy
Right
8.5
200
Toe and rock failure, some slump and erosion.
2012
Murphy
Right
8.55
30
Scour pocket out of face, downed tree.
2012
North Levee Road
Right
4.3
30
Four-foot slump.
2012
North Levee Road
Right
4.45
180
Sha Dadx: soil buttress - sand boils.
2012
North Levee Road
Right
5.8
100
Melroy Bridge partial scour/slumping.
2012
River Road
Left
3.05
40
Cave dug into silt on LB, 5' scour depth.
2012
River Road
Left
6.4
30
Six-foot deep scour in silt bench due to culvert outfall.
River Road
Left
7.45
45
Toe and face rock failure.
Benston/Boatman
Right
9.35
150
Slump in revetment. Concrete Panel missing.
2017
Benston/Boatman
Right
9.35
200
Storm drainage outlet onto revetment face has caused severe scour to occur and end segments of the outlet pipe have failed.
2017
Benston/Boatman
Right
9.3
140
Potential scour.
2017
Murphy
Right
8.4
120
Silt bench scour.
2017
Murphy
Right
8.41
25
Scour.
2010
2011
2012
2014 2014
2015 2015
2017
FLOOD – PAGE 4-147 REGION 5 ALL HAZARD MITIGATION PLAN – 2020-2025 EDITION BASE PLAN
Middle Puyallup River The middle Puyallup River reach begins at the confluence of the White River at RM 10.3 and continues upstream to the confluence with the Carbon River at RM 17.4, downstream of the City of Orting. Approximately 438 square miles drains to the middle Puyallup River. Throughout this reach, the river channel is a combination of large meander bends with segments which are straightened and confined by a combination of levees, revetments, and valley walls. The surrounding watershed and land use are mostly urban near the White River confluence in the cities of Sumner and Puyallup, while predominantly agricultural and rural residential through the Alderton-McMillan communities, and upstream to the Carbon River confluence (GeoEngineers 2003). Several tributaries enter the middle Puyallup River in this reach including Alderton Creek, Van Ogles Creek, Fennel Creek, Ball Creek, and Canyon Falls Creek. The largest tributary, Fennel Creek, drains most of the eastern upland plateau, including much of the City of Bonney Lake. Fennel Creek flows into the Puyallup River near RM 15.2. Salmon and trout, including Chinook, coho, pink, chum, sockeye, steelhead salmon, and cutthroat and bull trout use the entire reach of the middle Puyallup River.
FLOOD – PAGE 4-148 REGION 5 ALL HAZARD MITIGATION PLAN – 2020-2025 EDITION BASE PLAN
FLOOD – PAGE 4-149 REGION 5 ALL HAZARD MITIGATION PLAN – 2020-2025 EDITION BASE PLAN
Middle Puyallup River Extent and Occurrences The middle Puyallup River experienced major flood events most recently in 1996, 2006, 2008, and 2009. The highest peak flow recorded at the Alderton Gauge occurred on January 7, 2009 with 53,600 cfs (based on the USGS calculation). However, this is thought to be an overestimate, because it is higher than the peak flow measured downstream at the Puyallup gauge in the lower Puyallup River. The Alderton gauge results historically have a lower confidence during high flood stage events. Since 2013, there has been no flooding in the Middle Puyallup. Historical Major Flooding on the Middle Puyallup River USGS 12096500 Puyallup River at Alderton, WA 48 Records From 1915 - 2017 Water Year
Date
Stream Flow (cfs)
2009
January 7, 2009
41,600
1996
February 9, 1996
41,500
2007
November 7, 2006
40,300
2016
December 9, 2015
35,800
2015
November 25, 2014
30,700
2000
November 25, 1999
24,800
1956
December 12, 1955
23,300
2005
January 19, 2005
23,300
1947
December 11, 1946
22,600
1954
December 9, 1953
21,900
2003
January 31, 2003
21,000
1922
December 12, 1921
20,000
2011
January 16, 2011
19,900
Probability of Future Hazards In 2003, FEMA’s study contractor NHC calculated peak flows that would be utilized for updating the FEMA flood insurance study and flood insurance rate maps. For the Middle Puyallup River at the USGS gauge at Alderton (12096500) the calculations for the 10-year, 50year, 100-year and 500-year recurrence intervals are shown to be respectively: 27,500, 38,600, 43,500 and 55,100 cfs. Based on the NHC study and historical flow record, the Middle Puyallup River valley can expect to experience moderate flooding every two to five years, and severe flooding every ten to 25 years, over a long-term period (URS 2012). Generally, flooding occurs during late fall into early spring, particularly between the months of November and February. The Pierce County Climate Resiliency Plan anticipates that flood risks will increase with more extreme precipitation events and more of the precipitation falling as rain being captured in the upper watershed as snow. Sediment loading is expected to increase from rivers coming off Mount Rainier, thereby decreasing flood carrying capacity and increasing the risk of channel migration.
FLOOD – PAGE 4-150 REGION 5 ALL HAZARD MITIGATION PLAN – 2020-2025 EDITION BASE PLAN
Middle Puyallup River Impacts Impact on Community Commercial and industrial properties do not comprise a large portion of the Middle Puyallup (less than 1 percent) (URS 2012). Therefore, a large flood event would not result in a major impact to the economy and tax base in this area. Due to the large presence of vacant lands, open space, and resource land, temporary loss of business in this area is likely to be low. However, lands used for recreation or resource land may experience some economic loss if these areas are unable to be accessed or used during the flood or during the recovery period following a flood (URS 2012).
Land Purchases The following land and home acquisitions have occurred since 1991, using a combination of federal and state grant funds and local match. • • • • • •
Acquisition of home and property between 128th Street and the confluence with the Carbon River (48 acres). Acquisition of home and property between (RM 15.9 - RM 16.7) 116th Street and 128th Street (50 acres). Acquisition of homes and property near Fennel Creek confluence (44 acres). Acquisition of homes and property in the area of 96th Street and McCutcheon Road between RM 13.8 – RM 15.0 (78 acres). Acquisition of homes and property near Riverside Drive (1.8 acres). Acquisition of homes and property near/in the City of Sumner (11 acres).
In 2015, one additional property near Riverside Drive was purchased for flood damage mitigation. This parcel was an estimated .75 acre.
River Management The middle Puyallup River levees and revetments form nearly continuous bank protection from the confluence with the White River at RM 10.3 to the confluence with the Carbon River at RM 17.4. Many levees within the middle Puyallup River system are included in the U.S. Army Corps of Engineers, Public Law (PL) 84-99 Levee Rehabilitation program. Revetment structures make up a significant number of the river management facilities that are ineligible for inclusion in the PL 84-99 program. The below table contains a list of river management facilities and their ownership.
FLOOD – PAGE 4-151 REGION 5 ALL HAZARD MITIGATION PLAN – 2020-2025 EDITION BASE PLAN
Levees and Revetments in the Middle Puyallup River Name
Location a
Ownership
Traffic Avenue Revetment
RM 10.3 – RM 11.0
Pierce County
River Grove Levee
RM 11.0 – RM 11.45, PL 84-99
Pierce County
Riverwalk Revetment
RM 11.45 – RM 12.0
Pierce County
Riverside Levee
RM 12.0 – RM 12.8, PL 84-99
Pierce County
Van Ogle Revetment
RM 12.8 – RM 14.2
Pierce County
Evanger/White Revetment
RM 14.2 – RM 15.0
Pierce County
Fennel Creek Revetment
RM 15.15 – RM 15.9
Pierce County
Mosby Revetment
RM 15.9 – RM 16.65
Private
Dollar Creek
RM 16.65 – RM 16.9
Pierce County
Lindsay Levee
RM 16.9 – Carbon RM 1.2
Pierce County
Knutson Revetment
RM 10.7 – RM 12.0
Pierce County
WAZZU Revetment
RM 12.0 – RM 12.8
Pierce County
Bowman/Hilton Levee
RM 12.8 – RM 13.6, PL 84- 99
Pierce County
Sportsman Levee
RM 13.6 – RM 14.4, PL 84-99
Pierce County
Ball Creek Revetment
RM 14.4 – RM 15.7
Pierce County
McMillin Levee
RM 15.7 - RM 16.65, PL 84-99
Pierce County
Bowen/Parker Levee
RM 16.65 – RM 17.5, PL 84-99
Pierce County
Right Bank
Left Bank
Damage to Facilities Flood damages to middle Puyallup River flood risk reduction facilities range from mild to moderate in the past three decades. Damages sustained generally range from partial washout of the flood risk reduction structure over a few hundred lineal feet to localized moderate scour and erosion. Damages from major floods and high-water events between 1995 – 2017 have resulted in approximately 91 identified damage locations comprising 3.6 mile of levees and revetments. Damages have been estimated at nearly $7.37 million (based on 2017 dollars). The middle portion of the Middle Puyallup River reach between RM 12.2 and RM 14.2 has historically been most vulnerable to repetitive damages requiring repair actions to restore the structures. Since 2013, levees and revetments that have experienced repetitive damages include WAZZU, Bowman-Hilton, Van Ogles, and Sportsman. The table listed below summarizes recorded levee and revetment damages to middle Puyallup River facilitates (1995 – 2017).
FLOOD – PAGE 4-152 REGION 5 ALL HAZARD MITIGATION PLAN – 2020-2025 EDITION BASE PLAN
Summary of Damage to Facilities in the Middle Puyallup 1995 - 2017 Storm Season
Bank
River Mile (RM)
Damage Lineal Feet
Damage
Segment Name
1995 1995
Bowen/Parker
Left
16.8
50
Toe/slope failure.
1995
Bowman-Hilton
Left
13.2
150
Partial Washout. Toe and face rock.
1995
Bowman-Hilton
Left
13.2
600
Toe/slope failure.
1995
Mosby - Historic
Right
16.0
400
Toe/slope failure with spots of total failure.
1995
Mosby - Historic
Right
16.2
250
Partial Washout. Toe and face rock.
1995
Riverside Revetment
Right
12.8
600
Some Toe/slope failure.
1995
Van Ogle Revetment
Right
13.4
225
Partial washout. Toe and face rock.
1996
Bowen/Parker
Left
16.7
100
Total failure.
1996
Bowen/Parker
Left
16.8
200
Toe/slope failure.
1996
Bowen/Parker
Left
17.4
100
Toe/slope failure.
1996
Bowman-Hilton
Left
13.2
500
Toe/slope failure.
1996
Dollar Creek
Right
16.8
800
Toe/slope failure.
1996
McMillin
Left
16.0
600
Toe/slope failure with spots of total failure.
1996
McMillin
Left
16.2
250
Toe/slope failure with spots of total failure.
1996
Mosby - Historic
Right
16.0
400
Toe/slope failure.
1996
Riverside Revetment
Right
12.8
600
Toe/slope failure.
1996
Sportsman
Left
14.2
100
Slope failure.
1996
Wazzu Revetment
Left
12.2
600
Toe/slope failure.
Van Ogle Revetment
Right
13.0
50
Toe and face repair.
Riverside
Right
12.7
100
Partial washout of the toe and levee facing.
Evanger/White
Right
14.2
450
Repair/replace toe and face rock.
2006
Bowen/Parker
Left
17.3
220
Face erosion.
2006
Bowman-Hilton
Left
13.2
500
Fracture: scour.
2006
Evanger/White
Right
15.0
300
Face erosion.
2006
River Grove
Right
11.0 11.5
0
2006
Sportsman
Left
13.6
40
Fracture.
2006
Sportsman
Left
14.0
300
Washout.
1996
2002 2002
2004 2004
2005 2005
2006
Overtopping with minor levee damage.
FLOOD – PAGE 4-153 REGION 5 ALL HAZARD MITIGATION PLAN – 2020-2025 EDITION BASE PLAN
Summary of Damage to Facilities in the Middle Puyallup 1995 - 2017 Bank
River Mile (RM)
Damage Lineal Feet
Damage
Wazzu Revetment
Left
12.2
300
Face erosion.
2007
Bowman-Hilton
Left
13.2
880
Repair scour from levee being overtopped.
2007
McMillin
Left
16.3
50
2008
128th & McCutcheon
Right
16.7
12
Top of levee/access road scour.
2008
Bowen/Parker
Left
16.8
75
Toe rock failure.
2008
Bowen/Parker
Left
16.81
50
Toe rock failure and partial face rock failure.
2008
Bowman-Hilton
Left
13.2
60
Minor top coat damage.
2008
McMillin
Left
15.7
30
Damaged toe and face rock.
2008
McMillin
Left
16.1 16.2
30
Toe and face rock failure.
2008
Riverside
Right
12.0
30
Damaged toe and face rock.
2008
Riverside
Right
12.4
236
Damaged toe and face rock.
2008
Riverside
Right
12.7
5
Minor top coat damage.
2008
Sportsman
Left
13.75
0
Blocked culvert.
2008
Van Ogle Revetment
Right
13.5
30
Damaged face rock.
2008
Wazzu Revetment
Left
12.2
148
Wazzu partial washout.
2009
128th & McCutcheon
Right
16.75
20
Toe and face rock failure.
2009
Bowen/Parker
Left
16.7
12
Top of levee/access road scour. Tide gate damaged.
2009
Bowen/Parker
Left
16.7
300
Access road scour, face rock failure.
2009
Bowen/Parker
Left
16.8
75
Toe rock failure.
2009
Bowman-Hilton
Left
13.2
200
Scour 200 LF facing rock failure.
2009
Bowman-Hilton
Left
13.3
50
Scour 1/2 feet deep for 50 LF.
2009
Evanger/White
Right
15.0
200
Total levee failure/ end of levee.
2009
McMillin
Left
16.1 16.2
60
Toe and face rock failure.
2009
River Grove
Right
11.0 11.5
0
2009
Riverside
Right
12.6
15
2009
Sportsman
Left
13.75
200
Blocked culvert.
2009
Sportsman
Left
13.9
250
Damaged toe and face rock.
2009
Sportsman
Left
14.00
300
Major scour.
2009
Sportsman
Left
14.10
150
Head cutting on back side of levee.
Storm Season
Segment Name
2006
2007
2008
2009
Overtopping with minor levee damage. Scour over top of revetment. 1-2 feet
FLOOD – PAGE 4-154 REGION 5 ALL HAZARD MITIGATION PLAN – 2020-2025 EDITION BASE PLAN
Summary of Damage to Facilities in the Middle Puyallup 1995 - 2017 Bank
River Mile (RM)
Damage Lineal Feet
Damage
Wazzu Revetment
Left
12.2
65
Partial washout.
2010
Riverside Revetment
Right
12.8
50
Minor face rock slippage and possible toe rock misplaced.
2010
Sportsman
Left
14.05 14.17
650
Slump and scour near Sportsman Club.
2010
Sportsman
Left
14.05 14.17
650
Slump and scour near Sportsman Club.
2010
Van Ogle Revetment
Right
13.65
100
Slump in front of Knobloch residence.
2010
Van Ogle Revetment
Right
14.14
120
Toe rock and face rock failure.
2011
128th & McCutcheon
Right
16.8
440
Major scallop scour missing levee.
2011
Evanger/White
Right
14.2
75
Toe rock failure.
2011
Evanger/White
Right
14.9
200
Toe and face rock failure.
2011
Fennel Creek
Right
15.4
45
6 ft deep scour.
2011
River Grove
Right
11.42
50
3 ft slump.
2011
River Walk Revetment
Right
11.9
60
Minor toe scour.
2011
Riverside
Right
12.3 12.4
425
Toe rock failure.
2011
Riverside Revetment
Right
12.8
70
Toe and face rock failure.
2011
Sportsman
Left
14.05 14.17
650
Slump and scour.
2011
Sportsman
Left
14.2
220
Toe rock failure.
2011
Van Ogle Revetment
Right
13.6513.66
100
Slump in front of Knobloch residence.
2011
Van Ogle Revetment
Right
14.14 14.16
120
Toe and face rock failure.
2012
Ball Creek
Left
15.3
100
Toe and face rock failure.
2012
Bowen/Parker
Left
16.7 16.8
300
Face rock failure.
2012
McMillin
Left
16.1
100
Toe and face rock failure.
425
Toe rock failure.
Storm Season
Segment Name
2009
2010
2011
2012
2012
Riverside
Right
12.3 12.4
2012
Riverside Revetment
Right
12.8
100
Missing face rock.
2012
Van Ogle Revetment
Right
14.1
120
Toe and face rock failure.
2012
Wazzu Revetment
Left
12.2
50
Over steepened, loss of face and toe rock.
McMillin
Left
16.1
100
Toe & face rock failure.
2013 2013
FLOOD – PAGE 4-155 REGION 5 ALL HAZARD MITIGATION PLAN – 2020-2025 EDITION BASE PLAN
Summary of Damage to Facilities in the Middle Puyallup 1995 - 2017 Bank
River Mile (RM)
Damage Lineal Feet
Damage
Riverside Revetment
Right
12.8
100
Missing face rock.
Wazzu Revetment
Left
12.2
50
Toe & face rock failure.
2015
River Grove
Right
11.2
75
Tree root pulled out section of levee.
2015
Sportsman
Left
13.7
250
Partial erosion of revetment face rock.
2015
Wazzu Revetment
Left
12.2
150
Missing rock and over steepened.
2015
Wazzu Revetment
Left
12.2
150
Missing rock and over steepened.
2017
River Grove
Right
11.2
110
Overly steep. Sloughing. USACE repair.
2017
Wazzu Revetment
Left
12.1
60
Levee damage.
Storm Season
Segment Name
2013 2013
2015
2017
FLOOD – PAGE 4-156 REGION 5 ALL HAZARD MITIGATION PLAN – 2020-2025 EDITION BASE PLAN
Upper Puyallup River The upper Puyallup River begins at the confluence of the Carbon River at RM 17.4 and continues upstream to the Champion Bridge at RM 28.6, just downstream of Electron Road. The contributing drainage basin for this reach is approximately 188 square miles. In the lower portion of this reach, the river is confined by a combination of levees and revetments. In the middle portion there is less confinement due to the presence of two setback levees, the Soldiers Home setback levee at RM 21.5 to RM 22.5 and Ford setback levee at RM 23.4 to RM 25.0. Above RM 25.0, few levees and revetments remain on the right bank due to past flood damages and changes in flood management strategies. The surrounding watershed and land use is mostly urban on the right bank of the Puyallup near the City of Orting between RM 17.4 to RM 21.8, but predominantly agricultural, rural residential and forested upstream of RM 21.8. Like the middle Puyallup River, by the 1930s much of the valley and surrounding hills in the upper Puyallup River were harvested for timber and the valley cleared for agriculture (GeoEngineers 2003). Several tributaries enter the upper Puyallup River including Horse Haven Creek, Fiske Creek, Kapowsin Creek, and Fox Creek. The largest tributary, Kapowsin Creek, originates in Ohop Lake and Lake Kapowsin located approximately 3.7 miles upstream from its confluence with the Puyallup River at RM 26.0. Salmon and trout, including Chinook, coho, pink, chum, and steelhead, use the entire reach of the upper Puyallup River.
FLOOD – PAGE 4-157 REGION 5 ALL HAZARD MITIGATION PLAN – 2020-2025 EDITION BASE PLAN
FLOOD – PAGE 4-158 REGION 5 ALL HAZARD MITIGATION PLAN – 2020-2025 EDITION BASE PLAN
Upper Puyallup Extent and Occurrences The upper Puyallup River experienced flooding most recently in 1990, 1996, 1999, 2000, 2006, 2008, and 2009 (see Historical Flooding in the upper Puyallup River table). The largest flood event on record at the USGS gauge near Orting occurred on November 6, 2006 with a flow of 21,500 cfs, estimated to be approximately a 160-year event in the upper Puyallup River. Since 2013, there have been multiple high-water events that have not resulted in any significant damage to private property or public infrastructure other than flood facilities. The categorization of major flooding is based on a threshold of discharges in excess of approximately 16,000 cfs at the Orting gauge. Historical Flooding in Upper Puyallup River USGS 12096500 Puyallup River Near Orting, WA 86 Records From 1932 - 2017 Water Year
Date
Stream Flow (cfs)
2007
November 6, 2006
21,500
1996
February 8, 1996
18,300
2016
December 9, 2015
17,200
2009
January 7, 2009
16,900
2015
November 25, 2014
16,500
1963
November 20, 1962
15,300
1960
November 22, 1959
12,900
1934
December 10, 1933
12,800
1965
January 29, 1965
12,200
1956
December 11, 1955
12,100
1978
December 2, 1977
12,100
1933
November 13, 1932
11,800
1990
January 9, 1990
11,600
2000
November 25, 1999
11,600
2005
January 18, 2005
11,500
Probability of Future Hazards In 2003 FEMA’s study contractor NHC calculated peak flows that would be utilized for updating the FEMA flood insurance study and flood insurance rate maps. For the upper Puyallup River at the USGS gauge at Orting (12093500), the calculations for the 10-year, 50-year, 100-year and 500-year recurrence intervals are shown to be respectively: 12,200, 16,800, 18,600 and 22,600 cfs. The FEMA Levee Analysis and Mapping Plan (2019) used additional peak flow data through 2017 that includes significant flooding in November 2006, January 2009 and December 2015, and revised these estimates as follows for the 10-year, 50-year, 100-year and 500-year recurrence intervals, respectively: 12,890, 18,400, 20,800 and 26,520 cfs. This recent flow data shows a twelve percent increase in the one percent annual chance flow. Based on the NHC study, the historical flow record, and the thresholds for moderate flooding (13,500 cfs) and severe FLOOD – PAGE 4-159 REGION 5 ALL HAZARD MITIGATION PLAN – 2020-2025 EDITION BASE PLAN
flooding (greater than 16,000), the Upper Puyallup River valley can expect to experience moderate flooding every two to four years, and severe flooding every three to five years, over a long-term period (URS 2012). Generally, flooding occurs during late fall into early spring, particularly between the months of November and February.
Upper Puyallup River Impacts Impact on Community Although commercial and industrial properties do not comprise a large proportion of this area (less than 1 percent), a number of these properties are located within the 100-year floodplain (between the Puyallup River and state Route 162) (URS 2012). If a major flood event were to happen in the floodplain, it would impact the economy and tax base in Orting. Due to the large presence of vacant lands and resource land, temporary loss of business in this area is likely to be low outside the City of Orting (URS 2012). However, lands used for resource land, including agriculture, may experience some economic loss if these areas are unable to be accessed or used during the flood and during the recovery period following the flood (URS 2012).
Land Purchases The following land and home acquisitions have occurred since 1991, using a combination of federal, state, and local funds. • • • • • • • • • • • •
Acquisition of homes and property along Orville Road near Champion Bridge (53 acres); Acquisition of homes and property in the Neadham Road area (180 acres); Acquisition of homes and property near the High Bridge (8.5 acres); Acquisition of homes and property along Orville Road in Ford levee area (192 acres); Acquisition of property along Puyallup River left bank in Soldiers Home area (136 acres); Acquisition of homes and property near Leach Road (15 acres); Acquisition of homes and property near the confluence with Horsehaven Creek (29 acres); Acquisition of homes and property for the South Fork Setback levee (58 acres); Three properties were acquired in the Neadham Road area (17 acres); Six properties were acquired along Neadham Road and one property was acquired near Orville Road Kapowsin Creek (40 acres); One property was acquired along Orville Road and one property was acquired near Neadham road (7 acres); and Three properties were acquired along Orville Road (73 acres).
FLOOD – PAGE 4-160 REGION 5 ALL HAZARD MITIGATION PLAN – 2020-2025 EDITION BASE PLAN
River Management Levees and revetments form nearly continuous bank protection in the lower segment of the upper Puyallup River system between RM 17.4 and RM 23.6. Near the City of Orting, flood risk reduction facilities help protect residential, commercial, agricultural areas, and public facilities. Above RM 23.6 the levee segments were heavily damaged by major flood events between 1996 and 2009. The below table contains a list of river management facilities, including ownership. Levees and Revetments in the Upper Puyallup River Name
Location a
Ownership
High Cedars Revetment
RM 17.4 – RM 17.5
Pierce County
High Cedars Levee
RM 17.5 – RM 19.7, PL 84-99
Pierce County
Calistoga Levee
RM 19.7 – RM 21.25, PL 84-99
Pierce County
Jones Levee
RM 21.25 – RM 22.5, PL 84-99
Pierce County
Ford Levee
RM 22.5 – RM 24.9, PL 84-99
Pierce County
High Bridge Revetment
RM 24.9 – RM 25.45
Pierce County Roads
Neadham Road Levee
RM 26.4 – RM 26.9, PL 84-99
Pierce County
Right Bank
Left Bank South Fork Levee
RM 17.5 – RM 18.5
Pierce County
Leach Road Levee
RM 19.1 – RM 21.25, PL 84-99
Pierce County
Soldier’s Home Levee
RM 21.25 –RM 23.1, PL 84-99
Pierce County
McAbee Levee
RM 23.1 – RM 23.6, PL 84-99
Pierce County
Orville Road Revetment
RM 25.6 – RM 28.1
Pierce County
Champion Bridge Levee/Revetment
RM 28.1 – RM 28.6
Pierce County
Damage to Facilities Flood damages to upper Puyallup River flood risk reduction facilities have been extensive in the past three decades. Five significant flood events of more than 16,000 cubic feet per second (cfs) have occurred along the study reach since 1990. Damages sustained ranged from full washout of the flood risk reduction structure over several hundred lineal feet to localized moderate scour and erosion. Damages from the major floods and high-water events have resulted in approximately 243 identified damage locations along 16.3 miles of levees and revetments. Damages have been estimated at nearly $41.62 million (based on 2017 dollars). The upper portion of this Puyallup River reach between RM 25.4 and RM 28.6 has historically been the most vulnerable to significant repetitive damages requiring repair and implementation of capital solutions to reduce flood risk. The table below shows Flood Damage to Levees in Upper Puyallup River to include current damages from 1990 to 2017.
FLOOD – PAGE 4-161 REGION 5 ALL HAZARD MITIGATION PLAN – 2020-2025 EDITION BASE PLAN
Damage to Facilities along the Upper Puyallup River 1990 - 2017 Storm Season
Bank
River Mile (RM)
Damage Lineal Feet
Left
P-68 23.6
100
Reshape and replace rip rap and toe rock.
Right
P-70 24.0
100
Reshape and replace rip rap and toe rock.
Segment Name
Damage
1990 1990
McAbee Ford - Historic
1990 1990
The Country - Remnant Iii
Left
P-74: 24.7
200
Partial washout.
1990
High Bridge Revet.
Right
P-76 25.1
600
Restore damaged rip rap.
1990
Fiske Creek Revetment
Right
P-78 25.5
800
Reconstruction.
1990
Neadham Road-Historic I
Right
P-80 25.9
280
Reconstruction
1990
Neadham Road-Historic I
Right
P-81: 26.0
900
Reconstruction.
1990
Orville-Kapowsin
Right
P-82: 26.2
800
Reconstruction.
1990
Orville-Kapowsin
Left
P-82: 26.2
150
Reconstruction.
1990
Orville-Kapowsin
Left
P-83 26.4
501
Reconstruction.
1990
Orville-Kapowsin
Right
P-83: 26.4
700
Reconstruction.
1990
Orville-Kapowsin
Left
P-84 26.6
600
Washout.
1990
Orville-Kapowsin
Left
P-84: 26.6
900
Reconstruction.
1990
Orville-Kapowsin
Left
P-85 26.8
350
Partial washout.
1990
Neadham Road
Right
P-85: 26.8
250
Reconstruction.
1990
Orville-Kapowsin
Left
P-86: 27.0
800
Reconstruction.
1990
Stehn Large Lot
Left
P-87 27.2
500
Washout.
1990
Stehn Large Lot
Left
P-88 27.4
632
Reconstruction.
1990
Griessel
Left
P-89: 27.6
1000
Reconstruction.
1990
Griessel
Left
P-90 27.7
200
Partial washout.
1990
Champion Bridge
Left
P-94 28.5
400
Washout restore channel alignment.
Neadham Road
Right
P-85: 26.8
250
Reconstruction.
1992
High Bridge Revet.
Right
P-78: 25.4
160
Reconstruction.
1992
Neadham Road-Historic Ii
Right
P-82: 26.2
150
Reconstruction.
1994
Jones
Right
21.8
20
Repair of levee damages.
1994
Ford - Historic
Right
23.6
20
Repair of levee damages.
1994
Ford - Historic
Right
23.8
20
Repair of levee damages.
1995
Calistoga
Right
19.8 - 20.2
500
Total levee failure.
1995
Calistoga
Right
20.0
375
Partial washout.
1995
Leach Road
Left
20.0
195
Reshape and replace riprap and toe
1991 1991
1992
1994
1995
FLOOD – PAGE 4-162 REGION 5 ALL HAZARD MITIGATION PLAN – 2020-2025 EDITION BASE PLAN
Damage to Facilities along the Upper Puyallup River 1990 - 2017 Storm Season
Bank Segment Name
River Mile (RM)
Damage Lineal Feet
Damage rock.
1995
Leach Road
Left
20.2
300
Mostly toe failure with some slope failure.
1995
Calistoga
Right
20.7
100
Partial Washout.
1995
Leach Road
Left
20.7
200
Partial Washout.
1995
Calistoga
Right
20.9
200
Toe/slope failure.
1995
Jones
Right
22.3
250
Toe/slope failure.
1995
Jones
Right
22.4
200
Toe/slope failure.
1995
Soldiers Home - Historic
Left
22.5
200
Partial washout.
1995
Soldiers Home - Historic
Left
22.5
50
Total failure.
1995
Soldiers Home
Left
22.9
200
Partial washout.
1995
Ford - Historic
Right
23.6
900
Total failure.
1995
Ford - Historic
Right
23.7
200
Partial washout.
1995
The Country - Historic Ii
Left
24.0
200
Partial washout.
1995
The Country - Historic Ii
Left
24.0
800
Total failure.
1995
Mint Creek
Left
25.1
300
Partial washout.
1995
Neadham Road - Remnant I
Right
25.6
1995
Orville-Kapowsin
Left
26.2
1500
Full levee washout.
1995
Orville-Kapowsin
Left
26.5
225
Partial washout.
1995
Orville-Kapowsin
Left
26.6
200
Partial washout.
1995
Neadham Road
Right
26.8
500
Partial washout.
1995
Orville-Kapowsin
Left
27.0
500
Full levee washout.
1995
Griessel
Left
27.6
400
Full levee washout.
1995
Griessel-Historic
Left
28.1
300
Cutoff levee, full washout.
1995
Griessel-Historic
Left
28.1
700
Full levee washout.
1996
High Cedars
Right
17.6
400
Toe failure.
1996
High Cedars
Right
18.0
500
Toe failure.
1996
High Cedars
Right
18.0
400
Total failure.
1996
South Fork
Left
18.2
200
Levee access road damage.
1996
High Cedars
Right
19.0
100
Toe/slope failure.
1996
Calistoga
Right
19.8 - 20.2
500
Total levee failure.
1996
Calistoga
Right
19.8 - 20.2
1200
Total levee failure.
1996
Calistoga
Right
20.0
375
Toe/slope failure.
1996
Calistoga
Right
20.2
200
Mostly toe with some slope failure.
1996
Leach Road
Left
20.5
300
Toe/slope failure..
200 Partial washout.
1996
FLOOD – PAGE 4-163 REGION 5 ALL HAZARD MITIGATION PLAN – 2020-2025 EDITION BASE PLAN
Damage to Facilities along the Upper Puyallup River 1990 - 2017 Bank
River Mile (RM)
Damage Lineal Feet
Damage
Calistoga
Right
20.7
300
Toe failure.
Calistoga
Right
20.8
100
Toe failure.
1996
Calistoga
Right
20.9
300
Toe/slope failure.
1996
Calistoga
Right
21.2
200
Toe/slope failure.
1996
Soldiers Home - Historic
Left
21.9
400
Toe/slope failure.
1996
Jones
Right
22.3
250
Toe/slope failure.
1996
Jones
Right
22.4
200
Toe/slope failure.
1996
Jones
Right
22.5
200
Total failure.
1996
Ford
Right
22.9
300
Toe/slope failure.
1996
Ford
Right
23.1
200
Total failure.
1996
Ford - Historic
Right
23.6
900
Total failure.
1996
McAbee
Left
23.6
1200
Total failure.
1996
The Country - Historic Ii
Left
24.0
500
Total failure.
1996
The Country - Historic Ii
Left
24.1
300
Total failure.
1996
Ford - Historic
Right
24.6
1200
Total failure.
1996
High Bridge Revet.
Right
25.1
200
Total failure.
1996
Mint Creek
Left
25.15
250
Toe/slope failure.
1996
Neadham Road - Remnant I
Right
25.6
1300
Total failure.
1996
Neadham Road-Historic Ii
Right
26.2
2000
Total failure.
1996
Neadham Road
Right
26.4
600
Total failure.
1996
Neadham Road
Right
26.6
1000
Total failure.
1996
Orville-Kapowsin
Left
26.6
900
Toe/slope failure.
1996
Orville-Kapowsin
Left
26.7
1200
Toe/slope failure.
1996
Neadham Road
Right
26.8
1000
Total failure.
1996
Orville-Kapowsin
Left
26.8
2000
Total failure.
1996
Griessel
Left
27.6
2000
Toe/slope failure.
1996
Griessel-Historic
Left
28.0
2500
Toe/slope failure.
1996
Orville-Kapowsin
Left
26.7 - 27.6
3000
Total failure.
2003
Calistoga
Right
21.0
300
Partial washout of the toe and levee facing.
2003
Soldiers Home
Left
22.8
220
Partial washout of the toe and levee facing.
2003
Orville-Kapowsin
Left
26.2
360
Partial washout of the toe and levee facing.
2003
Champion Bridge
Left
28.2
40
Partial washout of the toe and levee facing.
Storm Season
Segment Name
1996 1996
2003
FLOOD – PAGE 4-164 REGION 5 ALL HAZARD MITIGATION PLAN – 2020-2025 EDITION BASE PLAN
Damage to Facilities along the Upper Puyallup River 1990 - 2017 Storm Season
Bank
River Mile (RM)
Damage Lineal Feet
Segment Name
Damage
2004 2004
High Cedars
Right
17.8
1,300
Partial washout of the toe and levee facing.
2004
High Cedars
Right
19.6
250
Partial washout of the toe and levee facing.
2004
Leach Road
Left
20.7
10
Re-establish heavy rip-rap around outfall pipe.
2004
Soldiers Home - Historic
Left
22.3
250
Partial washout of the toe and levee facing.
Soldiers Home - Historic
Left
22.3
100
Repair/replace toe and face rock.
2006
South Fork
Left
17.7
40
Washout.
2006
High Cedars
Right
18.0
50
Washout.
2006
South Fork
Left
18.0
350
Washout.
2006
High Cedars
Right
19.4
150
Washout.
2006
Leach Road
Left
19.4
50
Washout.
2006
Calistoga
Right
19.8
100
Washout.
2006
Leach Road
Left
19.8
200
Washout.
2006
Soldiers Home
Left
22.6
100
Face erosion.
2006
Ford
Right
22.8
350
Washout.
2006
McAbee
Left
23.6
600
Washout.
2006
Orville-Kapowsin
Left
26.3
415
Washout.
2006
Champion Bridge
Left
28.4
450
Washout.
2006
Champion Bridge
Left
28.6
150
Washout.
2006
Champion Bridge
Left
28.6
700
Washout.
2006
Neadham Road-Historic Iii
Right
26.7 - 27.0
1500
Washout.
High Cedars
Right
18.0
70
Washout.
2007
Jones
Right
22.0
200
Repair.
2007
Orville-Kapowsin
Left
25.7
500
Washout.
2007
Orville-Kapowsin
Left
26.2
200
Washout.
2007
Neadham Road
Right
26.7
330
Cut-off construction.
2007
Neadham Road
Right
26.4 - 26.8
1,600
Washout - USACE Assistance.
High Cedars
Right
18.2
75
Toe rock failure and partial face rock failure.
2005 2005
2006
2007 2007
2008 2008
FLOOD – PAGE 4-165 REGION 5 ALL HAZARD MITIGATION PLAN – 2020-2025 EDITION BASE PLAN
Damage to Facilities along the Upper Puyallup River 1990 - 2017 Bank
River Mile (RM)
Damage Lineal Feet
Damage
High Cedars
Right
18.5
175
Toe rock and partial face failure.
Leach Road
Left
19.3
250
Top of levee/access road scour.
2008
Leach Road
Left
19.75
350
Partial washout of the toe and levee facing.
2008
Jones
Right
21.7 - 22.4
600
Partial washout of the toe and levee facing.
2008
The Country - Historic I
Left
23.6 - 23.8
620
Washout.
2008
Calistoga
Right
19.82
200
Top surface access road scour.
2008
Calistoga
Right
20.78
130
Potential toe rock failure and face rock failure.
2008
Calistoga
Right
21.15
120
Potential toe rock failure and face rock failure.
2008
Jones
Right
21.3
450
Toe rock failure.
2008
Soldiers Home
Left
21.30
120
Toe rock failure.
2008
Jones
Right
22.0
300
Toe rock failure.
2008
Jones
Right
22.05
100
Toe rock failure.
2008
Ford
Right
22.8
150
Toe rock failure.
2008
Soldiers Home
Left
23.0
600
Toe rock failure.
2008
McAbee
Left
23.6
150
Partial levee core failure.
2008
Ford
Right
24.6
100
Toe rock failure.
2008
Neadham Road-Historic Ii
Right
26.3
738
Complete washout.
2008
Champion Bridge
Left
28.3
127
Toe and Face Rock Failure.
2008
Champion Bridge
Left
28.5
299
Partial washout.
2009
High Cedars
Right
18.2
75
Toe rock failure and partial face rock failure.
2009
High Cedars
Right
18.8
700
High cedars facing rock failure.
2009
Leach Road
Left
19.3
250
Top of levee/access road scour.
2009
High Cedars
Right
19.4
120
Face rock failure.
2009
Leach Road
Left
19.8
520
Revetment 30% of facing rock missing.
2009
Jones
Right
22.1
200
Primarily face scour loss of face rock.
2009
Jones
Right
22.35
60
Primarily face scour loss of face rock.
2009
Ford
Right
22.7
150
Primarily face scour loss of face rock.
2009
Soldiers Home
Left
22.7
141
Primarily scour along the lower portion of the face rock.
2009
McAbee
Left
23.3
200
Primarily face scour loss of face rock.
2009
McAbee
Left
23.6
150
Partial Levee Core failure.
2009
Neadham Road
Right
26.8
130
Cut-off extension.
Storm Season
Segment Name
2008 2008
2009
FLOOD – PAGE 4-166 REGION 5 ALL HAZARD MITIGATION PLAN – 2020-2025 EDITION BASE PLAN
Damage to Facilities along the Upper Puyallup River 1990 - 2017 Bank
River Mile (RM)
Damage Lineal Feet
Champion Bridge
Left
28.15
150
Complete washout of levee.
Champion Bridge
Left
28.2
168
Primarily face scour loss of face rock.
2009
Champion Bridge
Left
28.25
300
Primarily face scour loss of face rock.
2009
Champion Bridge
Left
28.3
135
Toe scour causing face rock to slough away.
2009
Champion Bridge
Left
28.5
435
Primarily face scour loss of face rock.
2010
High Cedars
Right
18.18
10
Small face scour pocket.
2010
Leach Road
Left
19.8
550
Toe and face scour - USACE assistance.
2010
Soldiers Home
Left
21.3
150
Slope and toe scour - USACE assistance.
2010
Jones
Right
21.4
500
Toe and partial embankment scour USACE assistance.
2010
Soldiers Home
Left
22.5
140
Slope and toe scour - USACE assistance.
2010
Soldiers Home
Left
22.7
175
Slope and toe scour - USACE assistance.
2010
Neadham Road
Right
26.8 - 27.0
550
Levee extension.
2011
Leach Road
Left
19.9
60
Partial failure.
2011
Ford
Right
23.4
120
Face and toe rock failure.
2011
Ford
Right
24.7
300
Lower face scour.
2011
High Bridge Revet.
Right
25.3
90
Major face scour/scarp.
2011
Neadham Road
Right
26.45
120
Face and toe rock failure.
2011
Champion Bridge
Left
28.3
100
Face rock failure and sloughing.
2011
Champion Bridge
Left
28.15 28.3
700
Face and toe rock failure.
2012
High Cedars
Right
19.3
75
Toe scour.
2012
Leach Road
Left
19.9
60
Partial failure upstream end of Corp.
2012
Calistoga
Right
20.7
25
Knick point.
2012
Soldiers Home
Left
21.45
50
Lower face and possible toe scour.
2012
Soldiers Home
Left
22.6
50
Lower face erosion.
2012
Ford
Right
23.5
200
Toe scour.
Storm Season
Segment Name
2009 2009
Damage
2010
2011
2012
2012
McAbee
Left
23.6
80
End of levee at rock point washed out to river mile post sign.
2012
Soldiers Home
Left
23.6
80
End of levee at rock point washed out to river mile post sign.
FLOOD – PAGE 4-167 REGION 5 ALL HAZARD MITIGATION PLAN – 2020-2025 EDITION BASE PLAN
Damage to Facilities along the Upper Puyallup River 1990 - 2017 Storm Season
Bank
River Mile (RM)
Damage Lineal Feet
Damage
Segment Name
2012
Ford
Right
24.7
200
Toe scour and loss of lower face.
2012
High Bridge Revet.
Right
25.2
30
Knick point in revetment.
2012
High Bridge Revet.
Right
25.4
50
Over steepened w/ lots of rock missing.
2012
Neadham Road
Right
26.5
240
Face rock sloughing along entire length due to lost toe rock or toe being lost.
2012
Neadham Road
Right
26.65
210
Toe rock missing causing face to slough.
2012
Neadham Road
Right
26.7
75
Several upper level toe rocks rolled out.
2012
Champion Bridge
Left
28.15
200
Continued damage from last year.
2012
Champion Bridge
Left
28.45
100
Sloughing moving upstream.
2012
Champion Bridge
Left
28.1- 28.2
700
Sloughing.
2013
High Cedars
Right
18.70
30
Toe rock and face rock missing with some core erosion.
2013
High Cedars
Right
19.4
75
Knick point. Toe rock loss and face sloughing.
2013
Ford
Right
23.50
200
Toe scour.
2013
Neadham Road
Right
26.65
210
Toe rock missing causing face to slough.
2013
Neadham Road
Right
26.70
60
Toe rock is being scoured and causing the face to slough.
2013
Champion Bridge
Left
28.3
100
Revetment repair.
2014
Soldiers Home
Left
21.45
100
Lower face scour.
2014
Neadham Road
Right
26.4
300
Thalweg against toe causing scour along the lower face and toe.
2014
Neadham Road
Right
26.6 & 26.7
285
Toe scour causing lower face to slough.
2014
Champion Bridge
Left
28.2 - 28.3
400
Toe rock rolling out and face sloughing.
2015
High Cedars
Right
18.15
100
Maintenance.
2015
High Cedars
Right
18.25
160
Missing face rock.
2015
High Cedars
Right
18.3
130
Missing face rock.
2015
High Cedars
Right
19.4
200
Maintenance.
2015
Leach Road
Left
19.4
200
Overtopping and scour over access road.
2015
Leach Road
Left
19.6
150
Overtopping and facing rock
2013
2014
2015
FLOOD – PAGE 4-168 REGION 5 ALL HAZARD MITIGATION PLAN – 2020-2025 EDITION BASE PLAN
Damage to Facilities along the Upper Puyallup River 1990 - 2017 Storm Season
Bank Segment Name
River Mile (RM)
Damage Lineal Feet
Damage damaged.
2015
Leach Road
Left
20.3
10
Tree pulled in a chunk of levee.
2015
Leach Road
Left
21.0
75
Toe and face rock missing.
2015
Soldiers Home
Left
21.45
40
Levee rehabilitation.
2015
McAbee
Left
23.2
100
Core exposed.
2015
Ford
Right
23.60
100
Missing face and toe rock.
2015
McAbee
Left
23.6
100
Buttress end has started to erode.
2015
Ford
Right
24.70
300
Full washout over 200 LF. Orville road only 40 feet away.
2015
Ford
Right
24.70
400
Washout of levee. Emergency repair.
2015
High Bridge Revet.
Right
25.2
60
Face scour, sloughing, loss of toe rock.
2015
High Bridge Revet.
Right
25.35
350
Face scour and loss of toe rock.
2015
Neadham Road
Right
26.4
150
Missing face rock.
2015
Griessel
Left
27.7
30
Access road at culvert damaged.
2015
Champion Bridge
Left
28.15
40
Erosion at end of Champion Bridge Levee.
2015
Champion Bridge
Left
28.2
110
Missing toe and face rock.
2015
Champion Bridge
Left
28.2
220
Severe face scour.
2015
Champion Bridge
Left
28.2
450
Emergency - levee rehab.
2015
Champion Bridge
Left
28.25
150
Missing face rock and over steepened.
2015
Champion Bridge
Left
28.25
100
Project has grown from 150 to 250 from November Flood.
2015
Neadham Road
Right
26.6 & 26.7
80
Levee rehabilitation.
2017
High Cedars
Right
17.6
1
Over steepened.
2017
High Cedars
Right
18.6
100
Toe and face rock failure.
2017
High Cedars
Right
18.77
40
Toe and face rock failure.
2017
Leach Road
Right
19.3
800
Access Road damage.
2017
Soldiers Home
Left
22.8 - 22.9
900
Levee rehabilitation.
2017
Leach Road
Right
19.9
25
Scour at top of levee.
2017
Leach Road
Left
20.2
60
Localized scour. Missing toe and face rock.
2017
Leach Road
Left
20.7
50
Localized scour. Missing toe and face rock.
2017
Leach Road
Left
21.0
310
Face and toe rock failure.
2017
Jones
Right
22.2
500
Toe rock failure.
2017
FLOOD – PAGE 4-169 REGION 5 ALL HAZARD MITIGATION PLAN – 2020-2025 EDITION BASE PLAN
Damage to Facilities along the Upper Puyallup River 1990 - 2017 Bank
River Mile (RM)
Damage Lineal Feet
Damage
McAbee
Left
23.6
160
Further erosion of buttress.
Ford
Right
24.6
400
Levee washout.
2017
High Bridge Revet.
Right
25.4
50
Upstream end of past repair project is damaged.
2017
Neadham Road
Right
26.65
125
Thalweg against toe causing scour along the lower face and toe.
2017
Champion Bridge
Left
28.2
150
Emergency - levee rehabilitation.
2017
Champion Bridge
Left
28.2
175
Further damage at end of levee.
2017
Champion Bridge
Left
28.25
50
Project has grown from 150 to 250 from November Flood.
2017
Champion Bridge
Left
28.25
50
More toe and face rock missing.
Storm Season
Segment Name
2017 2017
FLOOD – PAGE 4-170 REGION 5 ALL HAZARD MITIGATION PLAN – 2020-2025 EDITION BASE PLAN
White River The White River drains an area of approximately 475 square miles. It flows about 75 miles from its source on the Emmons Glacier on the northeast side of Mount Rainier to its mouth at the City of Sumner. The river has several tributaries including Huckleberry Creek, Greenwater River and Clearwater River. It flows through the community of Greenwater, the Muckleshoot Indian Reservation, and the cities of Buckley, Auburn, Pacific, and Sumner before joining the Puyallup River at RM 10.3. Approximately 75 percent of the White River basin lies within Pierce County and the remaining 25 percent is within King County. The White River forms the county line separating King and Pierce counties between the confluence of the Greenwater River and White River at RM 45.8 downstream to near the City of Auburn.
Lower White River The lower White River reach begins at the confluence with the Puyallup River and extends upstream to River Mile 5.5 at the Pierce-King County-line. The lower White River flows through the cities of Auburn, Pacific, and Sumner before joining the Puyallup River at RM 10.3. Several tributaries enter the lower White River in this reach, including Bowman Creek, Government Ditch, Jovita Creek, and Salmon Creek. The drainage basin is approximately 496 square miles. Prior to 2004, the majority of flow in the White River was diverted by Puget Sound Energy’s Buckley Diversion Dam located at RM 24.3. The Buckley Diversion Dam sent flow to Lake Tapps for power generation. Return flows from Lake Tapps enter the White River at RM 3.6. The dam is now owned by the Cascade Water Alliance and no longer produces energy. The White River is well known for its large sediment discharge and high turbidity levels. Today, substantial residential, industrial, and commercial development exists along the lower White River valley within the cities of Sumner, and Pacific. Salmon and trout, including bulltrout, cutthroat spring and fall Chinook, coho, sockeye, pink, chum, and steelhead use the entire reach of the lower White River.
FLOOD – PAGE 4-171 REGION 5 ALL HAZARD MITIGATION PLAN – 2020-2025 EDITION BASE PLAN
FLOOD – PAGE 4-172 REGION 5 ALL HAZARD MITIGATION PLAN – 2020-2025 EDITION BASE PLAN
Lower White River Extent and Occurrences The 1906 avulsion of the White River into the Stuck River doubled the Puyallup River watershed and started a long partnership between King and Pierce counties to manage the change in flow. With a little over a hundred years of history, our understanding of the river’s potential and balance of sediment and flow is still a work in progress. In the last 30 years major flooding in the lower White River occurred in 1990, 1996, 2006, and 2009. The largest flood on record in the lower reach occurred in December 1933, prior to the construction of Mud Mountain Dam (MMD). This would have been exceeded in the 2015 and 2011 floods if not for the dam. The USGS gauge upstream of the dam does not show record of the major floods of 1977, 1996 or 2006 as the gauge was flooded in the backwater of MMD. The largest recorded flow on the White River above MMD was in 2015. The peak flow of 31,900 cfs was attenuated by the dam so that the cities in the lower reach saw only 8,150 cfs at the USGS gauge at R Street. Increased flood risk in the lower White River has resulted from the reduction of channel capacity. Thresholds for flood warnings has decreased from 10,000 cfs to 6,500cfs. Since 2013, these events have occurred multiple times a year. Historical Flooding in Lower White River USGS 12100496 White River Near Auburn, WA - 20 Records from 1987– 2009 USGS 12100490 White River at R Street Near Auburn, WA - 8 Records from 2010-2017 Water Year
Date
Stream Flow (cfs)
1996
February 10, 1996
15,000
2007
November 9, 2006
14,700
1990
January 9, 1990
14,500
1997
December 30, 1996
13,600
2006
January 11, 2006
12,400
2009
January 9, 2009
12,000
2009
January 9, 2009
12,000
1999
December 30, 1998
10,600
2008
December 5, 2007
9,830
2000
November 26, 1999
9,620
2016
December 9, 2015
8,150
2002
January 9, 2002
7,840
2011
January 17, 2011
7,750
2003
January 31, 2003
7,750
2015
November 25, 2014
7,380
2012
February 23, 2012
7,290
2017
March 15, 2017
6,970
FLOOD – PAGE 4-173 REGION 5 ALL HAZARD MITIGATION PLAN – 2020-2025 EDITION BASE PLAN
Probability of Future Hazards The Flood Insurance Mapping Study (NHC, 2005) identified the following peak flows for the Lower White River in Sumner from RM 0.06 to 5.5 for the 10-year, 50-year, 100-year and 500year recurrence intervals, respectively: 14,000, 15,300, 15,500, and 19,000 cfs. Based on this study, the historical flow record (USGS gauge 12100490 at R Street near Auburn), and loss of channel capacity do to sediment transport, the thresholds have been significantly lowered for moderate flooding (8,000 cfs) and severe flooding (greater than 10,000 cfs). The White River valley can expect to experience moderate flooding every three to five years, and severe flooding every ten to 20 years, over a long-term period (URS 2012). Generally, flooding occurs during late fall into early spring, particularly between the months of November and February.
White River Impacts Impact on Community Commercial and industrial properties comprise approximately 31 percent of the land use in the 100-year floodplain (URS 2012). A major flood event would result in the temporary loss of business for commercial and industrial properties in this area. Short-term output, income, employment, and tax revenues may decrease. Major industrial facilities in this area include Pacific Distribution Services, Norvanco International, Hudd Distribution Services, Roadrunner Transportation, and Cooper Tire and Rubber Company (URS 2012). Major businesses include Solo Cup Company and several coffee roaster businesses (URS 2012).
Land Purchases There have been no land purchases or buyouts along the lower White River by Pierce County since 1991. However, 14-acres of property have been acquired by the City of Sumner between RM 3.8 and RM 4.9 for future use as a part of the Stewart to 16th street setback levee, Pacific Point Bar Setback Levee, and the White River Restoration. Additional floodplain property is anticipated to be purchased in the future.
River Management The lower White River revetments and levees form nearly continuous bank protection from RM 0.0 at the Puyallup River to the Pierce-King County line at RM 5.5. The flood risk reduction facilities protect property and improvements in the floodplain, with an estimated assessed value of $535 million (Economic Analysis 2010). The facilities are owned and operated by Pierce County as summarized in the table below. Levees and Revetments in the Lower White River Name
Location a
Ownership
Sumner Industrial Revetment
RM 0.0 – RM 5.1
Pierce County
Right Bank
FLOOD – PAGE 4-174 REGION 5 ALL HAZARD MITIGATION PLAN – 2020-2025 EDITION BASE PLAN
Levees and Revetments in the Lower White River Name
Location a
Ownership
Butte Revetment
RM 5.1 – RM 6.2
Pierce County
Fleishman Revetment
RM 0.0 – RM 2.05
Pierce County
Dieringer Revetment
RM 2.05 – RM 4.9
Pierce County
Potelco
RM 4.9 – RM 6.2, PL 84-99
Pierce County
Left Bank
Damage to Facilities Flood damages to lower White River flood risk reduction facilities in the past three decades have not been significant. Damages from major floods and high-water events between 1990 – 2017 have resulted in approximately 17 identified damage locations comprising 0.7 mile of levees and revetments. Damages have been estimated at nearly $1.54 million dollars (based on 2017 dollars). Since 1990, the levees and revetments along the lower White River have been stable requiring minimal repairs. However, in 2009, sediment accumulation became more apparent as there was a rapid diminishment of channel capacity resulting in increased flood risk. In 2017, King County constructed a new setback levee to improve channel capacity and habitat. The new County Line Setback levee was constructed on the left bank between RM 5.0 and 6.2. It was designed to provide capacity for the 1% chance storm event with sufficient free-board. King County is scheduled to monitor and maintain the project into the future. Damage to the Sumner Commercial Revetment segment was identified in 2011 during an annual condition assessment. Over the course of the following storm season the damage rapidly increased in length and severity and is scheduled for repair. Due to the complexities associated with the site, developing a solution amicable to the stakeholders involved has delayed the repair of this revetment. The table below shows the Damage to Facilities in the Past 20 Years along the Lower White River from 1990 and 2017.
FLOOD – PAGE 4-175 REGION 5 ALL HAZARD MITIGATION PLAN – 2020-2025 EDITION BASE PLAN
Damage to Facilities the along the Lower White River (1990-2017) Storm Season
River Mile (RM)
Damage Lineal Feet
Damage
Segment Name
Bank
Sumner Commercial Revetment
Right
W-49 2.0 and W-58 3.8
400
Partial washout.
Sumner Commercial Revetment
Right
3.4
100
Toe and face scour.
Potelco
Left
5.4
20
Damaged face rock.
Potelco
Left
5.25
20
Damaged face rock.
2011
Potelco
Left
5.05 - 5.15
650
Levee overtopping from wetland.
2011
Potelco
Left
5.35 - 5.5
570
Levee overtopping flowing to wetland.
2011
Sumner Commercial Revetment
Right
3.85
100
Levee core erosion, toe and face rock failure.
2011
Sumner Industrial Revetment
Right
0.03
30
Culvert replacement.
2012
Sumner Commercial Revetment
Right
3.85
400
Levee core erosion, toe and face rock failure.
2012
Sumner Industrial Revetment
Right
0.03
30
Culvert replacement.
Dierenger
Left
4.0
135
Erosion and scour protection installed by the City of Sumner.
2014
Dierenger
Left
4.0
50
Erosion and scour of the City of Sumner's soft armoring.
2014
Potelco
Left
5.35 - 5.5
570
Levee overtopping flowing to wetland.
Potelco
Left
5.3
50
Repairs spots where trees overtopped and damaged levee.
2017
Dierenger
Left
4.0
75
Old Sumner Levee repair site.
2017
Sumner Commercial Revetment
Right
3.8
530
Levee damage.
1990 1990
1993 1993
2008 2008
2009 2009
2011
2012
2013 2013
2014
2015 2015
2017
FLOOD – PAGE 4-176 REGION 5 ALL HAZARD MITIGATION PLAN – 2020-2025 EDITION BASE PLAN
Upper White River The upper White River reach in the study area extends from approximately RM 43.2 to RM 50.5, from downstream of the community of Greenwater to upstream of Crystal Village and Crystal River Ranch. State Route 410 parallels the river throughout this reach. Large tributaries include the Greenwater River, which enters the White River at RM 44.6 and the West Fork White River, which enters the White River at RM 48.2. Land uses in the reach include two residential communities, Greenwater Village and Crystal Village, which are supported by several commercial businesses located in Greenwater. Revetments have been constructed on the right bank of the river at Greenwater Village along 583rd Avenue East at RM 46.2 and in Crystal Village near RM 50.0. The upper White River has a large sediment discharge and high turbidity levels due to the proximity to its glacial headwaters. Salmon and trout, including spring Chinook, coho, pink, and steelhead, bull trout and cutthroat use this reach of the White River.
FLOOD – PAGE 4-177 REGION 5 ALL HAZARD MITIGATION PLAN – 2020-2025 EDITION BASE PLAN
FLOOD – PAGE 4-178 REGION 5 ALL HAZARD MITIGATION PLAN – 2020-2025 EDITION BASE PLAN
Upper White River Extent and Occurrences The White River gauge downstream of the Clearwater River confluence has operated intermittently from 1975 to the present, with several data gaps resulting from damage during large floods. In the last 40 years major flooding in the upper White River occurred in 1977, 1995, 1996, 2006, and 2008 (see the table below). Flow values in the table are shown as “less than” due to the larger drainage area for the Clearwater gauge. Historical Flooding in Upper White River USGS 12097850 White River Below Clearwater River Near Buckley, WA 25 Records From 1975 – 2017 No data for floods in 1997, 1996 or 2006 due to gauge damage Water Year
Date
Stream Flow (cfs)
2016
December 9, 2015
31,900
1996
February 8, 1996
29,000 (estimated)
2011
January 16, 2011
28,600
1976
December 2, 1975
22,800
2015
January 5, 2015
22,000
1996
November 28, 1995
20,500
2012
February 22, 2012
19,400
1991
November 25, 1990
18,400
2009
November 12, 2008
18,100
1990
January 9, 1990
17,200
1975
January 18, 1975
15,100
1987
November 24, 1986
14,900
1986
February 23, 1986
14,100
1984
January 25, 1984
13,300
2014
March 09, 2014
12,100
Probability of Future Hazards The Upper White River above the confluence with the Greenwater River at RM 44.6 consists of flows primarily from the West Fork White River, White River and Huckleberry Creek. A USGS river gage originally existed on the Upper White River, but it experienced problems and was removed. Flows above Greenwater are monitored now by using the USGS gauge (12097850) White River below Clearwater and subtracting the flow from the USGS gauge (12097500) Greenwater River. The best available estimates of flood flow frequency on the Upper White River are from the 1987 Flood Insurance Study. This shows the 10-year, 50-year, 100-year and 500-year recurrence intervals, respectively: 13,500, 18,700, 20,900, 26,400 cfs. FLOOD – PAGE 4-179 REGION 5 ALL HAZARD MITIGATION PLAN – 2020-2025 EDITION BASE PLAN
Upper White River Impacts Impact on Community Commercial and industrial properties do not comprise a large portion of this area (less than five percent) (URS 2012). The only businesses in this area include small bed and breakfast inns and restaurants in the Town of Greenwater. Therefore, a large flood event would not result in a major impact to the economy and tax base. Due to the large presence of vacant lands, open space, and resource land, temporary loss of business in this area is unlikely to occur (URS 2012). However, lands used for recreation or resource land may experience economic loss if these areas are unable to be accessed or used during the flood and during the recovery period following the flood (URS 2012).
Land Purchases There have been no land purchases or buyouts along the upper White River by Pierce County since 2013. However, 14-acres of property have been acquired by the City of Sumner between RM 3.8 and RM 4.9 for future use as a part of the Stewart to 16th Street Setback Levee, Pacific Point Bar Setback Levee, and the White River Restoration. Additional floodplain property is anticipated to be purchased in the future.
River Management The upper White River has a single levee in the vicinity of 583rd Avenue East, just upstream of RM 45.0 on the right bank. The levee is owned and operated by Pierce County as summarized in the table below. The taxable assessed value of property and improvements in the floodplain in the upper White and Greenwater River areas is estimated at $36 million (Economic Analysis 2010). Table 5.25 – Levees in the Upper White River Name Greenwater Village Levee
Location a RM 46.0 – RM 46.2 RB, PL 84-99
Ownership Pierce County
Damage to Facilities The Greenwater Village Levee continued to experience partial toe rock displacement. Since the last update, the residents of Crystal Village Ranch funded, permitted and installed a buried rock groin along the left bank of the White River. The groin was installed to address the residents’ concern about the possibility of channel migration continuing to impact their development. The damage to facilities table along the Upper White River (below) includes damages from 1996 to 2017.
FLOOD – PAGE 4-180 REGION 5 ALL HAZARD MITIGATION PLAN – 2020-2025 EDITION BASE PLAN
Damage to Facilities along the Upper White River 1996-2017 Segment Name
Bank
River Mile (RM)
Damage Lineal Feet
Damage
1996
Greenwater
Right
46.2
150
Toe/slope failure.
1996
Greenwater
Right
46.2
100
Toe failure.
2006
Greenwater
Right
46.2
300
Face erosion.
2007
Greenwater
Right
45.0- 45.2
750
Face erosion.
2015
Greenwater
Right
45.2
30
Partial toe rock displacement and missing face rock.
2015
Greenwater
Right
45.2
20
Missing toe rock.
Storm Season 1996
2006
2007
2015
FLOOD – PAGE 4-181 REGION 5 ALL HAZARD MITIGATION PLAN – 2020-2025 EDITION BASE PLAN
Greenwater River The Greenwater River lies in northeastern Pierce County and enters the White River at RM 44.6. The headwaters of the Greenwater River are in the Norse Peaks Wilderness area on Castle Mountain, elevation 6700 feet, and flows northwest for 21 miles to the community of Greenwater. The drainage basin is approximately 76 square miles. Primary tributaries include Maggie, Lost, Pyramid, and Twenty-Eight Mile creeks. Salmon and trout, including spring Chinook, coho, pink, and steelhead are present in the Greenwater River. The river forms part of the easterly boundary between King County and Pierce County. The planning area is from the mouth of the Greenwater River upstream to approximately RM 4.0. Land use consists of forested terrain, recreational and rural residential uses, and the community of Greenwater.
FLOOD – PAGE 4-182 REGION 5 ALL HAZARD MITIGATION PLAN – 2020-2025 EDITION BASE PLAN
FLOOD – PAGE 4-183 REGION 5 ALL HAZARD MITIGATION PLAN – 2020-2025 EDITION BASE PLAN
Greenwater River Extent and Occurrences In December 1977, the Greenwater River experienced its most severe flooding with a peak flow of 10,500 cfs. Other large floods occurred in 1946, 1959, 1965, 1996, and 2009 (see the table below). The 1977 event caused the most extensive damage. A large log jam at the State Route 410 crossing of the river contributed to extensive flooding and damage in the community of Greenwater. Historical Flooding in Greenwater River USGS 12097500 Greenwater River at Greenwater, WA 75 Records From 1911 - 2017 Water Year
Date
Stream Flow (cfs)
1978
December 2, 1977
10,500
1996
February 8, 1996
5,900
2011
January 16, 2011
5,590
1960
November 22, 1960
5,360
1965
January 29, 1965
5,090
1947
December 11, 1946
5,000
2016
December 9, 2015
4,620
2009
January 7, 2009
4,530
2012
February 22, 2012
4,440
1934
December 9, 1933
4,140
1976
December 2, 1975
4,140
2015
January 5, 2015
3,890
Probability of Future Hazards The best available estimates of flood flow frequency on the Greenwater River are from the 1987 Flood Insurance Study. This shows the 10-year, 50-year, 100-year and 500-year recurrence intervals, respectively: 5,600, 8,080, 9,180, 11,900 cfs.
Greenwater River Impacts Impact on Community Most of the Greenwater watershed is forest land except for the lower 1.2 miles. There are small lot recreational cabins on both the Pierce and King County sides of the river. The left bank Pierce County side at Lumpy Lane is predominantly higher than the King County right bank community that accesses their property over a low bridge that spurs off Lumpy Lane in Pierce County. Lower areas along the east end of Lumpy Lane and Stubbs Road can be threatened during moderate to major flooding. There is a history of small revetments on both sides of the river to FLOOD – PAGE 4-184 REGION 5 ALL HAZARD MITIGATION PLAN – 2020-2025 EDITION BASE PLAN
limit erosion. The county purchased one home and three lots in the 1990s where channel migration threatened the home. Currently one more home has been identified by the Building Official as threatened by erosion. The state highway over the Greenwater has been the site of log jams in high water events that threatened the bridge abutments.
Land Purchases In the early 1990’s, three parcels were acquired that consisted of 0.47 acres along the left bank of the Greenwater River near RM 0.7. Two parcels were already vacant, and the other parcel contained a house that was at high risk of being destroyed by channel bank erosion. This house has been removed.
River Management Pierce County has not actively maintained flood risk reduction facilities along the Greenwater River within the study area since 1982. There is a series of intermittent revetments along the left bank of the river between RM 0.1 and RM 1.27. King County maintains a series of intermittent revetments along the right bank of the river in the same area. A private revetment exists on the left bank between RM 0.6 to RM 0.7. There is also some armoring at the SR-410 crossing of the Greenwater River near RM 0.1.
Damage to Facilities As noted above, there is currently no actively maintained Pierce County flood risk reduction facility on the Greenwater River. The most significant damage occurred during the 1977 peak flood event that affected the State Route 410 Bridge and approaches. Some toe and face rock protecting the bridge banks and approaches probably have been damaged by the peak flows since 1977. The condition and status of the private revetment is not known. There has been loss of private property. In 1990, the County purchased a home on Lumpy Lane that was falling in the river due to channel migration. The County is currently working with an adjacent property owner whose home is being threatened by channel migration.
FLOOD – PAGE 4-185 REGION 5 ALL HAZARD MITIGATION PLAN – 2020-2025 EDITION BASE PLAN
Carbon River The Carbon River drains an area of 230 square miles that originates on the north face of Mt. Rainier at the Carbon Glacier. It flows 33 miles downstream joining the Puyallup River below the City of Orting at RM 17.4. This plan concentrates on the lower 8.4 miles of the Carbon River. Most of this segment of the river is within unincorporated Pierce County, but the left bank of the lower 3.5 miles flows along the City of Orting. Above RM 11.0, the river is contained within steep canyon walls up to the community of Fairfax at RM 17.5. Between RM 0.0 and RM 8.3, the channel corridor lies in a relatively narrow trough-like valley. The right bank is largely forested from RM 0.8 to RM 8.4. Below RM 0.8 the right bank is largely agricultural land. The left bank of the river from RM 0.75 to RM 3.54 is within the City of Orting and contains the Orting Wastewater Treatment Plant and single-family residential development. Between RM 3.4 and RM 8.3, the left bank land use consists mostly of agricultural and rural residential land. The left bank has a levee from RM 0.1 to RM 5.6 and RM 6.0 to RM 8.2. The right bank has a levee from RM 0.0 to RM 1.2 and RM 5.9 to RM 7.0. Two major tributaries enter the Carbon River in this reach, Voight Creek at RM 4.0 and South Prairie Creek at RM 5.8. South Prairie Creek is described in Chapter 5.8. Voight Creek, a smaller tributary, collects runoff from the foothills to the south and west and flows across the valley floor before entering the Carbon River (GeoEngineers 2003). The Carbon River contains the most productive mainstem spawning habitat remaining in the Puyallup River watershed for all species of salmon. Chinook, steelhead, chum, and pink salmon are found in relative abundance.
FLOOD – PAGE 4-186 REGION 5 ALL HAZARD MITIGATION PLAN – 2020-2025 EDITION BASE PLAN
FLOOD – PAGE 4-187 REGION 5 ALL HAZARD MITIGATION PLAN – 2020-2025 EDITION BASE PLAN
Carbon River Extent and Occurrences Major flooding of the Carbon River has been recorded occurred in 1933, 1959, 1977, 1990, 1996, 2006, 2008, and 2009 (see the table below). The November 2006 flood is the largest on record, with a measured flow of 14,500 cfs. The categorization of major flooding is based on a threshold of discharges in excess of approximately 10,000 cfs at the Fairfax gauge. Historical Major Flooding on Carbon River USGS 12094000 Carbon River Near Fairfax, WA 76 Records From 1930-2016 Water Year
Date
Stream Flow (cfs)
2007
November 6, 2006
14,500
1991
November 24, 1990
13,000
1996
February 8, 1996
12,000
2009
November 12, 2008
11,700
1934
December 9, 1933
11,000
2016
December 9, 2015
10,200
1978
December 1, 1977
10,000
1960
November 23, 1959
9,970
2015
November 25, 2014
9,470
2005
January 18, 2005
7,650
1968
December 25, 1967
7,480
1976
December 1, 1975
7,460
1975
January 18, 1975
7,320
2003
January 31, 2003
7,310
1974
January 15, 1974
7,180
Probability of Future Hazards In 2003, FEMA’s study contractor NHC calculated peak flows that would be utilized for updating the FEMA flood insurance study and Flood Insurance Rate Maps. For the Carbon River at the USGS gauge near Fairfax (12094000) the calculations for the 10-year, 50-year, 100-year and 500-year recurrence intervals are shown to be respectively: 8,700, 12,700, 14,500, 19,100. Based on the flow records for the past 20 years, the historical flow records, and the thresholds for moderate flooding (8,000-10,000 cfs) and severe flooding (greater than 10,000), the Carbon River can expect to experience moderate flooding every three to five years, and severe flooding every five to ten years, over a long-term period (URS 2012). Generally, flooding occurs during late fall into early spring, particularly between the months of November and February. With 76 years of data at the gauge, eight of the ten peak flood events have occurred on the Carbon River since 2000.
FLOOD – PAGE 4-188 REGION 5 ALL HAZARD MITIGATION PLAN – 2020-2025 EDITION BASE PLAN
Carbon River Impacts Impact on Community There are no commercial or industrial properties within this area; however, there are a substantial number of residential structures (URS 2012). Therefore, a large flood event would not result in a major impact to the economy and tax base. Due to the large presence of vacant lands, open space, and resource land, temporary loss of business in the area is unlikely to occur (URS 2012). However, lands used for recreation or resource land may experience some economic loss if these areas are unable to be accessed or used during the flood and during the recovery period following the flood (URS 2012).
Land Purchases A significant number of parcels and flood damaged homes have been purchased along the Carbon River since the 1991 Flood Plan was adopted. Acquisitions have been focused on the Upper Carbon River between RM 6.4 & 8.3 in support of a future setback levee project planned along this reach. The objective of the project is to help resolve repetitive damages to the levee as well as reconnect historic floodplain that is currently cutoff by the existing levee.
River Management On June 5, 1939 Pierce County approved Resolution No. 686, a plan for flood control of the middle Puyallup River, upper Puyallup River, and Carbon River. The plan was to establish a single channel on the Carbon River and Puyallup River (upstream of the White River confluence) by excavating gravel and river sediments and side casting them to form levees that were armored with rock riprap. This was the standard practice until the 1970s. Current levees along the Carbon River were primarily built in the 1960s. The once meandering river channel was straightened and confined to an average width of 250 feet. The levee system was designed to prevent sediment sources from the banks and cliffs adjacent to the river from entering the channel contributing to increased sediment transport. It was believed that by constricting the channel width, there would be increased flow velocities to continue sediment transport downstream. Pierce County currently owns and maintains approximately 10.5 miles of flood risk reduction facilities along the Carbon River in a combination of levees and revetments.
FLOOD – PAGE 4-189 REGION 5 ALL HAZARD MITIGATION PLAN – 2020-2025 EDITION BASE PLAN
Levees and Revetments along the Carbon River Location a
Ownership
Lindsay Levee
RM 16.9 (PR) – RM 1.7, PL 8499
Pierce County
Ski Park Levee
RM 5.95 – RM 7.0, PL 84-99
Pierce County
Riddell Levee
RM 0.0 – RM 1.7, PL 84-99
Pierce County
Orting Treatment Plant Levee
RM 1.7 – RM 3.05, PL 84-99
Pierce County
Bridge Street Levee
RM 3.05 – RM 3.7, PL 84-99
Pierce County
Voight Downstream Revetment
RM 3.7 – RM 4.0
Pierce County
Voight Upstream Revetment
RM 4.0 – RM 4.4
Pierce County
Name Right Bank
Left Bank
Guy West Levee
RM 4.6 – RM 5.6, PL 84-99
Pierce County
Guy West Revetment
RM 5.6 – RM 5.95
Pierce County
Alward Segment No 2 Levee
RM 5.95 - RM 6.4, PL 84-99
Pierce County
Fish Ladder Revetment
RM6.35- RM 6.65
Pierce County
Alward Segment No 1 Levee
RM 6.55 – RM 8.26, PL 84-99
Pierce County
Alward Revetment
RM 8.26- RM 8.33
Pierce County
Damage to Facilities Flood damages to Carbon River flood risk reduction facilities have been extensive in the past two decades. Six significant flood events have occurred along the study reach since 1990. Damages sustained ranged from full washout of the flood control structure over several hundred lineal feet to localized moderate scour and erosion. Damages from the major flood events resulted in approximately 99 identified damage locations comprising 5.9 miles of levees and revetments. Damages have been estimated at nearly $15 million dollars (based on 2010 dollars). The table below summarizes levee and revetment segments subject to the most significant and repetitive damages. The upper portion of this Carbon River reach between RM 6.0 and RM 8.3 incurred the most damage. Damage to Facilities along the Carbon River 1990 - 2017 Storm Season
River Mile (RM)
Damage Lineal Feet
Damage
Left
C-36 6.8
750
Reconstruction.
1300
Reconstruction. Washout.
Segment Name
Bank
Alward 1
1990 1990 1990
Alward 1
Left
C-37 and 38 7.2
1990
Bridge Street
Left
C-17 3.2
175
1990
Guy West
Left
C-31 5.9
400
Reconstruction.
1990
Lindsay
Right
C-2 0.4
250
Levee slope protection damage.
FLOOD – PAGE 4-190 REGION 5 ALL HAZARD MITIGATION PLAN – 2020-2025 EDITION BASE PLAN
Damage to Facilities along the Carbon River 1990 - 2017 Storm Season
Segment Name
Bank
River Mile (RM)
Damage Lineal Feet
1990
Lindsay
Right
0.8
400
Reslope and replace levee washed out by flood.
1990
Riddell
Left
C-2 0.4
400
Reslope and replace levee washed out by flood.
1990
Riddell
Both
0.9
400
Reslope and replace levee washed out by flood.
1990
Riddell
Left
C-5 0.9
150
Levee slope protection damage.
1990
Ski Park
Right
6.0
770
Flood damage repair.
1990
Ski Park
Right
C-34 6.4
300
Washout.
1990
Ski Park
Right
C-34 6.4
500
Reconstruction.
1990
Ski Park
Right
6.5
300
Reshape and replace rip rap and toe rock.
1990
Ski Park
Right
6.8 and 7.6
1550
Flood damage repair.
1990
Ski Park
Right
C-32 6.1
900
Reconstruction.
1990
South Prairie Confluence
Right
C-31 5.9
100
Reconstruction.
1995
Alward 1
Left
6.7
350
Partial washout.
1995
Alward 1
Left
6.9
150
Full levee washout.
1995
Alward 1
Left
7.1
700
Full levee washout.
1995
Alward 1
Left
7.3
100
Partial washout.
1995
Alward 2
Left
6.2
255
Repair partially failed embankment.
1995
Alward 2
Left
6.3
250
Partial washout.
1995
Guy West
Left
4.6
100
Full levee washout.
1995
Guy West
Left
4.9
100
Partial washout.
1995
Lindsay
Right
0.8
379
Toe/slope failure.
1995
Ski Park
Right
6.9
200
Partial washout.
1995
Ski Park/Alward 1
Both
6.9, 7.3, & 7.4
730
Rebuild fully washed out levee.
1996
Alward 1
Left
6.6
400
Toe failure.
1996
Alward 1
Left
6.9
200
Toe failure.
1996
Alward 1
Left
7.2
400
Total levee failure.
1996
Alward 1
Left
7.2
850
Total levee failure.
1996
Alward 2
Left
6.05
250
Toe/slope failure.
1996
Alward 2
Left
6.25
250
Toe/slope failure.
1996
Alward 2
Left
6.3
100
Toe/slope failure.
1996
Bridge street
Left
3.2
50
Toe/slope failure.
Damage
1995
1996
FLOOD – PAGE 4-191 REGION 5 ALL HAZARD MITIGATION PLAN – 2020-2025 EDITION BASE PLAN
Damage to Facilities along the Carbon River 1990 - 2017 Storm Season
Segment Name
Bank
River Mile (RM)
Damage Lineal Feet
Damage
1996
Bridge street
Left
3.6
350
Total levee failure.
1996
Fish Ladder
Left
6.4
50
Toe/slope failure.
1996
Guy West
Left
4.6
100
Total levee failure.
1996
Guy West
Left
4.9
100
Toe/slope failure.
1996
Lindsay
Right
0.2
450
Toe/slope failure.
1996
Lindsay
Right
0.5
50
Toe/slope failure.
1996
Lindsay
Right
0.6
80
Toe/slope failure.
1996
Lindsay
Right
0.95
50
Toe/slope failure.
1996
Lindsay
Right
1.0
30
Toe failure.
1996
Lindsay
Right
1.1
40
Toe failure.
1996
Lindsay
Right
1.2
125
Toe/slope failure.
1996
Orting Treatment Plant
Left
2.7
20
1996
Riddell
Left
0.4
100
Toe/slope failure.
1996
Riddell
Left
0.8
30
Toe/slope failure.
1996
Riddell
Left
1.05
20
Toe/slope failure.
1996
Ski Park
Right
7.1
800
Total levee failure.
1996
Ski park
Right
6.18
40
Toe/slope failure.
1996
Ski park
Right
6.9
320
Total levee failure.
1998
Alward 1
Left
6.9
150
Repair levee.
1998
Alward 1
Left
7.6
150
Repair levee.
1998
Alward 1
Left
8.0
200
Repair levee.
2003
Guy West
Left
5.4
260
Partial washout of the toe and levee facing.
2003
Ski Park
Right
6.6
450
Partial washout of the toe and levee facing.
2005
Alward 1
Left
6.6
450
Replace/ reconstruct/repair.
2005
Alward 1
Left
7.6
750
Replace/ reconstruct/repair.
2006
Alward
Left
8.3
100
Face erosion.
2006
Alward
Left
8.3
300
Face erosion.
2006
Alward 1
Left
7.2 - 7.4
750
Washout.
2006
Alward 1
Left
7.5
1200
Washout.
2006
Alward 1
Left
7.6
700
Washout.
2006
Alward 1
Left
8.2
150
Face erosion.
Toe/slope failure.
1998
2003
2005
2006
FLOOD – PAGE 4-192 REGION 5 ALL HAZARD MITIGATION PLAN – 2020-2025 EDITION BASE PLAN
Damage to Facilities along the Carbon River 1990 - 2017 Storm Season
Segment Name
Bank
River Mile (RM)
Damage Lineal Feet
Damage
2006
Alward 2
Left
6.0 - 6.1
600
Face erosion.
2006
Alward 2
Left
6.3
600
Washout.
2006
Bridge street
Left
3.2
50
Washout.
2006
Bridge street
Left
3.6
120
Washout.
2006
Bridge street
Left
3.6
200
Face erosion.
2006
Guy west
Left
4.6 - 4.9
1700
Toe erosion/undercut bank.
2006
Guy west
Left
4.8
150
Washout.
2006
Guy west
Left
4.8
100
Washout.
2006
Guy west
Left
4.8
140
Washout.
2006
Guy west
Left
5.0
270
Face erosion.
2006
Guy west
Left
5.2
150
Face erosion.
2006
Guy west
Left
5.4
30
Washout.
2006
Lindsay
Right
0.8
60
Fracture.
2006
Lindsay
Right
1.2
150
Washout.
2006
Lindsay
Right
17.4
50
Face erosion.
2006
Riddell
Left
0.2
50
Slump.
2006
Riddell
Left
0.4
0
Overtopping.
2006
Riddell
Left
1.2
0
Overtopping.
2006
Ski park
Right
6.0
500
Washout.
2006
Ski park
Right
6.0
300
Washout.
2006
Ski park
Right
6.3
100
Face erosion.
2006
Ski park
Right
6.4
500
Washout.
2006
Ski park
Right
6.8
550
Washout.
2006
Voights d.s.
Left
3.8
180
Face erosion.
2006
Voights u.s.
Left
4.2
20
Fracture.
2006
Voights u.s.
Left
4.4
110
Restore levee face and toe.
2007
Alward 1
Left
6.6 - 6.7
810
Reconstruct new levee prism and set new face rock.
2007
Alward 1
Left
6.8 - 7.0
1250
Reconstruct levee prism, set new toe, and face.
2007
Alward 1
Left
7.2 - 7.4
850
Reconstruct new levee prism and set new face rock.
2007
Alward 1
Left
8.1
390
Replaced toe and re-slope and replaced face rock.
2007
Alward 1
Left
8.0
450
Re-establish toe and repair face.
2007
Bridge Street
Left
3.6 - 3.7
0
Overtopping.
2007
Guy West
Left
5.0
500
Set new toe and re-slope face.
2007
FLOOD – PAGE 4-193 REGION 5 ALL HAZARD MITIGATION PLAN – 2020-2025 EDITION BASE PLAN
Damage to Facilities along the Carbon River 1990 - 2017 Storm Season
Segment Name
Bank
River Mile (RM)
Damage Lineal Feet
2007
Lindsay
Right
0.8
600
Replace/ reconstruct/repair.
2007
Lindsay
Right
1.2
450
Re-establish toe and repair face.
2007
Ski Park
Right
6.0
540
Replace/ reconstruct/repair.
2007
Ski Park
Right
6.8
800
Re-establish toe and repair face.
2008
Alward 1
Left
7.0
100
Face scour and loss face rock.
2008
Alward 1
Left
7.2 - 7.3
796
Toe scour and loss of face rock. Lower face slumping.
2008
Alward 1
Left
8.0
100
Toe scour and loss of face rock. Lower face slumping.
2008
Alward 1
Left
8.1
100
Toe scour and loss of face rock. Lower face slumping.
2008
Alward 1
Left
8.25
150
Toe scour and loss of face rock. Lower face slumping.
2008
Alward 2
Left
6.0
824
Face rock thin due to scour.
2008
Alward 2
Left
6.25
302
Toe scour and loss face rock.
2008
Alward 2
Left
6.35
136
Toe scour and loss face rock.
2008
Bridge Street
Left
3.5
300
Toe scour and loss face rock
2008
Bridge Street
Left
3.55 3.7
325
Routine maintenance to the existing levee structure.
2008
Bridge Street
Left
3.6 - 3.7
380
Toe and face scour.
2008
Fish Ladder
Left
6.4
171
Toe scour and loss face rock.
2008
Guy West
Left
4.7
296
Scalloped washout.
2008
Guy West
Left
4.8
1,200
Re-establish levee core to inhibit lateral piping during high water.
2008
Guy West
Left
5.0
290
Replace undersized face rock.
2008
Guy West
Left
5.2
196
Replace undersized face rock.
2008
Guy West
Left
5.3
253
Toe scour and loss face rock.
2008
Lindsay
Right
1.0
50
Toe rock failure and partial face rock failure.
2008
Orting Treatment Plant
Left
2.0
25
Toe scour and loss face rock.
2008
Riddell
Left
0.4 - 0.5
634
Toe scour and loss face rock.
2008
Riddell
Left
0.9 1.10
500
Washout of the toe and levee face.
2008
Ski Park
Right
6.0
336
Toe scour and loss of face rock.
2008
Ski Park
Right
6.25
140
Toe scour and loss of face rock.
2008
Ski Park
Right
6.45 -
900
Face scour and loss face rock.
Damage
2008
FLOOD – PAGE 4-194 REGION 5 ALL HAZARD MITIGATION PLAN – 2020-2025 EDITION BASE PLAN
Damage to Facilities along the Carbon River 1990 - 2017 Storm Season
Segment Name
Bank
River Mile (RM)
Damage Lineal Feet
Damage
6.6 2008
Ski Park
Right
7.0
139
Washout.
2008
Voights u.s.
Left
4.2
324
Washout.
2008
Voights u.s.
Left
4.4
123
Toe and face scour.
2009
Alward 1
Left
7.5
118
Face scour with core exposure. Possibly some toe loss. Bank is undercutting.
2009
Alward 2
Left
6.35
140
Toe scour and loss face rock.
2009
Fish Ladder
Left
6.4
110
Lower face scour.
2009
Lindsay
Right
0.6
30
Facing rock failure.
2009
Lindsay
Right
0.9
75
Facing rock failure.
2009
Lindsay
Right
0.9
180
Re-establish toe and repair face.
2009
Lindsay
Right
16.9 16.95
100
Toe and facing rock failure.
2009
2009
Riddell
Left
0.4
0
Overtopping.
2009
Ski Park
Right
5.95
50
armored spillway/notch.
2009
Ski Park
Right
6.2
255
Face scour with loss of most face rock.
2009
Ski Park
Right
6.25
144
Primary lower face scour causing upper face to slough.
2009
Ski Park
Right
6.4
310
Face scour with loss of most face rock.
2009
Ski Park
Right
6.75
200
Lower face scour.
Ski Park
Right
6.45 6.6
400
Toe scour and loss of embankment.
2011
Alward 1
Left
7.1
75
Face and potential toe rock failure.
2011
Alward 1
Left
7.55
90
Toe and face rock failure.
2011
Alward 1
Left
8.05
130
Toe and face rock failure.
2011
Alward 1
Left
8.15
50
Face rock failure.
2011
Bridge Street
Left
3.35
30
Toe and face rock failure.
2011
Bridge Street
Left
3.45
120
Face rock failure.
2011
Guy West
Left
4.8
270
Undermining levee.
2011
Guy West
Left
5.3
70
Toe/face scour.
2011
Orting Treatment Plant
Left
2.0
129
Toe and rock failure.
2011
Riddell
Left
1.0
140
Toe is scoured out along with some face rock.
2011
Riddell
Left
1.1
400
Toe is scoured out along with some face
2009
2011
FLOOD – PAGE 4-195 REGION 5 ALL HAZARD MITIGATION PLAN – 2020-2025 EDITION BASE PLAN
Damage to Facilities along the Carbon River 1990 - 2017 Storm Season
Segment Name
Bank
River Mile (RM)
Damage Lineal Feet
Damage rock.
2011
Riddell
Left
1.6
210
Undermined section with prism showing in sections.
2011
Voights d.s.
Left
3.75
90
Partial damage to facing rock.
2011
Voights d.s.
Left
3.8
130
Damage to toe and face rock.
2011
Voights u.s.
Left
4.2
700
Some toe rock failure.
2012
Alward 1
Left
7.1
250
Face and potential toe rock failure.
2012
Alward 1
Left
8.05 8.15
350
Toe and face rock failure.
2012
Bridge Street
Left
3.35
60
Face and toe scour.
2012
Bridge Street
Left
3.4
45
Facing and toe scour.
2012
Bridge Street
Left
3.45
120
Face rock is gone.
2012
Guy West
Left
4.8
270
Levee undermined along toe.
2012
Guy West
Left
5.3
170
Toe and face rock failing.
2012
Orting Treatment Plant
Left
2.0
129
Toe and face rock failure.
2012
Riddell
Left
0.4
634
Toe scour and loss of face rock.
2012
Riddell
Left
1.0
140
Toe is scoured out along with some face rock.
2012
Riddell
Left
1.6
210
Undermined trees are pulling apart face rock.
2012
Voights d.s.
Left
3.8
130
Some minor damage to face rock.
2012
Voights u.s.
Left
4.2
700
Some toe rock failure.
2013
Alward 1
Left
7.0 - 7.1
400
Toe and face rock failing.
2013
Alward 1
Left
7.2
150
Minor toe rock repair.
2013
Fish Ladder
Left
6.4
100
Toe and face rock failure.
2013
Guy West
Left
5.5
250
Toe and face rock failing.
2013
Orting Treatment Plant
Left
2.0
150
40 LF of prism core exposed.
2013
Riddell
Left
1.6
250
Missing face and toe rock.
2014
Guy West
Left
5.75
250
Face rock failure.
2014
Riddell
Left
0.5
500
Toe scour and loss of face rock.
2012
2013
2014
2014
Riddell
Left
1.6
260
Toe and face rock failure.
2014
Ski Park
Right
6.0
100
Toe and face erosion.
2015 FLOOD – PAGE 4-196 REGION 5 ALL HAZARD MITIGATION PLAN – 2020-2025 EDITION BASE PLAN
Damage to Facilities along the Carbon River 1990 - 2017 Storm Season
Segment Name
Bank
River Mile (RM)
Damage Lineal Feet
Damage
2015
Alward 1
Left
6.55
200
Levee rehabilitation.
2015
Alward 1
Left
7.1
40
Missing toe rock.
2015
Alward 1
Left
7.2
390
Levee rehabilitation.
2015
Alward 1
Left
7.9
100
Large log jam diverting flows/jet scour into levee.
2015
Alward 1
Left
7.9
20
Log jam is gone that forced flows into levee.
2015
Alward 1
Left
7.9
120
Toe and face rock damaged from large log jam.
2015
Alward 1
Left
8.1
60
Toe rock missing.
2015
Alward 1
Left
8.2
40
Missing toe rock in three locations.
2015
Alward 1
Left
8.2
30
Missing toe rock in three locations.
2015
Alward 1
Left
8.2
150
Large scour has formed at the toe of the levee. Toe and face rock has fallen into scour hole.
2015
Alward 2
Left
6.35
100
Levee rehabilitation.
2015
Alward 2
Left
6.2 -6.3
490
Levee rehabilitation.
2015
Bridge Street
Left
3.35
200
Levee rehabilitation.
2015
Bridge Street
Left
3.4
130
Face rock missing.
2015
Fish Ladder
Left
6.35 6.4
200
Rock displaced
2015
Fish Ladder
Left
6.35
100
Levee rehabilitation.
2015
Fish Ladder
Left
6.4
34
Missing Toe rock.
2015
Fish Ladder
Left
6.4
16
An additional 16 feet of revetment damaged from flood event.
2015
Fish Ladder
Left
6.4
100
Emergency repair.
2015
Fish Ladder
Left
6.45
150
Face and Toe Rock missing.
2015
Guy West
Left
4.65
150
Levee rehabilitation.
2015
Guy West
Left
4.8
360
Levee rehabilitation.
2015
Guy West
Left
5.3 5.35
375
Levee rehabilitation.
2015
Guy West
Left
5.2
40
Missing toe and face rock.
2015
Guy West
Left
5.75
150
Missing toe rock.
2015
Lindsay
Right
1.2
150
Toe rock missing.
2015
Lindsay
Right
0.8
30
Missing toe rock and face rock slumping.
2015
Lindsay
Right
0.8
200
Trees were undermined and then pulled out a section of face rock in several locations.
2015
Lindsay
Right
0.8
125
Missing toe rock and face rock.
2015
Riddell
Left
0.55
60
Missing face rock
2015
Ski Park
Right
6.2 - 6.3
735
Levee rehabilitation.
FLOOD – PAGE 4-197 REGION 5 ALL HAZARD MITIGATION PLAN – 2020-2025 EDITION BASE PLAN
Damage to Facilities along the Carbon River 1990 - 2017 Storm Season
Segment Name
Bank
River Mile (RM)
Damage Lineal Feet
Damage
2015
Ski Park
Right
2015
Ski Park
Right
6.20
40
Section of toe rock missing.
6.25
180
Missing toe and face rock.
2015
Ski Park
Right
6.80
200
Vertical face along inside radius of river bend.
2015 2015
Ski Park
Right
6.80
200
Vertical face.
Voights d.s.
Left
3.8
120
Missing toe and face rock.
2015
Voights d.s.
Left
3.8
140
Levee rehabilitation.
2015
Voights u.s.
Left
4.2
40
Partial undermining thru two repair sites in trees section.
2015
Voights u.s.
Left
4.2
80
Missing toe and face rock.
2015
Voights u.s.
Left
4.2
90
Missing toe and face rock.
2015
Voights u.s.
Left
4.3
20
Tree pulled out a chuck of face and toe rock.
2015
Voights u.s.
Left
4.3
50
Tree pulled out a chuck of face and toe rock
2015
Voights u.s.
Left
4.3
100
Large Cedar tree and Alder tree pulled a section of levee down.
2017
Alward 1
Left
7.9
120
Toe and face rock damaged from large log jam.
2017
Alward 1
Left
8.1
100
Toe rock missing. Scalloped along toe.
2017
Alward 2
Left
6.20
478
Reconstruction/preservation.
2017
2017
Alward 2
Left
6.000
150
Unacceptable PL 84-99 tie in, proposing slightly setback levee alignment to tie into former railroad embankment.
2017
Bridge Street
Left
3.4
130
Face rock failure. Face rock missing.
2017
Bridge Street
Left
3.7
120
Toe and face rock.
2017
Bridge Street
Left
3.4
340
Loss of toe and face rock.
2017
Bridge Street
Left
3.1
200
Loss of toe rock.
2017
Fish Ladder
Left
6.4
200
Loss of bank between 177th and the end of Alward 1 Levee.
2017
Guy West
Left
5.75
150
Toe and face rock failure.
2017
Orting Treatment Plant
Left
2.3
20
Portion of face rock missing.
2017
Orting Treatment Plant
Left
2.7
40
Toe rock failure.
2017
Orting Treatment Plant
Left
2.7
140
Partial of face rock missing.
2017
Orting Treatment Plant
Left
2.1
75
Levee face damage.
2017
Riddell
Left
1.2 - 1.3
500
Toe rock failure.
FLOOD – PAGE 4-198 REGION 5 ALL HAZARD MITIGATION PLAN – 2020-2025 EDITION BASE PLAN
South Prairie Creek South Prairie Creek lies in the center of the Puyallup River Basin, east of the City of Orting. South Prairie Creek has a drainage basin of 90 square miles and ranges in elevation from 285 feet above sea level to 5,933 feet at the summit of Pitcher Mountain. This plan concentrates on the lower floodplain area of South Prairie Creek (RM 0 - RM 6.4), extending from the Town of South Prairie to the confluence with the Carbon River at RM 5.9. There are no Pierce County levees along lower South Prairie Creek, but there are isolated rock riprap revetments and earthen berms that have been constructed by agricultural and residential landowners and transportation agencies, such as near SR-162 Bridge crossings of the creek. Land use consists of agricultural and rural residential, and the Town of South Prairie. There are no Pierce County levees along lower South Prairie Creek, but there are isolated rock riprap revetments and earthen berms that have been constructed by agricultural and residential landowners, and near State Route 162 bridge crossings of the creek. Salmon and trout, including fall Chinook, coho, pink, chum and steelhead use South Prairie Creek. South Prairie Creek is one of the most productive salmon and steelhead tributaries in the entire Puyallup River Basin.
FLOOD – PAGE 4-199 REGION 5 ALL HAZARD MITIGATION PLAN – 2020-2025 EDITION BASE PLAN
FLOOD – PAGE 4-200 REGION 5 ALL HAZARD MITIGATION PLAN – 2020-2025 EDITION BASE PLAN
South Prairie Creek Extent and Occurrences Major flood events since 1991 have damaged infrastructure, residential, agricultural, and recreational properties. Widespread flooding of roads, residential, and agricultural properties occurred in February 1996, November 2006, and January 2009. In most large floods, the Veteran of Foreign Wars campground sustains some damage. In January 2009, the Town of South Prairie Fire Station was flooded and sustained $36,000 in damage. State Route 162 and other local roads have been regularly closed during flooding due to water and debris over the roadway. Major flooding occurred in the South Prairie Creek in 1955, 1965, 1990, 1996, 2006, and 2009 (see the table below). The January 2009 flood is the largest on record, with a measured flow of 9,480 cfs, exceeding the 100-year flood flow of 8,700 cfs estimated by FEMA (FEMA/ NHC 2006). Since 2013, there has been no major flooding in this reach. Historical Major Flooding on South Prairie Creek USGS 12095000 South Prairie Creek at South Prairie, WA 60 Records From 1950 - 2017 Water Year
Date
Stream Flow (cfs)
2009
January 7, 2009
9,480
1996
February 8, 1996
8,170
1956
December 11, 1955
6,850
2007
November 7, 2006
6,540
1965
January 29, 1965
6,400
1990
January 9, 1990
5,930
1954
December 9, 1953
5,470
1991
February 19, 1991
5,390
2016
October 31, 2015
5,060
1975
January 18, 1975
5,020
2000
November 25, 1999
4,650
Probability of Future Hazards The thresholds for moderate and severe flooding for South Prairie Creek have not been established. During the past 20 years, peak flows over 6,000 cfs have occurred on three occasions. Based on the historical record, the November 2006 flood (6,540 cfs) was between a 10-year and 20-year event, the February 1996 flood was between a 25-year and 50-year event, and the January 2009 flood was greater than a 100-year event (URS 2012). Based on these flow records, South Prairie Creek can expect to experience moderate flooding every 5 to 10 years, and more severe flooding every 10 to 20 years, over a long-term period (URS 2012). Generally, flooding occurs during late fall into early spring, particularly between the months of November and February.
FLOOD – PAGE 4-201 REGION 5 ALL HAZARD MITIGATION PLAN – 2020-2025 EDITION BASE PLAN
South Prairie Creek Impacts Impact on Community There are no industrial properties and limited commercial properties within this area. Therefore, a large flood event would not result in a major impact to the county economy and tax base, although the Town of South Prairie could be severely impacted. However, lands used for residential and agricultural uses may experience some economic loss if these areas are unable to be accessed or used during the flood and during the recovery period following the flood (URS 2012). The 2009 flood caused the South Prairie fire station to flood and several roads overtopped and/or washed out causing residents to be stranded. There is a campground near river mile 2 that has to evacuate during minor flooding.
Land Purchases There have been extensive land purchases in the South Prairie Creek basin by Pierce County and its partners since 1991 for both flood and habitat related purposes. Approximately 142 acres have been purchased. Between 2006 and 2009, six parcels totaling 55.6 acres and four flood prone homes were purchased and removed. Funding has been provided by the Salmon Recovery Funding Board, Pierce County SWM fees, and the Real Estate Excise Tax (REET) funds. In addition, some properties have also been purchased by the Pierce Conservation District.
River Management No flood risk reduction facilities are owned and maintained by Pierce County Surface Water Management along South Prairie Creek. However, there are some rip rap revetments and armoring maintained by WSDOT along State Route 162 crossings and by Pierce County Roads along South Prairie Road East.
Damage to Facilities WSDOT reported scour of bridge piers and large woody debris buildup on bridges as problems on several bridges. Water and debris on roadways are a common problem for Pierce County roads, but damage to roadways is not widespread. Typically, some repair and maintenance of toe and facing rock follows large flood events. In 1996, South Prairie Creek jumped the right bank and washed out South Prairie Road near 246th Avenue East and did the same further downstream at Spring Site Road. Road reconstruction, bank stabilization, and an armored overflow flood re-entry channel repaired the flood damage.
FLOOD – PAGE 4-202 REGION 5 ALL HAZARD MITIGATION PLAN – 2020-2025 EDITION BASE PLAN
Nisqually River The Nisqually River drains a watershed of approximately 760 square miles. The river originates from the Nisqually glacier on the south slope of Mount Rainier with an elevation of 14,411 and flows 78 miles to the estuary at the Nisqually National Wildlife Refuge before flowing into Puget Sound. There are two major tributaries to the Nisqually River, the Mashel River, and Muck Creek. Nearly 58 percent of the Nisqually River watershed lies in Pierce County, with the remainder in Thurston County (16 percent) and Lewis County (26 percent). There are two dams on the Nisqually River, the first at RM 42.4 (LaGrande Dam) and the second at RM 44.2 (Alder Dam). Alder Dam forms the 3000-acre Alder Lake. The two dams are part of the Nisqually Hydroelectric Project owned and operated by Tacoma Power. According to Tacoma Power, the dams provide incidental reduction of flood flows, but there are no flood control requirements noted in the operating agreement (Nisqually Watershed Characterization, 2008).
Middle Nisqually The drainage area to the USGS gauge on the Nisqually River at McKenna is 517 square miles. The middle Nisqually River at McKenna forms the boundary between Pierce County and Thurston County. Flood risk on this reach is predominately in Thurston and Lewis County, as most of the Pierce County area is on high bank of the river. The focus of this reach is from approximately RM 21.3 to RM 26.0, where the 100-year floodplain is up to 2900 feet wide, and where substantial flooding occurred in the McKenna area during the February 1996 flood event. Land use in the McKenna vicinity consists of medium-density residential, rural residential and agriculture and pasture lands. There are also extensive lakes and wetlands in the surrounding area. Salmonid use in this reach of the Nisqually River includes fall Chinook, coho, chum and pink salmon and winter steelhead trout.
FLOOD – PAGE 4-203 REGION 5 ALL HAZARD MITIGATION PLAN – 2020-2025 EDITION BASE PLAN
FLOOD – PAGE 4-204 REGION 5 ALL HAZARD MITIGATION PLAN – 2020-2025 EDITION BASE PLAN
Nisqually River Extent and Occurrences One major flood in 1996, with flows estimated near 50,000 cfs, severely impacted the McKenna area (see the table below). Since construction of the Alder Dam in 1948, peak flow events exceeding 20,000 cfs have occurred five times. There have been no peak flows over 16,200 cfs since 1996. Records from the 1996 flood event indicate that 24 flooding problems were identified in the database for this area (Nisqually Basin Plan 2008). Historical Flooding on Middle Nisqually River USGS 12089500 Nisqually River at McKenna 61 Records from 1948 - 2017 Water Year
Date
Stream Flow (cfs)
1996
February 8, 1996
50,000
1965
January 29, 1965
25,700
1981
December 26, 1980
21,100
1960
November 23, 1959
20,500
1956
December 12, 1955
20,200
1990
January 10, 1990
17,700
1991
April 5, 1991
17,200
1951
February 11, 1951
16,900
1954
December 10, 1953
16,200
1982
February 19, 1982
16,200
2003
January 31, 2003
16,200
2009
January 8, 2009
16,100
1997
January 1, 1997
15,900
2016
December 9, 2015
15,900
Probability of Future Hazards The Flood Insurance Mapping Study for the Nisqually River (FEMA, 1987b) identified the 100year peak flow at McKenna at 32,000 cfs only to have the 1996 flood exceed 50,000 cfs. Many residents outside of the mapped 500-year flood zone lost their homes. Flooding in the lower Nisqually generally happens in late winter and early spring as the Tacoma Public Utilities (TPU) dam complex will be filling the Alder Lake reservoir each fall. While the TPU dams are not licensed for flood control, the draw down to generate power during the summer has allowed for attenuation of fall flood events in the lower reaches of the river. FEMA is conducting a new Flood Insurance Study of the Nisqually River and the 2019 Hydrology Report (STARR II) using Bulletin 17C calculations for the 10-year, 25-year, 50-year, 100-year and 500-year recurrence intervals are shown to be respectively: 29,900, 38,300, 45,000, 52,100, 70,500 cfs.
FLOOD – PAGE 4-205 REGION 5 ALL HAZARD MITIGATION PLAN – 2020-2025 EDITION BASE PLAN
Middle Nisqually River Impacts Impact on Community Commercial and industrial properties do not comprise a large portion of this area (less than two percent) (URS 2012). Therefore, a large flood event would not result in a major impact to the economy and tax base. However, lands used for recreation or resource land may experience some economic loss if these areas are unable to be accessed or used during the flood and during the recovery period following the flood (URS 2012).
Land Purchases A significant number of parcels and flood damaged homes were purchased along the middle Nisqually River in the McKenna vicinity following the 1996 flood. •
Acquisition of 25 parcels totaling 42.5 acres at a total cost of $2.04 million. Funding was a combination of Hazard Mitigation Grants (HMGP), with state and local match, including Real Estate Excise Tax (REET) funds.
River Management There is no known flood risk reduction facility infrastructure, past or present, owned or maintained by the Pierce County Surface Water Management Division. WSDOT has limited armoring along the SR-507 bridge crossing. The extent of armoring along the Thurston County (left bank) side of the river is not well known.
Damage to Facilities The 1996 flood eroded out the State Route 507 bridge approach on the Pierce County side (right bank), resulting in a two-day closure of the road and bridge. There is also ongoing scour and accumulation of large woody debris on the bridge piers during high flow events. The bridge is on WSDOT’s Scour Critical List for shallow spread footings and it is monitored during all highwater events. Flooding in 1996 resulted in extensive flooding of homes and roads in the McKenna area, as well as the Nisqually Valley Care Center, a nursing home located on the right bank downstream of the State Route 507.
Upper Nisqually River The upper Nisqually River begins on the slopes of Mount Rainier on the South Tahoma Glacier, Kautz Glacier, and Nisqually Glacier and flows generally east to west from the glaciers to Alder Lake, near the Town of Elbe. The upper Nisqually River forms the boundary between Pierce County and Lewis County. Glacial melt water and sediment flow down the mountain from three major sources: Tahoma Creek, Kautz Creek, and the Nisqually River. From Alder Lake to the confluence of Tahoma Creek at about RM 65.8, the upper Nisqually River flows through a broad FLOOD – PAGE 4-206 REGION 5 ALL HAZARD MITIGATION PLAN – 2020-2025 EDITION BASE PLAN
valley, occupied by terraces, glacial features such as moraines, and occasional bedrock outcrops (GeoEngineers 2007). The focus of this reach is from RM 50.5, at the entrance to Alder Lake Park in Elbe, to the upstream end of the levee/revetment at RM 65.4, near the entrance to Mt. Rainier National Park. The drainage area to the USGS gauge on the Nisqually River near National is 133 square miles. The unincorporated towns of Elbe and Ashford provide residential and commercial land uses and are located adjacent to State Route 706. Recreational, forest and agricultural uses make up the balance of land uses within this sub area. There are no salmon in this reach of the river, due to natural barriers and the dams downstream; however, there are resident cutthroat trout.
FLOOD – PAGE 4-207 REGION 5 ALL HAZARD MITIGATION PLAN – 2020-2025 EDITION BASE PLAN
FLOOD – PAGE 4-208 REGION 5 ALL HAZARD MITIGATION PLAN – 2020-2025 EDITION BASE PLAN
Upper Nisqually River Extent and Occurrences Since the USGS gauge was installed in 1942, major flooding has been recorded occurring in the upper Nisqually River in 1974, 1977, 1996, and 2006 (see the table below). The February 1996 and November 2006 floods both exceeded 21,000 cfs and were similar in magnitude to the estimated 1.0 percent annual chance flood (100-year) of 21,950 cfs estimated by Pierce County SWM. The most significant channel migration event occurred near the park entrance in 1990 after a series of moderate floods. The categorization of major flooding is based on a discharge greater than 15,000 cfs for the Nisqually River gauge near National, Washington. Historical Major Flooding on Nisqually River USGS 12082500 Nisqually River Near National, WA 75 Records From 1942 - 2017 Water Year
Date
Stream Flow (cfs)
2007
November 6, 2006
21,800
1996
February 8, 1996
21,200
1978
December 2, 1977
17,100
2016
December 9, 2015
16,700
1974
January 15, 1974
15,000
1990
January 9, 1990
14,500
2009
November 12, 2008
13,900
1976
December 4, 1975
13,200
1981
December 26, 1980
11,600
2015
November 25, 2014
11,500
1965
January 29, 1965
11,000
1991
November 24, 1990
11,000
1960
November 23, 1959
10,900
2003
January 31, 2003
10,800
1963
November 20, 1962
10,400
Probability of Future Hazards FEMA is updating the Nisqually River Flood Insurance Study at this time and released the hydrology report by their contractor STARR II in January 2019. The estimated peak flows for the Upper Nisqually reach for the 10-year, 50-year, 100-year and 500-year recurrence intervals of 12,900, 19,150, 22,500 and 30,000 cfs, respectively (STARR II 2019). Based on this estimate, the historical flow record, and the thresholds for moderate flooding (10,000-15,000 cfs) and severe flooding (greater than 15,000) (see section 3.9.3.1 below), the Upper Nisqually River can expect to experience moderate flooding every 10 to 25 years and severe flooding every 25-50 years, over a long-term period (URS 2012). FLOOD – PAGE 4-209 REGION 5 ALL HAZARD MITIGATION PLAN – 2020-2025 EDITION BASE PLAN
Upper Nisqually River Impacts Impact on Community There are no commercial or industrial properties in this area (URS 2012), therefore, a large flood event would not result in a major impact to the economy and tax base. However, the small percentage of resource lands may experience minimal economic loss if these areas are unable to be accessed or used during the flood and during the recovery period following the flood (URS 2012).
Land Purchases There have been no known land purchases or home buyouts by Pierce County in the upper Nisqually area since 1991. In 2006, the Nisqually Land Trust purchased 404 acres of timberlands and wildlife habitat in the upper Nisqually Valley, near the town of Ashford and the main entrance to Mount Rainier National Park.
River Management There is one levee/revetment in the upper Nisqually River owned and maintained by Pierce County Surface Water management. It is located near the entrance to Mt. Rainier National Park on the right bank, protecting both State Route 706 and Nisqually Park residences. There are also revetments and bank armoring at both road and rail crossings between Mt. Rainier National Park and Elbe, which are maintained by Pierce County Roads, WSDOT and Tacoma Rail. Additionally, there is armoring on the right bank at the entrance to Alder Lake, downstream of the State Route 7 Bridge.
Damage to Facilities The only flood control structure Pierce County owns on this reach is the Nisqually Park Entrance levee that extends into Mount Rainier National Park which protects the highway. Due to the high energy of the Nisqually River, the levee is consistently being repaired for loss of face and toe rock that has eroded away. In November 2006, Mt. Rainier experienced a record-breaking rain event resulting in severe flood damages throughout the National Park. Eighteen inches of rain fell in 36 hours near Paradise. One of the hardest hit areas was near the Nisqually entrance at the Sunshine Point Campground. More than 1,000 linear feet of levee was washed away. Damage to Facilities in the Upper Nisqually River 1990-2017 Storm Season
Bank
River Mile (RM)
Damage Lineal Feet
Damage
0
Gravel removal and dike construction.
219
Partial washout of the toe and levee facing.
1991 1991
Right
2003 2003
Right
64.7
FLOOD – PAGE 4-210 REGION 5 ALL HAZARD MITIGATION PLAN – 2020-2025 EDITION BASE PLAN
2003
Right
64.8
137
Partial washout of the toe and levee facing.
2003
Right
65.0
547
Partial washout of the toe and levee facing.
2004
Right
64.8
1200
Partial washout of the toe and levee facing.
2005
Right
65.1
850
Partial washout of the toe and levee facing.
2005
Right
65.13
70
Partial washout of the toe and levee facing.
2006
Right
64.6
200
Face erosion.
2006
Right
64.9
100
Washout.
Right
65.1 65.4
1600
Washout.
2008
Right
64.8
400
Toe scour and loss of face rock.
2008
Right
65.1 65.3
1150
Toe Scour and Loss of face rock.
2008
Right
65.3 65.4
600
Toe scour and loss of face rock.
Right
65.25 65.4
700
Severe toe scour.
2011
Right
64.6
150
Toe and face scour.
2011
Right
65.05 65.25
1100
Severe toe scour.
2012
Right
64.65
100
Active toe scour w/ face sloughing.
2012
Right
64.75
100
Active toe scour w/ face sloughing.
Right
64.85 65.05
1000
Severe toe scour and loss of lower face.
2015
Right
64.8
320
Missing face rock near toe.
2015
Right
65.4
300
Major toe scour along the road.
2004
2006
2006
2008
2010 2010
2011
2012
2012
2015
2017 2017
Right
65.4
300
Toe scour and loss of face rock.
2017
Right
64.77
90
Under cut toe, dislodged riprap, voids.
2017
Right
64.97
200
Toe rock failure.
2017
Right
65.02
30
Toe rock may be missing.
2017
Right
64.6
150
Toe rock has been scoured out.
FLOOD – PAGE 4-211 REGION 5 ALL HAZARD MITIGATION PLAN – 2020-2025 EDITION BASE PLAN
Mashel River The Mashel River sub basin, covering about 85 square miles, is higher in elevation and steeper than most other tributaries to the Nisqually River. Over 40 percent of the basin has slopes greater than 30 percent (Nisqually Basin Plan 2014). Major tributaries of the Mashel River are the Little Mashel River, Beaver Creek, and Busy Wild Creek. Elevations range from 460 feet at the mouth to 4,845 feet on the flanks of Mount Rainier. The Mashel River winds through a steep, sinuous canyon as it approaches the Nisqually River, where it enters at approximately RM 39.6. The Mashel River planning area is from the mouth of the Mashel River upstream to the Town of Eatonville (near RM 6.8). Land use consists of forested terrain, some agriculture (mostly livestock), rural residential development, and urban areas in the Town of Eatonville. Eatonville draws its drinking water from the Mashel River and the secondary-treated wastewater is discharged to the river downstream of the town. The Mashel River is the farthest upriver tributary to the Nisqually River that has anadromous fish use, including fall Chinook, coho, and pink salmon and winter steelhead trout.
FLOOD – PAGE 4-212 REGION 5 ALL HAZARD MITIGATION PLAN – 2020-2025 EDITION BASE PLAN
FLOOD – PAGE 4-213 REGION 5 ALL HAZARD MITIGATION PLAN – 2020-2025 EDITION BASE PLAN
Mashel River Extent and Occurrences Major flood events since 1991 have adversely affected transportation facilities and some private properties. There was channel migration in January 2009 along State Route 161 at the bridge crossing at RM 5.5 and downstream on the left bank from RM 5.2 to RM 5.3. Past flooding of the Mashel River occurred in 1946, 1996, 2007, and 2009 (see the table below). The magnitude of flood flows is not known for the period of 1958 to 1991, due to a data gap in the USGS gauge record. Major Flooding on Mashel River Date
Mashel River Flows near La Grand Gauge (cfs) – USGS #12087000
December 1946
6,859
February 1996
6,220
December 2007
5,790
January 2009
5,610
Probability of Future Hazards The Flood Insurance Mapping Study for the Mashel River (NHC, 2002) identified the following peak flows for the Mashel River from the USGS gage at RM 3.3 for the 10-year, 50-year, 100year and 500-year recurrence intervals, respectively: 4,995, 7,215, 8,250 and 10,900 cfs. There are no established thresholds for moderate and severe flooding for the Mashel River. During the past 20 years, peak flows over 5,000 cfs have occurred on three occasions as noted above. Based on the historical record, the February 1996 peak flow was between a 25- year and 50-year event, and the December 2007 and January 2009 peak flows were between 10- year and 25-year event (URS 2012). Generally, flooding occurs during late fall into early spring, particularly between the months of November and February.
Mashel River Impacts Impact on Community Commercial and industrial properties do not comprise a large portion of this area (less than one percent) (URS 2012). Therefore, a large flood event would not result in a major impact to the economy and tax base (URS 2012). However, lands used for recreation or resource land may experience some economic loss if these areas are unable to be accessed or used during the flood and during the recovery period following the flood (URS 2012). The sewer treatment plant for the Town of Eatonville is adjacent to the river. While the structures and facilities are two to six feet above the base flood elevation, they are less than 100 feet from the active channel and could be compromised if channel migration occurs on the right bank.
Land Purchases
FLOOD - PAGE 4-214 REGION 5 ALL HAZARD MITIGATION PLAN – 2020-2025 EDITION BASE PLAN
Pierce County has not purchased property in the Mashel River basin. However, the Town of Eatonville, the State of Washington, and the Nisqually Land Trust all own property along the Mashel River. The Land Trust owns 45 acres near Eatonville at Boxcar Canyon (purchased with Pierce County Conservation Future funds) and a 64-acre property that includes one mile of shoreline on the right bank of the Mashel River, downstream of the SR-7 crossing. The State of Washington and Washington State Parks and Recreation owns extensive property (over 1,000 acres) on the left and right banks of the lower Mashel River upstream of its mouth at the confluence.
River Management No flood control facilities are owned or maintained by Pierce County Surface Water Management along the Mashel River. Pierce County historically placed rip rap along the Mashel River near State Route 161 between RM 5.12 and RM 5.24. In 1950, a groin was built by dredging and straightening the river channel. A timber bulkhead paralleling the highway had become badly decayed and the river was eroding the highway causing PCRI to take action. The groin was heavily blanketed with rock from the Orting quarry (PCRI Annual Report 1950). The last documented action of PCRI rip rapping the Mashel River was in 1962. In the Town of Eatonville, riprap is present intermittently along both banks of the river from the wastewater treatment plant, located at RM 5.3, to the Alder Cutoff Road Bridge, located at RM 6.3. Rip rap protects the right bank from approximately 200 feet below the bridge to 50 feet above the bridge. The left bank has rip rap from approximately 50 feet below the bridge to 15 feet above the bridge. Much of the rip rap is old; however, WSDOT replaced rock on the right bank above the bridge and on the left bank upstream and downstream of the bridge in 2009. The town built a levee around the wastewater treatment plant following the 1996 flood. In 2004 log jams replaced rip rap on left bank in the vicinity of Smallwood Park, located at approximately RM 5.6, and at a private residence, located at approximately RM 5.33 (Watershed Professionals Network, LLC, 2004).
Damage to Facilities There is little historical information about damage to flood control facilities along the Mashel River. As noted above, Pierce County has no current river management facilities in the study area. WSDOT has several bridge crossings of State Route 161 and State Route 7, and revetments where the river flows adjacent to State Route 161.
FLOOD - PAGE 4-215 REGION 5 ALL HAZARD MITIGATION PLAN – 2020-2025 EDITION BASE PLAN
Health and Safety of Persons in the Affected Area at the Time of the Incident Flooding kills citizens throughout the United States every year. While that has not been a major problem in Pierce County over the years, it very well could happen with any major flood we have. The fact that Pierce County has had to do swift water rescues in the past with floods in both 1996, 2006 and 2015 shows the potential for life threatening situations to evolve during a flood. Pierce County streams and rivers run very fast and can quickly overwhelm individuals or vehicles caught in them. Persons caught in flood waters can be pinned under debris and drown. They can receive trauma from other debris being carried along by the river or by impacting rocks or other impediments in the river itself. During the fall and winter flood season, rivers and streams are comprised largely of cold rain and snow, and for those originating on Mt. Rainier, some glacier melt. They are therefore very cold. In addition, air temperature in the winter during flood season can also be in the thirty-degree range, although not usually below that during floods. The result is that persons caught in flood waters can drown not just from direct action of the flood but also as a complication of hypothermia. Figure 4.3-1 Nov. 2006 Flooding River Park Estates – Along Puyallup River
Other problems that can compromise a person’s health can develop after the flood waters have receded. Mold will grow in wet material, be it clothing, bedding, the walls of a house or the insulation under a floor. Sewage and hazardous chemicals may be present in homes, cars, or just as a layer coating peoples’ property. Water and food may be contaminated. Heat and electricity may be off for some time. All of these will contribute to a decrease in not just the quality of life for individuals, but also their current and long-term health.
FLOOD - PAGE 4-216 REGION 5 ALL HAZARD MITIGATION PLAN – 2020-2025 EDITION BASE PLAN
Health and Safety of Personnel Responding to the Incident Response to flooding is response in hazardous conditions. Whether one is attempting swift water rescue, adding sandbags to dikes, or cleaning up debris after the waters have receded, an individual is working in a hazardous environment. Impacts to responding personnel are similar to what can affect the citizens residing or working in the flood area. They include death from drowning and/or hypothermia, and either death or injury from trauma. Long-term, environmental hazards such as hazardous chemicals, sewage, etc. can cause illness, either acute or chronic.
Continuity of Operations and Delivery of Services Continuity of operations for most jurisdictions within Pierce County will not be compromised due to flooding. However, those that have their main administration or critical components of their operations within the flood zone could find their operational continuity at risk. If files, paper or electronic, are damaged or destroyed, an organization may not be able to: contact clients; assign work; complete scheduled jobs; meet deadlines; access, track, and pay accounts; or pay staff. Without a Continuity of Operations Plan (COOP) that takes these issues into account, they may not be able to operate in their normal mode. This would be especially true for those jurisdictions like Orting, Sumner, Puyallup or Fife that lie directly on the river, or have a significant portion of their infrastructure located close to the river. The delivery of services by the local jurisdictions and agencies within Pierce County is directly related to the degree of damage by the floods, to improved property, the infrastructure, and the areas in which the damage occurs. A flood that closes roads, either with water over the road or a washout, temporarily eliminates the ability of a local jurisdiction to repair other damaged infrastructure, respond to emergencies in the affected area, or deliver the other normal goods and services expected of it. Flooded electric substations, downed lines, contaminated wells, and broken pipelines all have the same impact. In all of these cases the delivery of services will be at least temporarily halted. Damage to facilities, equipment, or files all could impact the delivery of services to citizens from individual jurisdictions or agencies.
Public Confidence in the Jurisdiction’s Goverance The reputation of any individual jurisdiction within Pierce County or the public’s confidence in the jurisdiction is highly dependent on the public’s perception on how well the response and recovery were handled during and after the flood. A response that either shows or gives the impression that a jurisdiction is prepared and responsive to the public’s needs and manages a recovery to gets services back and damage repaired in a timely manner will enhance a jurisdiction’s reputation. If however, the perception develops, rightly or wrongly, that the jurisdiction is incompetent, slow to react, or ignores the needs of its citizens, then the reputation of the jurisdiction and the confidence in its abilities will decline.
Economic Conditions In 2010, Pierce County Surface Water Management had an Economic Analysis conducted by Entrix that supported the 2013 Pierce County Rivers Flood Hazard Management Plan. This FLOOD - PAGE 4-217 REGION 5 ALL HAZARD MITIGATION PLAN – 2020-2025 EDITION BASE PLAN
analysis focused on the 100-year floodplains of two river systems, its tributaries, and the large streams within the Planning Area. The report examined (1) existing socioeconomic conditions, (2) flood impacts to regional economic activity, (3) property damage, (4) transportation impacts, (5) wastewater treatment plant impacts, and (6) recreation impacts related to closures of Mt. Rainier National Park and Crystal Mountain. Pierce County faces the threat of significant impacts from flooding with potential flood related losses in excess of $725 million from a 100year or larger flood (Entrix 2010). Over 21,000 people live in the floodplain in 9,340 homes. Businesses located within the flood plain provide 11,800 jobs. There are three wastewater treatment plants serving 216,000 people located in the floodplain. The study summarized a range of estimates of economic impacts that were quantified, with both a low and high estimate, as follows: • • • • • •
Property damage is estimated to be between $199 and $520 million. Loss of business revenue from disruption or closure ranges from $13 to $46 million, depending on the number of days of closure. Delays in transportation network caused by road and rail closures are estimated to be between $12.6 and $19.3 million. The estimate of losses in agricultural output ranges between less than $1 to $20 million. Flood damage at wastewater treatment plants is estimated to be between $3 and $128 million. Lost revenue and income due to closures of Mt. Rainier National Park and Crystal Mountain Ski Resort is estimated to be between $1 and $14 million.
Surface Water Management will be updating the Pierce County Comprehensive Flood Hazard Management Plan in 2023. As a part of the update, a new economic analysis will be conducted.
Environmental Impacts Minimizing Water Quality Impacts of Flooding Three issues relate to flooding that affect aquatic life, ecosystem health and clean water. First, sources of pollution including chemicals, pesticides, fertilizers, metals, petroleum-based products, hazardous waste, and animal waste have the potential to contaminate flood waters when mobilized during flood events. This can be from improperly stored waste in the floodplain, or properly stored waste that is displaced due to flood flows. Locations of chemical or waste storage can include houses, garages, outbuildings, barns, and commercial and industrial businesses and a broad range of agricultural, residential, commercial, and industrial land uses. Second, septic systems and drain fields in floodplains are at risk of inundation and failure from floodwaters. Third, flood waters can erode and mobilize large amounts of sediment from watershed sources, instream and bank erosion that is later deposited downstream in rivers, floodplains, or Puget Sound. While some amount of sediment transport is natural and beneficial, excess sediment can degrade water quality and habitat. Once chemicals, waste or other pollutants are mobilized by floodwaters the result can be degraded water quality conditions, toxic effects on fish and other aquatic biota, and habitat impacts. The proper storage, handling, and management of chemicals, waste and other pollutants FLOOD - PAGE 4-218 REGION 5 ALL HAZARD MITIGATION PLAN – 2020-2025 EDITION BASE PLAN
is necessary to protect aquatic resources from adverse impacts. Components of a program to address these issues include education of citizens and businesses, technical assistance, best management practices, and regulation. New development requirements prevent the construction of septic systems and drain fields in floodplains, but pre-existing systems remain a problem in some areas. Such systems need to be carefully managed to reduce risks to water quality. Sources of excess sediment include watershed sources such as urban areas, agricultural activities, construction sites, and logging, as well as instream and bank erosion along rivers. Erosion control best management practices and stabilization of excessively eroding river banks can help reduce sediment sources.
Impacts on Water Quality, Fish and Wildlife, and Habitat Water quality degradation can result from numerous pollutant types, including oxygen demanding materials (e.g., organic wastes), sediment, nutrients (phosphorus, nitrogen), metals (copper, zinc), trace organics (e.g., pesticides, fuels, oils and automobile products), and bacteria. Discharge of pollutants to receiving waters during flooding can cause violation of water quality standards, acute effects on fish and other aquatic biota, and impacts on habitat. Impacts on aquatic species can lead to direct mortality from acute effects at toxic levels or chronic effects from sustained exposure to elevated levels of pollutants. For example, elevated levels of copper can impair olfaction (sense of smell) in salmon and impair the behavior of fish, in terms of their ability to migrate, feed, or detect predators. Water quality degradation can also reduce the diversity and abundance of aquatic insects and other stream biota, shifting to species that are more pollutant-tolerant. Examples of habitat impacts include sedimentation of spawning areas, or reduction of dissolved oxygen levels in water or interstitial areas of gravel.
Repetitive Flooding In the last twelve years, the county experienced three major floods with November 2006 and January 2009 events receiving a presidential disaster declaration and the November 2008 flood largely overshadowed by the flood two months later. 2014 and 2015 had moderate flooding that increased FEMA’s listing of repetitive loss properties even though Pierce County has an active program removing flood prone structures. In the January 2018 publication from FEMA, there were 32 repetitive loss properties (two insurance claims of $1,000 or more in a ten-year period) with four of them meeting the severe repetitive loss (SRL) definition (four claims with the combined value at more than $20,000). The county has mitigated one property since this list was created and has recently purchased another home that will be removed from the FEMA list in the Clear Creek area. This brings the total of purchased homes to over 450 since SWM’s buyout program began with just 31 being on the FEMA repetitive loss list. The county has five primary repetitive loss areas where many properties have experienced flood losses in the last twenty years. These areas are: Clover Creek near Parkland, Coastal Dash Point, Mid Puyallup River south of Sumner, South Prairie Creek and Clear Creek behind the River Road levee. While FEMA has a list of homes where property owners had purchased flood insurance to mitigate the cost of cleanup and repairs, there are many more homes were flood FLOOD - PAGE 4-219 REGION 5 ALL HAZARD MITIGATION PLAN – 2020-2025 EDITION BASE PLAN
insurance may not have been purchased or was purchased after the “big” flood. This means that homes will continue to be added to FEMA’s repetitive loss list until the area can be mitigated. The county intends to contact all flood prone properties, not just the ones on the FEMA repetitive loss list. This will be done through annual postcard notices that direct the recipient to learn more about their individual property by contacting the county. Once contacted, the county can discuss flood risk, mitigation and funding options. In the last four years this method has become more targeted to the flood risk (coastal, riverine, urban, and groundwater) which resulted in over 600 responses to last year’s postcard campaign. SWM has received a written request to be bought-out by 46 properties with one of these currently on the FEMA repetitive loss list.
Additional Flood Hazards in Pierce County Coastal Flood Hazard Pierce County has 123 miles of coastline that is predominantly high bank with a limited amount of low bank properties. The 2017 FEMA flood insurance rate map (FIRM) includes the first comprehensive coastal flood study of Puget Sound. 79 percent of the marine shoreline is mapped as a high hazard velocity zone where high waves can cause direct damage or erosion to structures. Chronic coastal flooding currently happens during high tide events that combine with wind events with Dash Point and Purdy seeing flooded structures, roads and parking lots. The latest NOAA guidance estimates sea level to be five feet higher in the next 80 years. High coastal bank and bluffs can have coastal erosion lead to landslides and cause damage to properties both above and below the bank. This type of damage has been limited in the past but could increase with sea level rise.
Urban/Stream Flood Hazard Urban flooding has a large stormwater runoff component. Within the urban growth areas drainage and creek systems can experience flash flooding events intensified by land cover changes. Stormwater runoff also has water quality concerns for human and aquatic health.
Groundwater Flooding Pierce County was at the terminus of the last ice age and the glaciers left a mix of well-draining soils and nearly impervious hard till and clay. This geology results in pockets of groundwater flooding where underlying soils fill up after extended periods of rain and pool to the surface in low lying well-draining soils. Between Graham, Fredrickson and Spanaway, groundwater will move in a west-northwesterly direction until it reaches Puget Sound. Groundwater flooding generally occurs after above average rainfall from October to December and then surfaces from March to May in old glacier oxbows.
Community Outreach Pierce County has conducted education and outreach efforts for many years to inform parcel owners and property dwellers of the importance of flood insurance and flood preparedness. These efforts have been both stand-alone campaigns and part of larger campaigns to raise FLOOD - PAGE 4-220 REGION 5 ALL HAZARD MITIGATION PLAN – 2020-2025 EDITION BASE PLAN
community awareness to prepare for significant weather events and natural disasters. Each year, Pierce County Surface Water Management sends notifications about flood insurance and flood risk to more than 19,000 addresses that are in the county’s floodplains. Postcards are mailed out the first week of October and reminder postcards are sent out shortly after. The postcards inform residents of the free services Surface Water Management offers, such as flood maps for parcels, copies of existing elevation certificates, and ways to mitigate flood risk and lower premiums. Surface Water Management also provides information on its website about flood insurance and flood preparedness.
Implementation and Partnerships Flood Control Zone District RCW 86.15.025 gave the Pierce County Council the authority to establish either countywide or a basin-level flood control zone district (FCZD) that creates additional opportunities for new, dedicated funding sources. On April 3, 2012, the Pierce County Council passed Ordinance 201195s, creating the Pierce County Flood Control Zone District (FCZD). The purpose of the FCZD is to construct, operate, and maintain flood control projects to reduce flooding and channel migration risks. The district is governed by a Board of Supervisors and an Executive Committee with input and recommendations from an Advisory Committee. Funding for the FCZD comes from a countywide property levy. Since 2014, SWM has received an estimated $11 million for capital projects from the FCZD to reduce flood risk and address channel migration problems.
Floodplains for the Future Floodplains for the Future is a cross-sector and inter-organizational partnership in the Puyallup watershed. 22 partner organizations meet to plan, fund, and implement floodplain projects to attain the shared vision of restored connections between rivers and land to improve habitat for salmon, and protect communities and infrastructure from flooding while preserving agricultural lands. Partners include: • American Rivers • City of Orting • City of Puyallup • City of Sumner • Floodplains by Design • Forterra • King-Pierce Farm Bureau • Muckleshoot Indian Tribe • PCC Farmland Trust • Pierce Conservation District • Pierce County • Pierce County Agricultural Program • Port of Tacoma • Puget Sound Partnership • Puyallup Tribe of Indians • Strategic Conservation Partnership FLOOD - PAGE 4-221 REGION 5 ALL HAZARD MITIGATION PLAN – 2020-2025 EDITION BASE PLAN
• • • • • •
South Puget Sound Salmon Enhancement Group The Nature Conservancy UW Climate Impacts Group Washington State Department of Ecology WRIA 10/12 Lead Entity WSU Extension
Some of the projects that this group is working on are: Orville Road Protection project, Clear Creek Floodplain Reconnection project, Neadham Road Acquisition and Revetment, South Prairie Creek Restoration Project, Alward Road Acquisition and Floodplain Restoration, Pacific Point Bar, Ball Creek, White River 24th Street Point Bar, and South Fork Side Channel Reconnection Project. For additional information, please visit: https://floodplainsforthefuture.org/
FLOOD - PAGE 4-222 REGION 5 ALL HAZARD MITIGATION PLAN – 2020-2025 EDITION BASE PLAN
Meteorological Severe Weather 4.4M Definition162 Severe weather includes a variety of meteorological phenomena that are detrimental to citizens and or infrastructure in the County. These atmospheric disturbances are usually characterized by strong winds frequently combined with rain, snow, sleet, hail, ice, or lightning. This definition includes unusual weather disturbances such as tornadoes or waterspouts, which appear infrequently in Pierce County. In addition, any heavy fall of snow or rain might be considered a severe storm in its own right. Secondary hazards or impacts that can result from severe storms include flooding (see Flood Hazard Chapter of the HIRA), landslides (see Landslide Hazard Chapter of the HIRA), power outages (see Energy Emergency Hazard Chapter of the HIRA), and closed transportation routes limiting emergency response, pollution, and environmental damage (see Transportation Accidents Hazard Chapter of the HIRA). This chapter will not cover rainstorms since the primary hazards that occur from heavy rain are flooding, landslides and erosion; the effects of rain will be covered in the chapters on flooding and landslides.
Types163 Hail Hailstorms occur when freezing water in thunderstorm clouds accumulates in layers around an icy core. Hail can cause damage by battering crops, structures, automobiles and transportation systems. While the County does get occasional hailstorms, they seldom include hail stones large enough to cause major damage. However, when hailstones are large,164 especially when combined with high winds, damage can be extensive.
Ice Storms Ice storms occur when rain falls out of the warm, moist upper layer of atmosphere into a belowfreezing, drier layer near the ground. The rain freezes on contact with the cold ground and other surfaces. It accumulates on exposed surfaces such as trees, roads, houses, power lines, etc. The accumulated weight of this ice, especially when accompanied by wind, can cause damage to trees and utility wires. Ice storms are usually of short duration from several minutes to a few hours. However, the danger left behind will last until a rising temperature allows for thawing.
Snowstorms Snowstorms or blizzards, which are snowstorms accompanied by high wind and/or poor visibility, occur occasionally in the County. A snowstorm including warmer moist air from the Pacific Ocean, overrunning existing cold, subfreezing air could continue to drop snow for several days.
SEVERE WEATHER - PAGE 4-223 REGION 5 ALL HAZARD MITIGATION PLAN – 2020-2025 EDITION BASE PLAN
Thunderstorms severe thunderstorm produces a tornado, winds of at least 58 mph (50 knots), and/or hail at least 1" in diameter. Structural wind damage may imply the occurrence of a severe thunderstorm. A thunderstorm’s wind equal to or greater than 40 mph (35 knots) and/or hail of at least 1" is defined as approaching severe. Lightning is a visible electrical discharge produced by a thunderstorm. The discharge may occur within or between clouds, between the cloud and air, between a cloud and the ground or between the ground and a cloud.
Tornadoes and Waterspouts Tornadoes are the most violent weather phenomenon known. Their funnel shaped clouds rotate at speeds up to 300 miles per hour or more, and large ones may affect areas from one-quarter to a mile and a half in width, see Table 4.9-1. They may travel for some distance although seldom more than 15 miles. Table 4.9-1 The Enhanced Fujita Tornado Damage Scale Tornadoes are produced by strong WIND EST. SCALE TYPICAL DAMAGE (MPH) thunderstorms. Such F0 65-85 Minor damage. Peels surface off some roofs, some thunderstorms can also damage to gutters or siding, branches broken off trees; produce large hail, heavy rain shallow- rooted trees pushed over. and strong sustained winds EF1 86-110 Moderate damage. Roofs severely stripped, mobile homes overturned or badly damaged, loss of exterior over a larger geographic area. doors; windows and other glass broken. A waterspout is a tornado EF2 111-135 Considerable damage. Roofs torn off welloccurring over water. constructed houses; foundations of frame homes shifted, mobile homes completely destroyed, large Specifically, it normally trees snapped or uprooted; light-object missiles refers to a small, relatively generated; cars lifted off ground. weak rotating column of air EF3 136-165 Severe damage. Entire stories of well-constructed houses destroyed; severe damage to large buildings over water beneath a such as shopping malls; trains overturned; heavy cars towering cumulus cloud. lifted off the ground and thrown; structures with weak
Windstorms
EF4
166-200
foundations blown away some distance. Extreme damage to near total destruction. Wellconstructed houses and whole frame houses completely leveled; cars thrown, and small missiles generated. Massive damage. Strong frame houses leveled off foundations and swept away; steel-reinforced concrete structures critically damaged; high rise buildings have severe structural deformation. Incredible phenomena will occur.
There are four main types of windstorm tracks that impact EF5 >200 the Pacific Northwest and Pierce County as identified in Figure 4.9-1. From these systems two basic windstorm patterns have emerged that impact Pierce County. These are the south-wind event and the eastwind event; see maps Map 4.9-1 and Map 4.9-2. South-wind events are generally large-scale events that affect large portions of not only Pierce County, but also most of Western Washington and possibly Western Oregon. The East Wind events and South Wind events outlined below are the typical windstorms in Pierce County that cause damage. Wind speeds vary and are noted on the maps and the following occurrences table. South-wind events are generally large-scale events that affect large portions of not only Pierce County, but also most of Western Washington and possibly Western Oregon. In occasional cases, they may even affect areas as far south as Northern California. South-wind events, due to funneling effects, can reach up to 100 mph in SEVERE WEATHER - PAGE 4-224 REGION 5 ALL HAZARD MITIGATION PLAN – 2020-2025 EDITION BASE PLAN
confined areas such as the Tacoma Narrows. In contrast, east-wind events are more limited. High pressure on the east side of the Cascade Mountain Range creates airflow over the peaks and passes, and through the funneling effect of the valleys, the wind increases dramatically in speed. As it descends these valleys and then exits into the lowlands around Enumclaw and Buckley, the wind can pick up enough speed to damage buildings, rip down power lines, and destroy fences. Once it leaves the proximity of the foothills the wind tends to die down rapidly causing little damage to the rest of the County. While these are the primary wind events to cause damage within the County, they are not the only problem. A strong north wind event combined with a higher than normal tide can cause coastal flooding along the County shorelines and can push extra water into the lower reaches of the Puyallup River. Localized geographic conditions can exacerbate the problem, causing an increase in wind intensity. Ridges, valleys, mountains, and even large buildings can redirect wind flow and cause local variations in damage.
SEVERE WEATHER - PAGE 4-225 REGION 5 ALL HAZARD MITIGATION PLAN – 2020-2025 EDITION BASE PLAN
Figure 4.9-1 Windstorm Tracks165
Profile Location and Extent Severe weather of all types directly and indirectly affects the County. Due to variations in geographic location and elevation, certain areas of the County are more vulnerable to certain types of severe weather, including: windstorm, snowstorm, and ice storm. Maps are currently available that depict wind events. Maps 4.9-1 and 4.9-2 show the severe windstorm hazard for Pierce County as depicted in South Wind Event and the East Wind Event. Windstorms directly and indirectly affect all of Pierce County. The maps show Pierce County and the extent of severe windstorms with predominant wind direction
SEVERE WEATHER - PAGE 4-226 REGION 5 ALL HAZARD MITIGATION PLAN – 2020-2025 EDITION BASE PLAN
Map 4.9-1 Pierce County Severe Weather Wind Hazard—South-Wind Event166
SEVERE WEATHER - PAGE 4-227 REGION 5 ALL HAZARD MITIGATION PLAN – 2020-2025 EDITION BASE PLAN
Map 4.9-2 Pierce County Severe Weather Wind Hazard—East Wind-Event167
SEVERE WEATHER - PAGE 4-228 REGION 5 ALL HAZARD MITIGATION PLAN – 2020-2025 EDITION BASE PLAN
Occurrences Historically, over the years Pierce County has had several instances of severe weather. While not all of these have caused major long-term problems, they all have disrupted people’s day-to-day activities and posed a burden, especially on the poor and elderly. Table 4.9-2 lists some of the other notable severe storms (weather) in Pierce County. Table 4.9-2 Notable Severe Weather in Pierce County
DATE
DESCRIPTION HAIL National Weather Service has a report of hail between ¾” and 1” in the Cascades of eastern Pierce County. While hail has been a regular addition to thunderstorms in the Puget Sound basin, and have caused minor damage, there are no major hailstorms that have had hail large enough in the populated areas to cause enough damage for a major declaration. ICE STORMS
June 2007
January 2011 December 1996February 1997 (Federal Disaster #1159)
February 8-24, 2019
January 14-23, 2012 (Federal Disaster #4056)
December 12, 2008 – January 5, 2009 (Federal Disaster/Emergency #1825)
November 27, 2006 January 9-10, 2006
A series of winter storms delivered snow, freezing rain, warm rain and wind to the west coast producing floods, snow and ice damage, and landslides. SNOWSTORMS Winter Storm Maya brought 8-24 inches of snow for nearly two weeks in WA. Governor Inslee signed an emergency proclamation that encompassed all counties on Feb. 8. The Pierce County EOC was activated to level two (virtually), the County Planning and Public Works Department plowed 24/7 until the storms end, and the search and rescue 4x4 team transported over 130 hospital staff, 911 dispatchers, and public works staff who were running the snow plows within seven days. From Feb. 8-9 six to twelve inches of snow fell in the County. In Puyallup there was twelve inches of reported snow and Lakewood and Tacoma reported eight inches of snow. ‘Snowmageddon’ resulted in heavy snow and local high winds, causing damage of more than $32 million. A cold snap with multiple days of snow closed roads and eventually a record snow event was declared with a snow emergency declared for the County. Up to six inches fell throughout the County, followed by two days of sub-freezing temperatures. Up to seven inches fell throughout the County, followed by two days of sub-freezing temperatures.
SEVERE WEATHER – PAGE 4-229 REGION 5 ALL HAZARD MITIGATION PLAN – 2020-2025 EDITION BASE PLAN
January 2004 November 19-21, 1996 (Federal Disaster #1152)
November 17, 1985 February 1980 January 9, 1980 January 1972 November 21,1960 March 5, 1960 January 16, 1950 February 1, 1916
September 7, 2019
May 9, 2017
October 11, 2014 April 27, 2014 September 6, 2009 February 19, 2007 June 18, 2002 September 27 2001 May 31, 1997
Successive snowfalls and freezing causes EOC activation and closure of Pierce County government due to severe weather conditions. 5.5 inches recorded in Tacoma, up to 12 inches recorded in southern areas of County. Up to 12 inches of snow, knocking out power, causing road, school, and business closures. A snowstorm combined with a cold spell lasted for over a week causing power outages, traffic congestion, broken pipes, and allaround havoc with the normal day-to-day business of the County. Significant snowfall. Up to15 inches of snow fell throughout the County. Snowing in the County with drifts up to four feet. Winds with the snow were clocked at 25 mph. Up to seven inches of snow fell throughout the County, knocking out power. Up to seven inches of snow fell throughout the County. Tacoma had drifts up to twelve feet. Economic loss in the County ran into millions of dollars. From two to four feet of snow fell throughout Western Washington. THUNDERSTORMS The National Weather Service counted more than 2,200 cloud-toground lightning strikes in the Puget Sound area between 6 p.m. and 11 p.m., a rate of 440 an hour. The Washington State Fair was evacuated, and no injuries were reported within the County. Lightning struck Good Samaritan Hospital Dally Tower in Puyallup. One of the 800 MHz phones was rendered inoperable leaving only two to communicate with EMS, other hospitals, and the Pierce County EOC. TORNADOES AND WATERSPOUTS Waterspout off Anderson Island in South Puget Sound never hit land and lasted for a couple of minutes. A tornado (EF0), maximum width of 25 yards, touched down in Eatonville for less than a minute. Estimated peak wind speed was 75 mph. A tornado (F1-high end) touched down at Lake Tapps and continued in a NE direction for 9.6 miles with winds from 100-110 mph. A funnel cloud was reported near Orting. It did not touch down. A funnel cloud was recorded in the Gig Harbor area. It did not touch down. This F1 tornado began as a funnel cloud over the Puyallup Valley and then moving to the NE touched down in the Bonney Lake area. A tornado (F1) touched down in south Tacoma near the Tacoma Mall, damaging a church, power lines, and few other buildings.
SEVERE WEATHER – PAGE 4-230 REGION 5 ALL HAZARD MITIGATION PLAN – 2020-2025 EDITION BASE PLAN
June 23, 1996 September 24, 1981 June 12, 1978 October 5, 1899168
January 5-6, 2019
January 7, 2007 December 14, 2006 (Federal Disaster #1682) Hanukkah Eve Windstorm of 2006
November 12-15, 2006 February 17, 2006 December 25, 2005 December 2003
December 1995 March 1995 January 1993
A tornado (F0) touched down in north Tacoma running north into Ruston, damaging some homes, downing a number of trees and breaking power lines. A tornado touched down at Gray Field on Ft. Lewis. A tornado touched down in E. Tacoma and at Ft. Lewis. A tornado devastated a tract of land from 300 to 600 yards wide from Mossy Rock and Osborne in Lewis County to Orting. The storm was strong enough to uproot old growth forest. WINDSTORMS South windstorm with gusts more than 50 mph left 20,000 customers without power when a large tree knocked out the Tacoma Public Utilities substation in Graham. Temperature high was 52 degrees F and the low 36. The City of Orting was hit particularly hard and opened a charging center at their City Hall during the day. Windstorm came into Washington causing minor damage in Pierce County but major damage to isolated counties such as Chelan County. South-wind event, serious damages throughout Western Washington. Over 1,500,000 people were without power, some as long as 10 days. Major tree and electrical damage. Damaging winds up to 86 mph on coast and 60 mph around western interior. Power was out to over 100,000. East-wind event, localized to Pierce County, produced sustained winds of 40-50mph for 18hrs, knocking down trees and power lines and causing over $4,000,000 in public damage alone in the County. Christmas Day Gale had winds of 40+ mph recorded at a number of weather stations in Pierce and other counties in W. Washington East-wind event causes downed trees, power outages, and damage to property in Buckley, Eatonville, Bonney Lake and surrounding areas. Sustained winds of 60 mph and gusts up to 80 mph. Windstorms starting in Northern California generated winds in excess of 100 mph and continued to the north into Canada causing three states, including Washington, to issue disaster proclamations. Windstorms created multiple power-outages and downed trees. Inauguration Day Storm.
(Federal Disaster #981)
November 1981 October 1962 (Federal Disaster #137)
November 1958 November 7, 1940
High winds in Western Washington. Columbus Day Storm recorded winds up to 88 mph in Pierce County. This was less than in some other areas. Maximum wind speed in other areas reached as high as 150 mph. Strongest recorded windstorm in Pierce County History causing extensive damage throughout the County. High winds in Western Washington. Tacoma Narrows Bridge blown down.
SEVERE WEATHER – PAGE 4-231 REGION 5 ALL HAZARD MITIGATION PLAN – 2020-2025 EDITION BASE PLAN
Recurrence Rate Based on the previous history of severe weather that has impacted Pierce County and information from the National Weather Service169 it was determined the probability of recurrence for the severe storms hazard in Pierce County to be five years or less occurrence.
Hail To date (2019) the various hailstorms in the County have caused limited damage to some of Pierce County’s agricultural products. The only reported hailstorm with hail large enough to have caused extensive damage in the past was located in the Cascades. Minor hailstorms happen on almost a yearly basis somewhere in the County. Since large hail is such a rare occurrence it is listed as a 100 year or less occurrence.
Ice Storms The record shows only a single significant ice storm in the past 100 years. It was therefore determined the probability of recurrence as 100 years or fewer occurrences.
Snowstorms Table 4.9-1 lists 15 significant snowstorms in the past 100 years. Taking this as an average it was determined that snowstorms of consequence happen as a ten year or less occurrence.
Thunderstorms Thunderstorms occur almost every year. The frequency in which there is an impact to people, property, or the environment has been a larger focus in recent years especially now that we are experiencing a drought and wildfires are a big concern. However, due to the lack of data collection on this hazard, it is an estimated five year or less reoccurrence.
Tornadoes While not as frequent as windstorms, there have been seven recorded tornadoes in the past 120 years. Given this frequency, it was determined the probability of recurrence as 20 years or less.
Windstorms Wind has played a prominent role in the history of emergencies and disasters impacting communities within Pierce County. Major events, see Table 4.9-1, have occurred 13 times during the past 70 years and caused millions of dollars’ worth of damage. Pierce County can expect some wind-related problems on an annual basis, although few of these cause extensive damage. Based on the historical frequency of large windstorms it was determined the probability of recurrence as 10 years or less.
SEVERE WEATHER – PAGE 4-232 REGION 5 ALL HAZARD MITIGATION PLAN – 2020-2025 EDITION BASE PLAN
Impacts As can be seen above, the impacts from severe weather can be largely dependent on the type of incident. Since the severe weather can range from snowstorms to tornadoes each one is factored out in this section.
Health and Safety of Persons in the Affected Area at the Time of the Incident Hail Over the years, hail has not been a major factor in Pierce County. While injury and even death to people and animals that are in the wrong spot at the wrong time can occur, the size of hail that impacts Pierce County is usually too small to cause injury or death. While the damage to crops, cars and other items out in the weather can be dramatic, direct impacts to people in the affected areas of Pierce County are usually limited to minor stings and bruises. However, should a hailstorm with large hail stones occur, individuals could be injured and in rare instances killed. Ice Storms and Snowstorms Figure 4.9-2 Snowstorm 01/2004 Downtown Tacoma
Direct impacts from ice storms and winter storms can include injuries such as hypothermia, frostbite, falls, blunt force trauma from falling debris or death. Accidents can occur when people walk on icy walkways or on the ground. Transportation accidents increase drastically with icy roads. In addition, the overload of ice on trees or utility wires can cause limbs or wires to break. These can fall on individuals, automobiles, or homes causing traumatic injuries or death. In the case of downed utility wires, fires can start or individuals could be electrocuted. Direct impacts on the general public can be especially prevalent in the residentially challenged individuals (formally known as homeless), older adult populations and any persons who lose heat and power for extended periods of time. There is an increase in injuries and deaths from accidents and in some cases increases in heart attacks from individuals attempting to shovel snow from walkways and driveways. Individuals on home-based life support systems could be adversely impacted by the power outages if they do not have a backup power system. Depending on the depth of the snow, the length of time it stays around, and the number of downed tree limbs, or trees in lines, road closures could isolate some individuals; possibly for days.
SEVERE WEATHER – PAGE 4-233 REGION 5 ALL HAZARD MITIGATION PLAN – 2020-2025 EDITION BASE PLAN
A combination of the cold and lack of power will force many people to find alternate ways of cooking and heating. Those who attempt to cook or heat with barbecue grills, hibachis or portable generators inside any building run the risk of carbon monoxide poisoning leading to brain damage and death. Access to public transportation, shelters, stores and businesses, healthcare facilities, and government services can all be compromised due to snow; see Figure SW-2. In many cases the hills and slopes of many of the roads and streets restricts individuals’ movements. This remains the case until road crews can sand and plow roads. Thunderstorms Lightning is one of the leading causes of weather-related fatalities. But the odds of being struck by lightning in a given year are only around 1 in 500,000. However, some factors can put you at greater risk for being struck. Regional, seasonal, and occupational differences affect your risk of being injured by lightning. Lightning can occur during any time of the year, but lightning casualties are highest during summer. July is generally the month with the most lightning. Lightning strikes often occur in the afternoon. In fact, two-thirds of all lightning casualties occur between noon and 6pm. Lightning most often strikes people who work outside or engage in outdoor recreational activities. More than a third of lightning strike deaths occur on farms. Other common places are industrial locations and private residences. Construction and material handling such as loading and unloading are two of the most common work-related activities where lightning strikes occur.170 Tornadoes and Waterspouts Most tornadoes that have historically impacted Pierce County have been rather small. The exception is the October 1899 tornado. The results of any tornado can be devastating to those caught in one. However, the number of people injured or killed and the number of houses, businesses, community facilities, etc. destroyed or damaged varies dramatically depending on the size of the tornado, where it touches down, and how long it is in contact with the ground or water. As we often see in the Mid-west, persons caught in a tornado can expect flying debris and collapsing buildings as the main cause of injury and Figure 4.9-3 Satellite Image Hanukkah Eve Windstorm death. Windstorms Windstorms are one of the emergencies that impact all of Pierce County on a regular basis. Some are much more damaging than others. For those like the Hanukkah Eve Windstorm of 2006, see Figure 4.9-3,171 the impact on the public can be very severe.
SEVERE WEATHER – PAGE 4-234 REGION 5 ALL HAZARD MITIGATION PLAN – 2020-2025 EDITION BASE PLAN
Individuals can be hit by flying debris or falling limbs and trees. During past windstorms cars have been crushed and houses split by falling trees. Individuals can suffer injury or death. Downed wires have been known to electrocute individuals, as happened in Gig Harbor in the Hanukkah Eve Windstorm of 2006. Large numbers of power lines down, combined with trees and limbs on roads can keep fire, medical and law enforcement personnel from responding to incidents. During heavy wind first responders may have to wait until the wind abates before being able to respond to calls.
Health and Safety of Personnel Responding to the Incident Hail First responders have very similar safety and health concerns to those of the general public regarding hail. Ice Storms and Snowstorms First responders can expect similar injuries as the general public. First responders operating in the hazardous environment of an ice or snowstorm have the potential to get cold related injuries if they are not adequately protected from the elements. Due to the amount of time spent on snow covered roads responding to storm related problems, they also have a potential for traffic accidents. Road crews will have to be careful of downed lines and work in conjunction with utility workers to open roads. Thunderstorms The potential impact to first responders is the same or lesser than persons affected at the time of the incident. First responders are very efficient in transporting affected persons to medical facilities and therefore would be spending a considerable amount of time in their vehicles which provides a layer of protection. Tornadoes During the actual tornado itself, responders are like any other citizen. They are as likely as anybody else to be injured or killed by the storm. The Greensburg Kansas tornado, see Figure 4.9-4, gives a good impression of what can happen as a tornado passes through a community. Once the tornado has passed however, they will enter the area where the damage has occurred. With a large tornado this puts them in a hazardous area. They could be exposed to live electric wires, hazardous chemicals, and unstable debris.
SEVERE WEATHER – PAGE 4-235 REGION 5 ALL HAZARD MITIGATION PLAN – 2020-2025 EDITION BASE PLAN
Figure 4.9-4 Before/After Tornado Damage Greensburg, KS 05/04/07172
Windstorms First responders will be putting themselves in harm’s way throughout windstorm incidents. They can be hit by flying or falling debris as well as coming in contact with downed power lines. Response vehicles have been crushed and over the years there are the occasional injuries. In the aftermath of the windstorm, first responders by the nature of their work are putting themselves in harm’s way.
Continuity of Operations and Delivery of Services Hail Hail has not traditionally caused more than the most minor slowdown of any public services within the boundaries of Pierce County. Due to the shortness and small size of the normal hailstorm it is not expected to disrupt any organizations continuity of operations or the delivery of services to the public for more than a short period of time. Should there be an increase in size of the hail stones and an increase in the length of the storms then damage might begin to appear on equipment, facilities, vehicles and people. Ice Storms and Snowstorms While ice storms themselves tend to last only a few hours at the most, the after affects can last for days or weeks. The actual problem with iced roads, falling branches, and other types of damage will continue until the temperature warms enough for the ice to melt. In a situation where the temperature remains below freezing for a long period of time there may be continuity of operations problems for local jurisdictions or agencies. Local jurisdictions and agencies with limited or small staffing following the event could cause their operations to lapse for short periods. Both an ice storm and snowstorm can slow down and, in some cases, halt the delivery of services over the entire County and for any jurisdictions or agencies located within its borders. Ice or snow coated streets do not allow the normal movement of emergency vehicles of any type within their normal response times, so the delivery of all types of services will be slower than normal or SEVERE WEATHER – PAGE 4-236 REGION 5 ALL HAZARD MITIGATION PLAN – 2020-2025 EDITION BASE PLAN
even non-existent until such time as the streets are once again passable. Government offices, schools, businesses and services might be shut down for days. A few days following Winter Storm Maya in February of 2019, the Pierce County Auditor’s Office had a special election. Luckily many roads were passible and the snow was quickly melting but if the storm had lasted any longer or if temperatures were not high enough to melt the snow, the Auditor’s Office would have been responsible to ensure voters had access to the election center or possibly postpone the election (this can only be done if certain conditions and thresholds are met). Keeping jurisdictions or agencies operations going is one aspect but making sure that the services you provide are accessible and doesn’t infringe on person’s rights is a complex issue and should be considered with all hazards. Thunderstorms Lightning strikes can cause short-term disruptions of services or close the State Fair early. Continuity of operations from a jurisdictional level will not be impacted as greatly as a small agency or business that doesn’t have additional resources outside of their single location. Communications equipment and technology devices that we rely on to deliver services may be taken out but not to a scale where the impact will be long term. The main concern is lightning starting fires (see Wildland Urban Interface Fires chapter). Tornadoes A small tornado touching down in Pierce County should not impact the continuity of operations for any of its larger jurisdictions. It is possible that a small tornado could directly damage the only response capability or administrative office of a very small agency or jurisdiction. In that case, their continuity of operations would be impacted until they were able to get assistance from a neighboring jurisdiction. However; this is unlikely. An EF one tornado could damage a large area to the extent that a large proportion of a jurisdiction’s capability, either physically or administratively may limit its continuity of operations. Having the administrative offices destroyed, possibly along with the staff being injured or killed, would make the normal day-to-day operations difficult to maintain. Combining this with broken pipes in the destroyed buildings, phone and electric lines down, streets covered with debris and possible fires from broken gas lines would increase the difficulty of maintaining the continuity of operations. Due to the localized nature of the tornado, the delivery of services to the rest of the County should be minimally impacted with the exception of energy. The damage to the power infrastructure could have a direct effect on surrounding neighborhoods, businesses, jurisdictions, and the State (see Energy Emergency chapter). Windstorms Operations for most if not all the agencies or jurisdictions in Pierce County should be able to continue, albeit at a reduced level in some cases. Damage to the administration, infrastructure SEVERE WEATHER – PAGE 4-237 REGION 5 ALL HAZARD MITIGATION PLAN – 2020-2025 EDITION BASE PLAN
and a reduction in response are very possible consequences of a major windstorm. Damage to administrative facilities, operational equipment, communications systems, or utilities would put various organizations in a bind as far as maintaining their normal support to the public but would not completely shut down their operations. The impacts to the delivery of services could impact the entire County or in some cases, only a portion of it. This is largely dependent on the type of windstorm. An east-wind event, see Map 4.9-2 Pierce County Severe Storm Wind Hazard – East-Wind Event, with very strong winds will usually only impact the eastern portions of the County. The force of the wind decreases rapidly over distance. Wind speeds that can hit 100 mph in Buckley will be 50 mph or less by the time it gets to the western portion of the County. In a case like this there could be some loss of ability by local jurisdictions in the eastern portions of the County to deliver adequate services to the community. With heavy winds there could be extensive debris on the roads, broken lines and if some buildings are damaged, there could be broken water or gas pipes. With a south-wind event, see Map 4.9-1, essentially the entire populated area of the County will be impacted. This is equivalent to the Columbus Day windstorm of 1962 or the Hanukkah Eve Windstorm of 2006. In these two cases, there was major damage to the trees and powerlines. Many roads were totally closed, see Figure 4.9-7, and some people were without power for over 10 days. In situations like this the local jurisdiction is not capable of maintaining an adequate delivery of services.
Property, Facilities, and Infrastructure Hail Large hailstones can damage property, facilities and some infrastructure like electrical transformers, etc. However, in Pierce County the size of hail that has fallen historically has caused minimal damage, if at all, to any of the jurisdictions’ facilities or infrastructure in Pierce County. Ice Storms, Snowstorms, and Windstorms Ice, snow and windstorms can cause significant damage to public and private property, facilities, and local infrastructure. Overloaded tree limbs breaking off and landing on cars, buildings, and equipment can cause significant damage. Overloaded wires can break causing fires. Power can be out to portions of the County for over a week after a major windstorm. This means that traffic lights will be out at crossings and emergency facilities without generator backup will not be able to function. Having many roads covered with debris like the one in Figure 4.9-8 would virtually shut the County down. Ice and snow on roofs add extra weight and can cause damage, especially on lightly built structures. A 50-foot conifer can accumulate as much as 99,000 lbs of ice during a storm173, and when combined with wind may topple causing much more damage than it would have otherwise. SEVERE WEATHER – PAGE 4-238 REGION 5 ALL HAZARD MITIGATION PLAN – 2020-2025 EDITION BASE PLAN
Strong wave action from windstorms can erode coastal areas with railroad tracks and roads built in some cases right up to the water’s edge. Response vehicles and facilities may have trees or branches fall on them. Blowing debris, such as parts of roofs, fences, metal signs, and even sand can all cause damage to property and equipment. Figure 4.9-5 Tacoma Narrows Bridge – November 7, 1940 Windstorm
Thunderstorms Lightning strikes are associated with fires, electrical loss, and damage to equipment. The vulnerability to lightning cannot be understated as virtually every structure and system can be impacted by a lightning strike. Tornadoes Depending on the track and size of the tornado, it could devastate facilities and infrastructure. The last few tornadoes to strike Pierce County have been relatively small and have caused minor damage to the facilities or infrastructure of any jurisdiction in the County. If a tornado the size of the Greensburg Kansas tornado of May 4, 2007 (see Figure 4.9-4) were to strike one of the towns or other jurisdictions in the County they would have extensive damage to their property, facilities and the jurisdiction’s infrastructure. Descriptions of the 1899 tornado to hit Pierce and Lewis counties appear to put it in the same category. That tornado destroyed old growth forest with trees up to four feet in diameter and left a path of destruction 300 to 600 yards wide and 50 miles long. A repeat of that event passing through the populated portions of the County could destroy or damage some major pieces of infrastructure in addition to family homes and businesses.
SEVERE WEATHER – PAGE 4-239 REGION 5 ALL HAZARD MITIGATION PLAN – 2020-2025 EDITION BASE PLAN
The Environment Hail Hail can cause extensive damage to crops and other plants such as abrade or tear leaves; break stalks, stems or branches; destroy blossoms; and bruise fruit. This will be short term environmental damage, lasting about one year. Ice Storms Ice storms cause environmental damage by placing an excess amount of weight on plants that can break the limbs off large trees, crush small shrubs and injure or kill animals. Conifers are a little more resilient to the effects of the ice than are deciduous trees and can accumulate large quantities of ice. When combined with wind however they then can topple with considerable force. Icing can further damage plants by sealing the leaves, stems and buds from the air, suffocating these parts. When the ice sheet covering the ground persists for a lengthy period it can also suffocate some plant species. Animals that are used to snow cannot dig through the ice as they would snow to reach their normal food supply and so starve. Some could become encased in ice themselves and die.174 With enough time the environment will regain its normal vitality but depending on the amount of damage done it could take from a few months to several years. Snowstorms Light snowstorms have very little impact on the environment. The plants and animals that are endemic to Pierce County are used to this type of winter weather. With a heavy snowfall, broken limbs from trees will be one of the most visible signs of damage. If the snow remains deep for an extended period of time, some large animals being unable in deep snow to cover enough terrain to find food may starve to death. Regardless of the initial damage done by the storm, the scars on the environment will disappear; usually in a matter of months. Thunderstorms The only environmental impact is caused by fires and will not be further discussed in this chapter (see the Wildland Urban Interface Fires chapter). Tornadoes Tornadoes by their very nature can destroy everything in their path. The 1899 tornado, according to news reports, cut a 300 to 600-yard path through forest ripping up trees four feet in diameter. A repeat of a tornado of that size could cause even more environmental damage today. In 1899 it tore through forest and farms. While the environment suffered the loss of many trees it began to repair itself immediately and eventually the vegetation and forest recovered. SEVERE WEATHER – PAGE 4-240 REGION 5 ALL HAZARD MITIGATION PLAN – 2020-2025 EDITION BASE PLAN
The environment that the tornado would travel through has changed considerably. Forests have been logged and are now in at least their second if not third re-growth. Instead of a few farms spread apart you have a modern metropolitan area. A tornado that touches down in the wrong area could destroy oil storage tanks and hundreds of other hazardous chemical storage sites. All the hazardous materials that are transported on the highway system or through the port by ship or rail would be at risk of being spilled. Many of these could cause drastic, long-term environmental damage possibly lasting for many decades. Spills into the rivers or Commencement Bay could decimate fish populations for years. Windstorms
Figure 4.9-6 County Road December 2006 Windstorm
The impacts include downed trees and limbs. In some cases, entire stands of trees can blow down in a single windstorm, see Figure 4.9-7.175 A single tree falling at any one point is a very minor environmental problem that will have very little impact depending on the location. However, a full stand of trees all falling together leaves a scar that will take decades to re-grow. Loss of forest increases erosion and increased erosion leads to more silt in the rivers. Fallen trees can block streams or cause log jams on rivers that can cause the water to back up with possible flood consequences. Along coastal areas strong winds, especially when combined with high tides can erode beaches. The wave action can undercut hillsides that extend down to the water increasing the possibility of landslides. Wind damage to homes, businesses or industry can cause further environmental damage through the release of hazardous chemicals. Natural gas lines can be broken leading to fire. Very strong winds can tip over trucks or cause the driver to have an accident leading to a spill. Depending on the quantity and type of chemical the spills will be more or less damaging.
Economic and Financial Condition Hail Economic impacts from hail, even the relatively small hail that occasionally falls here in Pierce County can be dramatic. Portions of the Puyallup Valley are used for farming and have a high potential for damage to crops if there is a hailstorm at the right time of year. Other types of economic damage may come about if the hailstones are large enough to damage cars, equipment being used outside and building exteriors.
SEVERE WEATHER – PAGE 4-241 REGION 5 ALL HAZARD MITIGATION PLAN – 2020-2025 EDITION BASE PLAN
Ice Storms and Snowstorms The economic or financial impact of an ice storm or major snowstorm can be extensive. A major storm that knocks out electricity; closes roads, schools and businesses could have a major impact on the local economy. Damage to facilities due to the weight of the ice and/or snow can be in the millions of dollars. When employers close their business even for a few days the ripple effects include not just lost goods but lost wages for employees. With lost wages, the employee becomes unable to pay his/her bills. If this goes on for very long, the lost wages make it difficult for the worker to pay the normal day-to-day bills that arrive in the mail much less support the retail economy. Damage to homes and personal property can also be high, leading to increased debt for the individual or family. Thunderstorms Lightning strikes that directly hit infrastructure and destroy critical equipment will need to be replaced. For those who do not have insurance that covers this hazard in their policy, may not be able to replace damaged equipment. Tornadoes A small tornado hitting the unpopulated areas of Pierce County would have negligible economic or financial consequences for the jurisdictions in the County. In contrast, a large tornado moving through an industrial area, a concentration of businesses, or a populated area could devastate the local economy. Homes and some businesses could be rebuilt and be up and running within a year or so. Larger scale projects like malls or the port industrial complex could take many years to rebuild and re-staff. Windstorms The economic and financial aspects of a windstorm can be extensive. Local damage to homes and businesses can run into the millions of dollars. When business or industry is damaged there can be extensive loss of employment. This leads to individuals and families not being able to make their bill payments, including rent or house payments. People unable to work will need assistance which puts a burden on the taxpayer. If the situation does not resolve itself the jurisdiction could eventually have some people leave the area. Coastal erosion through wind damage can cause transportation problems. The under-cutting of roads along the coast, the damage to bridges from high-wind coastal flooding and the erosion leading to landslides are all problems that could affect the local economies throughout Pierce County’s coastal areas. Another area is agricultural damage. This includes the lumber industry. Lumber can react differently than the other agricultural products of Pierce County. Damage to most crops from a windstorm might take a year or more to recover. With the lumber industry a large timber blowdown might be salvageable. While this could keep the loggers employed and the company in a SEVERE WEATHER – PAGE 4-242 REGION 5 ALL HAZARD MITIGATION PLAN – 2020-2025 EDITION BASE PLAN
good financial condition initially, they will have to jump right into replanting the area to allow a harvest in a few decades.
Public Confidence in the Jurisdiction’s Governance Hail and Thunderstorms Hailstorms and thunderstorms should not cause any loss of confidence in any of the jurisdictions in Pierce County. Ice Storms, Snowstorms, and Windstorms The reputation of local jurisdictions and agencies in the wake of an ice or snowstorm is partly dependent on the weather itself. A major storm that maintains below freezing temperatures for a long period of time will continue to tax local resources throughout that period. Two factors will affect peoples’ perceptions on the competency of the local jurisdiction. The first is how fast the roads are brought back to being passable and the second is how quickly their electricity is returned. If these two things are brought back to normal quickly, confidence in the local entity will be high. If, on the other hand, things are slow and the perception develops that not enough is being done, then confidence in the local jurisdiction will falter and it will develop a reputation for either incompetence or not caring about the citizens it serves. Tornadoes In the wake of a tornado the confidence in any individual entity will be based on how quickly it responds to the needs of the affected community. People know that tornadoes are extremely damaging and there are not many of them that form in Pierce County. A tornado by its very nature is more localized in its damage. Rather than being a County-wide phenomenon, the path of destruction will be well defined. Any jurisdiction directly impacted by the wind should be able to begin recovery operations immediately. If assistance is needed, and it hasn’t been for the last few tornadoes, it would be available from nearby agencies and jurisdictions on short notice. If the perception, real or not, is that any agency or jurisdiction is not responsive to the needs of the community affected by this incident, then there will be a decrease in confidence in that organization. If, on the other hand, the entities involved acts quickly to get the community back on its feet, its reputation should not be hurt.
SEVERE WEATHER – PAGE 4-243 REGION 5 ALL HAZARD MITIGATION PLAN – 2020-2025 EDITION BASE PLAN
(This page intentionally left blank)
SEVERE WEATHER – PAGE 4-244 REGION 5 ALL HAZARD MITIGATION PLAN – 2020-2025 EDITION BASE PLAN
Meteorological Wildland/Urban Interface Fire Hazard 4.5M Identification Description Definition A wildfire is any non-structure fire that occurs in an area in which development is essentially non-existent, except for roads, railroads, power lines, and similar transportation facilities.176 A wildland urban interface (WUI) area is a geographic area in which structures and other human development meets or intermingles with wildland or vegetative fuels. A WUI fire is a fire located in that geographic area.
Types WUI fires occur naturally (lightning strikes) or are started by people. Secondary events such as erosion, landslides, and flash floods often occur in areas which have been affected by wildland fires.177 There are three sources of fires. They are described below. ▪
▪
▪
Naturally Occurring Fires - Naturally occurring interface fires, especially those caused by lightning, are rarer in western Washington.178 King, Pierce, and Snohomish Counties have a combined average of 2,500 natural vegetation fires each year.179 Wildfires in Washington State on lands protected by Department of Natural Resources (DNR) (1970May 2018) for Pierce County was 1,267.180 Manmade Fires - Manmade interface fires, stemming from people’s carelessness and lack of fire knowledge, are common causes of fires. In Western Washington 95% of fires are human caused.181 Major causes include arson, recreational fires that get out of control, smoking related, debris burning, and children playing with fire. Prescribed Burns - Controlled burns are fires conducted because the fire cycle is an important aspect of management for all ecosystems and controlled burns are not considered hazards unless they get out of control.182
Profile Location and Extent “The expansion of the WUI in recent decades has significant implications for wildfire management and impact. The WUI creates an environment in which fire can move readily between structural and vegetation fuels. Its expansion in recent decades has increased the likelihood that wildfires will threaten structures and people. This data is based on the National Fire Protection Association (NFPA) risk assessment and includes one or several communities with similar wildfire risks.”183
WILDLAND/URBAN INTERFACE FIRE – PAGE 4-245 REGION 5 ALL HAZARD MITIGATION PLAN – 2020-2025 EDITION BASE PLAN
In the 2018 Fire in Washington Report prepared by the Washington State Fire Marshal’s Office, there were 45,430 fire-related incidents for Region 4 (King, Pierce, and Snohomish Counties) from 2014-2018. Eastern Washington faces the greatest risk of fire, though Western Washington does have areas of risk as well. The Washington State Department of Natural Resources is currently mapping the entire wildland urban interface for the state. It is important to note that areas defined as part of the WUI do not necessarily have the highest wildfire risk. Map 4.10-1 illustrates the modeled wildfire risk for the entire state. Several other communities are identified in neighboring counties that are in close proximity to the Pierce County border.
WILDLAND/URBAN INTERFACE FIRE – PAGE 4-246 REGION 5 ALL HAZARD MITIGATION PLAN – 2020-2025 EDITION BASE PLAN
Map 4.10-1 Washington State Fire Hazard Map184
WILDLAND/URBAN INTERFACE FIRE – PAGE 4-247 REGION 5 ALL HAZARD MITIGATION PLAN – 2020-2025 EDITION BASE PLAN
As the map above illustrates, Pierce County fire risk has concentrations and additional portions scattered around near the Puget Sound. In western Washington and western Oregon, more than 94% of wildfires are started by people. Therefore, it follows that areas in Pierce County with higher concentrations of people will also have higher wildfire risk. Due to variables affecting the fire threat caused by topography, weather, and the amount of fuel, the DNR has created different fire danger rating areas, or zones, based on recommended actions by the NFDRS. Pierce County is in two zones as you can see in Map 4.10-2. Map 4.10-2 Industrial Fire Precaution Level Shutdown Zones185
Each Shutdown Zone has unique characteristics, as mentioned above, of topography, weather and the quantity of available fuel, that usually create situations of similar fire danger throughout the zone; but that could be different for adjacent zones. These different characteristics can lead to the IFPL also being different for adjacent zones. “In addition to the industrial controls, the DNR administers the Public Use Restrictions, limiting the public’s use and access to forested lands during periods of high fire danger.186 Like the industrial limitations there are four levels of control that can be exercised. These are: ▪
Summer Fire Rules – In affect from April 15 to October 15 or longer if warranted.
WILDLAND/URBAN INTERFACE FIRE - PAGE 4-248 REGION 5 ALL HAZARD MITIGATION PLAN – 2020-2025 EDITION BASE PLAN
▪
Burn Ban – When initiated by DNR, this ban prohibits all open fires on DNR lands. It may be done in coordination with federal and local agencies to cover land under their control.
▪
Closed Entry Areas – Usually designated as “regions of extra fire danger” in the spring and closed to recreation throughout the summer.
▪
Forestland Closure – In periods of extreme fire weather conditions, DNR may restrict all activities on some private and public lands, even to the point of not allowing homeowners access to their homes.”
Occurrences187 Fire is a normal part of most forest and range ecosystems in temperate regions of the world. Fires traditionally burn on a fairly regular cycle, recycling carbon and nutrients stored in the ecosystem, and strongly affect the species (including humans) within the ecosystem. Pierce County encompassed several different fire regimes historically, with fires occurring in some locations as frequently as every 7 years on average, to as many as every 200 years on average. 188 While wildland fires are predominately recognized as an Eastern Washington phenomenon, they also happen on the west side of the Cascades. The burning cycle in western Washington is every 100 – 150 years.189 This assumes a normal regrowth pattern after a forest has burned.
Figure 4.10-1 Carbon Copy Fire August 2006
Figure 4.10-1 shows the Carbon Copy fire in Pierce County during the summer of 2006. The most recent large fire in Pierce County was the Norse Peak Fire in 2017 that came close to the Greenwater community, triggering evacuations. More than 40% of the acreage burned in western Washington since the 1980s burned in 2017 or later (Harvey 2018).190 Wildland fires in Pierce County are largely confined to the drier periods of the year. In most years, this falls during the summer or earliest portion of fall. At that time, due to the lack of rain, the fuel moisture content191 is usually at its lowest. Any time the weather turns dry and hot for three days or longer, there is the possibility of a wildland fire. Fuels can dry out in as quickly as three days, even in rainy periods. Due to the proximity of homes and businesses throughout Pierce County to areas with natural vegetation, given the right location and conditions, many fires could turn into a Wildland/Urban Interface Fire.
WILDLAND/URBAN INTERFACE FIRE - PAGE 4-249 REGION 5 ALL HAZARD MITIGATION PLAN – 2020-2025 EDITION BASE PLAN
The best available information at this time indicates that fires have occurred in or near the locations identified above in the location and extent description. Map 4.10-3 illustrates fire occurrences in the records kept by DNR from 1973 through 2018.
WILDLAND/URBAN INTERFACE FIRE - PAGE 4-250 REGION 5 ALL HAZARD MITIGATION PLAN – 2020-2025 EDITION BASE PLAN
Map 4.10-3 Washington State DNR Wildland Fire Statistics: 1973-2018192
While not all of these are technically WUI fires, their relatively frequent occurrence indicates a risk to the WUI fire hazard near populated areas of Pierce County. Table WUI-1 shows the number of classified fires193 that DNR responded to from 2010 through 2019 in the South Puget Sound Region194 and their associated cause. Map WUI-4 shows the number of fire occurrences captured by Department of Natural Resources 2010-2019. None of these maps or figures represent a comprehensive count of all fires in Pierce County that have occurred. WILDLAND/URBAN INTERFACE FIRE - PAGE 4-251 REGION 5 ALL HAZARD MITIGATION PLAN – 2020-2025 EDITION BASE PLAN
Table 4.10-1 DNR Wildland Response South Puget Sound Region: 2010-2019195
Cause
2010
2011
2012
2013
2014
2015
2016
2017
2018
2019
Total
Arson
0
2
3
0
1
0
0
0
0
0
6
2.4
Children Debris Burn
0 0
0 0
1 2
0 0
1 0
4 2
0 2
1 3
0 3
0 2
7 14
2.8 5.6
Lightening
0
0
2
3
2
2
1
0
1
1
20
8.1
Logging
0
0
0
0
0
2
0
0
0
0
2
.8
Misc.
1
5
3
3
5
6
3
5
9
7
55
22.3
Recreation
14
15
14
10
3
3
3
6
4
1
91
36.9
Smoker Under Investigation
0 0
0 0
2 0
0 0
0 0
1 0
0 0
0 3
2 2
0 4
5 9
2.03 3.6
Undetermined Totals
0 15
0 22
1 28
0 16
4 16
7 27
1 10
8 26
12 33
3 18
37 246
15 100
WILDLAND/URBAN INTERFACE FIRE - PAGE 4-252 REGION 5 ALL HAZARD MITIGATION PLAN – 2020-2025 EDITION BASE PLAN
%
Map 4.10-4 Pierce County Fire Occurrences 2010-2019
WILDLAND/URBAN INTERFACE FIRE - PAGE 4-253 REGION 5 ALL HAZARD MITIGATION PLAN – 2020-2025 EDITION BASE PLAN
While the vast majority of the fires listed in both Table 4.10-1 and Table 4.10-2 would not be defined as WUI fires, the Department of Natural Resources, South Puget Sound Region, is involved fighting a Wildland/Urban Interface fire as least every couple of years.196 Very few structures have been lost in these fires due to the quick response and the high priority put on preventing the fires from involving the threatened structures. When this is combined with the WUI involvement of individual jurisdictions (cities, towns, and rural fire districts) in fighting wildland fires that threaten homes and other improved property in their individual districts or jurisdictions, the potential for a major fire is always there. Table 4.10-2 shows the number of fire incidents and dollar loss for Region 4 (King, Pierce, and Snohomish counties). This information is generated each year by the Fire Protection Bureau and released by the Washington State Patrol. The data is reported by local fire agencies to the National Fire Incident Reporting System (NFIRS).197 Table 4.10-2 Pierce, King and Snohomish County Fires
Year 2014 2015 2016 2017 2018 Total
# of Incidents 7,659 9,738 7,147 9,582 11,304 45,430
Dollar Loss $163,868,942 $70,471,509 $56,836,472 $129,728,734 $152,389,347 $573,295,004
Wildfires will happen every year within the boundaries of Pierce County. Few will have the potential of developing into a WUI fire. The more rural communities have the highest potential for developing a large scale WUI fire. This includes, but is not limited to, the communities of Ashford, Elbe, Eatonville, Wilkeson, Carbonado,
McKenna, and Roy. Recurrence Rate Today many factors affect the overall recurrence rate of fires. The main factor that was not part of the ecosystem in the past is the effect of the encroachment of humans into what has traditionally been forested area. Whether it is through logging, recreation, or the pressure of a growing population creating an expansion of homes and businesses into the traditionally rural areas of the County, the potential for fires to impact the human community has escalated over the past century and a half. Based on information from past fire occurrences and information from the DNR, the probability of recurrence for the WUI fire hazard in Pierce County is a five year or fewer occurrences.
WILDLAND/URBAN INTERFACE FIRE - PAGE 4-254 REGION 5 ALL HAZARD MITIGATION PLAN – 2020-2025 EDITION BASE PLAN
Impacts Health and Safety of Persons in the Affected Area at the Time of the Incident The health and safety of persons in the affected area at the time of the fire could be deeply compromised. Burns, smoke inhalation, psychological trauma, and death are among the impacts on the population living, working, recreating, or visiting within the impacted area. The southern California wildfires of 2003 and 2007 and the Oakland Hills fire of 1991 are perfect examples of major WUI fires that can not only cause damage, but death as well. The Oakland Hills fire killed 25 people, the 2003 Southern California fire 22, and the 2007 fires a dozen. The Paradise fire in 2018 had the highest death toll to date with 85 killed and 3 firefighters injured. This does not count the civilians who were injured in each of these fires. In some ways, the psychological damage can be as traumatic as some of the physical injury. Both adults and children can present long-term psychological changes due to the incident. Children may manifest these through regression or other actions including: • Fear of injury or death; • Fear of separation; • Inability to sleep; • Fear of the dark; • Fear of closed spaces; • Fear of outdoor spaces; • Regression of toilet training/bed wetting or other outgrown childish behavior; • Withdrawal from normal activities; • Fear of sudden noises; • Refusing to eat, nightmares, hyperactivity and irritability; and • Aggressive episodes with other children. 198 “Adult stress symptoms include: anxiety, depression, insomnia, irritability, impairment in concentration, loss of productivity, feelings of sadness and gloom, and the tendency to link the fire to other traumatic events in their life.”199
Health and Safety of Personnel Responding to the Incident The impacts to personnel responding to a Wildland Urban Interface Fire include burns, trauma, smoke inhalation, psychological trauma and death. Injury and death can occur from equipment failure or not wearing the proper equipment. They can occur from falling snags, burnover, or even a bulldozer rolling over on steep terrain. According to the U.S. Fire Administration, from January 2, 2009 to December 31, 2019 there were 926 on-duty firefighter fatalities in the U.S. This number includes contractors working the fire. Of those 926 the cause of fatality injury included: •
Stress/Overexertion, 506 people, 54.8% of total WILDLAND/URBAN INTERFACE FIRE – PAGE 4-255 REGION 5 ALL HAZARD MITIGATION PLAN – 2020-2025 EDITION BASE PLAN
• • •
Vehicle collision – includes aircraft, 124 people, 13.4% of total Struck by, 79 people, 8.6% of total Caught or trapped, 67 people, 7.3% of total200
From June 23, 2010 to December 16, 2018 there were twelve on-duty firefighter fatalities in the State of Washington. During the 29-year period from 1990 to 2009, 359 people nationwide were killed during wildland fire operations. Of those 359 firefighters killed, four major causes were responsible for 275 or 89% of those deaths. They are: • • • •
Aircraft accidents, 93 people, 26% of total Vehicle accidents, 79 people, 22% of total Heart attacks, 78 people, 22% of total Burnovers, 65 people, 18% of total201202
Due to mutual aid, these deaths can affect communities nationwide, not just those where the wildfire takes place. Pierce County lost Fire Chief Dan Packer in a blaze in Yreka, California on July 26, 2008 when he was doing reconnaissance and was overrun by the fire front.203204Longterm effects for wildland firefighters can include heart disease, emphysema and environmentalcaused diseases.
Continuity of Operations and Delivery of Services Depending on the area impacted by a Wildland/Urban Interface Fire, the continuity of operations for multiple jurisdictions or agencies might all be affected at the same time. Many of the smaller jurisdictions or agencies, especially those located in the more rural areas of the County, with a limited staff and facilities, could have their entire infrastructure destroyed, their community gone, and staff may have evacuated because of the danger posed by a large WUI Fire. Another problem is the isolation of certain areas. Many areas exist with their only access being the narrow two-lane roads that connect them to the more populated portions of the County. Pierce County also contains seven inhabited islands and one near island.205 Four of these have their only access by ferry and three by a two-lane road and bridge. This is exacerbated in some areas, like Ketron Island, which has no fire response located on the island, and is only accessible by ferry. In contrast, larger entities with their infrastructure, equipment, and staff spread over a broad geographical area, will be less likely to experience the inability to continue operations. Longterm operational recovery may not be feasible for some of the smaller jurisdictions if the WUI fire was large enough affect their entire jurisdiction. Losing both the resident population due to the fire and the resulting tax base, in addition to loss of their infrastructure, could make operational recovery impossible for smaller communities. Second, delivery of regular, day-to-day services to the impacted area could be compromised for many months, if not years. In some cases, it is possible that the effects on service delivery will be not just to the area with direct fire damage, but also to areas around the periphery of the fire. Fire damage will include not just the building stock, but also much of the other infrastructure. Power WILDLAND/URBAN INTERFACE FIRE – PAGE 4-256 REGION 5 ALL HAZARD MITIGATION PLAN – 2020-2025 EDITION BASE PLAN
poles and lines will be down, blacktop roads will have melted and in some cases, burned. The damage within the burned area could be so severe that few services will actually be required within it. Rather, it could be difficult providing services across the burned area to homes and businesses outside the actual area of damage. With power lines down, well houses burned, roads damaged, etc., not all services will be immediately available to neighboring communities outside the burned area. Within the burned area, infrastructure will need to be repaired prior to rebuilding being accomplished.
Property, Facilities, and Infrastructure Within the geographic area covered by a WUI fire there will be considerable damage to the facilities and infrastructure. The fires that burn throughout the western states present year-to-year images of the destruction possible. Pierce County, like any of these other communities, can expect private property, public facilities, equipment and infrastructure in some communities to have major damage or in some cases total loss.
The Environment Environmental impacts from a major wilderness fire can be extreme and may be exacerbated even further if the fire becomes a wilderness/urban interface fire. Normal environmental damage includes deforestation, death of animals, burnt material becoming polluting effluent in streams and rivers, increased erosion and a higher potential for landslides. This damage may take decades to reverse. If the fire happens in an area of old-growth forest, which may have been in existence for hundreds of years, it could take centuries for the environment to regain its original form and biodiversity. However, even with the damage done, not everything about the damage is detrimental. The damage done to the environment and the destruction of the forest opens up areas for colonization by new plants and animals. These burned areas allow sunlight to reach the ground. In doing so, plants that have not been able to survive in the heavily shaded understory, that normally exist in old growth forests, will thrive. As they do so, they will attract animals that thrive on them. Over time, the remnants of the original forest will encroach on the open area and it will once again return to forest. With a fire that affects the interface between the forest and the developed areas of the County, there is the problem of further pollution. The burning of materials used in construction, the rupturing of oil, gas or other hazardous materials tanks, the melting and burning of tires, and the distribution of firefighting chemicals across the landscape. Over the past few years, an increase in the knowledge of the effects from fire-fighting chemicals has shown that there can be long-term detrimental impacts on the environment, especially on water features and areas where the groundwater may become contaminated.206;207 This is particularly relevant when there are repeat uses of the chemicals to control fires.
Economic and Financial Condition The economic and financial condition of any individual jurisdiction will depend on the size of the Wildland/Urban Interface Fire and which parts of the community are directly affected. A fire WILDLAND/URBAN INTERFACE FIRE – PAGE 4-257 REGION 5 ALL HAZARD MITIGATION PLAN – 2020-2025 EDITION BASE PLAN
that burns a couple of thousand acres of previously logged but not re-grown terrain and destroys a dozen homes will have a relatively benign long-term economic impact for the larger community. In comparison, one that destroys an area the same size, but burns an entire small community, will have long-term lasting effects, if the community is able to rebuild at all. The Camp Fire that destroyed more than 13,000 homes in Butte County (including the Town of Paradise) has been awarded nearly $500 Million in Small Business Administration (SBA) loans and FEMA grants.208 The long-term effects include: a loss of economic vitality because of the destroyed businesses and wilderness jobs associated with recreation and logging; a loss of tax revenue; and, possibly the permanent loss to the community of the people that lived in the homes either due to death from the fire or moving away in the aftermath of the disaster.
Public Confidence in the Jurisdiction’s Governance The reputation of the entity will be directly related to the perception of competence in handling the fire threat and how well it was handled. The more damage caused by the fire that is shown to have been preventable by some action of the agency or jurisdiction, the lower the resulting reputation will be and the greater the decrease in confidence in the entity’s ability to handle future situations. A rapidly handled fire with little damage to homes or businesses will enhance the jurisdiction’s reputation while a fire that burns many homes or businesses, even if it was well–handled, may allow a lack of confidence to develop. Visuals of teams working to protect the homes and property of individuals will help to shore up this image. It’s important for homeowners and residents to understand the large part they play here, too. Emergency personnel cannot require homeowners to clean gutters, roofs, and remove combustible directly next to their house. This needs to be an all-hands effort.209
WILDLAND/URBAN INTERFACE FIRE – PAGE 4-258 REGION 5 ALL HAZARD MITIGATION PLAN – 2020-2025 EDITION BASE PLAN
Technological Abandoned Underground Mines Hazard 4.1T Identification Description Definition Abandoned underground mines are any excavation, under the surface of the earth, formerly used to extract metallic ores, coal, or other minerals, and that are no longer in production. Figure 4.11-3 Warning Sign Posted at Mine Entrance
Types Abandoned mines pose two different problems for the citizens of Pierce County. First is the problem of access to the mines themselves. While most people think of access being through original entrances, many mines can also be accessed through airshafts or even areas where a roof has collapsed. Most of the known mines that are closed have either had their entrances barricaded or sealed to prevent trespassing into what is increasingly hazardous terrain. These closures were commonly done with plugs of mine waste, land-clearing debris, or even sometimes old car bodies. These “unengineered” caps may eventually fail, especially if the original slope is near or above 35 degrees. Unengineered caps pose another problem. It is possible that some of them may plug old mine openings from which water used to flow. Many mines were originally built with the entrance on a downhill slope so water would not pool inside. Pumps were sometimes used to remove any water accumulating in the lower portions of the mine. If the plug is not done correctly it could block the natural flow of water from the mine allowing it to back up behind the plug creating the potential for an unexpected and sudden outburst of water. If the plug is strong enough to hold the water it could develop another path to the surface, possibly at an unanticipated location.
ABANDONED UNDERGROUND MINES – PAGE 4-259 REGION 5 ALL HAZARD MITIGATION PLAN – 2020-2025 EDITION BASE PLAN
Old shoring and columns of un-mined material left to support the roof of the mine eventually deteriorate, either due to age for the wooden shoring or compression by the weight of the rock above. Related to the issue of access is the problem of hazardous gasses given off by the remaining coal pooling in areas within the mine itself. During mining operations these gasses are vented to the outside. When the mine is shut down, the venting ceases and the gasses can then pool increasing the potential for asphyxiation for individuals entering the mine. Either way; due to the deteriorating structure in the mine itself or to the pooling of hazardous gasses, the interiors of old mines become more dangerous over time. The second problem impacts the land over the individual mine. As the weight of gravity compresses the un-mined material forming the columns left to keep the mine shaft open, called a room-and-pillar system,211 the surface of the land may subside, or settle, causing damage to buildings, facilities or infrastructure on or near the surface. The depth of a mine and the structural stability of the overlying rock dictate the ability of the overlying material to limit the impact of subsidence on surface structures.
Profile Location and Extent Underground coal mines are the largest abandoned mine hazard in Washington, not only because of the great extent of some of these mines, but also because population centers have tended to develop around them. Pierce County is included in the list of counties possessing the majority of coal mines in the state.
Table 4.11-1, Some Pierce County Named Coal Mines210 Apex Coal Co. Mine Bonato Coal Co. Mine Burnett Mine Burn-it Coal Co.’s Mine No. 2 Carbonado Mine Carbon Hill Coal Co.’s Mine Coast Coal Co.’s Mines (Spiketon Mines) Commercial Coal Co.’s Mine, No. 5 Seam Crocker Mine Dependable Coal Co. Mine, No. 4 Seam Douty Mine Electric Mine Fairfax Mine (New) Fairfax Mine (Old) Gale Creek Coal and Coke Co. Mine Henry Bartoy’s Acme Gem Mine Henry Bartoy’s Mine (aka Harry Rotoy’s Mine) Kelly Coal Co.s Mine Kranko Queen Mine (aka Kranko & Wilson Queen Mine) Mashell Coal and Coke Co. Mine Melmont Mine Melmont-Wilkeson- Carbonado Mines Miller Mine Montezuma Mine Northwestern Improvement Co.’s Prospect Holes Peanut Mine Queen Mine Skookum Mine South Willis Mines Wilkeson Coal and Coke Co. Mines Wilkeson-Wingate Coal Co. Mine, No. 4 Seam Wingate Mine
Maps of Pierce County’s 40-some known mines are possibly incomplete. These mines are located in the eastern part of the county in the foothills around the towns of Buckley, Carbonado and Wilkeson and north of the community of Ashford. The first coal discovered in the state was in what is now Cowlitz County in 1833. However, coal mining appears to have begun in Washington in either 1853 or 1854. Within a few years the mining had expanded to Pierce County beginning in the Wilkeson and Carbonado areas.212 It was not until after 1887 that mines began to file maps yearly under a newly imposed law. The main tunnel systems for the majority of the large mines ABANDONED UNDERGROUND MINES – PAGE 4-260 REGION 5 ALL HAZARD MITIGATION PLAN – 2020-2025 EDITION BASE PLAN
are relatively well documented on these old maps. Many companies filed their updated maps annually as required. However, once the businesses closed any shafts constructed that final year went undocumented because no final map was ever filed with the mine inspection office. Therefore, even the most updated maps may not adequately reflect either extensions of tunnels or excavating done during the final year of any mine’s operations. Figure 4.11-2 Lady Wellington Mine Tipple213
In addition, a number of abandoned mining sites, usually small, have been inadvertently discovered for which there are no maps on record with either the Department of Natural Resources or Pierce County. Some of these may predate the filing of mine maps and some of them may just have ignored the law. The potential exists that there may be many more located in the north/south band of coal bearing rock threat runs intermittently from King County to the Nisqually River. Compounding the problem is that a number of the mines changed hands many times over the course of their existence and therefore changed names. In some areas, even the name of the now defunct towns changed as different companies moved in or out of an area. This can be seen in the area two miles northeast of Wilkeson, originally called Pittsburg. Named to emulate the coal and steel center of Pennsylvania, the name only lasted for twenty years from 1889 to 1909. In 1909 the name was changed to Spiketon and then to Morristown in 1917 by the Washington State Legislature. This lasted until 1927 when the mines in the area closed for good. Today much of the area is once again called Spiketon by the locals.214 While most maps developed by the coal companies were extremely accurate as to the mapped features under the surface of the ground, they were not always accurate in relation to surface features. This problem has been exacerbated due to changes in surface topography, loss of buildings, new construction, grading, etc. Much of the information we do have is on old paper which has been deteriorating for, in some cases, over 100 years. The Department of Natural Resources has attempted to save and consolidate this information before it disappears completely. For these reasons, the mine maps on record are not completely reliable as to information about the location of Pierce County coal mines and the hazard they pose to the county’s citizens. Pierce County has, through its developmental regulations, attempted to address this problem by delineating the areas of Pierce County where the mines were located as a Critical Area in the Developmental Regulations215 (See Map 4.11-1, Mine Hazard Areas of Pierce County). Properties within this area are required to have a geotechnical assessment done to evaluate any potential threat to structures built on the site.
ABANDONED UNDERGROUND MINES – PAGE 4-261 REGION 5 ALL HAZARD MITIGATION PLAN – 2020-2025 EDITION BASE PLAN
Map 4.11-1 Mine Hazard Areas of Pierce County
ABANDONED UNDERGROUND MINES – PAGE 4-262 REGION 5 ALL HAZARD MITIGATION PLAN – 2020-2025 EDITION BASE PLAN
Occurrences There have been no deaths in Pierce County reported from accidents relating to abandoned mines, and no known cases of subsidence from the mines directly affecting current homes or businesses in the County.
Recurrence Rate The Pierce County Sheriff’s Department reports that they have had very few incidents of citizens entering the abandoned mines in eastern Pierce County. Two of the three incidents reported involved younger people who it was later discovered had not entered the mines after all. The third incident involved a missing suicidal woman who was reported to have entered one of the mines. Her body was never found.216 With the mine entrances closed in most instances, it is unlikely that there will be a regular recurrence of accidents or searches for missing citizens in the future. Underground coal mines are the largest abandoned mine hazard in Washington, not only because of the great extent of some of these mines, but also because population centers have tended to develop either around or near them. Pierce County is included in the list of counties possessing the majority of coal mines in the state. In each of the areas of impact there are the dual problems of entering the mine and subsidence. Each is treated independently. Subsidence on the other hand could become a developing problem over time. With the County’s growing population expanding into the less populated areas of the County, property in those areas that are traditional mining areas may appear desirable. Anecdotal evidence points to subsidence having occurred at different times. In many cases the posts supporting the ceilings were blown as the mining moved out allowing much of the land to subside quickly. In other cases where the supports were not blown, the subsidence actually showed as a line or grid system, depending on the underlying pattern of tunnel construction, on the overlying land. This could be seen on hillsides denuded due to logging. As new growth has grown up, the patterns are no longer recognizable.217 A similar report comes from Burnett, where a family reports that a portion of their pasture sank precipitously, forming a hole thirty feet wide that went down diagonally for approximately 650 feet from the surface.218
Impacts Health and Safety of Persons in the Affected Area at the Time of the Incident Interior Mine Hazard Persons entering an abandoned mine are at threat of injury and possibly death. These can be due to falling into unmarked shafts, collapse of the ceiling or part of the support structure, or asphyxiation from gasses that have pooled in the interior of the mine. There is also the possibility ABANDONED UNDERGROUND MINES – PAGE 4-263 REGION 5 ALL HAZARD MITIGATION PLAN – 2020-2025 EDITION BASE PLAN
that someone outside the mine could fall into an old airshaft that may not be closed. There are reports that some of these may still exist in the mine hazard area.219 Subsidence Mine Hazard Subsidence can occur over time with a gradual or sudden and dramatic sinking of the land over old mine shafts. The actual threat to the public is not so much to individuals since any subsidence, even if sudden, will be of a limited amount, but rather to the homes and infrastructure that may be built on top of the subsiding area. Homes could be destroyed, water and sewer lines broken, and roads unusable. Anyone living, working or recreating beyond the subsidence could be isolated for from a few days to a week or more until a repair can be arranged depending on the amount of damage and the stability of the underlying material.
Health and Safety of Personnel Responding to the Incident Interior Mine Hazard
Figure 4.11-3 Pacific Coast Coal Mine Tipple, Carbonado220
Response personnel entering an abandoned mine are at threat of injury and possibly death in the same manner of those whom they are attempting to find or rescue. These can include falling into unmarked shafts including old abandoned air shafts on the surface, collapse of the ceiling or part of the support structure, or asphyxiation from gasses that have pooled in the interior of the mine. Subsidence Mine Hazard Response personnel may find that not all the land has subsided and that a portion of it could still sink from under nearby buildings, forested areas or even under their rescue vehicles. This could damage equipment and cause injury to response personnel.
Continuity of Operations Interior Mine Hazard There should be no breakdown in the continuity of operations for any agency due to an accident or search or rescue from an abandoned mine. There would be no loss of infrastructure and only a very limited use of County resources in this situation.
ABANDONED UNDERGROUND MINES – PAGE 4-264 REGION 5 ALL HAZARD MITIGATION PLAN – 2020-2025 EDITION BASE PLAN
Subsidence Mine Hazard Subsidence of a section of land overlying an abandoned mine could damage any road or other surface infrastructure that might cross it. Due to the very limited area that these old mines underlie in what is mostly wilderness area today, it is expected that any impact the continuity of operations in a very small geographic area until such time as the damaged infrastructure can be repaired.
Delivery of Services Interior Mine Hazard There should be no breakdown in the delivery of services for any agency due to an accident or search or rescue from an abandoned mine. There would be no loss of infrastructure and only a very limited use of County resources in this situation. Subsidence Mine Hazard Subsidence of a section of land overlying an abandoned mine could damage any road or other surface infrastructure that might cross it. The loss or decrease of normal services to any area beyond the subsidence is possible until such time as the damaged infrastructure can be repaired. The few County resources currently accessed by roads or other infrastructure in the mine hazard area is very limited and should not impact any services of significance to more than the very small population residing in those areas.
Property, Facilities, and Infrastructure Interior Mine Hazard There should be no damage to property, facilities or infrastructure from interior mine hazards. Subsidence Mine Hazard There is considerable threat to property, facilities and infrastructure built on land containing abandoned mines. However, due to the rural character of the area where the mines are located and the very limited population that lives there, it is unlikely that there would be much damage to infrastructure from any one section of mine shaft or mine collapsing today. It is possible that there could be some road damage and there could be utility disruption from broken power and water lines. However, none of that will have an effect on a significant population. Due to the localized damage from the subsidence, returning the damaged infrastructure to functionality should be a quick and easy project.
ABANDONED UNDERGROUND MINES – PAGE 4-265 REGION 5 ALL HAZARD MITIGATION PLAN – 2020-2025 EDITION BASE PLAN
Environment Interior Mine Hazard Environmental impacts from the coal mines that dot the landscape in eastern Pierce County decreased to negligible with the end of the coal mining industry. Debris from the mines dumped near the entrances and occasionally in the rivers and streams that flow through the coal fields that went on as much as 150 years ago can continue to impact the environment with material that leaches into the soil and streams. Continued environmental impacts from the mines themselves will be very limited and there should be no increase due to a mine-related search or rescue incident. Subsidence Mine Hazard Subsidence by itself should cause little or no environmental damage. Having a piece of land sink a few feet by itself may not make any difference in the rest of the environment. However, there could be ancillary damage from the damaged infrastructure. Broken water lines, until turned off, could cause limited erosion. Broken power lines from a dropped pole in the subsidence area could start a fire.
Economic and Financial Condition Interior Mine Hazard In dealing with an incident involving entering an abandoned mine, costs should be in the normal range for search and rescue activities on the surface. SAR expenses are a normal budget item for the response agencies. Subsidence Mine Hazard Any collapse of mine tunnels impacting the surface will only impact a small portion of the mine hazard area of the County. With very little development within the mine hazard area, there will be little if any economic impact from a subsidence event. As long as development is restricted, that will continue to be the case. Similarly, the drain on County finances should be very limited if at all. The largest financial impact could be to any homeowner who happens to have property where a subsidence incident takes place. Current restrictions on building in the mine hazard areas will limit future subsidence costs, however there are a small number of homeowners who have homes in the area built prior to current controls. A collapse of a mine tunnel under one of these homes could destroy it, with a major financial impact to the homeowner.
Public Confidence in the Jurisdiction’s Governance Interior Mine Hazard There should be little or no decrease in the public’s confidence in the jurisdictions due to an incident within a mine. ABANDONED UNDERGROUND MINES – PAGE 4-266 REGION 5 ALL HAZARD MITIGATION PLAN – 2020-2025 EDITION BASE PLAN
Subsidence Mine Hazard With proper controls on construction within the mine hazard area, there will be few if any mine subsidence incidents that impact current development. This should result in few if any subsidence incidents that would cause the public to lose confidence in County government.
ABANDONED UNDERGROUND MINES – PAGE 4-267 REGION 5 ALL HAZARD MITIGATION PLAN – 2020-2025 EDITION BASE PLAN
(This page intentionally left blank)
ABANDONED UNDERGROUND MINES – PAGE 4-268 REGION 5 ALL HAZARD MITIGATION PLAN – 2020-2025 EDITION BASE PLAN
Technological Active Threat / Attack Tactics 4.2T Identification and Description Definition The Department of Homeland Security defines an active shooter as “an individual or multiple individuals actively engaged in killing or attempting to kill people in a confined and/or populated area”. These areas include where people shop, learn, work and exercise free speech.221 Attacks can be perpetrated by many different actors with different motivations, but all use violent and destructive tactics to cause harm to people and/or property. Some actors include terrorists (domestic and international), violent extremists, and targeted violent offenders.
Types Examples of tactics are mass shootings, bombings, arson, murder, kidnapping, hijacking, or skyjacking. Not all attacks are politically motivated, some are based on personal grievances. Most attacks happen in public gathering places or institutions, of which Tacoma has many. The threat of attacks has grown with the interconnectedness of the internet and social media. In today’s security conscious, post-9/11 environment, the main threat appears to be attacks using small-scale tactics such as shootings or vehicle ramming. No official sources were found that categorize active shooter events by type of incident or method. The New York City Police Department’s Compendium of Active Shooter Incidents divides them by location: Office Building, Open Commercial, Factories and Warehouses, Schools and Other.222 From a planning perspective in Pierce County, these events can be categorized into three general categories: workplace, school and public venue. In addition to location, the differentiating consideration is the potential triggering event or conditions leading up to the incident. These can be very personal in nature and specific to the individual and set of circumstances at the time.
Profile Location and Extent The Federal Bureau of Investigation (FBI) has many resources on active shooter statistics. From 2000-2017 there were 250 active shooter incidents (Figure 4.12-1 Incidents per Year and Figure 4.12-2 Casualty Breakdown by Year). In 2013 when the FBI released their first study results there were only 160 active shooter incidents. A few images highlight the increase in frequency and casualty counts.223
ACTIVE THREAT / ATTACK TACTICS - PAGE-269 REGION 5 ALL HAZARD MITIGATION PLAN – 2020-2025 EDITION BASE PLAN
Figure 4.12-1 250 Active Shooter Incidents in the U.S. from 2000-2017: Incidents per Year
The above bar chart contains the numbers of active shooter incidents in the United States, broken down by year, from 2000 to 2017. Those yearly numbers are: 2000, one incident; 2001, six incidents; 2002, four incidents; 2003, 11 incidents; 2004, four incidents; 2005, nine incidents; 2006, 10 incidents; 2007, 14 incidents; 2008, eight incidents; 2009, 19 incidents; 2010, 26 incidents; 2011, 10 incidents; 2012, 21 incidents; 2013, 17 incidents; 2014, 20 incidents; 2015, 20 incidents; 2016, 20 incidents; and 2017, 30 incidents. The total number of active shooter incidents during the time frame was 250. ACTIVE THREAT / ATTACK TACTICS - PAGE-270 REGION 5 ALL HAZARD MITIGATION PLAN – 2020-2025 EDITION BASE PLAN
Figure 4.12-2 250 Active Shooter Incidents in the U.S. from 2000-2017: Casualty Breakdown per Year
The above stacked bar chart includes statistics on the number of killed or wounded casualties, broken down by year, after active shooting incidents in the United States between 2000 and 2017. Those numbers are: 2000, seven killed; 2001, 12 killed and 31 wounded; 2002, 11 killed and 18 wounded; 2003, 29 killed and 22 wounded; 2004, 14 killed and six wounded; 2005, 24 killed and 27 wounded; 2006, 23 killed and 23 wounded; 2007, 69 killed and 57 wounded; 2008, 29 killed and 34 wounded; 2009, 65 killed and 78 wounded; 2010, 37 killed and 49 wounded; 2011, 32 killed and 52 wounded; 2012, 90 killed and 118 wounded; 2013, 44 killed and 42 wounded; 2014, 36 killed and 61 wounded; 2015, 56 killed and 78 wounded; 2016, 83 killed and 129 wounded; and 2017, 138 killed and 591 wounded. During the time frame, the total number killed was 799 and the total number wounded was 1,418.
ACTIVE THREAT / ATTACK TACTICS - PAGE-271 REGION 5 ALL HAZARD MITIGATION PLAN – 2020-2025 EDITION BASE PLAN
The FBI identified 11 separate incident location categories when seeking to identify the primary locations where the public was most at risk during an incident (Figure 4.12-3 Location Categories). These location categories include commercial areas (divided into malls, businesses open to pedestrian traffic, and businesses closed to pedestrian traffic), educational environments (divided into schools [prekindergarten through 12th grade] and IHEs), open spaces, government properties (divided into military and other government properties), residences, houses of worship, and health care facilities. Figure 4.12-3 250 Active Shooter Incidents in the U.S. from 2000-2017: Location Categories
The above pie chart shows a statistical breakdown of the location categories where the 250 active shooter incidents took place in the U.S. from 2000 to 2017. Those location categories include: areas of commerce, 105 incidents or 42 percent; educational environments, 52 incidents or 21 percent; government property, 25 incidents or 10 percent; open spaces, 35 incidents or 14 percent; residences, 12 incidents or 5 percent; houses of worship, ten incidents or 4 percent; and health care facilities, ten incidents or 4 percent. ACTIVE THREAT / ATTACK TACTICS - PAGE-272 REGION 5 ALL HAZARD MITIGATION PLAN – 2020-2025 EDITION BASE PLAN
In 2018 there were 27 incidents that resulted in 213 casualties (85 people killed and 128 people wounded, excluding the shooters). The highest number of casualties (17 killed and 17 wounded) occurred at Marjory Stoneman Douglas High School in Parkland, Florida. The second highest number of casualties (12 killed and 16 wounded) occurred at the Borderline Bar and Grill in Thousand Oaks, California.224 Since 2000, most active shooter events involved locations that could be considered “soft targets.” These were venues where groups of people congregated, access was relatively easy and there was little to no security presence. Workplace or academic settings were common locations in which attacks occurred.225 Some attacks appear to have been spur of the moment or the product of a sudden emotional event. Others were methodically planned over a period of time, presumably for revenge, notoriety or to make a statement to society in general. In the latter cases, attackers appeared to be in full control of their emotions and made deliberate decisions about how to carry out their attacks. Target locations were specifically selected, method of attack was carefully calculated, the timing was selected based on the highest potential for casualties and there is even evidence that some of these attackers even planned how the event would end.226 Whether the attack is deliberately planned or an immediate reaction to an emotional event, potential indicators that the risk level has increased are difficult to spot and unreliable. Recent events have shown that they can occur at malls, concerts, department stores, schools, work places, public gatherings and any other location that can be easily accessed. Furthermore, there is typically no discernible pattern or set of criteria as to how the attacker selects their victims. The goal of the assailant is to kill as many people as quickly as possible before the attack ends. This puts the attacker in the position of advantage as they determine the time, location and method of the attack, forcing victims, bystanders and responders to react to their actions. Due to the unpredictable and uncontrollable nature of these events, countermeasures characteristically involve the immediate actions of people at the attack site and quick deployment of law enforcement officers. Active threat events are frequently short lived and over before law enforcement can arrive on scene. Because of this, individuals must be mentally and physically prepared to deal with the situation as it is happening.227 Survivor initiated mitigation actions are as important toward ending an active shooter event as law enforcement response. These actions span the full spectrum of the Avoid, Deny and Defend methodology.228 Analysis of known events indicates that few attackers had previous negative contact with law enforcement, however most had recently experienced something significant in their lives. Dramatic events, such as the loss of a job, severe financial hardship, loss of a relationship, a personal humiliating event, or other significant events have been known to act as a trigger. Some of these were tied to a one-time occurrence (i.e. an employee was unexpectedly fired or laid off) while others occurred over a period of time (i.e. bullying in school, struggling academic performance, history of negative interaction between a supervisor and employee etc.). These incidents frequently had a “last straw” event that was the tipping point for the attacker(s). It is important to understand that attacks do not necessarily happen immediately after a “last straw” event. This event may mark the beginning of the planning process. The duration of that process is individual to the potential attacker. Some further analysis indicates that mental illness may be a contributing factor in many of these cases, but no definitive causal relationship is specifically ACTIVE THREAT / ATTACK TACTICS - PAGE-273 REGION 5 ALL HAZARD MITIGATION PLAN – 2020-2025 EDITION BASE PLAN
established at this time.229 It is important to note that the fact that a person has suffered a hardship or has experienced a series of life impacting events is not, in and of itself, a reliable indicator of potential risk. A more comprehensive review of the individual is generally required. As this is realistically only possible in a narrow band of potential cases, the ability to truly predict an event like this is minimal.230 Guns were the most commonly used weapon and in many cases the attacker had multiple weapons.231 Although rare, there were incidents in which the attacker brought an explosive device of some kind, potentially in an effort to kill more people or as a means to engage first responders. While we call it active shooter, attackers can use other weapons as seen in the December 2012 attack in China when an attacker entered a classroom and began stabbing children. In this case, a firearm was probably not available, but that did not deter the attacker. Incidents such as these demonstrate the potential resolve of an attacker once he has decided on a violent act. A second similar incident occurred in April of 2013 when Dylan Quick ran through the hallways of a building on the Lone Star Community College campus using a razor knife to slash and attack fellow students. By the time he was stopped, he injured fourteen people, two of which were taken to local hospitals in critical condition.232
Occurrences There have been five planned or conducted events in Pierce County since 2001 that were formally categorized as “active shooter”. Another five occurred within the state, mostly in Western Washington (Table 4.12-1 Occurrences in the Puget Sound). It must be noted that this assessment does not account for potential reporting bias in how events were categorized and/or officially reported by law enforcement agencies.233 Table 4.12-1 Occurrences in the Puget Sound234 DATE
Community
Location
11/1999
Seattle
Northlake Shipyard
5/2001
Tacoma
Pacific Lutheran University
11/2005
Tacoma
Tacoma Mall
4/2006
Puyallup
7/2006
Seattle
Rogers High School Jewish Federation of Greater Seattle
11/2009
Lakewood
Forza Coffee Shop
2/2010
Tacoma
Birney Elementary School
7/2011
Auburn
Muckleshoot Casino
5/2012
Seattle
Café Racer Coffee Shop
4/2013
Federal Way
Pinewood Village Apartments
6/2014
Seattle
Seattle Pacific University
10/2014
Marysville
Marysville-Pilchuck High School
9/2016
Burlington
Cascade Mall
12/2017
Graham
Graham-Kapowsin High School
ACTIVE THREAT / ATTACK TACTICS - PAGE-274 REGION 5 ALL HAZARD MITIGATION PLAN – 2020-2025 EDITION BASE PLAN
6/2018
Seattle
Highway 509 Near SeattleTacoma International Airport
Recurrence Rate There is no pattern as to frequency or recurrence of attacks in Pierce County or Washington State. The last known active threat event in Pierce County occurred in 2019. On a national scale, compared to all violent crimes committed, active shooter events are the most common.235 That said, the unpredictable nature of these events, the mental and emotional triggers that can cause them and the current social and economic influences within the general society make it prudent to assume that there will be an occurrence in the future within Pierce County.
Impacts Health and Safety of Persons in the Affected Area at the Time of the Incident The goal of most attackers is to kill and injure as many people as possible in as short a time as possible. Sometimes this begins by targeting a specific individual(s) and then escalates. In other events, there is no specific target in mind. Based on the analysis of previous events in Washington State, people in the workplace and school settings are most likely to experience an active shooter event. That does not rule out or reduce the potential that people in public places such as malls, churches or community events can find themselves in an active threat situation. Four of the ten events in Washington State occurred in public venues (see chart above). Injured people have the potential of dying from their injuries before medical response can arrive. Until law enforcement has successfully secured the scene, medical personnel will not enter the affected area. Law enforcement’s initial focus will be to stop the threat and secure the area. At least initially, injured people may be on their own to render aid and evacuate the area within their capabilities. Those who are injured may face a long and painful recovery as well as significant medical expenses that can lead to financial hardship. In some cases, people will not fully recover from their physical injuries dramatically effecting their quality of life and potentially their ability to work. There will likely be significant potential for psychological effects for people who witnessed the incident. Post-traumatic stress syndrome is a concern in the weeks, months and possibly years following the incident. This will significantly affect individual quality of life, ability to work and may add to the financial hardship as well.
Health and Safety of First Responders Responding law enforcement should expect to be in the line of fire as soon as they arrive on scene. To date, most active threat events were resolved very quickly; either before or upon the arrival of law enforcement.236 The two biggest risks to responding personnel are a heavily armed attacker that is willing to stand and fight and/or an attacker that has introduced an explosive device to target responders. Secondary devices at likely staging areas or assembly areas should ACTIVE THREAT / ATTACK TACTICS - PAGE-275 REGION 5 ALL HAZARD MITIGATION PLAN – 2020-2025 EDITION BASE PLAN
be a concern for responders. This tactic has significant potential to dramatically impact evacuees and responders and slow the response/recovery. Responding medical personnel are further at risk if there is more than one attacker or if the attacker has not been contained. Multiple threat events presumably involve at least some planning on the part of the attackers, who may want to engage responding fire and medical personnel to increase the number of dead and/or wounded. Depending on where the attack happens, securing the location can be a lengthy process, which increases the chances that seriously injured people can die from their wounds. This may place the burden of initial triage and medical care on law enforcement. The psychological impact to responders cannot be overlooked. These are very intense events that can result in a high number of casualties. Being in the line of fire or responding to the carnage can have a significant emotional impact. The public expects responders to carry on and be there if another event happens. Post-traumatic stress syndrome can affect responders’ ability to perform their jobs in the future. The initial recovery of the scene will happen quickly. The recovery of the people may take much longer.
Continuity of Operations Depending on where the attack occurs and how extensive it is, continuity of operations may be an issue. An attack that occurs in a workplace, will not only affect the available personnel to continue operating, but may prevent the facility from being operational for some time while recovery and investigations take place. The facilities with public access may find delivering normal services difficult as people are afraid to re-enter the facility. This may necessitate establishing an alternate location with potentially reduced staffing and capability until normal operations can be reestablished or improving virtual access to services.
Delivery of Services If an attack occurs at a service delivery facility, there may be a temporary interruption of those services during the recovery and investigations. Personnel, facilities and equipment may not be available or capable of providing necessary services for some time, depending on how long it takes for the agency and its employees to recover from the incident. Agencies and their supported populations should plan for reduced or interrupted service capabilities following an active threat event.
Property, Facilities and Infrastructure Property, facility and infrastructure damage has not been a main concern for active shooters in the past. Overall damage was localized to the incident site and typically not extensive. In the event that the attacker introduces an explosive device, the amount of damage will likely increase, but should still remain generally localized to the event site.
ACTIVE THREAT / ATTACK TACTICS - PAGE-276 REGION 5 ALL HAZARD MITIGATION PLAN – 2020-2025 EDITION BASE PLAN
Environment The environmental impact of an active shooter event will likely be negligible, unless an explosive device is introduced. The nature of the device, size, composition and what was damaged will determine the extent of environmental impact. In general terms, it is not likely that a single active threat event will result in significant environmental impact.
Economic and Financial Condition The economic impact of an active threat event would likely be localized and tied directly to the nature of the attack. The event that occurred at the Tacoma Mall in 2005 may have had a shortterm economic impact on the stores at that location, but its effect did not extend beyond that. The likelihood of a larger economic impact as a result of a single active threat event is remote. The financial impact will likely be most significant to jurisdictions in which the event occurred. These will predominantly come in the form of personnel costs (i.e. overtime, loss of productivity, extended leaves of absence, medical costs, legal costs…) due to response and recovery requirements.
Public Confidence in the Jurisdiction’s Governance Public confidence will be most shaped by the effectiveness and efficiency of the initial response, then by how effectively local and county agencies transition through the recovery phase of the incident. Public information and how it is managed will be of paramount importance to shape public confidence. A single active threat incident is not likely to reduce overall public confidence in the jurisdiction’s governance if the incident is managed effectively and efficiently.
ACTIVE THREAT / ATTACK TACTICS - PAGE-277 REGION 5 ALL HAZARD MITIGATION PLAN – 2020-2025 EDITION BASE PLAN
(This page intentionally left blank)
ACTIVE THREAT / ATTACK TACTICS - PAGE-278 REGION 5 ALL HAZARD MITIGATION PLAN – 2020-2025 EDITION BASE PLAN
Technological Civil Disturbance Hazard 4.3T Identification Description Definition “Civil disturbance means acts of violence and disorder prejudicial to the public law and order.”237 Civil unrest is the result of groups or individuals within the population feeling, rightly or wrongly, that their needs or rights are not being met, either by the society at large, a segment thereof, or the current overriding political system. When this results in community disruption to the extent that intervention is required to maintain public safety, it has become a civil disturbance. Civil disturbance may be a cascading consequence of the impacts from a natural disaster as demonstrated in Hurricane Katrina.
Types Civil disturbance spans a wide variety of actions some of which may violate criminal law and includes, but is not limited to: riots, acts of violence, insurrections, unlawful obstructions, protests or assemblages, or other disorders prejudicial to public law and order.238 Triggers could include: an economic depression leading to economic instability for a portion of the public; human-caused or natural disasters that disrupt infrastructure; racial tension; religious conflict; sectarianism; sector, or general unemployment; a decrease in normally accepted or available services or goods, such as extreme water, food, or gasoline rationing; or unpopular political actions such as the Vietnam War. Communal riots are types of disorders that are classified by direct battles between groups. Their underlying cause may be racial, religious, economic, territorial, or any of a number of issues that pit one group against another. Commodity riots are disorders that stress the economic and political distribution of power among groups. The focus of violence is the destruction of, or in some cases the taking of property.
Profile Location and Extent The potential for civil unrest or civil disturbance is highest in the larger cities of the County. This correlates with normal patterns across the country. There needs to be an adequate population density, or critical mass, to bring civil unrest to the point of impacting the community at large (Map CD-1 Pierce County High Probability Locations and Map CD-2 High Probability Locations Zoomed In). This doesn’t exclude a rural development; rather it means that large cities CIVIL DISTURBANCE – PAGE 4.T1-279 REGION 5 ALL HAZARD MITIGATION PLAN – 2015-2020 EDITION BASE PLAN
have a higher probability for civil unrest to spill over into civil disturbance. In Pierce County, this includes Lakewood, Puyallup and Tacoma. However, as other cities grow, their vulnerability also increases.
Occurrences The United States has a long history of civil disturbance. After the American Revolution it did not take long for major incidents like Shay’s Rebellion (1786-1787) and the Whiskey Rebellion (1791-1794) to break out. This has continued in other shapes and forms throughout the entire history of the country, touching every state in one form or another. Pierce County has seen a number of civil disorders over the years. These have ranged from the mob violence leading to the lynching of J.M. Bates in Steilacoom in 1863239 and the anti-Chinese riots in 1885240 to the Vietnam War demonstrations of the late 1960s and early 1970s. Labor unrest has ranged from agitation by the Industrial Workers of the World (IWW) “Wobblies” to multiple strikes such as the Longshoreman’s strike of 1934.241 These civil disturbances often escalated to violence due to tensions between labor unions, companies, and local law enforcement. In one case in May of 1905 a battle erupted between the Longshoreman’s Union and the Sailor’s Union which led to one death and numerous injuries. Occasionally unrest at a national level may spill over into the local environment. This was seen in the panic of 1893 where the economic depression led to high unemployment and a series of bank failures. These circumstances influenced Ohio businessman and organizer Jacob Coxey, to organize a march of the unemployed on Washington D.C. in 1894.242 Local organizers in Seattle and Tacoma decided to follow a routine being developed by other groups across the country. The organizers converged in Puyallup with the intent to form a permanent labor organization and then hijack a train travelling to Washington D.C. On April 29, 1894, their "army" of 3500 unemployed workers assembled in Puyallup. In preparation to augment their own forces, the City had hired police officers from the surrounding jurisdictions. Unfortunately the mob was too large for local law enforcement to control. Outnumbering the citizens by two to one, the “army” demanded food and money, threatened local citizens, and demanded the Northern Pacific Railroad to supply them with a train. Four days later, on May 3rd, becoming frustrated with the behavior of the protesters the governor stepped in and threatened the use of troops to quell the disturbance. The threat worked and the group disbanded.243 One of the more significant incidents of civil unrest was the conflict between the State of Washington and the Puyallup Tribe of Indians throughout the latter half of the 1960s. This culminated in the September 9, 1970 arrest of 55 adults and 5 children from a fishing camp protest on the Puyallup River. One tribal member threw a firebomb onto a railroad bridge over the river that damaged it. Tear gas and clubs were used to subdue the inhabitants of the camp. The escalating confrontation between the State Fisheries and Game Departments and the Puyallup Tribe of Indians over the previous six years had brought the Indian’s cause to the forefront of local news and had gradually turned the local citizens against the state agencies. Four years later the Boldt Decision affirmed the right of the tribes to 50% of the harvested fish. 244 245 ,
CIVIL DISTURBANCE – PAGE 4.T1-280 REGION 5 ALL HAZARD MITIGATION PLAN – 2015-2020 EDITION BASE PLAN
Map 4.T2-1 Pierce County Civil Disturbance Hazard Area
Note: This map of high probability locations is not an extensive list. Talk with your local law enforcement to get high probability locations for your jurisdiction
CIVIL DISTURBANCE – PAGE 4.T1-281 REGION 5 ALL HAZARD MITIGATION PLAN – 2015-2020 EDITION BASE PLAN
Map 4.T2-2 Pierce County Civil Disturbance High Probability Locations Zoomed In
Note: This map of high probability locations is not an extensive list. Talk with your local law enforcement to get high probability locations for your jurisdiction
CIVIL DISTURBANCE - PAGE-282 REGION 5 ALL HAZARD MITIGATION PLAN – 2020-2025 EDITION BASE PLAN
Today, while black and white racial tensions are occasionally high, they have not escalated to the level they did in 1969, when violence erupted in the Hilltop area of Tacoma and curfews were enacted. Even in 1991 with the Rodney King episode, there was more damage to business from lost customers, (because many stores closed early in fear of a riot) than there was from any actual incident. For many years the occasional incident of racially inspired graffiti or incidents while not disappearing, decreased. What has changed is the election of Barack Obama as President of the United States. Since his election it has been noted that there has been an increase in white supremacy organizations and in racially motivated incidents.246 These have not coalesced into any sort of major anti-minority movement at this time. What has coalesced into a form of anti-minority movement, are the dual spheres of the antiimmigrant movement focused first on those from Latin American countries especially illegal immigrants, and secondly from the distrust of those of Middle Eastern heritage, in particular those espousing Muslim religious beliefs. Both of these are the latest form of various antiimmigrant and religious biases that have occurred throughout our history. Fueling these today are the down economy, fear of losing a white majority, and the aftermath of 9-11 with the resulting Iraq and Afghanistan wars. While in some parts of the country these have led to confrontations, violence, and required police action, so far that has not been the case in Pierce County. The World Trade Organization riots in Seattle in November of 1999 served to remind all of us, in the Northwest, that organized groups could still cause a major disturbance if they put their minds to it. Shortly thereafter, there was fear that the Kaiser Aluminum strike could turn violent in March of 2000 when outside agitators came to Tacoma in support of the striking workers. A strong police presence and good planning prevented a repeat of the Seattle experience. Recurrence Rate Today there are still minor acts of protest and vandalism associated with the wars in Iraq and Afghanistan, especially in relation to the movement of military supplies through the Port of Tacoma and protests at the gates to Pierce County’s military bases. Many of these direct actions are either supported or actively instigated by outside groups. As the war in Iraq continues to wind down some of these may decrease. Many of the same groups are a minor irritation, organizing small protests over the incarceration of illegal immigrants in the Immigration and Customs Enforcement (ICE) detention facility on the Tacoma tide flats. While today many people are disillusioned by the political process, nationally, there is no overriding popular point for them to organize around. Prominent groups, like the Tea Party activists, while quite vocal over their concerns have not moved to become disruptive instead opting for vocal protest and an effort to move towards political change. However, given the history and nature of political dissent in this country, under the right circumstances, that could change on short notice. In summary minor occurrences of civil unrest may occur at any time for various reasons. Most of these are too small to warrant any concern. The occasional situations where police operations are more than cursory are the exception rather than the rule. Looking at the historical record, major civil unrest leading to social disruption is a rare occurrence. CIVIL DISTURBANCE - PAGE-283 REGION 5 ALL HAZARD MITIGATION PLAN – 2020-2025 EDITION BASE PLAN
Impacts Health and Safety of Persons in the Affected Area at the Time of the Incident Civil Disturbances can lead to injury and death for both the citizens involved and innocent bystanders. This can be from conflict between groups or between protesting groups and the legal authorities.
Health and Safety of Personnel Responding to the Incident If it turns violent, civil disturbances can lead to injury and death for personnel responding to an incident.
Continuity of Operations and Delivery of Services Minor protests should not limit the continuity of government operations or the delivery of services to the general public. However, as the size of the protest grows the potential impact on County operations and delivery of services could be considerable. This would largely be dependent on the focus of the disturbance. A large-scale protest against the wars in the Middle East located at the gates to Joint Base Lewis/McChord might draw some deputies in to support other law enforcement like the State Patrol and the military police, but should not have a major impact on other portions of the County. In contrast, the blocking of roads, taking over of Pierce County government buildings, threats against County personnel, and destruction of County property all would impact operations and the normal day-to-day delivery of services. Actions like these could impact County operations well beyond the actual time of the civil disturbance. Damage to property and equipment may limit the physical ability of the County to respond over a significant period of time. Injury, death or threats to staff, causing some to either resign their position or change their work habits or schedule could have the same impact, limiting the delivery of services to the public.
Property, Facilities, and Infrastructure Property may be damaged or destroyed by those fomenting the unrest. Depending on the scale of the protests this could range from broken windows, burnt refuse bins and spray-painted graffiti to destruction of major pieces of infrastructure. On the opposite end of the spectrum are the Los Angeles riots of 1992. During the riots, fifty-three people died, up to 2,000 were injured, and 3,600 fires were set destroying 1,100 buildings.247 A local example of this, on a much smaller scale, is the firebombing of the railroad bridge over the Puyallup River during the confrontation between members of the Puyallup Tribe and law enforcement in 1970. While this incident did not destroy the bridge, the time and cost to evaluate the damage and repair it impacted the movement of rail cars for a short period. Essentially any major facility could be damaged by a large enough contingent bent on harming or destroying it. CIVIL DISTURBANCE - PAGE-284 REGION 5 ALL HAZARD MITIGATION PLAN – 2020-2025 EDITION BASE PLAN
Environment Environmental damage is highly dependent on the size and focus of the civil disturbance. Generally speaking there is little or no damage to the environment. Litter, broken windows and spray-painted graffiti create little environmental damage. However, a civil disturbance that turns destructive and attacks infrastructure that includes hazardous chemicals or starts fires could cause extensive environmental damage.
Economic and Financial Condition Damage to stores from vandalism associated with civil disturbance could be relatively minor or extensive as during the Los Angeles riots of 1992. This is only part of the problem. There are the long-term social impacts, such as the potential to foster the growth of centrifugal tendencies248, from any civil disturbance. The loss in confidence by local residents and/or businesses could lead to depopulation in the impacted area and/or an exodus of business and capital from not just the directly impacted area, but also surrounding areas that might have been tainted by the actions nearby.
Public Confidence in the Jurisdiction’s Governance The public’s confidence in the jurisdiction’s governance will depend on a number of factors: • Is it a minor disruption or does it involve a major segment of the public, • Is the civil unrest a result of local conditions or is there something of national significance that is driving the incident; • Is the handling of the situation deemed appropriate to the scale or threat caused or implied by the unrest; • Did the jurisdiction appear to be cowed or confused by the unrest; • Is the unrest caused initially by a lack of confidence in the jurisdiction for some reason; • How quickly do things return to normal; • If laws are broken, are the perpetrators brought to justice; and • If the incident accomplished its ends was this to the satisfaction of the general public? Any incident handled to the satisfaction of the local population will enhance the public’s confidence in the jurisdiction’s abilities. However, this is a difficult position for the government to be in. Authorities can be seen as walking a social tightrope. If they are seen either as too harsh on the protesters or too lenient in giving in to demands or coercion, then confidence wanes leading to more difficulties in the future. Finding that middle ground, acceptable to the majority of the public, can be almost impossible. There have been a number of examples of this in Pierce County. In the 1893 takeover of Puyallup, it was not until the governor threatened to use military force that the disruption ended allowing the citizens to go about their normal business. In the conflict between the Puyallup Tribe and the State Fisheries, the heavy-handed tactics used by the State had the effect of increasing sympathy for the Tribe. Just to the north, in Seattle during the 1999 World Trade Organization riots the lack of a coordinated response and delays in arresting the most violent demonstrators led to a decline in respect for the local authorities.
CIVIL DISTURBANCE - PAGE-285 REGION 5 ALL HAZARD MITIGATION PLAN – 2020-2025 EDITION BASE PLAN
(This page intentionally left blank)
CIVIL DISTURBANCE - PAGE-286 REGION 5 ALL HAZARD MITIGATION PLAN – 2020-2025 EDITION BASE PLAN
Technological Cyber-Attack Hazard 4.4T Identification and Description Definition “An attack, via cyberspace, targeting an enterprise’s use of cyberspace for the purpose of disrupting, disabling, destroying, or maliciously controlling a computing environment/infrastructure; or destroying the integrity of the data or stealing controlled information.”249 These attacks are efforts to exploit targeted systems for personal, political, social or financial reasons.
Types Cyber-attacks are methods of action used within the greater context of the political, social and criminal realms. They are conducted by actors under the general context of: • Cyber Warfare: Politically motivated actions by a nation-state to penetrate another nation’s computers or networks for the purpose of conducting espionage or causing damage or disruption of national systems.250 • Cyber Terrorism: The intentional use of computers, networks and public internet to cause destruction and harm for personal objectives. These objectives may be political or ideological.251 • Cyber Crime: A crime which a computer is the object of the crime (hacking, phishing, spamming, ransomware) or is used as a tool to commit an offense (child pornography, hate crimes, theft, stalking…).252
Profile Location and Extent In 2009, President Obama stated in a speech about cyber security “…it’s now clear this cyber threat is one of the most serious economic and national security challenges we face as a nation.”253 Cyber-attacks can come in different forms based on the intended outcome and what is being attacked. Therefore, it is very difficult to define the specific methods, extent of the risk or target location. Any computer, computer system or electronic communications device/network is potentially vulnerable. Attack methods are evolving and changing at an ever-increasing pace as technology changes and security efforts become steadily more advanced. For the purpose of this risk assessment, attack methods fall into the following general categories:
CYBER ATTACK - PAGE-287 REGION 5 ALL HAZARD MITIGATION PLAN – 2020-2025 EDITION BASE PLAN
• Penetration Attack. This involves breaking into a system using a known security vulnerability to gain access.254 Once access is gained the attacker can take control of the system, disrupt its functionality, incapacitate it, steal/gather information, conduct surveillance etc. These attacks can be very surreptitious and go undetected for extended periods, leaving the attacker ample time and opportunity to carry out their activities. • Denial of Service Attacks. These affect a system by diminishing its ability to function and can eventually result in the incapacitation of that system.255 The basic tactic is to overload the system’s capability by flooding it with information such as e-mails, web site hits, significant increase in data streams etc. Attacks can be designed to hit a specific target or accomplish a specific task then self-destruct. Others may be designed to gain access then “hide and report”. Some can be designed like a time bomb that activate at a certain point or when specific criteria are met. Others are designed to spread as quickly and as far as possible to create the greatest impact or affect. Just as a human contagion can spread with every contact between people, an electronic contagion can spread at every point there is contact between an infected computer and any other electronic system capable of processing information. It then grows exponentially over time creating greater potential for long term impacts. The most important concept to be understood is that anything connected to or controlled by a computer that is capable of establishing contact with another computer or system is vulnerable to attack and exploitation.256
Occurrences No specific data was found listing occurrences of cyber-attacks specific to Pierce County or Western Washington. The below table captures many reported incidents in the United States between late 2010 and early 2013.257 Given the nature of the cyber environment, this list can be very representative of incidents that likely have and certainly will occur in the future in Pierce County. Table 4.14-1 Reported Incidents in the United States Between Late 2010 and Early 2013 Date Incident October 2010 The Wall Street Journal reports that hackers employed malware programs to steal over $12 million from five banks in the US and UK. March-April 2011 The FBI identified twenty incidents where online banking credentials of small-to-medium US companies were stolen and used to transfer over $11 million into Chinese companies. March-April 2011 Hackers attempted to steal authentication data that would allow them to access the Lockheed Martin data networks. April 2011 Google reported attempts to hack into their systems to compromise Gmail account passwords for prominent US people, to include senior US officials. April 2011 Oak Ridge Laboratory employees received e-mails with malware attachments that infected two machines and resulted in a few megabytes of data being stolen. This was the second intrusion into the lab’s data files. May 2011 Hackers attacked Sony’s PlayStation network and stole more than 80 million users’ personal information. The loss was estimated at over $170 million. June 2011 Citibank reported losing credit card data for 360,000 customers due to hacker activity. July 2011 The Secretary of Defense announced that a defense contractor was hacked and lost 24,000 files. CYBER ATTACK - PAGE-288 REGION 5 ALL HAZARD MITIGATION PLAN – 2020-2025 EDITION BASE PLAN
September 2011
October 2011 December 2011
March 2012
March 2012 June 2012 July 2012 December 2012 February 2013
February 2013
A malware program was introduced onto control stations for US Air Force Unmanned Arial Vehicles at Creech Air Force Base in Nevada. No drones were compromised, but the capability to remotely access UAV control systems was made clear. The networks for 48 chemical, defense and other industries were penetrated for at least six weeks by a hacker looking for intellectual property. US Chamber of Commerce announced that its computer networks were penetrated by a foreign hacker for nearly a year. The hacker had access to significant amounts of information, to include member company communications and industry positions on US trade policy. NASA’s Inspector General reported that successful attacks on NASA computer systems resulted in the loss of 150 user credentials, which could be used to gain unauthorized access to NASA systems. DHS issued a cyber intrusion warning alert regarding attempts to infiltrate US gas pipeline systems. A phishing campaign targets US aerospace industry experts attending the 2013 IEEE Aerospace Conference. The Director of the NSA reported a 17-fold increase in cyber incidents at US infrastructure companies between 2009 and 2011. Two power plants hit with sophisticated malware infections gave attackers access to plant computer systems. The Department of Energy confirmed that it was hit by a major cyber-attack. Fourteen servers and 20 work stations were penetrated, which compromised the personal information of several hundred employees. The DOE is assuming that the attack was intended to obtain more sensitive information. DHS issued a restricted report revealing that criminals targeted 23 gas pipeline companies and stole information that could be used to commit sabotage.
In addition to this list, the DHS reported that there was a spike in 2012 of cyber-attacks against power, water and nuclear targets within the US. Gas pipeline and chemical companies were frequent targets as well. In some of the attacks, companies reported that some of the data which was stolen could allow for unauthorized remote operations of company systems.258 Recurrence Rate Cyber incidents are expected to be a problem for the foreseeable future and recurrences are very likely to occur throughout Pierce County.
Impacts Health and Safety of Persons in the Affected Area at the Time of the Incident Cyber-attacks can be used to target specific individuals. Others, although not targeted at a specific person, seek to obtain information that can be used to harm people. Cyber bullying, stalking, identity theft, fraud, compromise of personal information or some other types of attacks, are all forms of cyber-crimes that affect people directly. These attacks frequently have significant psychological impacts, can dramatically impact on a person’s well-being and have led to suicide in some cases. Some denial of services attacks seeks to overload emergency communications systems. When successful, they can effectively shut down a community’s 911 center leaving people without CYBER ATTACK - PAGE-289 REGION 5 ALL HAZARD MITIGATION PLAN – 2020-2025 EDITION BASE PLAN
ready access to emergency services. If an attack of this nature were to occur in conjunction with another emergency, the potential for loss of life increases dramatically. Some medical devices are drawing concern in recent media releases, because they broadcast information wirelessly to other medical systems. This makes them vulnerable to interdiction by a hacker. Recent advances in pacemakers have included the ability to transmit data about a patient’s heart directly to his or her doctor. Some are growing concerned that this may allow hackers to seize control over the device and disrupt its life saving function.259 No further information was found to indicate that such an attack had taken place, however the potential exists. Researchers at the University of Washington and University of San Diego demonstrated the ability to hack into a car’s computerized systems and gain control over them, ignoring driver input.260 Functional systems such as stability control, traction control, breaking, navigation systems, anti-theft systems, monitoring systems etc., are essentially wireless computer systems on many high-end cars that can communicate with each other as well as external systems such as OnStar, a smart phone or personal e-mail system. This makes them vulnerable to intrusion and incapacitation.261 An attack on these systems poses significant risks to motorists for serious accident, injury and potentially death. Successful attacks on critical infrastructure such as ground traffic control devices, railroad switches and air traffic control systems can result in catastrophic accidents with significant loss of life. Water management systems at some of the state’s largest dams are controlled by networked computers. If remotely accessed, it is possible that a hacker could open the flood gates and release massive amounts of water onto downstream communities with disastrous effects. This list could continue. The bottom line is that people have become inextricably linked to technological systems. While this link can benefit them in many ways, it also makes them vulnerable.
Health and Safety of Personnel Responding to the Incident Emergency responders are most at risk if there were a successful attack on their supporting communications systems. Most radio and dispatch systems today are essentially computer networks. Disruption of that network poses great risk to responders as well as the public.
Continuity of Operations and Delivery of Service Most county agencies rely very heavily on computer networks to function. Pay systems, personnel systems, social services, public works, judicial, emergency management etc., all require significant automated capability to function in modern society. Disruption of those systems will cause at least a short-term impact on a department’s ability to operate, unless there are back-up protocols in place. Destruction of systems will likely extend the period in which operations are reduced or suspended.
CYBER ATTACK - PAGE-290 REGION 5 ALL HAZARD MITIGATION PLAN – 2020-2025 EDITION BASE PLAN
Depending on what type of service an organization provides, delivery may be partially or completely disrupted. Agencies may be forced to temporarily suspend services until an attack can be stopped and systems restored. If the attack erases essential information, it may be a long period of time before an agency can return to normal levels of service delivery.
Property, Facilities and Infrastructure There is significant potential for damage to facilities and infrastructure. Power generation and management systems, water movement and storage, wastewater treatment facilities and gas pipelines are all controlled by computerized systems. A successful attack to gain control over these systems could result in extensive damage that may seriously reduce their capability for a period of time. Several incidents of damaging cyber-attacks on infrastructure have been reported throughout the world.262 The potential for such an incident occurring in Pierce County is high. Incapacitated transportation management and control systems could result in accidents that can severely damage property and facilities as well as creating potentially serious hazardous material threats.
The Environment As previously mentioned, hazardous materials spills are a real possibility if automated protection systems are taken over and incapacitated. Failed transportation control systems may result in fuel spills as well as other hazardous cargo. Wastewater treatment facilities could be temporarily disabled leaving large amounts of untreated sewage to potentially flow into local bodies of water.
Economic and Financial Condition Most notable cyber-attacks resulted in significant financial impacts. System outages, lost customer information, stolen funds, stolen intellectual information etc., have frequently cost companies of all sizes large amounts of money. In 2012, the Ponemon Institute completed a three-year study in which it tracked 56 large US corporate organizations. The study showed an average annual financial loss of $8.9 million, with the largest loss being $46 million. The study further noted that smaller organizations incurred a significantly higher per capita cost, presumably the result of a less robust financial margin.263 Companies can incur substantial costs in their efforts to protect themselves from cyber-attack. Studies have shown that the stronger the security posture, the lower the costs associated with an attack.264 These protective protocols and systems cost businesses money, which eventually is passed on to the client or consumer. Either way, the “threat” of cyber-attack is costing everyone more money. Identity theft costs people significant amounts of money each year as bank accounts are drained, credit cards are fraudulently used, or personal information is used to make fraudulent transactions. In 2010, 8.1 million Americans were reportedly victims of identity theft with a mean loss of $631.00 per victim.265 This equates to an annual consumer loss of over $5 billion.
CYBER ATTACK - PAGE-291 REGION 5 ALL HAZARD MITIGATION PLAN – 2020-2025 EDITION BASE PLAN
Loss of customer information frequently equates to loss of confidence and ultimately loss of business. Larger companies are postured to survive this type of event. Small business, however, may lack the financial resources to rebound after such an incident. The recovery costs could be extensive as well. Whether it is infrastructure damage, loss of funds, costs associated with correcting problems or loss of productivity, there may be a significant cost associated with putting things back together after a successful attack. Loss of information poses one of the greatest risks as its effects have the potential to linger well after the attack has been contained. Public Confidence in the Jurisdiction’s Governance Cyber-attacks against the private sector will likely not impact on the public’s confidence in their elected leaders, unless the targets of the attacks are of public interest such as a privately-owned utility or privately contracted public service. The greater the public impact, the greater potential that residents will question what their government is doing for them. A loss of private information by a government agency has significant potential to impact public confidence. Residents expect that their private information will be protected. Just as a business, customer confidence drops if that information is compromised. A sustained loss or reduction in a government provided service as a result of cyber-attack may erode public confidence. Generally speaking, the average citizen understands that things can happen. How quickly the agency recovers and returns to normal operations may directly impact on the level of confidence affected resident have. Over time, unaffected residents may begin to question the vulnerability of other agencies or systems, especially any system that contains their personal information.
CYBER ATTACK - PAGE-292 REGION 5 ALL HAZARD MITIGATION PLAN – 2020-2025 EDITION BASE PLAN
Technological Dam Failure Hazard 4.5T Identification Description Definition A dam is any “barrier built across a watercourse for impounding water.266” Dam failures are catastrophic events “characterized by the sudden, rapid, and uncontrolled release of impounded water.267
Types Dam failures may be caused by structural deficiencies in the dam itself. These may come from poor initial design or construction, lack of maintenance and repair, or the gradual weakening of the dam through the normal aging processes. However, they can also be caused by other factors including but not limited to debris blocking the spillway, flooding, earthquakes, lahars, landslides, improper operation, vandalism, cyber-attack or terrorism.
Profile Figure 4.15-1 Reasons for Dam Failures Nationally268
OVERTOPPING – 34% of all failures * Inadequate Spillway Design * Debris Blockage of Spillway * Settlement of Dam Crest FOUNDATION DEFECTS – 30% of all failures * Differential Settlement * Sliding and Slope Instability * High Uplift Pressures * Uncontrolled Foundation Seepage PIPING AND SEEPAGE – 20% of all failures * Internal Erosion Through Dam Caused by Seepage− “Piping” * Seepage and Erosion Along Hydraulic Structures Such as Outlet * Conduits or Spillways, or Leakage Through Animal Burrows * Cracks in Dam CONDUITS AND VALVES – 10% of all failures * Piping of Embankment Material Into Conduit Through Joints or Cracks OTHER - 6% of all failures
Location and Extent269 The Washington Department of Ecology’s inventory of dams, lists 58 dams or retention facilities either totally in Pierce County or shared jointly with another county. Of these, 46 have a peak storage capacity of 10 or more acre-feet. Of the 58 dams, 29 of them are listed as being of either high or significant hazard (see Table 4.15-1 Pierce County Dams that Pose a High or Significant Risk to the Public).270 The current count by classification are eight – 1A, seven – 1B, seven – 1C, seven – 2D and 2E. Since the last HIRA update in 2015, 13 dams have an increase in hazard class (10 of them are dikes at Lake Tapps).
Many of these, even though they are located in portions of the county with a low population base are a hazard because of the quantity of water they impound (see Table 4.15-1 Pierce County DAM FAILURE - PAGE-293 REGION 5 ALL HAZARD MITIGATION PLAN – 2020-2025 EDITION BASE PLAN
High and Significant Risk Dams). This is the case with Alder, La Grande, and Mud Mountain Dams. A catastrophic failure of any of these dams could impact communities’ miles downstream. Others are listed as hazardous not because of the quantity of water they could release, but rather because of their proximity to the public. There could be tens to hundreds of people or businesses located in a close proximity to the flow from a failure. It should be noted that a dam failure can happen at any time and be caused by anything. Map 4.15-1 Pierce County High and Significant Risk Dams illustrates the locations of all the dams in the county. Others are listed as hazardous not because of the quantity of water they could release, but rather because of their proximity to the public. There could be tens to hundreds of people or businesses located in a close proximity to the flow from a dam failure. It should be noted that a dam failure can happen at any time and be caused by anything. Map 4.15-1 Pierce County High and Significant Risk Dams illustrates the locations of all the dams in the county.
DAM FAILURE - PAGE-294 REGION 5 ALL HAZARD MITIGATION PLAN – 2020-2025 EDITION BASE PLAN
Table 4.15-1 Pierce County Dams that Pose a High or Significant Risk to the Public
Name Alder Dam
Hazard Class* 1A
Owner
River or Stream
Tacoma. P. U. Nisqually R.
Bonney Lake WSU Infiltration Pond Butterworth Dam
2D
Frozen Lake Dam
1B
Harbor Hill North Pond La Grande Dam
1B 1B
Opg Properties Unnamed LLC Tacoma P. U. Nisqually R
Leach Creek Stormwater Detention Dam McMillin Reservoir No.1 N. Dam McMillin Reservoir No.1 S. Dam Mud Mountain Dam
1B
Tacoma P. W. Leach Creek
1C
1A
Tacoma P. U. Tributary - Puyallup R.-Offstream Tacoma P. U. Tributary - Puyallup R.-Offstream US ACE White R.
North Fork Clover Creek E1 Detention Basin North Fork Clover Creek E1 Detention Facility Slavic Lake Dam
1A
Pierce Co.
N Fork Clover Creek
1B
Pierce Co.
2D
Steilacoom Lake Dam
1B
Slavic Christian Center City of Lakewood
2E
1C
Weyerhauser Offstream Inc. WA DFW Eden Creek Eng. US DOI NPS Tributary – White R.
TWN RNGE Type** SEC T15 NR04 VA ES09 T19 NR05 RE ES03 T15 NR04 RE ES20 T17 NR09 RE ES33 T22 NR02 RE ES31 T16 NR04 PG ES04 T20 NR02 RE ES14
Purpose†
Crest
H, R
Height Normal Max Max Storage‡ Storage‡ Discharge 1550 ft 330 ft 231,936 241,950 85,000 cfs
C
1000 ft
5 ft
30
35
0 cfs
I, S
300 ft
61 ft
2050
2450
25 cfs
R, S
215 ft
19 ft
64
76
0 cfs
C
900 ft
20.5 ft
17
51
unmarked
H, R
710 ft
217 ft
2676
3015
88,000 cfs
C
1000 ft
10 ft
1
110
280 cfs
T19 NR04 ES14 T19 NR04 ES14 T19 NR07 ES17 T19 NR03 ES14
RE
S
2200 ft
30 ft
165
165
0 cfs
RE
S
2200 ft
30 ft
166
166
0 cfs
ER
C
700 ft
425 ft 106,000
156,000
RE
C, Q
850 ft
10 ft
1
135
245,000 cfs 749 cfs
N Fork Clover Creek, W Branch
T19 NR03 ES10
RE
C
1090 ft
10 ft
85
104
1260 cfs
Offstream
T22 NR01 WS35
RE
R
40 ft
8 ft
8
10
30 cfs
Steilacoom Lake
T20 NR02 ES34
PG
F, R
120 ft
28 ft
2640
6970
1980 cfs
DAM FAILURE - PAGE-295 REGION 5 ALL HAZARD MITIGATION PLAN – 2020-2025 EDITION BASE PLAN
Sylvia Lake Dam 2D Sylvia Lake. Tributary - Puget T21 NR01 RE R 387 ft 25 ft 67 124 160 cfs PC Country Club Sound ES11 Tapps Lake 1C Cascade Water Tapps Lake T20 NR05 PG R, S 73 ft 21.5 ft 55,500 46,655 1000 cfs Backflow Alliance ES26 Prevention (CWA) Structure Tapps Lake Dike 1A CWA Diversion from White T20 NR05 RE H, R 200 ft 18 ft 19,000 22,000 0 cfs No. 1 R. ES09 Tapps Lake Dike 1A CWA Diversion from White T20 NR05 RE H, R 1600 ft 23 ft 36,000 38,000 0 cfs No.11 R. ES10 Tapps Lake Dike 1C CWA Diversion from White T20 NR05 RE H, R 1250 ft 14 ft 23,000 25,000 0 cfs No.12 R. ES10 Tapps Lake Dike 1C CWA Diversion from White T20 NR05 RE H, R 350 ft 9 ft 18,000 20,000 0 cfs No.2A R. ES05 Tapps Lake Dike 1C CWA Diversion from White T20 NR05 RE H, R 300 ft 16 ft 26,000 28,000 0 cfs No.2B R. ES04 Tapps Lake Dike 1B CWA Diversion from White T20 NR05 RE H, R 600 ft 15 ft 26,000 28,000 0 cfs No.3 R. ES04 Tapps Lake Dike 1A CWA Diversion from White T20 NR05 RE H, R 4000 ft 45 ft 56,000 58,340 0 cfs No.4 R. ES09 Tapps Lake Dike 1A CWA Diversion from White T20 NR05 RE H, R 500 ft 24 ft 38,000 40,000 0 cfs No.5 R. ES09 Tapps Lake Dike 1A CWA Diversion from White T20 NR05 RE H, R 600 ft 26 ft 41,000 43,000 0 cfs No.6 R. ES10 Tapps Lake Dike 2D CWA Diversion from White T20 NR05 RE H, R 350 ft 20 ft 32,000 34,000 0 cfs No.8 R. ES10 Tapps Lake Dike 2D CWA Diversion from White T20 NR05 RE H, R 250 ft 15 ft 24,000 26,000 0 cfs No.9 R. ES10 Tapps Lake Dike 1C CWA Diversion from White T20 NR05 RE H, R 700 ft 19 ft 30,000 32,000 0 cfs No.10 R. ES10 Tapps Lake Dike 2D CWA Diversion from White T20 NR05 RE H, R 350 ft 6 ft 8000 10,000 0 cfs No.13 R. ES27 *Hazard Classes: 1 – High Hazard, 1A – greater than 300 lives at risk, 1B – 31 to 300 lives at risk, 1C – 7 to 30 lives at risk, 2D – 1 to 6 lives at risk, 2E – 0 population at risk but significant economic and/or environmental effects. **Type: ER – Rock Fill Dam, PG – Concrete Gravity Dam, RE – Earth Fill Dam, VA – Concrete Single Arch Dam. †Purpose: C – Flood Control & Storm Water Management, F – Fish & Wildlife, H – Hydroelectric, I – Irrigation, Q – Water Quality, R – Recreation, S – Water Supply DAM FAILURE - PAGE-296 REGION 5 ALL HAZARD MITIGATION PLAN – 2020-2025 EDITION BASE PLAN
‡All dam storage numbers are in acre-feet. One acre-foot is the quantity needed to cover one acre to the depth of one foot or 43,560 cubic feet, or 325,851 gallons.
DAM FAILURE - PAGE-297 REGION 5 ALL HAZARD MITIGATION PLAN – 2020-2025 EDITION BASE PLAN
Map 4.15-1 Piece County High and Significant Risk Dams
DAM FAILURE - PAGE-298 REGION 5 ALL HAZARD MITIGATION PLAN – 2020-2025 EDITION BASE PLAN
Occurrences There have been a number of dam failures in Washington State over the past 100 years, some of which are shown in Table 4.15-2, but a review of the literature has not turned up any in Pierce County. Table 4.15-2 Select Dam Failures in Washington State271,272 Dam Location Failure Date Nature of the Failure and Damage Masonry Dam Near North 12/23/1918 Excessive seepage through the glacial moraine abutment caused mud (Boxley Burst) Bend flow about one mi. from reservoir. It destroyed a RR line and village of Eastwick. Eastwick Near North 02/1932 A landslide blocking a culvert caused a RR fill dam to fail Railroad Fill Bend destroying a portion of the RR tracks, the village of Eastwick and Dam killing seven residents. Loup Loup Near Malott April 1938 A 50 foot high hydraulic fill dam failed when emergency spillway Dam was undercut during a flood. It destroyed ½ mile of state highway, 25 homes and left 75 people homeless. Lake Dawn Port Angeles February 1950 Heavy Rains caused overtopping and failure of the earthen dam. one Dam home destroyed and $4000 damage North Star Everett December 1967 A 40 foot high dam washed out by overtopping due to lack of Sand & Gravel spillway. 25 foot high dam rebuilt, also failed, washed out Great Dams Northern RR tracks and derailed a passing train Pillar Rock Wahkiakum January 1970 A logging road fill culver was blocked by debris. It overtopped and Dam Co. failed. That caused a 25 foot high concrete gravity dam to fail. three homes and a fish cannery were destroyed. Sid White Dam Near Omak May 1971 Earthen dam failed due to seepage through animal burrows. Caused a second dam to fail and dumped debris into the town of Riverside. Alexander Lake Near December 1982 Spillway undermined and failed during heavy rains. Caused damage Dam Bremerton at fish hatchery and homes in Gorst Upriver Dam Spokane May 20, 1986 Hydropower facility failed by overtopping. Lightening struck the system causing the turbines to shut down. Water rose behind the dam while they were trying to restart the turbines. Backup power systems failed and the spillway gated could not be raised in time. Caused $11 million in damage to the facility Chinook Dam Pacific Thanksgiving Heavy rains overtopped the embankment and undermined the County Weekend 1990 spillway, leading to failure of the dam. Approximately $100,000 damage to the facility Seminary Hill Centralia October 05 Failure along weak rock zone in a hillside caused a massive slide Reservoir 1991 which breached the reservoir. three million gallons of water drained from the reservoir in three minutes. two homes were destroyed, many homes damaged, $3 million in damage. Iowa Beef Wallula near January 25, Failure of 15 foot high embankment released 300 acre-feet of waste Processors Richland 1993 water. Failure attributed to high reservoir levels due to snowmelt, Waste Pond entering animal burrows near the embankment crest, and eroding the Dam No. 1 dam. Washed out the Union Pacific RR tracks, derailed five locomotives and caused $5 million in damage. Mill Creek Cosmopolis November 12, Pedestrian bridge washed out; residential areas flooded; ~12 homes Dam and 2008 received flood damages Aberdeen
Recurrence Rate
DAM FAILURE – PAGE 4-299 REGION 5 ALL HAZARD MITIGATION PLAN – 2020-2025 EDITION BASE PLAN
Failure is a possibility for any dam. While there have been occasional failures across the state, their lack in Pierce County over the past one hundred years would indicate a recurrence rate of fifty or more years.
Impacts Figure 4.15-2 Mud Mt. Dam Intake273
The impact from any individual dam failure depends on a number of factors: • What is the maximum amount of water the dam can contain? • What is the maximum amount of water the dam contains when it fails? • Is the failure immediate and total or only partial and slowly developing allowing the water to gradually build in volume and power? • Is the dam located in a populated area or is it removed from developed areas and critical infrastructure? • Are there any other contributing factors that might limit the evacuation from a threatened area or the emergency response to the incident? • Is there a warning?
Health and Safety of Persons in the Affected Area at the Time of the Incident Any individual dam has a very specific area that will be impacted by a catastrophic failure. The dams listed above in Table 4.15-1, will be a direct threat to the lives of individuals living in the inundation zone below the dam. Currently, populations who work in the inundation zone below the dam are not considered in the hazard classification process. Locals with data on businesses’ number of employees and daily average customers can work with the Department of Ecology Dam Safety Office to identify hazard classification changes for weekdays. The impact from any catastrophic failure would be similar to that of a flash flood. Just six inches of moving water can knock you down and one foot of moving water can sweep your vehicle away.274 Lives can be lost. The water and landscape can be contaminated with hazardous materials such as sharp debris, pesticides, fuel and untreated sewage.275 There could be injuries from impacts with debris being carried by the flood. With the cold water and cold air temperature for much of the year, hypothermia could exacerbate many of the problems for those rescued and contribute to the number of drowning deaths. Water may also be electrically charged from underground or downed power lines.276 For more information see Flood chapter. Because of their small size, or their location in uninhabited areas, thirty dams in Pierce County are not shown on Table 4.15-1. While it cannot be precluded, these dams are not expected to cause death or injury to individuals. However, it is possible that an individual or group of DAM FAILURE – PAGE 4-300 REGION 5 ALL HAZARD MITIGATION PLAN – 2020-2025 EDITION BASE PLAN
individuals could be in the wrong place at the wrong time and become a casualty of one of them failing.
Health and Safety of Personnel Responding to the Incident Response to a dam failure is a response to a hazardous situation. Swift-water rescue of individuals trapped by the water puts the immediate responders at risk for their own lives. Later, after the water has receded, those involved in the cleanup may be at risk from the debris left behind.
Continuity of Operations and Delivery of Services Continuity of operations for any jurisdiction outside the direct impact area could be very limited. Unlike most flood situations, a dam failure’s impact will be constrained to an area within a single watercourse. In addition, the failure, while sending a surge of water down the individual watercourse will not usually continue to send water down over an extended period of time. There will be a surge of water and then with most dams the quantity will taper off relatively quickly. Exceptions would include the partial failure of one of the large dams in the County, or the failure of a major dam during a major rain, or rain on snow event. In either of these cases, there could be a flood hazard already in existence when the dam fails. Having the damage located within a single watercourse, while limiting the area directly impacted, could still cause major disruption of operations and the delivery of services. The heavy onrush of water associated with an event of this type could, through the destruction of infrastructure in the impacted area, put a total halt in a jurisdiction’s ability to respond to many of the day-to-day needs of its citizens.
Property, Facilities, and Infrastructure No matter the size of the dam, the large quantity of water associated with the failure of a dam creates a scouring force in the area immediately below it. For small dams this might only cover a few dozen to hundreds of yards not impacting much if any infrastructure. For large dams, like Alder, La Grande and Mud Mountain scouring could go for miles and damaged infrastructure may be found all the way to Puget Sound. Depending on the quantity of water, the force caused by its onrush can take out buildings, power lines, sewage systems and roads. Damaged sewage systems are serious health hazards and need to be assessed as soon as possible. A large dam with a high head of water could effectively scour the terrain below it for miles, taking out all buildings and other infrastructure. This scouring force could also erode soil and any buried pipelines in the steeper portions of the valleys. Where the slope moderates and the rivers enter a wider plain the water would slow down and while still damaging the infrastructure it would act more like a very high, flood or small tsunami. There would still be some scouring in certain areas, but some other areas along the edges of the inundation zone might have a lot of debris deposition. Failure of one of the major dams on the White or Nisqually Rivers when full could damage highways as far as I-5. Smaller roads and bridges closer to the actual failure could be totally DAM FAILURE – PAGE 4-301 REGION 5 ALL HAZARD MITIGATION PLAN – 2020-2025 EDITION BASE PLAN
removed due to the force of the water. Roads may have weakened and could collapse under the weight of a car. Floods in Washington damage bridges on a regular basis without anywhere near the quantity of water that could be released by a catastrophic dam failure on one of the County’s major rivers.
Environment Any dam that fails has a detrimental impact on the environment. Of the 58 dams in Pierce County, seven are classified a significant risk to the environment only. The degree of the impact will vary depending on the size of the failure. Small dams will probably only impact a very small portion of the environment downstream. In the other extreme, the scouring action of a large quantity of water will destroy all vegetation in its path. A very large dam could hypothetically take out forested areas. Like any flash flood, this will destroy any wildlife caught in the flow. Fish habitats, including spawning beds, could be destroyed. Unlike most floods, the force of the water from a large dam failure will have a major scouring impact on portions of the valley. In some areas it will take off most if not all topsoil, limiting the ability of the environment to return to normal. It could take years for the natural restorative processes to bring back an ecosystem similar to what was there beforehand. A large dam that fails, depending on the quantity of water released, could have an impact far beyond what is normally expected from a flood on its watercourse. Part of this is due to the volume of water that at peak may have a flow many times that of even a record flood. Added to this is the large quantity of material, both natural, like logs and other vegetation, and human related, like fertilizer, sewage, livestock, vehicles, and other hazardous materials. This material as it is deposited, may cause further pollution of not just the areas normally flooded, but also land that lies far above or away from the normal flood plain.
Economic and Financial Condition The economic impact from the failure of many of the smaller dams in the County is negligible. Impacts would be to the owner of the dam and potentially to a small local group, probably geographically located directly downstream from the dam. The area they impact would be so small and, in most cases isolated, that a failure of one would go almost unnoticed by the rest of the County. As the size of the dam increases and the proximity to the public and/or critical infrastructure increases, the severity of the impact to our economy increases. Any of the dams listed in Table 4.15-1 could have an impact on either the overall economy or on the financial condition of many of the businesses or homeowners located in the inundation zones from those dams. A couple of the worst-case scenarios include a failure of Mud Mountain Dam or Alder Dam during peak storage. Either of these could not only kill many people but could irrevocably damage the infrastructure. The supply chain would be disrupted as roads and bridges would be lost. This includes damage to the main north-south corridor of Interstate 5. Businesses would be damaged or in many cases destroyed, and municipalities in the inundation zones would have a long-term process of rebuilding and reopening. Not all businesses will reopen, and some may DAM FAILURE – PAGE 4-302 REGION 5 ALL HAZARD MITIGATION PLAN – 2020-2025 EDITION BASE PLAN
choose to relocate. All of this would not only impact those areas in the inundation zone, but any area relying on either the infrastructure or businesses located in that zone.
Public Confidence in the Jurisdiction’s Governance For many of the small dams located in the County whose failure would have no impact on the general public there would be little change in the public’s confidence in local governments or any agency overseeing their safety or operation. The failure of any dam that does considerable damage to the community will have a lot of scrutiny by the press and the public. The organizations most in the line of fire will be those responsible for the dam and those responsible for overseeing its licensing and safety. When the ownership of the dam is a public agency the confidence in that agency will be adversely affected. Dam safety inspections fall to the Dam Safety Office in the Washington State Department of Ecology. When a dam fails that directly impacts the public, especially if there are deaths associated with it, there will be considerable scrutiny of why it happened. The next point will be to ask the date of the last inspection and what were its results. If an inspection was conducted multiple years ago questions will arise concerning why it was not done more recently. This will be especially critical if it is shown that the dam in question was not inspected at the rate recommended by FEMA.277 This is summarized by the State of Washington: Guidelines for dam safety prepared by the Federal Emergency Management Agency recommend annual inspections of high hazard dams (3 or more homes at risk), a 2-year interval for significant hazard dams (1 or 2 homes at risk), and a 5-year interval for low hazard dams (no homes at risk).278 Current inspection requirements as listed in the Washington Administrative Code 279 are: (1) As authorized by RCW 43.21A.064, the department has the authority to conduct routine periodic inspections of all existing dams with high and significant downstream hazard classifications to reasonably secure safety to life and property. • Dams with high downstream hazard classifications will be inspected every five years. • Dams with significant downstream hazard classifications will be inspected every five years, or ten years if workload or staffing necessitates a longer cycle between inspections. • Dams classified as low hazard are not included in the periodic inspection program. A dam failure of a class one or two dam, especially when there are injuries or fatalities; combined with lengthy periods between inspections will bring unwanted scrutiny on the State of Washington. This will lead to a decrease in the public’s confidence in the State’s governance.
DAM FAILURE – PAGE 4-303 REGION 5 ALL HAZARD MITIGATION PLAN – 2020-2025 EDITION BASE PLAN
(Page left intentionally blank)
DAM FAILURE – PAGE 4-304 REGION 5 ALL HAZARD MITIGATION PLAN – 2020-2025 EDITION BASE PLAN
TECHNOLOGICAL ENERGY EMERGENCY HAZARD 4.6T Identification Description Definition An Energy Emergency is a situation in which the unavailability or disruption of the supply of energy poses a clear and foreseeable danger to the public health, safety, and welfare. An Energy Supply Alert is a situation which threatens to disrupt or diminish the supply of energy, to the extent that public health, safety, and welfare may be jeopardized. Both are declared by the governor through executive order. By declaring an Energy Supply Alert, the state recognizes that emergency conditions have worsened, and that expanded measures are needed to address the crisis.280
Types Energy resources include electricity; petroleum distillates such as gasoline, diesel fuel, aviation fuel, heating oil; propane; and natural gas. Short term losses of energy services are not typically considered an emergency, however a simultaneous failure of a back-up (i.e. a generator) that keeps a critical system functioning could result in a short-term emergency. Pierce County citizens, businesses and government agencies rely on different energy resources depending on their location, type of business or industry, and preference. Distribution is facilitated through both private and public entities using various means and infrastructure. In addition, nearly all rely at least partially on electricity to function on a daily basis. Gasoline and diesel fuel are other critical energy resources that are relied on heavily. Natural gas and propane provide heating and cooking fuel for many and heating oil is still used in some homes across the County. No matter which type of resource is involved, it is the inability to provide or have access to sufficient quantities to meet public, commercial and government demand that creates the emergency. It may not just disrupt the normal day-to-day lives of Pierce County citizens; it may also threaten their physical, psychological and economic wellbeing. This is particularly relevant to vulnerable populations, who tend to be more affected by minor fluctuations in their environment. The effects of the emergency can be compounded when more than one resource is restricted or when it is accompanied by severe weather or other emergency/disaster conditions.
Profile Location and Extent An energy emergency can happen anywhere and potentially everywhere in Pierce County. They most frequently come in the form of extended electrical outages due to severe weather. High ENERGY EMERGENCY – PAGE 4-305 REGION 5 ALL HAZARD MITIGATION PLAN – 2020-2025 EDITION BASE PLAN
winds or heavy snows associated with seasonal storms can cause significant damage to utility systems resulting in potentially extensive and long-term service interruptions.281 A second likely scenario would be a shortage, reduced availability or substantial increase in the cost of an energy resource. These can occur for various reasons ranging from environmental effects, political fluctuations, market manipulations and an overall reduction in supply. Seventy percent of Washington’s electricity is hydroelectric.282 A severe drought could reduce the production capability of the State’s water ways, forcing a reliance on more expensive forms of power generation. This will likely cause an initial shortage followed by a potentially significant increase in cost. The drought in California in the year 2000 along with market manipulations caused an 800% increase in wholesale prices of electricity.283 People in lower socioeconomic categories and small businesses would be affected first and most significantly. If this scenario persists for an extended period of time, its effects will be felt across all segments of the County’s populations, businesses and government agencies. A worst-case scenario would be a loss of electric power for an extended period combined with a reduction or loss of fuel sources that currently power transportation systems and the redundant electricity generation systems that keep critical infrastructure functioning. Transportation, sewage treatment, water production, medical systems, government systems, financial systems, emergency response and more could all be severely impacted. This scenario would likely have lasting effects, which would be felt across the County for months or years after resources were restored. An example of this, would be the system failure and permanent damage to the infrastructure occurring from an extreme space weather event. Space weather events are those that happen in space yet may impact operations here on earth. Several types exist including geomagnetic storms and solar radiation storms. While the potential is at its highest during the height of the solar cycle, which occurs every 11 years, it can occur at any time.284 Geomagnetic storms disrupt the earth’s magnetic field and can stimulate electrical currents known as Geomagnetically-Induced Currents (GIC’s).285 Solar radiation storms are charged particles and protons that usually disturb radio communications and Global Positioning System (GPS). A large-scale incident can result in the damage to electronics, memory and imaging systems on satellites, and complete radio blackouts. Such an incident may cost billions of dollars of damage and take months or longer to repair.286
Occurrences The most frequent type of energy incident in Pierce County is a power outage. Small, short term outages (lasting only hours) occur routinely across the County. There have been some significant outages that were longer lasting and required some response by local, county and state government agencies. In 1929, severe drought caused water levels to be at an all-time low. This dramatically reduced the power generation capability of the LaGrande Dam on the Nisqually River and the Cushman Dam on the Skokomish River. By December, electricity was so short that Tacoma street lights were turned off, shops and illuminated signs were left dark and “Camp Lewis” turned off ENERGY EMERGENCY – PAGE 4-306 REGION 5 ALL HAZARD MITIGATION PLAN – 2020-2025 EDITION BASE PLAN
barracks lights at 4:00 PM. The situation became so dire that on 16 December the US War Department, at the request of President Hoover, dispatched the aircraft carrier USS Lexington from the Bremerton shipyard to generate electricity to keep Tacoma alive (see figure 4.16-1).287 In 1980, Mount Saint Helens erupted. Ash caused short circuits in electrical transformers and caused blackouts for days. In 1989, a severe space weather event hit the North American continent. The worst hit was Canada where millions of people were without power for nine hours. New Jersey lost a transformer worth $12 million dollars.288 This geomagnetic storm had the greatest impact on the energy industry in history.289 As a result of situations such as these, FEMA has taken an active approach in learning about space weather to prepare citizens.290 Figure 4.16-1 The Carrier Lexington Providing Electricity to the City of Tacoma291
In the fall of 2000, major producers of electricity on the West Coast created an energy emergency through market manipulation, artificially inflating prices that grossly increased the cost/kilowatt hour. The WA Governor required conservation efforts by public agencies, urged the public to reduce electric demand, and directed utilities to prepare for rolling blackouts although blackouts did not occur. Doing so was highly detrimental not only to the financial well-being of power distributors, but also to that of the individual homeowner, business owners and especially to industries that relied on large quantities of very cheap power. In December of 2006, the Hanukkah Eve Windstorm left thousands of Pierce County residents without power for days due to extensive damage to power lines. Fifteen people died and some areas went without power for as many as eleven days.292 Daily temperatures that time of the year range between the low 30s to the mid-40s293 creating serious County-wide concerns for the health and safety of residents. In early 2008, the country saw a significant spike in fuel prices reaching nearly $4.50 per gallon. It lasted for nearly three months.294 This caused an overall cost of living increase throughout the
ENERGY EMERGENCY – PAGE 4-307 REGION 5 ALL HAZARD MITIGATION PLAN – 2020-2025 EDITION BASE PLAN
country affecting low income families and small businesses. Some of the businesses did not survive. In December of 2008, a significant winter storm hit western Washington knocking out power to portions of the County. Some areas were without power for up to a week. In late January of 2009, the main cable that supplies electricity to Anderson Island broke, leaving residents and businesses without power for weeks. County resources were deployed to the island to support the community until power could be restored. In January of 2012, one of the largest snowstorms to hit western Washington in decades blew in depositing significant amounts of heavy wet snow. Immediately following, the temperature dropped causing heavy ice deposits to form on the already snow laden trees, power lines and roofs. Over 200,000 people ended up without power, some for up to three weeks. Rural areas were the last to have power restored. In 2018, the Enbridge Pipeline disruption created a short-term natural gas shortage; Cascade Natural Gas 7 Puget Sound Energy asked customers to cut back use of natural gas. Impacts to regional trash pickup in service areas that use natural gas in trucks, some hospital’s linen services, oil refineries refining process, and creating fertilizer that farmers in Eastern WA depend on. Recurrence Rate Major energy outages during severe weather events are an occasional hazard of living in Pierce County. They happen throughout the County every few years. The recurrence rate is five years or less. More critical are the occasional situations like the one brought on by the 1929 drought or the cable breaking between the mainland and Anderson Island. Large occasional incidents like those have a recurrence rate of fifty years or less. Extreme space weather events can range between less than 1 per solar cycle to as many as 4, depending on the type of storm. The most dangerous are Geomagnetic Storms which have a frequency of 4 extreme events every eleven years (per solar cycle).295 Significant increases in the cost of fuel resources have not impacted Pierce County as significantly as they did in 2008. These occurred again in 2011 and 2012. The subsequent spikes did not reach the same levels as before and the overall impact did not appear to be as severe. The economy and consumer seemed better prepared for the follow-on spikes.296 That said, another prolonged period of high energy costs will likely impact the more vulnerable populations and small businesses of the County.
ENERGY EMERGENCY – PAGE 4-308 REGION 5 ALL HAZARD MITIGATION PLAN – 2020-2025 EDITION BASE PLAN
Impacts Health and Safety of Persons in the Affected Area at the Time of the Incident An extended loss of electrical power can pose some significant challenges for people within the affected areas. Rural communities experience more frequent power outages and have resources to get by for a time. For example, a farmer is more likely than an apartment dweller to have a backup generator. Children, the sick and the elderly are more vulnerable to the impacts of power outages as well as the poor. Depending on the time of year and the temperatures, loss of power can pose significant heating and cooling problems. Those without wood, gas fireplace or a generator have no safe means to heat their homes. Over time, hypothermia can become a real concern. Previous power outages have also seen individuals die of carbon monoxide poisoning in their homes as they attempt to heat with alternative means such as an open fire in the house. The longer the outage lasts during colder periods, the higher the potential for this kind of thing happening. Refrigerators require electricity to function. Perishable foods in the refrigerator can become unsafe to eat within hours without power. Food in a freezer may be viable for up to two days. Resupplying or replacing food during the crisis can be difficult as stores rely on electricity to run their refrigeration units as well. Additionally, shelf stocks in grocery stores tend to deplete quickly, leaving many people without a reliable way to feed themselves and their families. Even if stores have food, without cash or checks, customers may not be able to purchase it. Many people rely on electronic financial systems to do most or all of their transactions. Without power, access to money in this form is impossible. Water availability may be an issue for families residing in rural areas. Many homes in rural Pierce County draw their water from wells. In most cases the pump that pulls the water is driven by electricity. Once the power goes out, the pump stops and so does the water supply. If there is a loss of fuel supplies at the same time, water in the urban areas may be impacted as well as sewage treatment when generators fail, and critical systems shut down. These are extreme examples but not outside the realm of possibilities in a worst-case scenario. Loss of power will eventually result in a loss or serious degradation of communication ability for people if they do not have a landline phone in their homes. Cellular phones, tablets and computers all require power. Eventually their batteries will run down, and the devices will no longer work. During the 2012 snowstorm, gas stations were forced to shut down because there was no power to run their pumps leaving no way to refuel cars or generators. In some areas, people with generators were left without power as their fuel ran out and they were unable to find any locally. An inability to refuel cars stranded some people and cost others their only heat or source to power personal communication devices. ENERGY EMERGENCY – PAGE 4-309 REGION 5 ALL HAZARD MITIGATION PLAN – 2020-2025 EDITION BASE PLAN
A fuel shortage or significant spike in cost can have many of the same impacts on families. As was observed in 2008, the cost of nearly everything went up when fuel prices climbed. People in lower socioeconomic groups and those with fixed incomes will be most significantly impacted. If the shortage or spike lasts for months, the financial impact may be nearly irreversible for some of these people. The homeless may be even more impacted as higher fuel prices increase the cost of living. This typically reduces charitable contributions, which are necessary to help the homeless and very poor. That occurs simultaneously with an increased need for government services, putting an additional strain on government programs.
Health and Safety of Personnel Responding to the Incident Utility workers will always have a risk of electrocution. The exception to the above is the potential for widespread civil unrest if an energy emergency lasts for an extended period. The population will grow increasingly frustrated and desperate if services cannot be restored and necessities are difficult to obtain. This desperation may lead to organized and unorganized civil disturbances that can grow quickly if not effectively handled. In May of 2012, widespread unrest occurred in Pakistan after months of significant energy shortages. Protestors damaged infrastructure, office buildings, government agencies and blocked roads.297 Although a local reaction this significant is not likely early on, law enforcement and emergency responders must prepare for extended periods of deprivation that may result in civil unrest. See the Civil Disturbance chapter for more detail.
Continuity of Operations and Delivery of Services The nature of the energy emergency may directly influence continuity of operations for the County. A shortage in propane, natural gas or heating oil should not significantly impact County operations or its delivery of services to residents. A short-term outage of electricity should have a minor impact for agencies or services that lack a back-up power source for their systems. Agencies or services with back-up power and fuel or generation capability should be unaffected in the short-term. A long-term outage of electricity will have a progressively increasing impact on operations and service delivery for agencies without back-up power. At some point, many scenarios suggest that agencies may be forced to seek portable power generation if available or relocate to temporary facilities that can provide the electrical power necessary to resume at least some level of operations. Agencies with organic power generation capability should be generally unaffected. A shortage or reduced availability of gasoline or diesel fuel should not initially cause County agencies to stop operations or prevent delivery of services. If the shortage continues, lack of fuel availability may force agencies to prioritize services in order to maximize what fuel is available. Emergency medical services, fire, law enforcement and transportation may be impacted to the greatest extent and could be forced to curtail or modify service delivery to reduce overall fuel consumption.
ENERGY EMERGENCY – PAGE 4-310 REGION 5 ALL HAZARD MITIGATION PLAN – 2020-2025 EDITION BASE PLAN
The worst-case scenario for the County is a long-term electrical outage combined with a shortage or loss of available gasoline or diesel fuel sources. The longer this situation lasts the greater the impact will be on County operations and especially its ability to deliver critical services. Back-up power generation capability will eventually fail as generators run out of fuel. Hospitals, emergency services, emergency communication and other critical County capabilities will be reduced significantly without external assistance. Community health risk increases as sewage treatment and water delivery systems begin to fail. County agencies that rely on automated systems to maintain operations will be forced to reduce or stop operations until system power can be restored. The County’s ability to support vulnerable populations will likely be significantly impacted the longer this scenario continues. The latter scenario is the least likely to happen but presents the greatest potential to significantly impact on County operations and the ability to deliver critical services to residents. It is likely that this type of energy emergency will be combined with a natural disaster or other significant emergency. That combination of effects can accelerate the impacts on already strained County resources and force difficult decisions in an effort to maintain the most critical services to support the greatest number of people.
Property, Facilities, and Infrastructure A shortage or reduced availability of fuel resources should not have a significant impact on property, facilities or infrastructure across the County. On the other hand, a solar storm could impact the electric grid, damaging transformers, telecommunication lines and pipelines of which many portions may no longer be fixable. A long-term electrical outage will impact infrastructure that is not supported by back-up power generation systems and may also require the closure of some County facilities that do not have back-up systems. As mentioned above, a long-term electrical outage combined with a shortage of fuels can have significant impacts on facilities and County infrastructure. Sewer, water treatment, water pumping, transportation and communication infrastructure can cease to function if the emergency lasts for an extended amount of time. Some infrastructure may even be seriously damaged by an extended power outage.
Environment The lack of energy by itself will not be detrimental to the environment. Rather it will be the impact of failing systems and individuals attempting to overcome the lack of energy. Systems such as wastewater treatment, off-gas scrubbers from coal or oil-fired industrial furnaces, electrostatic air filtration systems and others require large amounts of energy to function. A reduction or loss of energy resources can cause these systems to fail, which may result in unfiltered discharge of toxic substances into the local environment. If there is a wintertime failure of systems that provide heat to residents, there will likely be an increase in wood burning to compensate. Airborne particulate matter will likely increase as more and more fireplaces and wood stoves are used to heat homes. Additionally, the longer the interruption lasts, the more wood will be required to heat homes. This may result in a significant ENERGY EMERGENCY – PAGE 4-311 REGION 5 ALL HAZARD MITIGATION PLAN – 2020-2025 EDITION BASE PLAN
increase in wood cutting in local forests as well as urban areas. Over time, large wooded sections in both rural and urban areas could be significantly damaged. If the emergency is caused by reduced availability of gasoline or diesel fuel, hoarding may become a problem. The environmental concern is the storage of potentially large quantities of fuel in containers that were not designed for it. Spills and leaks of fuel into the ground water and river systems may be an issue. If these things happen, they will increase the overall recovery cost of the emergency.
Economic and Financial Condition A long-term energy emergency can impact the local economy long beyond the actual end of the emergency. Whether it is the loss or reduction of a single energy resource or a combined loss of multiple resources, there will be economic impacts that can last for a long time. Analyses from electrical outages across the country indicated that a 30-minute loss of power can result in an average fiscal loss of nearly $16,000.00 for a medium or large industrial company. That loss climbs to $94,000.00 for an eight-hour interruption.298 An analysis of various storm related electrical outrages put the total annual loss to the US economy between $20 billion and $55 billion.299 The total economic impact on energy technologies and infrastructure from a major solar storm event has been estimated by NASA to cost $2 Trillion within the first year. The damage of infrastructure could take weeks, months or even years to repair.300 Businesses that cannot open or have to limit their open hours due to rationing, will lose revenue. Small businesses are particularly vulnerable to this impact, especially if the outage lasts for an extended period. There will be cases that businesses will have to permanently close, because they are unable to financially recover from the outage. This could lead to a cascading effect whereby the loss of business will mean the loss of jobs for individuals who would normally spend their income on goods that other businesses supply. Loss of power can lead to spoilage in grocery stores and restaurants. These businesses must replace those items at a significant cost. Families will have to restock freezers and refrigerators when fresh items become available. Lower income families and small grocery stores will feel the effects of this most significantly. Social assistance requirements will likely increase following an extended loss of power. Loss of business means loss of tax revenue for governments at the same time there is an increase in the number of people needing financial support. The potentially corresponding increase in social assistance requirements and recovery costs can lead to a financial drain on County government. This may lead to subsequent cost saving decisions that can impact on programs, services, employees and County residents.
Public Confidence in the Jurisdiction’s Governance One of the assumed roles of government is the protection of the infrastructure and systems that make modern society operate. A major disruption can bring about the loss of support by the people. The County’s readiness to address the issues associated with an energy emergency and to ENERGY EMERGENCY – PAGE 4-312 REGION 5 ALL HAZARD MITIGATION PLAN – 2020-2025 EDITION BASE PLAN
provide services, while quickly restoring “normal” life for residents, will be the driving force that shapes public opinion and confidence. Without this, the public’s confidence in the jurisdiction’s ability to govern could be eroded. The jurisdiction’s public information efforts will be one of their most effective tools to shape opinions during an emergency. If that emergency is a loss of power, many of the systems to accomplish that task may not be functioning (TV, radio, computer, etc.). This will significantly increase the challenge of keeping the public informed of recovery efforts.
ENERGY EMERGENCY – PAGE 4-313 REGION 5 ALL HAZARD MITIGATION PLAN – 2020-2025 EDITION BASE PLAN
(This page intentionally left blank)
ENERGY EMERGENCY – PAGE 4-314 REGION 5 ALL HAZARD MITIGATION PLAN – 2020-2025 EDITION BASE PLAN
Technological Epidemic/Pandemic Hazard 4.7T301 Identification Description Definition An epidemic is a disease that spreads rapidly throughout a region’s or country’s population. Pandemic refers to an epidemic that has spread throughout a larger geographic area impacting multiple countries or continents.302
Types The best-known types of pandemics are influenza pandemics. These have been some of the deadliest plagues in history. It is estimated that, worldwide, the 1918 flu pandemic killed over 50,000,000 people. The latest example of this is the H1N1 “Swine Flu”. This flu strain is a recombination of swine, human and bird flu genes. Initial cases appeared in Veracruz, Mexico in the spring of 2009. Spreading through the population, it next moved to the United States and then eventually worldwide. Symptoms were mild for a large percentage of the population; however, those with a compromised immune system, pregnant women, or very young children had a more intense reaction to diseases than many others in the general population. Seasonal flu epidemics are a recurring phenomenon that migrates around the world. The flu virus tends to mutate allowing it to continuously re-infect the population. In the United States, annual flu respiratory infections range from 5 to 15 percent yearly. Other diseases with pandemic pedigrees are cholera, AIDS, and now emerging, tuberculosis. Each of these has been around for many years, and for cholera, tuberculosis and Ebola may break out into a rapidly moving pandemic again. AIDS while currently in a pandemic stage is unlikely to recede into the background anytime soon.
Profile Location and Extent Epidemics and pandemics have in the past covered the entire County. They will continue to do so in the future. To what extent they infect the public depends on their ease of transmittal. How serious the disease is to the individual depends on a number of factors including age, general health, lifestyle, occupation, etc. If they follow the pattern of the annual flu infecting 5 to 15 percent of the population, that would mean anywhere from 44,415 to 133,245 people in Pierce County could become infected.
EPIDEMIC/PANDEMIC – PAGE 4-315 REGION 5 ALL HAZARD MITIGATION PLAN – 2020-2025 EDITION BASE PLAN
Occurrences Pandemics and epidemics have plagued humans for thousands of years. As human populations began to congregate in cities, the potential for large scale epidemics grew. As this process continued and trade between the various population centers increased and so did the potential for the disease to spread. This eventually led to the potential for pandemics. Today with our mobile population, individuals can be in North America one day, in Europe the next and in Asia the next. This increases the ability for opportunistic diseases to migrate through the world’s population. Recent Epidemics have included: • 1976-2014 Ebola outbreaks Recent Pandemics303 have included: o 1918-1919: “Spanish Flu” Worldwide o 1957: “Asian influenza” o 1961-1970s: “7th Cholera pandemic”304 o 1968: “Hong Kong influenza” o 1981-Current: AIDS (Although pandemic in scale) o 2009-2010: “Swine Flu” o 2020 Coronavirus-19 (COVID-19)-Current In recent years, citizens have been the victims of a number of different diseases some of which are on the verge of being, or are already, epidemics or pandemics. These have had an impact on the effect on the population’s health in the County. A few of these include: •
Acquired immune deficiency syndrome (AIDS) was only discovered nationally in 1981 and is currently considered an epidemic in the United States.
•
Measles has been a major childhood disease ever since settlers with European heritage moved into Washington during the 1800s. Much of it has been controlled by vaccinations. However, in the 1990s, Washington experienced the largest measles epidemic since 1979.
•
Hepatitis B, a serious, highly contagious liver disease is frequent in Washington, including outbreaks in Pierce County.
•
Tuberculosis (TB) is another one of those diseases which has been around for many years. The belief, a few years ago, that it would soon be brought under control is no longer considered realistic. The development of strains that resist treatment, combined with lifestyles that allow the disease to be transferred easily, has allowed its resurgence during the past few years. Many people, once they become symptomatic, will continue to infect others until they themselves are located and given treatment. When left to themselves, many of those who initially resist treatment will also fail to complete treatment once the symptoms begin to disappear. This could lead to a later resurgence and contribute to the development of resistant strains. This is especially EPIDEMIC/PANDEMIC – PAGE 4-316 REGION 5 ALL HAZARD MITIGATION PLAN – 2020-2025 EDITION BASE PLAN
true in the denser urban cores. To counter this, the Tacoma/Pierce County Health Department has initiated a program of aggressive follow up to make sure that individuals complete a full course of their treatment. Without these preventative measures, the future could see a dramatic increase in the disease rate. It is estimated that between two and three new cases are diagnosed in the County each month. This may not seem like many but considering that nationally only a few years ago we appeared to be on the verge of eliminating the disease, the numbers appear depressing. •
The standard fall/winter flu season creates its own epidemic on a yearly basis with some strains causing greater damage than others. In cases like this, the elderly are hit the hardest, resulting in several deaths attributable to flu each year.
•
The highly publicized e-Coli epidemic in January of 1993, caused by tainted hamburger at fast food restaurants was an excellent example of how an epidemic we are not familiar with can suddenly enter our environment. In this case it infected a number of people and caused a great deal of suffering before anyone even realized it was happening. Pierce County’s toll in that epidemic was 73 infected individuals. In 1998, another e-Coli outbreak occurred in the County from an unknown source at the Puyallup Fair.
•
Another disease that has come to the foreground in Washington is Lyme Disease. While the first reported case in Washington was in 1987, cases have increased from year to year with the large number of people recreating in our wilderness areas, there is potential for the number of cases to expand rapidly.
•
Hantavirus Pulmonary Syndrome (HPS) is another one of those emerging diseases. HPS was first reported in the United States in the spring of 1993. As of November 2001, 288 cases had been reported in the U.S. and about 38 percent of the people died as a result of the infection. There have been a few cases reported within Washington State, none contacted in Pierce County. Deer and mice shed the virus in their urine, saliva, and droppings. Exposure comes through breathing dust after cleaning rodent droppings or disturbing nests, or by living or working in rodent-infested settings. Testing shows that approximately 10% of the deer and mice tested are carriers of the disease.
Recurrence Rate There have been four flu pandemics in the past 100 years with three of them being in the last 60 years. This produces a recurrence rate for pandemic flu of 25 years or less. Other pandemics like the cholera pandemic, the AIDS pandemic, the possibly evolving tuberculosis pandemic, and Coronavirus pandemic reveal that taking all types of pandemics together will bring the recurrence rate down to 20 years or less.
Impacts Health and Safety of Persons in the Affected Area at the Time of the Incident
EPIDEMIC/PANDEMIC – PAGE 4-317 REGION 5 ALL HAZARD MITIGATION PLAN – 2020-2025 EDITION BASE PLAN
With epidemics and pandemics there is no area unaffected by the spread of the disease. The impact on citizens is acute illness and depending on which disease they catch there could be respiratory problems, vomiting, diarrhea, sore muscles, joint pain, weakness, spitting up blood, coma or death. For some diseases, and this includes the 1918 “Spanish Flu,” many people develop long term physical complications, or due to brain damage, there may be long term, residual, mental impairment.
Health and Safety of Personnel Responding to the Incident Responders will be mostly from the medial services in fire departments, ambulance attendants and hospital personnel. Those diseases that are transmitted through human-to-human contact will put the rescuer in danger of coming down with the same disease.
Continuity of Operations and Delivery of Services
Figure 4.17-1 Individuals Hoping to Avoid Contracting Disease
Depending on the severity of the epidemic or pandemic there could be problems with continuity of operations and the delivery of services. As staff members stay home because they themselves are ill, they are caring for others or because they fear contracting the disease, the ability of the County, or the other jurisdictions within it, to maintain delivery of services to their constituents could be severely limited. As the incidence of disease increases, there could be a loss of operational continuity within individual departments.
Property, Facilities, and Infrastructure There should be no direct impact to property, facilities or the physical infrastructure. Indirect impacts could develop due to lack of maintenance on equipment, property or facilities. However, with an epidemic or pandemic, if the symptoms of the disease are severe, with many people requiring skilled nursing or hospital care, it would overwhelm the medical infrastructure.
Environment Epidemics and pandemics do not normally disrupt the environment. As a human disease they infect humans, and in some cases, certain animals. The avian flu H1N5 has attacked certain bird populations with a high rate of morbidity and mortality. This is also the case with West Nile Virus which is now moving through the bird population here in Washington State. It is possible that other diseases might make the jump between humans and animals, increasing animal illness and death.
Economic and Financial Condition Seasonal flu by itself causes considerable economic hardship due to lost productivity305, high medical costs and lost wages. In the United States these costs range from $71 to $167 billion dollars a year.306 With a pandemic, if the symptoms of the disease are severe, including long periods of illness, or residual, debilitating effects, it could impact the economy of the County for EPIDEMIC/PANDEMIC – PAGE 4-318 REGION 5 ALL HAZARD MITIGATION PLAN – 2020-2025 EDITION BASE PLAN
years. The need to alter or prevent the normal social contacts, called “social distancing,” will lead to a further temporary decrease in the financial condition of the community.
EPIDEMIC/PANDEMIC – PAGE 4-319 REGION 5 ALL HAZARD MITIGATION PLAN – 2020-2025 EDITION BASE PLAN
Public Confidence in the Jurisdiction’s Governance An epidemic or pandemic can shake the confidence of the public across all social groups. As an ever-larger portion of the population becomes ill, demands for limited and controlled medical supplies could cause questions to arise concerning the methods of distribution. Inadequate response to the public’s concerns about the supplies or the method of distribution could lead to not only lack of confidence, but outright hostility towards both those in power and those who hold the reins of distribution. If there is a decision to isolate those who are ill, restrict travel, cancel public events, close schools and businesses or take other, possibly controversial, actions or positions, there could be strong public resistance. Any action would have to be partnered with a strong public relations campaign to convince the public that it may be necessary. If the actions are truly perceived by the public to be in their best interest, the confidence in government may survive.
EPIDEMIC/PANDEMIC – PAGE 4-320 REGION 5 ALL HAZARD MITIGATION PLAN – 2020-2025 EDITION BASE PLAN
Technological Hazardous Material 4.8T Identification Description Definition Hazardous materials are materials, which because of their chemical, physical or biological properties, pose a potential risk to life, health, the environment, or property when not properly contained. A hazardous material release then is the release of the material from its container into the local environment.
Types It includes materials that are explosive, flammable, combustible, corrosive, reactive, poisonous, biological or radioactive. They can be in a solid, liquid or gaseous state. Of increasing interest is Bakken crude oil. This is due to a combination of the physical and chemical properties, and related hazards, combined with the fact that the very large quantities transported have the potential to create very large explosions, fires and environmental degradation of the environment. Prior to 2012 there were no trains carrying Bakken oil into or through Pierce County. Today that has changed. There are on average an estimated 15 trains of around 100 cars each week carrying Bakken Oil into or through Pierce County. Note that there is a variation in the properties of crude oil since each oil field or even wells in the same oilfield will not produce the same type of crude oil.307 Table 4.18-1. List of constituents or ingredients found in Bakken crude oil.308
Profile Location and Extent Hazardous materials incidents may be either generated from a fixed site or the result of a transportation related accident or release. Not included here are terrorist incidents or radioactive releases from a fixed nuclear facility (FNF). Hazardous materials used in terrorism are covered HAZARDOUS MATERIALS – PAGE 4-321 REGION 5 ALL HAZARD MITIGATION PLAN – 2020-2025 EDITION BASE PLAN
in the Terrorism chapter. As there are currently no local fixed nuclear facilities that would be an immediate threat through the release of material to Pierce County, they are not included in this chapter. Hazardous materials are classified into four groups of chemicals under Title III of the Superfund Amendments and Reauthorization Act of 1986 (SARA Title III). These are: 1. Extremely Hazardous Substances – These chemicals have acutely toxic properties. Includes approximately 366 chemicals. 2. Hazardous Substances – Includes approximately 720 chemicals. 3. Hazardous Chemicals – Inventories of these chemicals and material safety data sheets for each must be submitted if they are present at the chemical facility in certain amounts. 4. Toxic Chemicals – Chemicals or chemical categories that appear on the list because of their chronic or long-term toxicity. Includes 325 chemicals. Chemicals within these categories have different reporting requirements as to quantities on site that need to be reported. The reporting forms, Tier II forms, go to the Washington State Department of Ecology, the Local Emergency Planning Committee of Pierce County located at the Department of Emergency Management and the local fire department or district. Table 4.18-2. Environmental Protection Agency’s Identified Top Five Facilities.309
HAZARDOUS MATERIALS – PAGE 4-322 REGION 5 ALL HAZARD MITIGATION PLAN – 2020-2025 EDITION BASE PLAN
Figure 4.18-1 Exxon Valdez Oil Spill, 1989
Occurrences The defining moment in the control of hazardous materials is the December 1984 Union Carbide release of Methyl Isocyanate gas in Bhopal, India. This, the worst industrial accident in history, killed over 3,000 people initially and left others blinded or with other handicaps. Over one million claims were made for damages from the release, of which 574,366 claims were awarded damages.310
Hazardous material spills are a regular part of response organizations operations in Pierce County. While most reported spills are relatively minor, such as small amounts of hydraulic fluid or diesel, there are occasional spills that tax response organizations. Notification of many small spills initially comes to the County from the Washington Emergency Management Division (WEMD), who may receive a notification from a citizen, a local jurisdiction, the Department of Ecology or the National Response Center, an office within the U.S. Coast Guard. While there have been hazardous material releases in Pierce County, some of which have had fatal consequences, there has not been a truly large-scale incident that resulted in a number of deaths or injuries. This is also true when it comes to railroad accidents. Although there have not been any major hazardous materials derailments in Pierce County that have resulted in loss of life, there have been cases in Canada and other areas of the United States. With the rise of crude oil incidents, “crude oil emergency incidents have now become higher probability – high consequence events.” The Pipeline and Hazardous Materials Safety Administration (PHMSA) further indicates that there is a higher risk as seen with recent derailments and the resulting fires. There are two major derailments of significance, the first is the Lac-Mégantic, Quebec, Canada 63 car derailment on July 5, 2013 which resulted in the death of 47 people due to fire and other effects of the accident.311 The other derailment was on April 30, 2014 in Lynchburg, Virginia where 17 of 105 tank cars fell into the James River, spilling almost 30,000 gallons of oil.312 The last two largest spills that have caused major problems within Pierce County are the February 12, 2007 Chlorine Spill in the Port of Tacoma313 and the Dalco Passage Oil Spill of October 13, 2004.314,315 Both of these required a major response by responders and in the case of the Dalco Passage spill took many days to clean up.
HAZARDOUS MATERIALS – PAGE 4-323 REGION 5 ALL HAZARD MITIGATION PLAN – 2020-2025 EDITION BASE PLAN
Table 4.18-3 Pierce County Spill Data from May 2018 to May 2019316
Incident Category
Number of Incidents
Oil
335
Pollution
82
Hazmat/Chemical
19
Drug Labs
7
Boat Sinking/Grounding
7
Rail
6
Vessel Casualty
3
Aircraft
1
Fire/Explosion
1 Total
461
Table 4.18-1 does not include non-industrial releases. While many small releases enter the environment from small boats, cars, trucks and other sources, one type of spill has decreased over the past few years: the number of illegal methamphetamine sites. From a high of 258 sites in 2001317, it decreased to 56 sites in 2009.318 Table 4.18-3 lists the reported releases of all hazardous chemicals in Pierce County for 20182019. Recurrence Rate Spills of small quantities of hazardous materials happen regularly. These can range from a meth lab being located and needing clean up to a diesel spill on the highway. Taking all these factors into account we could say that there are hazardous chemical spills annually. However, the large spills that could impact a significant portion of the public and create major economic or environmental problems are a five year, or less, occurrence.
Impacts Health and Safety of Persons in the Affected Area at the Time of the Incident Depending on the hazardous material(s) involved, the quantity, proximity of exposures and the current environmental factors during the time of the incident, the impact to persons in the affected area may range from negligible to fatal.319 Initial reactions to inhaled hazardous gasses HAZARDOUS MATERIALS – PAGE 4-324 REGION 5 ALL HAZARD MITIGATION PLAN – 2020-2025 EDITION BASE PLAN
may include respiratory problems, burning sensation in the mouth, nose, and eyes, loss of consciousness, dizziness, suffocation and death. Some substances in a solid or liquid state can be absorbed through the skin. Others, like caustics and acids, may cause burns on contact. For some chemicals there are residual problems that might not present themselves for years. Some of these leave lung lesions or impact other internal organs. These may result in later development of emphysema or various cancers.
Health and Safety of Personnel Responding to the Incident Personnel responding to a hazardous chemical spill, if not properly protected, are subject to the same physical problems as the initial victims.320
Continuity of Operations and Delivery of Services Most hazardous materials spills will impact a limited area. If within that area are governmental operations that may be impacted, then there could be a decrease in the delivery of services. If the chemical is such that an area must be closed for a lengthy period of time or destroys the method of service delivery, then for the necessary services to be maintained new routing or a new method of delivery will need to be developed. If the spill impacts some portion of an agency or government directly then there may be a loss in operational continuity.
Property, Facilities, and Infrastructure Property, facilities and the infrastructure may all be damaged by different individual spills. Hazardous material spills may contaminate a facility so that it must undergo extensive cleaning, or in the case of some radioactive materials, abandoned permanently. They may ignite or explode, destroying any object in their proximity. They may corrode facilities or infrastructure leaving it in need of replacement.
Environment Environmental impacts can range from the relatively minor or short term, as are many of the spills that happen in the County, on an annual basis to those that cause major impacts over multiple years. Two major national incidents, the Exxon Valdez oil spill and the Cantara/Dunsmuir spill show how a major spill can damage the environment, sometimes for decades. The damage in the aftermath of the 1989 Exxon Valdez oil spill has continued to plague the environment. While the actual death of wildlife has declined other issues have continued. Studies have shown that “lingering oil deposits affect species over many years…” In many species “sublethal, chronic doses compromise health, growth and reproduction…” This can have a cascade impact as the various “impaired species interact negatively with one another…321" In the case of the Cantara/Dunsmuir chemical spill of July 14, 1991, 19,000 gallons of metam sodium, a potent herbicide and pesticide that is usually used to sterilize soil, spilled from a train tank car into the Upper Sacramento River. It killed off all aquatic life in the river and damaged HAZARDOUS MATERIALS – PAGE 4-325 REGION 5 ALL HAZARD MITIGATION PLAN – 2020-2025 EDITION BASE PLAN
Figure 4.18-2 Dalco Passage Oil Spill Clean Up322
the riparian habitat for 41 miles to Lake Shasta. Its initial reaction with water created a toxic cloud that kept responders away until it had dissipated.
Vegetative damage from the spill resulted in a sudden and catastrophic reduction in canopy cover and foliage along the river, with a corresponding dramatic loss of many wildlife species dependent on the river’s riparian vegetation. Wildlife such as birds, bats, otters, and mink either starved or were forced to move because their food sources were no longer available. Ultimately, over a million fish, and tens of thousands of amphibians and crayfish were killed. Millions of aquatic invertebrates, including insects and mollusks, which form the basis of the river’s ecosystem, were destroyed. Hundreds of thousands of willows, alders, and cottonwoods eventually died. Many more were severely injured. The chemical plume left a 41-mile wake of destruction, from the spill site to the entry point of the river into Shasta Lake.323 The damage caused by both of these spills to the environment has taken many years to overcome and residual impacts may still be felt.
Economic and Financial Condition The economic consequences of a large hazardous material spill can be wide ranging and can last for years. Financial problems are dependent on the chemical(s) released; the size of the spill; the number and size of the businesses impacted; the number of homes impacted or destroyed; which pieces of infrastructure have been impacted; and, the complexity of, and length of time to complete, the cleanup. If the facilities have burned or the cleanup takes a lengthy period of time the economic losses are compounded. If the chemical(s) released do not allow cleanup, as a radioactive substance might, the economic impact could be permanent.
HAZARDOUS MATERIALS – PAGE 4-326 REGION 5 ALL HAZARD MITIGATION PLAN – 2020-2025 EDITION BASE PLAN
Public Confidence in the Jurisdiction’s Governance Generally, there is no change in the public’s confidence in a jurisdiction for the routine small spills. Public scrutiny of the role local government played in the handling of a large or dangerous spill will impact the way it is regarded in the future.
HAZARDOUS MATERIALS – PAGE 4-327 REGION 5 ALL HAZARD MITIGATION PLAN – 2020-2025 EDITION BASE PLAN
(This page intentionally left blank)
HAZARDOUS MATERIALS – PAGE 4-328 REGION 5 ALL HAZARD MITIGATION PLAN – 2020-2025 EDITION BASE PLAN
Technological Pipelines Hazard 4.9T Identification Description Definition Although there are many different substances transported through pipelines including sewage, water and even beer, this chapter will focus on transportation arteries carrying hazardous liquids and gaseous substances.324 According to the U.S. Code Title 49 Subtitle VIII Chapter 601, “Pipeline transportation means transporting gas and transporting hazardous liquid.”325 Pipelines may be buried or above ground.
Types This chapter is concerned with the two interstate pipelines that transport petroleum products and natural gas through Pierce County and the pipeline that delivers jet fuel to Joint Base Lewis/McChord. Any of these three could have a catastrophic spill or leak that could devastate a large area in its proximity. While there are crude oil pipelines in Washington, there are none in Pierce County. In addition, the small gas pipeline systems for local distribution, while not operated or controlled by the pipeline companies, can also pose a safety risk. Cities, towns and those portions of the County that have gas distribution systems need to be conscious of the condition of any underground gas pipeline systems serving their facilities. For the purposes of this section we will consider only those three companies transporting large quantities of product over distance, not the distribution and residential systems prevalent in many of our communities.
Profile Location and Extent Current Pierce County pipelines include Northwest Pipeline Corp, Olympic Pipeline Company, and Par Pacific. Between these they contain 80.93 miles of natural gas pipeline and 44.68 miles of liquid petroleum product pipeline. (See Map 4.19-1 Pierce County Pipelines.) Northwest Pipeline Corporation326 is a primary conveyer of natural gas to the Pacific Northwest and the Intermountain Region. It transports natural gas at a pressure of up to 960 pounds per square inch (psi). A subsidiary of Williams Pipeline, it enters the County as a 30-inch line from the north on the Muckleshoot Indian Reservation. Crossing to the west of Lake Tapps, it skirts the eastern edge of Sumner and the southeastern portions of Puyallup. Here at 192nd it joins a 36-inch line that replaces an old 26-inch line327. It then crosses Meridian around 122nd and continues southwest until just east of McKenna where it crosses the Nisqually River.
PIPELINES – PAGE 4-329 REGION 5 ALL HAZARD MITIGATION PLAN – 2020-2025 EDITION BASE PLAN
Olympic Pipeline Company has a 14-inch gasoline pipeline that runs through Pierce County coming in from the north along the Interstate 5 corridor, passing through the west edge of Milton and the south section of Fife. In Fife, the main line turns south, crosses the Puyallup River and proceeds to Fredrickson. From there it changes direction going southwest. It crosses Joint Base Lewis/McChord, goes through Roy and crosses the Nisqually River downstream of McKenna. It carries gasoline, diesel and aviation fuel at pressures of up to 1,400 psi. There are two transfer points for fuel in Pierce County. The first, the Tacoma Delivery Facility, delivers fuel through feeder lines to a number of points in the Tacoma port/industrial area. The second, the Spanaway Delivery Facility, delivers fuel to Puget Power.329 McChord Pipeline is a wholly owned subsidiary of Par Pacific Holdings Inc. At 14.25 miles in length it is the shortest of the pipelines in Pierce County. It transports JP-8 jet fuel from the terminal in the Port of Tacoma, to Joint Base Lewis/McChord.330
Occurrences
Table 4.19-1 Cities & Towns with Interstate Pipelines within, or within 1 Mile of City Limits328 Bonney Lake Edgewood Fife Lakewood Milton Puyallup Roy Sumner Tacoma
One of the larger pipeline incidents, and one that could have caused even greater damage, was the rupture of the 16-inch gasoline line owned by Olympic Pipe Line Company, on the afternoon of June 10, 1999 in Bellingham. That spill of 277,200 gallons of gasoline into Hanna and Whatcom creeks exploded killing three boys. The resulting fireball sent a plume of smoke 30,000 feet into the air.331 (See Figure 4.19-1 Olympic Pipe Line Rupture 06/10/99.) That incident could have been much worse if the Figure 4.19-1 Olympic Pipeline Rupture 06/10/99 gasoline had not ignited before entering much the downtown portions of Bellingham. Instead, by igniting when it did, most of the damage was confined to Whatcom Falls Park, a few residences and the water treatment plant located at the park. The only significant occurrence of a spill, on any line, natural gas or petroleum product, was the Northwest Pipeline Corporation natural gas incident May 1st 2003, in Sumner332. This incident, caused by pipe corrosion, did not result in an explosion. However, the venting gas was heard for some distance and a small area nearby was evacuated. The line was shut down and repaired without further incident. Recurrence Rate The transportation of both natural gas and refined petroleum products is most safely done through the use of pipelines. Due to the immense quantities of product that have to be delivered PIPELINES – PAGE 4-330 REGION 5 ALL HAZARD MITIGATION PLAN – 2020-2025 EDITION BASE PLAN
throughout the country, not only would it be nearly impossible to fill the need with trucks, it would also increase dramatically the potential for accidents and the resulting spills on the highways. While minor leaks happen in the local distribution systems, a major leak from either a natural gas or gasoline pipeline is a rare occurrence. With only one Pierce County incident recorded in the past ten years the recurrence rate is estimated to be ten years or more.
PIPELINES – PAGE 4-331 REGION 5 ALL HAZARD MITIGATION PLAN – 2020-2025 EDITION BASE PLAN
Map 4.19-1 Pierce County Pipelines
PIPELINES – PAGE 4-332 REGION 5 ALL HAZARD MITIGATION PLAN – 2020-2025 EDITION BASE PLAN
Impacts The impacts from a natural gas pipeline incident compared to one from a petroleum product pipeline can be quite different. This section will therefore treat the two as separate incidents. It must also be acknowledged that this section is based on a single break at any one time. In the advent of an earthquake there could be many breaks along one or more of the pipelines at the same time. This will increase the risk near the pipelines to individuals, businesses, the infrastructure and the environment.
Health and Safety of Persons in the Affected Area at the Time of the Incident Natural Gas Pipeline Natural gas is listed as a hazardous material due to its flammability. While it is non-toxic it can replace the oxygen in the blood stream causing suffocation. 333 Natural gas is 40 percent lighter than air so a release from a rupture will tend to rapidly rise into the atmosphere. This limits the potential for suffocation unless a person is in an enclosed space directly within the area of the leak where the gas may be able to replace the oxygen. While flammability and the explosive nature of the gas is the main threat it takes a proper ratio of gas to air to create a combustible mixture. The approximate range of flammability is from 4.0 to 14.0 percent.334 Unless there is the proper mixture of gas and air combined with a spark or fire, there will be no explosion. In most cases of natural gas pipeline ruptures there are no fiery explosions, no injuries and no deaths. Data from all-natural gas pipeline incidents in Washington State from 2000 to 2009 show a total of only seven incidents, none of which had a fatality or injury associated with it.335 Health and safety impacts in the affected area can range from minor burns, including frostbite from the cooling gas, and difficulty breathing, to death from aspiration or explosion. Petroleum Product Pipeline Petroleum product vapors coming from a liquid spill are the initial threat to persons in the impacted area. The vapors are heavier than air and so will pool in low areas. Inhalation of the vapors can cause nose or lung irritation, produce dizziness or headaches, vomiting, and in large enough quantities can lead to coma and death.336 Suffocation is a real possibility in low areas, gullies, creeks or basins. Of the three people killed by June 10, 1999 Olympic Pipe Line rupture in Bellingham one, while fishing, was overcome by the fumes, fell into the creek and drowned prior to the ignition337. The biggest threat to lives is through ignition of the product. Ignition of the various petroleum products, whether they are gasoline, diesel, or a kerosene product can injure anyone in the vicinity. Burns ranging from minor to fatal would be the primary impact on those in the vicinity of an explosion.
PIPELINES – PAGE 4-333 REGION 5 ALL HAZARD MITIGATION PLAN – 2020-2025 EDITION BASE PLAN
Health and Safety of Personnel Responding to the Incident Natural Gas Pipeline With the natural tendency of the gas to escape into the atmosphere there should be little threat to first responders. As soon as a leak or rupture is discovered Northwest Pipeline will shut off the gas flow and allow the remaining gas in the line to dissipate. If the gas has ignited, shutting it off will allow the flame to burn itself out. Then a repair crew will go in and repair the line. A threat to first responders is possible when a person is injured requiring aid, in the vicinity of the leak or break. The possibility of an ignition source close to the break causing it to ignite, or medical or rescue personnel themselves, unwittingly causing it to explode, could cause injury or death to the responders. Petroleum Product Pipeline The threat to rescuers is the same as for the public. Petroleum product vapors coming from a liquid spill will be a threat to first responders attempting to rescue those in the impacted area. Entering the impacted area could open first responders to both the explosive potential of the product as well as the physical consequences of inhaling the vapors. As with the public, the biggest threat to lives is through ignition of the product.
Continuity of Operations and Delivery of Services Natural Gas Pipeline A rupture of a natural gas pipeline could cause a disruption in the delivery of services to the localized area impacted by the break. Due to natural gas being forty percent lighter than air there will be little if any dispersion into the surrounding community. If a break occurred near or under a major transportation route it could require rerouting of services around the area until the line is repaired. If in a community, it could require the evacuation of residents, businesses, or governmental offices for a period of time until the line is closed, the pressure reduced and the gas line purged of any remaining product. If a rupture resulted in a fire, local buildings may be directly impacted and if they belong to a local governmental body it could further delay some services. Due to the limited area impacted by any natural gas pipeline rupture; there should be no loss of service delivery for any extended period of time and no disruption of governmental operations. Petroleum Product Pipeline Both petroleum pipelines are located in areas that include high industrial, business and infrastructure use. The 1999 Olympic Pipe Line rupture and spill in Bellingham provides a perfect example of the kind and size of spill that is possible in Pierce County. Depending on its location, a break causing a significant release, with or without an explosion or fire, could require evacuation of many homes, businesses, schools, and government buildings. In the right place it could require the closing of the interstate or State Route 512. While a release, even with an explosion and fire will not shut down the County’s operations, it will prevent the delivery of services to the impacted area. Depending on the size of the spill, its location, the population PIPELINES – PAGE 4-334 REGION 5 ALL HAZARD MITIGATION PLAN – 2020-2025 EDITION BASE PLAN
impacted, and whether it ignites, service delivery could be compromised for a period ranging from a couple of days to weeks.
Property, Facilities, and Infrastructure Natural Gas Pipeline During a rupture, the pressure in a natural gas pipeline can disrupt or blow the soil from above the break. Any facility or piece of infrastructure over or adjacent to the rupture could be damaged or destroyed. If the gas ignites it will set flammable objects above it or near it on fire. Depending on environmental factors such as wind, proximity of vegetation or other fuels, and dryness of the environment, the fire could spread to other nearby structures damaging or destroying them. Petroleum Product Pipeline A spill that does not ignite is treated as a very large hazardous chemical spill. It can contaminate buildings and destroy equipment and documents. As a liquid, its tendency to impregnate porous material can irreparably damage many items requiring their replacement. The biggest threat from a petroleum product pipeline rupture is from the potential fire or explosion, if the spill ignites. It can destroy property, buildings, equipment, businesses and government records. The heat can melt and ignite road asphalt, destroy electric powerlines, and weaken the metal on transmission and cell towers. It can damage bridges and railroad lines forcing a rerouting of normal traffic possibly for Figure 4.19-1 Whatcom Falls Park, 2003338 months.
Environment Natural Gas Pipeline Environmental damage from a natural gas pipeline should be very limited even if a fire has started. The immediate disruption to the surface environment will take a while to re-vegetate, but without a fire there should be no long-term effects. If a fire is initiated, the impact will be more apparent, but, like any other fire will eventually heal. With a natural gas line rupture there are few if any residual products in the soil that could cause environmental problems years later. Petroleum Product Pipeline Spills from a petroleum product pipeline can have a major long-term impact on the environment even if the product does not ignite. Petroleum PIPELINES – PAGE 4-335 REGION 5 ALL HAZARD MITIGATION PLAN – 2020-2025 EDITION BASE PLAN
products, in concentration, are hazardous to both plants and animals. Acute sort term exposure by animals can cause burns, eye irritation, neurological impacts and lung damage that can in many cases lead to coma and death.339 Liquid petroleum products will, like water, seek the lowest place. A large spill will therefore flow down gullies, entering streams and rivers damaging fish, fish habitat waterfowl, and mammals that rely on that watercourse. A spill’s long-term environmental impacts can include pollution of the soil, the groundwater, and even, depending on the underlying strata, the local aquifer. A large petroleum pipeline rupture resulting in an explosion and fire will effectively destroy all vegetation and animal life in the burned area. Eventually this will begin to return to the pre-spill condition, although, depending on the scale of the damage, it might take years. Figure 4.19-2 shows the resurgence of vegetation in Bellingham’s Whatcom Falls Park in 2003, four years after the spill and explosion that destroyed large portions of it. While the tall firs that were destroyed still stand the understory has already largely reclaimed the damaged property.
Economic and Financial Condition Natural Gas Pipeline Due to the usually limited nature of the damage from a natural gas pipeline rupture and explosion the economic impacts should be limited to any businesses in the immediate vicinity of the rupture and to the owner of the pipeline itself. Unless there is direct damage to roads or rail, rerouted traffic should be back to normal within a short period after the line has been purged and any fire put out. Petroleum Product Pipeline The economic and financial impact from a petroleum product pipeline rupture, spill and explosion would vary considerably depending on where in the County the incident happened. A rupture and resulting explosion in the Port of Tacoma could destroy a number of businesses, temporarily close down some international shipping terminals, and impact rail lines. If close to Interstate 5, it could close the freeway requiring a rerouting of north-south traffic until such time as the fire is put out and clean up around the freeway is complete. In contrast, a rupture, with a resulting fire, in the southern portion of the County would impact a small, local population. While the economic impact to those communities would be high the overall impact to the County would probably not be very great.
Public Confidence in the Jurisdiction’s Governance Natural Gas Pipeline Unless there is some circumstance that exacerbates the problems associated with the rupture there should be little if any impact on the public’s confidence in whichever jurisdiction the incident happens. Normal response should be similar to the natural gas line rupture in Sumner, May 1st, 2003. In this case there was a small evacuation, the fire department responded, Northwest Pipeline shut down the gas, bled out the line and repaired it. PIPELINES – PAGE 4-336 REGION 5 ALL HAZARD MITIGATION PLAN – 2020-2025 EDITION BASE PLAN
If there are exacerbating problems, for example a highway closure, fiery explosion damaging buildings or causing deaths, the public’s confidence will depend entirely on how effective the response was perceived to be. If there are questions about the response, the public’s confidence will decrease. If the response is perceived to be good there will be no decrease in the public’s perception of the incident, and it will be quickly forgotten. Petroleum Product Pipeline The public’s confidence will be directly related first to the immediate impact on themselves. A spill and explosion in the southern, more rural portion of the County that impacts very few people will not have people questioning the response nearly as much as one in the more populated, industrialized portions. This is especially true if there are many deaths, economic loss is great, or the infrastructure that impacts them personally is compromised. There will be comparisons with the 1999 Bellingham incident that will question whether the oversight that was implemented since then, was adequate and carried out.
PIPELINES – PAGE 4-337 REGION 5 ALL HAZARD MITIGATION PLAN – 2020-2025 EDITION BASE PLAN
(This page intentionally left blank)
PIPELINES – PAGE 4-338 REGION 5 ALL HAZARD MITIGATION PLAN – 2020-2025 EDITION BASE PLAN
Technological Terrorism Hazard 4.10T Identification Description Definition Title 18 of the United States Code defines terrorism and lists the crimes associated with terrorism. In Section 2331 of Chapter 113(B), defines terrorism as: “…activities that involve violent… or life-threatening acts… that are a violation of the criminal laws of the United States or of any State and… appear to be intended (i) to intimidate or coerce a civilian population; (ii) to influence the policy of a government by intimidation or coercion; or (iii) to affect the conduct of a government by mass destruction, assassination, or kidnapping; and…(C) occur primarily within the territorial jurisdiction of the United States…” . Within the government, combating terrorism is the Federal Bureau of Investigation’s top investigative priority. The FBI further defines terrorism as either domestic or international: •
•
Domestic terrorism: Perpetrated by individuals and/or groups inspired by or associated with primarily U.S.-based movements that espouse extremist ideologies of a political, religious, social, racial, or environmental nature. International terrorism: Perpetrated by individuals and/or groups inspired by or associated with designated foreign terrorist organizations or nations (state-sponsored).
The terrorism threat has evolved significantly since the September 11, 2001 series of coordinated attacks by the Islamist terrorist group al-Qaeda against the United States. The threat landscape (referring to identified threats, trends observed, and threat actors) has expanded considerably. Three factors have contributed to the evolution and expansion of the terrorism threat landscape:340 •
•
•
Internet: International and domestic threat actors have developed an extensive presence on the Internet through messaging platforms and online images, videos, and publications, which facilitate the groups’ ability to radicalize and recruit individuals receptive to extremist messaging. Social Media: Social media has allowed both international and domestic terrorists to gain unprecedented, virtual access to people living in the US in an effort to enable homeland attacks. Islamic State of Iraq and Syria (ISIS), in particular, encourages sympathizers to carry out simple attacks where they are located against targets—in particular, soft targets. This message has resonated with supporters in the US and abroad. Several recent attackers have claimed to be acting on ISIS’ behalf. Homegrown Violent Extremists (HVEs): The FBI defines HVEs as global-jihadinspired individuals who are based in the US, have been radicalized primarily in the US, and are not directly collaborating with a foreign terrorist organization (FTO). HVEs may assemble in groups but typically act independently in attacks or other acts of violence.
TERRORISM – PAGE 4-339 REGION 5 ALL HAZARD MITIGATION PLAN – 2020-2025 EDITION BASE PLAN
Domestic terrorists can be ‘right-wing’ or ‘left-wing’ extremists such as white supremacists, anti-government militias or anarchists. Domestic terrorists can also be ‘single-issue’ groups such as animal rights or environmental rights extremists. And, domestic terrorists can also be ‘lone wolves’ with a personal agenda or grievance and prepares, commits violent acts alone outside of any group support. According to FBI Director Senate testimony in July 2019, the bureau has recorded about 100 domestic terrorism arrests since December 2018 compared to about 100 international terrorism arrests. The FBI, according to the director’s testimony, is most concerned with “lone offender attacks, primarily shootings.” Earlier, at a congressional hearing in May 2018, the head of the FBI counterterrorism division testified that the bureau was investigating 850 domestic terrorism cases and of that approximately 350 of the cases involved racially motivated violent extremists341. Most in that group, he said, were white supremacists. In 2015, the Seattle division of the FBI revealed 70-100 active cases possibly linked to terrorism across the state.342 In the years since revealing the breadth of terrorism investigations in Washington State, domestic terrorism arrests outpaced jihad-inspired terrorism arrests nationwide.343 The US government acknowledged the problem in its October 2018 ‘National Strategy for Counterterrorism’. "Notably, domestic terrorism in the United States is on the rise, with an increasing number of fatalities and violent nonlethal acts committed by domestic terrorists against people and property," the strategy paper says.344
Profile Location and Extent Terrorism events can be distinguished from other types of man-made hazards by three important considerations:345 •
In the case of chemical, biological, and radioactive agents, there presence may not be immediately obvious, making it difficult to determine when and where they were released, who was exposed, and what danger is present for first responders. • Terrorist events evoke very strong emotional reactions, ranging from anxiety, to fear to anger, to despair to depression. • Even failed attacks have long-term economic impacts for the targeted government and critical infrastructure sector disproportionate to the cost of the attack itself. The form and locations of many natural hazards are identifiable and, even in some cases, predictable; however, there is no defined geographic boundary for terrorism. Based on previous historical events, it is presumed that critical facilities, services, and large gatherings of people are at higher risk. Pierce County has areas of concentrated population and venues and events that draw large crowds. It also has significant infrastructure that is important locally as well as nationally. The county is a key component in the Pacific Northwest transportation network that supports extensive domestic and international commerce. There are key transportation nodes and routes that cannot be easily replaced or bypassed. TERRORISM – PAGE 4-340 REGION 5 ALL HAZARD MITIGATION PLAN – 2020-2025 EDITION BASE PLAN
One of largest joint military bases in the Department of Defense resides in Pierce County. Joint Base Lewis-McChord (JBLM) is the jumping off point for the United States’ military and strategic influence across the Pacific Rim. Additionally, there are multiple Reserve Component and military recruiting facilities throughout the county. There are significant populations of military personnel and their families residing in the communities surrounding JBLM as well as a significant number of county residents who are employed on the base. The rural areas of the county contain large swaths of private, state and national forests. Additionally, it contains the Mount Rainier National Park. These areas are sources of revenue and employment for Pierce County residents. English-language terrorist media continues to identify similar gatherings as “soft targets” and promote them as potential attack sites. For example, Inspire #12 magazine published online by Al Qaeda, suggested targeting locations “flooded with individuals, e.g., sports events . . . election campaigns, festivals, and other gathering [sic]. The important thing is that you target people and not buildings.”346 Attacks targeting these types of events will continue to present security challenges to public safety personnel, because attendees are anonymous and generally unscreened for prohibited items. Violent extremist propaganda continues to urge lone actors to attack soft targets using small arms, knives, and vehicles because they are simple and effective. Foreign terrorist organizations implore followers to kill with whatever means available “whether an explosive device, a bullet, a knife, a car, a rock, or even a boot or a fist.”347
Occurrences Prior to the attacks on September 11, 2001, there were less than a dozen major terrorist events in Washington State. Since then, violent extremism has become commonplace, on a global and national scale, and the number of local terrorism and violent extremism cases continue to rise.348 Some of the most notorious terror cases in Washington State include the arrest of Ahmed Ressam, the “Millennium Bomber,” in December 1999, the Earth Liberation Front (ELF) firebombing of University of Washington’s (UW) horticulture center in May 2001, and the foiled Seattle Military Entrance Processing Station attack plot in 2011. •
•
•
On March 26, 2018, Thanh Cong Phan from Everett was arrested after mailing at least 11 suspicious packages to multiple military and government facilities in the Washington, D.C. metropolitan area, which contained potential destructive devices. He was charged with shipping of explosive materials, after the packages were found to contain small amounts of black explosive powder.349 On March 31, 2017, Muna Osman Jama of Reston VA and Hinda Osman Dhirane of Kent WA were sentenced to 12 years and 11 years respectively, after being found guilty of conspiracy to provide material support to al-Shabaab. The two reportedly organized an all-female fundraising group, called the “Group of Fifteen,” who provided monthly payments to al-Shabaab; facilitating and tracking money sent through conduits in Kenya and Somalia.350 On August 25, 2017, Melvin Neifert from Selah was arrested and charged with receiving incendiary explosive device materials—specifically, potassium nitrate and other materials to make a potassium nitrate-sugar bomb—that were to be used in connection with the
TERRORISM – PAGE 4-341 REGION 5 ALL HAZARD MITIGATION PLAN – 2020-2025 EDITION BASE PLAN
•
•
•
•
•
•
•
•
•
2016 May Day events. Federal authorities seized evidence and questioned Neifert on May 1, the same day anti-capitalist demonstrations took place in Seattle.351 On September 4, 2016, a fire was intentionally set at the Planned Parenthood clinic in Pullman, WA. Authorities recovered a video from inside the clinic showing a flammable object had been thrown through the window. While no injuries were reported, and no suspects identified, there is a history of domestic terrorism against the Pullman clinic.352 On April 9, 2015, Blake Heger was arrested after attempting to place two shrapnel-laden pipe bombs near a high foot-traffic area outside a hardware store in Puyallup, WA. Police were called after a concerned citizen saw him sharpening large knifes in the parking lot. He was found with two additional pipe-bombs, four large knives, and a screwdriver that he had sharpened into a dagger.353 On January 1, 2014, Musab Masmari attempted to set fire to a gay nightclub on Capitol Hill in Seattle, WA by spilling gasoline down a set of stairs and lighting it, while 750 people packed the club's New Year’s Eve event. According to investigative documents, Masmari told a friend that “homosexuals should be exterminated.” In July 2014, he was sentenced to ten years in federal prison for arson.354 On July 18, 2014, Ali Muhammad Brown was arrested after killing four people in WA and a college student in NJ, as part of a personal vengeance against the U.S. government for its actions in the Middle East. In 2004, he was arrested and prosecuted for his role in a bank fraud scheme to finance fighters traveling abroad and had known links to a disrupted terror cell in Seattle, WA and Bly, OR in 1999.355 On October 27, 2012, Abdisalan Hussein Ali, a 22-year old born in Somalia but raised in Seattle and Minnesota, was the third American killed as an al-Shabaab suicide bomber in Mogadishu. Ali was reportedly one of two bombers in an attack that killed “scores of African Union peacekeepers.” He arrived in Seattle in 2000 and moved to Minneapolis before being recruited into al-Shabaab and travelling to Somalia in 2008.356 On September 8, 2011, Michael McCright was arrested and charged with second-degree assault for a July 2011 incident where he intentionally swerved his vehicle at a government-plated vehicle occupied by two U.S. Marines in Seattle. Known on the Internet as “Mikhail Jihad,” McCright had ties to Abu Khalid Abdul-Latif, a man convicted of plotting to kill federal employees and military recruits in Seattle, WA.357 On June 22, 2011, Abu Khalid Abdul-Latif and Walli Mujahidh were arrested for planning to attack the Military Entrance Processing Station (MEPS) in Seattle with machine guns and grenades after previously planning, but discounting, an attack at Joint Base Lewis McChord (JBLM). According to FBI investigators, “Abdul-Latif said that ‘jihad’ in America should be a ‘physical jihad,’ and not just ‘media jihad’.”358 On May 11, 2011, Joseph Brice of Clarkston WA was arrested for assembling, practicing, and detonating explosive devices after an incident that occurred on April 18, 2010, when an explosive device he made prematurely ignited, causing him significant injuries. He had a YouTube channel called “Strength of Allah,” where he posted the videos in an attempt to support terrorism.359 On January 17, 2011, Kevin Harpham, an admitted white supremacist, placed a remotecontrolled backpack improvised explosive device (IED), with rat-poison coated shrapnel, at a park bench near the marching route on the morning of the Martin Luther King Jr. Day Parade in Spokane, WA. Prosecutors said the device was “constructed with a clear, TERRORISM – PAGE 4-342 REGION 5 ALL HAZARD MITIGATION PLAN – 2020-2025 EDITION BASE PLAN
• •
•
lethal purpose,” and Harpham said it was intended to protest social concepts, such as unity and multiculturalism.360 On June 11th 2001, the Westgate Family Medicine Clinic was bombed just after noon.361 In 1990 white supremacists had planned to bomb a homosexual bar in Seattle and then move to Pierce County where they would bomb a number of bars with an African American clientele and Korean businesses but were arrested prior to initiating their attacks. In 1972 Tacoma’s Model Cities and Human Rights offices were burned.
Recurrence Rate Using the FBI definition above, it can be shown that terrorist activities happen in Pierce County regularly.
Impacts The scale, nature, methods and level of success of attacks are all variables that will directly affect the impacts. For details on impacts please see the active threat/attack tactics chapter. Terrorist attacks continue to take place at open-access events, mass gatherings, and outside the perimeter of secured events, possibly because of a perceived lack of security, the availability of publicized schedules, and largely unrestricted admittance. Examples of open-access events include marathons, parades, protests, rallies, festivals, fireworks display, farmers markets, and high-profile funerals and vigils or memorials. Terrorists could also target gatherings located close to ticketed events, such as tailgating adjacent to major sporting events or concerts362. Judging from previous terrorist plots and attacks, terrorists will likely remain interested in conducting opportunistic attacks against civilian targets, most notably mass gatherings. Techniques used in recent terror attacks have included the use of vehicles as weapons, edged weapons, small arms, and improvised explosive devices (IEDs). Provided below is the 2019 complex coordinated terrorist attack scenario that was developed for the Seattle Urban Area Security Initiative Threat and Hazard Identification and Risk Assessment planning. The scenario was developed by the WA State Fusion Center and vetted by local law enforcement in Pierce, King, and Snohomish Counties. The scenario, finalized on August 8, is based on the current threat environment.363 The radicalization of Pacific Northwest extremist groups has recently been promoted by other national terrorism movements which have called for violent resistance to destroy human life and disable critical infrastructure. Radicalization starts to build in the Winter of 2018. Over the next six months there is an increase in expression of on-line animosity towards the U.S. Government which calls for action on June 24th. In recent weeks there has been an increase via social media of on-line extremist groups indicating an intense animosity and a belief of injustice by the U.S. Government. These local online indicators show lone actors, inspired by extremist ideology, have been able to circumvent security measures to take up small arms, make vehicle borne and rudimentary standalone improvised explosive devices (IEDs) with the stated intent to attack the Region. In addition, there are calls for “Leaderless Resistance” making it difficult to locate, mitigate, TERRORISM – PAGE 4-343 REGION 5 ALL HAZARD MITIGATION PLAN – 2020-2025 EDITION BASE PLAN
or prevent their stated intent. Within the Seattle Region, there is increasing concern about a number of these groups starting to influence public opinion, which may lead to violent actions. The on-line information promotes and warns of the need for longer and ongoing acts of violence to achieve superiority over current government authority. On July 3rd, there are several online attacks which are a precursor to the July 4th physical attacks on an iconic building, multiple active shooter events, vehicle borne violence and IEDs, and unattended small items across the City of Seattle and surrounding areas.
TERRORISM – PAGE 4-344 REGION 5 ALL HAZARD MITIGATION PLAN – 2020-2025 EDITION BASE PLAN
Technological Transportation Accidents Hazard 4.11T Identification Description Definition Transportation accidents as used in this assessment include accidents involving a method of transportation on the road, rail, air, and maritime systems within the confines of Pierce County.
Types Small accidents between a small number of motor vehicles, small watercraft or an accident involving a small private plane are not included in this definition. Instead, accidents must involve a level of complexity that taxes first responder systems or triggers the activation of the mass casualty incident plan, mass fatality incident plan or response to violence plan. Since hazardous materials are covered in the Hazardous Materials chapter, this chapter, while mentioning it as contributing factor, will not emphasize it. o Road Transportation: Pierce County is traversed by 11 state highways, one interstate with a short interstate feeder into downtown Tacoma, and numerous roads and streets. o Rail Transportation: Passenger, freight and tourist rail lines exist in various places in Pierce County. This includes Burlington Northern Santa Fe (BNSF) Railroad, Fort Lewis Rail, Sound Transit, Tacoma Rail, Tacoma Rail Mountain Div., and Union Pacific Railroad.
Table 4.21-1 Airports in Pierce County Airport Location
Owner, Use
Gray Field
US Army - Military
o Air Transportation: Pierce County is home to thirteen working airports. (See Table 4.21-1 Airports in Pierce County.) Air traffic consists of private fixed wing, sea planes, small commercial jets, helicopters and a large contingent of military aircraft.
Thun Field
Joint Base Lewis/McChord Joint Base Lewis/McChord S. of Puyallup
Tacoma Narrows
Gig Harbor
Spanaway American Lake Seaplane Base Swanson Kapowsin Field Mt. Rainier, Kautz Fitz Pad 2 Heliport
Spanaway Lakewood
Shady Acres Cawleys South Prairie Burnett Landing Airport
Spanaway South Prairie Wilkeson
McChord
Eatonville Kapowsin Kautz Creek Graham
US Air Force Military Pierce County - Flight Training, Lt. Jet Traffic, Helicopter, Commercial, Charter Pierce County - Flight Training, Charter, Lt. Jet Traffic, Helicopter, Commercial Public Seaplane Public Private Federal - Helicopter Private - Helicopters and single engine planes. Private Community Private
o Maritime Transportation: The Port of Tacoma is a major terminus for commercial vessels. Ships also traverse the western portions of the County en route to and from Olympia. Ferry routes cross between Steilacoom and TRANSPORTATION ACCIDENTS – PAGE 4-345 REGION 5 ALL HAZARD MITIGATION PLAN – 2020-2025 EDITION BASE PLAN
McNeil, Anderson, and Ketron Islands. Vashon Island has a Washington State Ferry route that runs between Point Defiance and Tahlequah on its southern end. A small private ferry runs between the Longbranch Peninsula and Herron Islands. Commercial tour boats spend time in Pierce County waters as do hundreds of private boats of all types and sizes.
Profile Location and Extent The various forms of transportation, covering the majority of the County have considerable potential for accidents that could threaten Pierce County’s infrastructure, its citizens and their livelihood. o Road Transportation: Privately owned vehicles and local bus services provide the primary means of transportation for individuals in Pierce County. Freeways, highways and roads serve the area. Important roadways include Interstate 5, State Highways 16, 123, 161, 162, 163, 167, 410, 509, and 512. All major highways carry high volumes of traffic, including large numbers of commercial vehicles carrying goods, and in some cases hazardous materials. Transit, school buses, and even bicyclists (including marathons) also use these roads. A major road transportation emergency could be caused by an accident involving any one of these carriers. Generally, most traffic accidents, even when a death occurs, are considered routine and not a major incident. The type of situations where an incident could be considered major might involve an Amtrak train landing on the I-5; or a bus of school children; a semi-truck losing brakes and plowing into businesses; or, a semi-truck carrying hazardous materials exploding in rush hour traffic. If carrying hazardous materials, surrounding areas could require sheltering in place or evacuation, as necessary. o Rail Transportation: The rail lines run through the County and through or near the edges of DuPont, Steilacoom, Lakewood, University Place, Tacoma, Fife, Puyallup, Sumner, and Bonney Lake. Passenger transportation exists in Pierce County in the form of Amtrak, the Sounder, and Tacoma Link. Amtrak follows the tracks along Puget Sound north of the Nisqually River to Point Defiance, then through Tacoma and Puyallup and up the Auburn Valley. Sound Transit provides weekday service and covers special events on the Sounder between Lakewood and Everett and the Tacoma Link between Tacoma Dome and Theater District. Burlington Northern/Santa Fe and the Union Pacific have lines which run north and south through the County. The railroad owned by the City of Tacoma transports goods and materials around the Port of Tacoma. It also operates the 132 miles of line out to Fredrickson and south out of the County to Morton and Chehalis. The Mt. Rainier Scenic Railway, a small privately-owned tourist rail line, runs from Elbe up the Nisqually River valley and then south along Mineral Creek to Mineral Lake in Lewis County. o Air Transportation: The fourteen active airports or airstrips in Pierce County range tremendously in size and use. At one end of the scale there are McChord and Gray Fields, both major US military facilities. At the other end of the scale there are small fields like Spanaway and Ranger Creek or the heliport at Kautz Creek in Mt. Rainier National Park. Aircraft come and go from some of these small runways daily, while others have more casual use. Many of the smaller airports in the County were built in rural areas with low population. Over the years, as the County’s population base expanded, many of these have now become part of the suburban landscape, surrounded by neighborhoods and TRANSPORTATION ACCIDENTS – PAGE 4-346 REGION 5 ALL HAZARD MITIGATION PLAN – 2020-2025 EDITION BASE PLAN
businesses. Pierce County owns two small commercial airports, Thun Field and the Tacoma Narrows Airport. Pierce County has the added risk of being directly in the flight path for many planes either landing or taking off from Sea-Tac International Airport in King County. o Maritime Transportation: Marine transportation accidents can be classified into two types: those that directly involve large numbers of people in a potential mass casualty accident such as a ferry sinking, or those that threaten the larger community or the environment such as a fire on a ship carrying hazardous chemicals. If a fully loaded ferry were to capsize or sink, the injuries and death tolls could be very high depending on weather and amount of notice before the vessel is submerged. In addition to passenger ferries, there are a number of tour boat operators who work the waters around Pierce County. Depending on the boat they may have anywhere from ten to a couple hundred people on board. Table 4.20-2 Ferry Service in Pierce County # of cars # of passengers McNeil Barge and Tug 16 75 McNeil Foot Ferry 0 336 Pt. Defiance Ferry 65 546 Anderson Island Ferry 54 250 Herron Island Ferry 12 49
Commercial shipping traffic in Pierce County follows well defined shipping lanes. By far the majority of all types of commercial traffic flows through the Port of Tacoma. A major fire, hazardous chemical spill, or explosion, either on board or at the Port, could affect not only the City of Tacoma, but depending on wind direction and size of the incident, also Browns Point, Federal Way, Fife or even Puyallup. A much smaller volume of material, usually on small ships or barges, passes through the Tacoma Narrows. Because of the quantity of materials carried by some of these vessels, a spill, explosion, or onboard fire could affect a significant coastal population. Marina fires, although connected to the land, can damage or destroy surrounding vessels and if uncontrolled spread shore facilities. There will be no further coverage of marina fires in this plan.
Occurrences364 General occurrences are summarized below. For more notable incidents see Table 4.20-1 Transportation Accidents/Catastrophic Failures in Pierce County. •
Road Transportation: Over the years there have been several major accidents in Pierce County. While many of these have happened along the I-5 corridor others have happened on other major roads, especially on State Route 16 at the Narrows Bridge. The various causes include heavy fog, freezing rain, side winds (especially on the Narrows Bridge) or ice forming on bridges. These types of accidents happen every year. Occasionally tanker trucks, chemical trucks, busses or other vehicles, which could lead to a major incident, are involved. Some of these have closed down the highways for portions of a day and
TRANSPORTATION ACCIDENTS – PAGE 4-347 REGION 5 ALL HAZARD MITIGATION PLAN – 2020-2025 EDITION BASE PLAN
some have required evacuation of neighboring buildings. However, none have caused a large long-term evacuation or closure of a highway. •
Rail Transportation: Of rising concern is the transportation of Bakken Crude Oil which brings 123,000 barrels/day or 5,160,839 gallons/day into Pierce County365. Although there have not been any major derailments of Bakken Crude Oil in Pierce County, there have been a considerable number in Canada and the US. Two major derailments of significance include the Lac-Mégantic, Quebec, Canada 63 car derailment on July 5, 2013 which resulted in the death of 47 people due to fire and other effects of the accident.366 The other derailment was on April 30, 2014 in Lynchburg, Virginia where 17 of 105 tank cars fell into the James River, spilling almost 30,000 gallons of crude oil.
•
Air Transportation: Pierce County has been the scene of dozens of airplane crashes over the years. Most of these have been small aircraft with one or two people in them. Test pilots from Boeing have crashed in the County. Military planes have flown into each other. Pilots have crashed during 4th of July celebrations. Ultralights have crashed and there is even an incident of a plane attempting to take off without its pilot. Mount Rainier, sticking up above the rest of the County, has accounted for a number of accidents. In addition to these problems, pieces of planes have occasionally fallen off during flights. A jet tire fell on Brown’s Point; a jet canopy popped off and hit a home in 1954; a piece of a C-141 Starlifter fell into a yard in 1979; and in 1984, the tail cone of a Boeing 747 fell into a field north of Puyallup.
•
Maritime Transportation: The last two major vessel fires in the Port of Tacoma were in 1986 and 1989. There have been a number of small craft that have exploded and burned or sank, as well as fires at marinas. In addition, there are the occasional freighters, like the Ocean Steelhead in 1983 or the Ace Accord in 1986, which have listed and come near to sinking in the Port of Tacoma. Barge shipments containing thousands of gallons of petroleum products are regularly transported up Puget Sound from Tacoma.
Table 4.21-3 Transportation Accidents/Catastrophic Failures in Pierce County
DATE
DESCRIPTION
August 10, 2018
April 1956 November 27, 1952 Thanksgiving night December 10, 1942
AIR A Horizon Air employee stole a 76-person turbo prop plane around 8:00 p.m. from Seattle-Tacoma International Airport and about an hour later crashed it into the south end of Ketron Island (the north end has six cabins). The employee was killed in the crash and no one else was injured. Northwest Orient Airlines flight crashed into Puget Sound on the Pierce/King County border off Dash Point. Of the 37 people on board, all but three survived. A C-54 transport crashed in southern Pierce County killing 37 of the 38 people on board. The lone survivor was a young boy who lost his parents, two brothers and a sister in the crash. Marine transport plane with 32 aboard lost their lives when it crashed into the side of Mt. Rainier.
TRANSPORTATION ACCIDENTS – PAGE 4-348 REGION 5 ALL HAZARD MITIGATION PLAN – 2020-2025 EDITION BASE PLAN
August 4, 2019
August 31, 2005
December 18, 2017
July 2, 2017
February 26, 2011
May 16, 2007
February 1996
1984
MARITIME On Sunday afternoon around 4:30 p.m. Pierce County Planning and Public Works ferry (Christine Anderson) had a catastrophic mechanical failure of the ramp while docked at Anderson Island. This lasted for less than 24 hours but approximately 100 people were impacted as they couldn’t get home or go to work the next day. Many people had to leave their vehicles either on the ferry or left them in the ferry lanes on both Anderson Island and Steilacoom. Harborview Marina Fire in Gig Harbor damaged 55 boats and sank 48 of them.367 RAIL At 7:34 a.m. southbound Amtrak passenger train 501, consisting of ten passenger railcars, a power railcar, a baggage railcar, and a locomotive at either end, derailed from a bridge near DuPont, Washington. Several passenger railcars fell onto Interstate 5 and hit multiple highway vehicles. At the time of the accident, 77 passengers, five Amtrak employees, and a Talgo, Inc., technician were on the train. Of these individuals, three passengers were killed, and 57 passengers and crewmembers were injured. Additionally, eight individuals in highway vehicles were injured. At approximately 2:30 p.m. an Amtrak passenger train carrying approximately 250 people derailed near Chamber Creek Rd in Steilacoom. Four rail cars went of the track and there were four injuries. One was from the train derailment and the other three fainted from heat exposure at 92 degrees. A 103-car freight train derailed and side-swiped a 14-car train. The smaller train, carrying four cars of sodium hydroxide, had three cars land on the shoreline near the Chambers Bay Golf Course in University Place. In this incident an estimated 50 gallons of sodium hydroxide discharged into the beach.368,369 See Figure TA-1 Train Wreck on Mounts/Old Nisqually Road. Minor amounts of diesel were spilled, and three people were trapped and had to be rescued. This incident closed the Mounts/Old Nisqually Road for five days.370 Freight train carrying chemicals derailed near DuPont during the winter storm and partially went into the Puget Sound. The tank cars were damaged but intact so very little spillage. Not many people were injured as a result. Amtrak derailment along shore of Puget Sound near DuPont. People only suffered minor injuries.
Recurrence Rate Small transportation accidents happen in Pierce County on a daily basis and mostly occur on the roads and highways. The large-scale accidents that threaten the lives and livelihood of a large
TRANSPORTATION ACCIDENTS – PAGE 4-349 REGION 5 ALL HAZARD MITIGATION PLAN – 2020-2025 EDITION BASE PLAN
number of citizens are much rarer but we’ve had three in past two years. Reviewing the information above would point to a ten year or less recurrence rate for all types combined.
Impacts The impacts of a major transportation accident, although varying depending on the type of accident and the vehicles involved, will have similar factors. Differences between them are discussed as necessary.
Health and Safety of Persons in the Affected Area at the Time of the Incident The potential for injury and death are the major impacts from all types of transportation accidents. Traumatic injuries and possible burns are the primary results. For the survivors of a major incident, with a large number of dead and injured, posttraumatic stress disorder (PTSD) and posttraumatic stress (PTS) are psychological impacts that affect first responders, adults and children. With ferry or other marine transport accidents, the potential for drowning and/or hypothermia are additional threats. A ferry that makes runs to Anderson or Fox Islands and is out of service and blocks access to the main dock, delivering baby food and other essential items such as fuel can be a dire need especially in the winter.
Health and Safety of Personnel Responding to the Incident The threats to the health and safety of personnel responding to the scene of transportation accidents depend on the environmental factors associated with each incident. Threats include inhalation or contact with hazardous chemicals, fire, explosion; and in water rescues, drowning and hypothermia. As mentioned above posttraumatic stress disorder (PTSD) and posttraumatic stress (PTS) are psychological impacts.
Continuity of Operations and Delivery of Services Impact to the continuity of operations and the delivery of services to the public will depend on the type of transportation and the location. o Road Transportation: An incident on the highways while damaging, should not impact the delivery of services or the continuity of operations for any jurisdiction for more than a short period of time (a couple of days). Establishing detours for all major routes is a standard operating procedure that happens frequently. o Rail Transportation: Continuity of operations should not be compromised by a rail accident in most jurisdictions in the County unless there is something to compound the problem. This would most likely be a chemical spill, especially in the form of a toxic cloud. Delivery of services on the other hand could be jeopardized by a train accident that damages or blocks access to critical infrastructure. o Air Transportation: The impact to continuity of operations and the delivery of services from an air transportation incident are directly connected to what is hit by the aircraft. Any object struck by an aircraft of any type will suffer damage. If government buildings are struck the continuity of operations for that agency or even jurisdiction in some cases
TRANSPORTATION ACCIDENTS – PAGE 4-350 REGION 5 ALL HAZARD MITIGATION PLAN – 2020-2025 EDITION BASE PLAN
with small jurisdictions, could be at risk. If a critical portion of the infrastructure is struck, it could impact the delivery of services that it normally carries out. o Maritime Transportation: A ferry accident that puts a ferry out of commission and/or destroys a ferry dock will heavily impact the delivery of services to the areas served. The ability to get a route back in service will depend on the time it takes to replace or repair the ferry or dock. A ship sinking in Commencement Bay, especially at the entrance to the Blair Waterway, that could restrict commercial traffic and impact the operations of the Port of Tacoma would have cascading impacts on the supply chain. Currently 80 percent of Alaska’s imports come from the Port of Tacoma providing food, medicines and other essential supplies. Other types of marine accidents, unless combined with an explosion or hazardous chemical spill, will probably not impact service delivery or the continuity of operations.
Property, Facilities, and Infrastructure o Road Transportation: Most road or highway transportation accidents will result in very little damage to facilities, infrastructure, or property due to the limited or localized nature of any highway accident. o Rail Transportation: Rail transportation events, localized in nature like road events, can cause considerably more damage to property, facilities and infrastructure due to the size of trains and the quantity of materials carried. Any piece of property or facility in close proximity to the tracks has the potential of being damaged or destroyed. This is compounded by any fire or chemical spill that is created by the accident. o Air Transportation: The crash of any aircraft can damage or destroy any property, facility or piece of infrastructure that it hits. o Maritime Transportation: Any property along the Puget Sound shoreline is at risk from a maritime incident. This can come from the actual grounding of a vessel, complications from a fire, or the release of hazardous chemicals.
Environment Generally, given the localized nature of the accident, the environment will not be greatly impacted unless the accident involves some other complicating factor. While the normal spill from accidents on the roads and highways of the County can cause minor environmental damage, it seldom covers more than a few dozen square meters and after some clean up the environmental damage is not permanent and will heal over time. Aircraft may contain a large quantity of fuel and in many accidents, this will burn causing local fire damage. Those accidents that might include a large chemical spill and/or fire from a train, aircraft, or a truck accident may take months or years to be resolved. A perfect worse-case example is the Cantara/Dunsmuir chemical spill of July 14, 1991 in northern California. In this accident all aquatic life in the Upper Sacramento River was killed off when 19,000 gallons of metam sodium, a potent herbicide, and pesticides used to sterilize soil, TRANSPORTATION ACCIDENTS – PAGE 4-351 REGION 5 ALL HAZARD MITIGATION PLAN – 2020-2025 EDITION BASE PLAN
spilled from a train tank car. In addition, it killed the algae, aquatic plants and vegetation growing along the riverbank.371 See the chapter on Hazardous Materials for more detail on environmental impacts.
Economic and Financial Condition The economic impacts from any transportation accident are directly related to its impact on the ability for businesses and industries to move their goods into, though, or out of the County. o Road Transportation: With few exceptions, damage to roads or bridges from a single incident, while changing the transportation route that cargo travels on the highways, will have little impact on the economic environment. A repeat of the collapse of the Interstate 5 bridge over the Skagit River is the obvious example of a road accident that did impact the local economic environment. Local businesses had to deal with a change in traffic patterns creating excessive truck and other vehicle traffic clogging up of roadways on the alternate routes. We’ve seen this more recently as unintended consequences to businesses that relied on bringing in customers through foot traffic were especially hit with the constant change in routes for the demolition and removal of the Alaskan Way Viaduct in Seattle. o Rail Transportation: A rail incident involving damage to tracks could force shippers to change the methods of commodity movement. Due to the large quantity of goods carried by a train, if they were destroyed it has the potential to have a strong impact on the financial condition of individual companies. This would be especially true of those companies that operate on a “just-in-time” basis. In the larger economic scheme, while there might be some ripples, it is unlikely to create large changes in the economic climate of the County. o Air Transportation: Major airline companies have insurance that will get them through their financial hardships. Smaller companies or privately-owned aircraft may face real financial hardships but this will not have a widespread impact on the economic climate in the County. o Maritime Transportation: The sheer quantity of goods loaded on ships and barges in Commencement Bay and docked at the Port of Tacoma means that a maritime accident, leading to one being damaged, sunk or destroyed, could impact not only the local economic climate, but the financial wellbeing of companies that may ship material from either overseas or some other part of the United States. If an accident were to block either the Blair or Sitcum Waterways, it would shut down a large portion of the commercial traffic through the Port with major economic repercussions.
Public Confidence in the Jurisdiction’s Governance Confidence in the jurisdiction will be limited in regard to the majority of service providers are non-profits or the private sector. Questions that arise will include: • •
Could the accident have been prevented? Who is at fault? TRANSPORTATION ACCIDENTS – PAGE 4-352 REGION 5 ALL HAZARD MITIGATION PLAN – 2020-2025 EDITION BASE PLAN
• • •
Was the response well handled? How soon will things be back to normal or the issue resolved? What measures are going to be taken to prevent a repeat of the incident?
Depending on the answers to these questions the involvement of one or more jurisdictions could be applauded or criticized.
TRANSPORTATION ACCIDENTS – PAGE 4-353 REGION 5 ALL HAZARD MITIGATION PLAN – 2020-2025 EDITION BASE PLAN
(This page intentionally left blank)
TRANSPORTATION ACCIDENTS – PAGE 4-354 REGION 5 ALL HAZARD MITIGATION PLAN – 2020-2025 EDITION BASE PLAN
Resource Directory For additional details please see the Pierce County Hazard Identification and Risk Assessment 2020 (published separately). A copy can be found on Pierce County Department of Emergency Management’s Website.
ENDNOTES – PAGE 4-355 REGION 5 ALL HAZARD MITIGATION PLAN – 2020-2025 EDITION BASE PLAN
Endnotes 1
Avalanche Handbook, Avalanche Handbook 489, U.S. Department of Agriculture, Ronald I. Perla and M. Martinelli, Jr., pp. 67-68 2 Friends of Utah Avalanche Center, http://utahavalanchecenter.org/ 3 Ibid. p. 35 4 Northwest Weather and Avalanche Center, http://www.nwac.us/accidents/ 5 This particular incident does not involve a normal avalanche that a backcountry traveler might run into. In this case a climbing party on Mt. Rainier had a large block of ice and snow on the Ingraham Glacier, called a serac, collapse, and sweep down the mountain, push the climbers into a crevasse, and bury them. Their bodies are still on the mountain. 6 Modified from PC HIVA (DRAFT), Earthquake Section, September 5, 2002, p. 1. http://www.co.pierce.wa.us/xml/abtus/ourorg/dem/HIVAWEB.pdf 7 Slide from Corina Allen, Chief Hazard Geologist, Washington State Department of Natural Resources, presented on May 1, 2019. 8 Ibid, p. 3-4. 9 USGS publication. “Earthquake Hazards in Washington and Oregon, Three Source Zones.” http://www.ess.washington.edu/SEIS/PNSN/CascadiaEQs.pdf 10 A pending US Geological Survey publication. 11 Czajkowski, J. L.; Bowman, J. D., 2014, Faults and earthquakes in Washington State: Washington Division of Geology and Earth Resources Open File Report 2014-05, 1 sheet, scale 1:750,000. 12 Gonzalez, Frank I., et al. “Puget Sound Tsunami Sources: 2002 Workshop Report.” NOAA/Pacific Marine Environmental Laboratory, Contribution No. 2526, 2003. p. 7. 13 Negar Elhami Khorasani, Maria E.M. Garlock, (2017) "Overview of fire following earthquake: historical events and community responses", International Journal of Disaster Resilience in the Built Environment, Vol. 8 Issue: 02, pp.158-174, https://doi.org/10.1108/IJDRBE-02-2015-0005 Permanent link to this document: https://doi.org/10.1108/IJDRBE-02-2015-0005 14 Corina Forson presentation at the Threats and Hazards Identification Workshop on May 1 2019 in Tacoma, WA. 15 https://www.dnr.wa.gov/geologyportal 16 What is Lidar?, National Oceanic and Atmospheric Administration, accessed July 29, 2019 from https://oceanservice.noaa.gov/facts/lidar.html 17 Ibid. p. 7. 18 Modified from PC HIVA (DRAFT), Earthquake Section, September 5, 2002, p. 2. http://www.co.pierce.wa.us/xml/abtus/ourorg/dem/HIVAWEB.pdf 19 “A dipping planar (flat) zone of earthquakes that is produced by the interaction of a downgoing oceanic crustal plate with a continental plate. These earthquakes can be produced by slip along the subduction thrust fault or by slip on faults within the downgrading plate as a result of bending and extension as the plate is pulled into the mantle. Also known as the Wadati-Benioff zone.” From the USGS Earthquake Glossary at http://earthquake.usgs.gov/learn/glossary/?term=Benioff%20zone 20 Ibid. p. 2-3. 21 Earthquakes in Washington, Walsh, Timothy J., et. al., Washington State Department of Natural Resources, Division of Geology and Earth Resources, www.dnr.wa.gov/ResearchScience/Topics/GeologicHazardsMapping/Pages/earthquakes.aspx 22 http://www.pnsn.org?HIST_CAT/isoseismals.html 23 Gonzalez, Frank I., et al. “Puget Sound Tsunami Sources: 2002 Workshop Report.” NOAA/Pacific Marine Environmental Laboratory, Contribution No. 2526, 2003. p. 7-8. 24 An earthquake raised shorelines along the Seattle Fault Zone in A.D. 900–930; moreover, several shores of southern Puget Sound subsided A.D. 860–940. Therefore, the uplift north of the Tacoma Fault either coincided with a single large event in A.D. 900–930, or it represents a separate earthquake of about that age. However, the subsidence at Wollochet Bay on the peninsula in Pierce County implies either coseismic or a seismic deformation after A.D. 900–930. Gonzalez, Frank I., et al. “Puget Sound Tsunami Sources: 2002 Workshop Report.” NOAA/Pacific Marine Environmental Laboratory, Contribution No. 2526, 2003. p.4. 25 Modified from PC HIVA (DRAFT), Earthquake Section. September 5, 2002, p. 3-5. http://www.co.pierce.wa.us/xml/abtus/ourorg/dem/HIVAWEB.pdf
ENDNOTES – PAGE 4-356 REGION 5 ALL HAZARD MITIGATION PLAN – 2020-2025 EDITION BASE PLAN
26
Earthquakes in Washington, Walsh, Timothy J., et. al., Washington State Department of Natural Resources, Division of Geology and Earth Resources, www.dnr.wa.gov/ResearchScience/Topics/GeologicHazardsMapping/Pages/earthquakes.aspx 27 Scenario for a Magnitude 6.7 Earthquake on the Seattle Fault, Earthquake Engineering Research Institute and the Washington Military Department, Emergency Management Division, June 2005. 28 Hazard Mitigation Survey Team Report for the Nisqually Earthquake, February 28, 2001 , DR-1361-WA, Federal Emergency Management Agency and Washington Military Department, Emergency Management Division, p. 13. 29 Scenario for a Magnitude 6.7 Earthquake on the Seattle Fault, Earthquake Engineering Research Institute and the Washington Military Department, Emergency Management Division, June 2005, p 1. 30 Cascadia Subduction Zone Earthquakes: A magnitude 9.0 earthquake scenario, Cascadia Region Earthquake Workgroup, 2005, p.2. 31 Naghii MR. Public health impact and medical consequences of earthquakes. Rev Panam Salud Publica. 2005;18(3):216-221 online at http://journal.paho.org/index.php?a_ID=187 32 Rubble Dust: A Health Risk For Haiti's Earthquake Survivors?, Richard Knox NPR online, http://www.npr.org/blogs/health/2010/01/rubble_dust_a_health_risk_for.html?ft=1&f=103537970 Worry amongst health experts of respiratory problems for Haitians. He references Dr. Landrigan who has been involved in medical and epidemiological studies on the after affects of the World Trade Center collapse. 33 From the State of Missouri’s Department of Mental Health PowerPoint slide show “The Psychological Impact of Trauma on Responders” Presenter notes slide 5, presented October 21, 2005 at the FEMA Crisis Counseling Program. http://www.dmh.missouri.gov/diroffice/disaster/documents/EmergResponderPrznt10210530minCCP_000.ppt 34 Ibid. slide 21. 35 Johnson Sherrard, Linda, Heroes on Call, Occupational Health and Safety, March 2007, http://www.ohsonline.com/articles/45373 36 For a more in depth look at the long term effects on first responders see Mitchell, Jeff and Bray, Grady, Emergency Services Stress: Guidelines for Preserving the Health and Careers of Emergency Services Personnel, Brady, Prentice Hall Career & Technology, Englewood Cliffs, New Jersey 1990, and Jackson, Brian A. et al., Protecting Emergency Responders: Lessons Learned from Terrorist Attacks, Rand Science and Technology Institute, Proceedings from the Conference December 9-11, in New York City. 37 Field Manual: Postearthquake safety evaluation of Buildings, Second edition, Project Manager: Christopher Rojhan, Applied technology Council, Redwood City, California, 2005, p. 45. 38 Post-Earthquake Safety Evaluation of Buildings, ATC -20 Instruction Slide Show, Project Manager: Christopher Rojhan, Applied technology Council, Redwood City, California, 2005. 39 Geotechnical Earthquake Engineering Server (GEES) of the University of Southern California sponsored by the Siting and Geotechnical Systems component of the National Science Foundation's Earthquake Hazard Mitigation program, http://gees.usc.edu/GEER/Nisqually/liquefaction/lateralspread/index.html 40 The Department of Homeland Security’s Regional Resiliency Assessment Program (RRAP) published the Resiliency Assessment on Washington State Transportation Systems in March of 2019. Accessed January 10, 2020 at https://mil.wa.gov/asset/5d8ba2a03a1b7 41 Page 26 Resiliency Assessment Washington State Transportation Systems (March 2019) accessed January 13, 2020 at https://mil.wa.gov/asset/5d8ba2a03a1b7 42 Modified from Pierce County HIVA (DRAFT), Landslide Section, September 5, 2002, p. 1. http://www.co.pierce.wa.us/xml/abtus/ourorg/dem/HIVAWEB.pdf 43 Ibid, p. 1, 2. 44 Information provided by Stephen Slaughter, LG, LEG, Landslide Hazards Program Manager for Washington Geologic Survey at Threats and Hazards Identification Workshop in Tacoma on May 1 https://fortress.wa.gov/dnr/geologydata/publications/ger_ri39_pierce_county_landslide_inventory.zip 45 A live version can be accessed at https://geologyportal.dnr.wa.gov/#natural_hazards 46 Information on this map comes from Pierce County Planning and Land Services Department’s interpretation of data on the Coastal Zone Atlas of Washington, Volume 7, (Pierce County). Washington State Department of Ecology, 1979. 47 Op cit, Pierce County HIVA C p. 2,-3. 48 Slaughter, S. L.; Burns, W. J.; Mickelson, K. A.; Jacobacci, K. E.; Biel, Alyssa; Contreras, T. A., 2017, Protocol for landslide inventory mapping from lidar data in Washington State: Washington Geological Survey Bulletin 82, 27 p. text, with 2 accompanying ESRI file geodatabases and 1 Microsoft Excel file.
ENDNOTES – PAGE 4-357 REGION 5 ALL HAZARD MITIGATION PLAN – 2020-2025 EDITION BASE PLAN
49
Landslides and Landslide Hazards in Washington State Due to February 5-9, 1996 Storm--U.S. Geological Survey Administrative Report-- Debris flow undermining abutment of bridge across the Carbon River on Washington SH165 south of Carbonado, Washington. 50 Stephen Slaughter, Washington Geologic Survey, Landslide Hazard Program Manager, May 1, 2019. 51 Pacific Tsunami Museum Archive Photos http://www.tsunami.org/archives.html [Internet accessed August, 2012]. 52 Pacific Tsunami Museum Archive Photos (See above). 53 Modified from Washington State Natural Hazard Mitigation Plan (DRAFT), Tsunami Section, Washington State Emergency Management Division. September 5, 2002. 54 Gonzalez, Frank I., et al. “Puget Sound Tsunami Sources: 2002 Workshop Report.” NOAA/Pacific Marine Environmental Laboratory, Contribution No. 2526, 2003. p. 9-14. 55 Note that all of these tsunamis were triggered from landslides and all of Washington’s waterways are at risk including those in eastern Washington. Alex Dolcimascolo, Tsunami Geologist, Washington Geological Survey, September 25, 2019 presentation. 56 Tacoma, Washington, Tsunami Hazard Mapping Project: Modeling Tsunami Inundation from Tacoma and Seattle Fault Earthquakes, NOPP Technical Memorandum OAR PMEL-132, Venturato, Angie J. et al., pps. 9-10. 57 NOAA Technical Memorandum OAR PMEL-132, Tacoma, Washington Tsunami Hazard Mapping Project: Modeling Tsunami Inundation from Tacoma and Seattle Fault earthquakes. Venturato, Angie J., et al, NOAA, United States Department of Commerce January 2007, p 3. 58 Ibid. p.3. 59 Tacoma, Washington, Tsunami Hazard Mapping Project: Modeling Tsunami Inundation from Tacoma and Seattle Fault Earthquakes, NOPP Technical Memorandum OAR PMEL-132, Venturato, Angie J. et al., pps. 9-10. 60 Tacoma, Washington, Tsunami Hazard Mapping Project: Modeling Tsunami Inundation from Tacoma and Seattle Fault Earthquakes, NOPP Technical Memorandum OAR PMEL-132, Venturato, Angie J. et al., pps. 9-10. “Due to constraints of the inundation grid, the model does not cover the full extent of wave propagation in the upper Puyallup River; subsequently, the wave reflects off the edge of the grid boundary leading to potentially nonphysical inundation within the City of Fife and Puyallup Nation territory.” 61 Japan Earthquake & Tsunami of 2011: Facts and Information, Becky Oskin, Live Science https://www.livescience.com/39110-japan-2011-earthquake-tsunami-facts.html 62 Japan’s Earthquake and Tsunami: Economic Effects and Implications for the United States, Dick K. Nanto, William H. Cooper, J. Michael Donnelly, and Renee Johnson, Congressional Research Service https://fas.org/sgp/crs/row/R41702.pdf 63 The Impact of the Great East Japan Earthquake on the Labor Market – Need to Resolve the Employment Mismatch in the Disaster-Stricken Areas, Yoshio Higuchi, Tomohiko Inui, Toshiaki Hosoi, Isao Takabe, and Atsushi Kawakami, Semantics Scholar https://pdfs.semanticscholar.org/c4f0/ddfc5107daf420c330f2540344dd73895fc0.pdf 64 Indonesia Central Sulawesi Earthquake and Tsunami, International Labor Organization, https://www.humanitarianresponse.info/sites/www.humanitarianresponse.info/files/documents/files/ilo_sulawesi_cri sis_employment_impact_assessment_-_2_november_2018.pdf 65 Fleeing Palu Residents Hampered by Fuel Shortage, Crime and Air Chaos, Wahyudi Soeriaatmadja, The Straits Times, https://www.straitstimes.com/asia/se-asia/fleeing-palu-residents-hampered-by-fuel-shortage-crime-and-airchaos 66 Tsunami in Indonesia Kills over 280, With No Warning, Muktita Suhartono, The New York Times, https://www.nytimes.com/2018/12/23/world/asia/tsunami-indonesia-sunda-strait.html 67 Indonesia: Tsunami – Dec 2018, ReliefWeb, https://reliefweb.int/disaster/ts-2018-000423-idn 68 Gonzalez, p. 9-14. 69 Tacoma News Tribune, April 18, 1949. p.1 as quoted in Lander, et al. (1993) Tsunamis Affecting the West Coast of the United States 1806-1992, NGDC Key to Geophysical Record Documentation No. 29, NOAA, NESDIS, NGDC, 242 pp. at http://wcatwc.arh.noaa.gov/web_tsus/19490413/references.htm 70 Ibid. Cover. 71 Tacoma, Washington, Tsunami Hazard Mapping Project: Modeling Tsuami inundation from Tacoma and Seattle fault Earthquakes, Venturato, et.al., United States Department of Commerce, National Oceanic and Atmospheric Administration, Office of Oceanic and Atmospheric Research, January 2007, p. 3. 72 See tsunami.gov for current alert and warning information.
ENDNOTES – PAGE 4-358 REGION 5 ALL HAZARD MITIGATION PLAN – 2020-2025 EDITION BASE PLAN
73
Do Natural Disaster Induce More Crime?, Michael Lentini, Plamen Nikolov, Matthew Schwartz, Alpenglow: Binghamton University Undergraduate Journal of Research and Creative Activity, https://pdfs.semanticscholar.org/a284/441e3470180f713cd54cb8b17ec1e1629838.pdf 74 Japanese, Waiting in Line for Hours, Follow Social Order After Quake, Susan Donaldson James and Russel Goldman, abcNEWS, https://abcnews.go.com/Health/japan-victims-show-resilience-earthquake-tsunami-signsense/story?id=13135355 75 Do Natural Disaster Induce More Crime?, Michael Lentini, Plamen Nikolov, Matthew Schwartz, Alpenglow: Binghamton University Undergraduate Journal of Research and Creative Activity, https://pdfs.semanticscholar.org/a284/441e3470180f713cd54cb8b17ec1e1629838.pdf 76 Japan Earthquake: Organised Crime Gangs Preying on Victims, Julian Ryall, The Telegraph, https://www.telegraph.co.uk/news/worldnews/asia/japan/8399906/Japan-earthquake-organised-crime-gangspreying-on-victims.html 77 Damage to the docks from the 1894 tsunami generated by an underwater landslide in Commencement Bay. Photo from Archives in the Tacoma Public Library, Photo G27.1-099.jpeg 78 Venturato, et al,, p.12 79 Tacoma, Washington, Tsunami Hazard Mapping Project: Modeling Tsunami Inundation from Tacoma and Seattle Fault Earthquakes, NOPP Technical Memorandum OAR PMEL-132, Venturato, Angie J. et al., p 14. 80 Tacoma, Washington, Tsunami Hazard Mapping Project: Modeling Tsunami Inundation from Tacoma and Seattle Fault Earthquakes, NOPP Technical Memorandum OAR PMEL-132, Venturato, Angie J. et al., pps. 10-11. 81 The Cascadia Subduction Zone data is preliminary and there are still data gaps that will be completed in the coming years. 82 Modified from PC HIVA (DRAFT), Volcano Section, September 5, 2002, p. 1. http://www.co.pierce.wa.us/xml/abtus/ourorg/dem/HIVAWEB.pdf 83 US Geological Survey Cascade Volcano Observatory 84 Pringle, Patrick and Scott Kevin, Postglacial Influence of Volcanism on the Landscape and Environmental History of the Puget Lowland, Washington: A Review of Geologic Literature and Recent Discoveries, with Emphasis on the Landscape Disturbances Associated with Lahar, Lahar Runouts, and associated Flooding, p.10 85 Hobblett, R.P. et al, Report: volcano Hazards from Mount Rainier, Washington, Revised 1998, U.S. Geological Survey Open-File Report 98-428 accessed at http://vulcan.wr.usgs.gov/Volcanoes/Rainier/Hazards/OFR98428/OFR98-428.html 86 Viscous meaning having a thick, sticky consistency between solid and liquid. 87 www.nsm.buffalo.edu/courses/gly433/Pyroclast.pdf 88 Walder and Driedger, p. 2. 89 For more information visit USGS Volcano Hazards Program Webpage on Mt. Rainier at https://volcanoes.usgs.gov/volcanoes/mount_rainier/geo_hist_future_eruptions.html 90 Hazard zones for lahars, lava flows and pyroclastic flows from Mount Rainier (Hoblitt and others, 1998: US Geological Survey Open file Report 98-428, accessed at http://vulcan.wr.usgs.gov/Volcanoes/Rainier/Publications/FS065-97/FS065-97_map.pdf 91 K.M. Scott, P.T. Pringle, and J.W. Vallance, Sedimentology, Behavior, and hazards of Debris Flows at Mount Rainier, Washington, U.S. Geological Survey, Open File Report 90-385, P.80-84 92 Timeframes were provided by USGS Chief Scientist in Charge Seth Moran in July 2019. A copy of the presentation can be found on the Pierce County Emergency Management Risk Assessments Past Events webpage at https://www.co.pierce.wa.us/6367/Risk-Assessment-Past-Events 93 T.C. Pierson, Estimated Lahar Travel Times for Lahars 107 to 108 Cubic Meters in Volume (Approaching a ‘Case 1’ Lahar in Magnitude) in the Puyallup River Valley, Mount Rainier, and Estimated Lahar Travel Times for Lahars 107 to 108 Cubic Meters in Volume (Approaching a ‘Case 1’ Lahar in Magnitude) in the Carbon River Valley, Mount Rainier, Revised October 11, 2001, U.S. Department of the Interior, U.S. Geological Survey. 94 “D-Claw” Simulations of collapse-driven lahars courtesy of Dick Iverson and David George (USGS-CVO) 2019. 95 Mt. Rainier, Active Cascade Volcano, National Research Council, National Academy Press, Washington DC, 1994, pps.42-43. 96 USGS, http://vulcan.wr.usgs.gov/Volcanoes/PacificNW/AGU-T106/rainier.html 97 Lyn Topinka, Mount St. Helens: A General Slide Set GS9, http://vulcan.wr.usgs.gov/Volcanoes/MSH/SlideSet/ljt_slideset.html 98 Email correspondence from William E. Scott, USGS geologist, David A. Johnston, Cascade Volcano Observatory, 2/26/08.
ENDNOTES – PAGE 4-359 REGION 5 ALL HAZARD MITIGATION PLAN – 2020-2025 EDITION BASE PLAN
99
Volcanic Ash: How to be Prepared for an ashfall, USGS, and Washington Military Department, Emergency Management Division pamphlet, June 2003 100 Deadly Lahars from Nevado del Ruiz, USGS Volcano Hazards Program, Colombia, November 13, 1985, http://volcanoes.usgs.gov/Hazards/What/Lahars/RuizLahars.html 101 Materials in this section on tephra are from the Cascades Volcano Observatory website http://vulcan.wr.usgs.gov/Volcanoes/MSH/Images/ash_and_tephra_images.html 102 Much of this section is taken from Volcanic-Hazard Zonation for Mount St. Helens, Washington 1995, by Edward Wolfe and Thomas Pierson, USGS Open-File Report 95-497. 103 IPCC Working Group I of the Intergovernmental Panel on Climate Change. 2007. http://www.ipcc.ch/publications_and_data/ar4/wg1/en/spmsspm-projections-of.html 104 Climate Impacts Group presentation at the Threats and Hazards Identification Workshop May 1 & 2, 2019. A copy of the presentation can be found at https://www.co.pierce.wa.us/6367/Risk-Assessment-Past-Events 105 Climate Change: Basic Information. March 2014. Environmental Protection Agency. http://www.epa.gov/climatechange/basics/ 106 Causes of Climate Change: Earth’s Temperature is a Balancing Act. March 2014. Environmental Protection Agency. http://www.epa.gov/climatechange/science/causes.html 107 Riebeek 2010. 108 Ibid. 109 United Nations Framework Convention on Climate Change. http://unfccc.int/files/documentation/text/html/list_search.php?what=&val=&valan=a&anf=0&id=10 110 Ibid. 111 IPCC Special report on Carbon Dioxide Capture and Storage, Working Group III of the Intergovernmental Panel on Climate Change, Cambridge University Press, New York, New York, 2005, p. 65. 112 The Ocean and the Carbon Cycle. NASA Oceanography. http://science.hq.nasa.gov/oceans/system/carbon.html 113 Impacts of Anthropogenic CO2 on Ocean Chemistry and Biology. Tedesco, Kathy, et.al., NOAA Research. Office of Oceanic and Atmospheric Research. http://www.research.noaa.gov/spotlite/spot_gcc.html 114 Climate Change Futures: Health, Ecological and Economic Dimensions, The Center for Health and the Global Environment, Harvard Medical School, November 2005, p.4. 115 Impacts of Climate Change on Washington’s Economy: A preliminary Assessment of Risks and Opportunities, November 2006, Washington Economic Steering Committee and the Climate Leadership Initiative Institute for a Sustainable Environment, university of Oregon for WA. Dept. of Ecology and Dept. of Community, Trade and Economic Development, Washington State, P. 17. 116 2050 projections source: Mote, P. W. et al., 2013. Climate: Variability and Change in the Past and the Future. Chapter 2, 25-40, in M.M. Dalton, P.W. Mote, and A.K. Snover (eds.) Climate Change in the Northwest: Implications for Our Landscapes, Waters and Communities, Washington D.C.: Island Press. 117 Ibid. 118 Warner, Mass, Salathe, J Hydromet, 2014. 119 Elsner, M.M. et al. 2009: Implications of 21st Century climate change for the hydrology of Washington State (and Elsner et al. 2010 Climatic Change paper) 120 Climate Impacts Group presentation at the Threats and Hazards Identification Workshop May 1 & 2, 2019. A copy of the presentation can be found at https://www.co.pierce.wa.us/6367/Risk-Assessment-Past-Events 121 Presentation provided by Climate Impacts Group on May 1, 2019 at Threat and Hazards Identification Workshop. 122 Littell et al. 2010. 123 Mauger et al. 2015. 124 While there is some disagreement as to the actual beginning of the “Little Ice Age,” ranging from 1150 to 1560, with most scientists putting the beginning at the later number, the end point is commonly agreed to be around 1850. There had been a general cooling of the climate from around 1150 to 1460 and then a warm spell for approximately 100 years, and then from 1560 to 1850 a very cold climate shift. From http://www2.sunysuffolk.edu/mandias/lia/little_ice_age.html, http://www.windows.ucar.edu/tour/link=/earth/climate/little_ice_age.html 125 The Little Ice Age, Lisa Gardiner, University Corporation for Atmospheric Research, The Regents of the University of Michigan http://www.windows.ucar.edu/tour/link=/earth/climate/little_ice_age.html 126 Climate Variability, Climate Change, and Sea-level Rise in Puget Sound: Possibilities for the Future, Douglas J. Canning, Washington Department of Ecology and JISAO/SMA Climate Impacts Group, U. of Washington, 2001, p.1-2. 127 Mauger et al. 2015.
ENDNOTES – PAGE 4-360 REGION 5 ALL HAZARD MITIGATION PLAN – 2020-2025 EDITION BASE PLAN
128
Ibid, page 2. Mauger et al. 2015. 130 Stoelinga et al. 2009; Mote et al. 2008. 131 Mote, P., A. K. Snover, S. Capalbo, S. D. Eigenbrode, P. Glick, J. Littell, R. Raymondi, and S. Reeder, 2014: Ch. 21: Northwest. Climate Change Impacts in the United States: The Third National Climate Assessment, J. M. Melillo, Terese (T.C.) Richmond, and G. W. Yohe, Eds., U.S. Global Change Research Program, 487-513. doi:10.7930/J04Q7RWX 132 1928 to 2000 South Cascade Glacier Photo Comparison.http://ak.water.usgs.gov/glaciology/south_cascade/19282000comparison.htm and http://ak.water.usgs.gov/glaciology/south_cascade/1979-2003comparison.htm 133 Mount Rainier National Park Nature Notes, Volume XV, December 1937, No. 4, Mount Rainier National Park http://www.nps.gov/archive/mora/notes/vol15-4c.htm 134 Impacts of Climate Change on Washington’s Economy: A preliminary Assessment of Risks and Opportunities. November 2006. Washington Economic Steering Committee and the Climate Leadership Initiative Institute for a Sustainable Environment, university of Oregon for WA. Dept. of Ecology and Dept. of Community, Trade and Economic Development, Washington State, P.32-34. 135 Glacier Research on Mount Rainier. Mount Rainier National Park. http://www.glaciers.pdx.edu/MRNP/Res00.html 136 Seattle Post Intelligencer Nov 13, 2003 Online, http://seattlepi.nwsource.com/local/148043_warming13.html 137 Ibid. 138 What is meant by the term drought? Referenced by the National Weather Service, Western Region Headquarters from Glossary of Meteorology, 1959 edition. http://www.wrh.noaa.gov/fgz/science/drought.php The current edition lists it as “A period of abnormally dry weather sufficiently long enough to cause a serious hydrological imbalance.” http://amsglossary.allenpress.com/glossary/search?p=1&query=Drought&submit=Search&def=on 139 The drought types are taken from the National Drought Mitigation Center (NDMC), School of Natural Resources, University of Nebraska, Lincoln, 2006, http://drought.unl.edu/ 140 The Palmer Drought Severity Index, NOAA’s Drought Information Center, NOAA, http://www.drought.noaa.gov/palmer.html 141 What is Drought: Understanding and Defining Drought., The National Climatic Data Center (NCDC), http://www.ncdc.noaa.gov/sotc/drought/ 142 National Drought Mitigation Center, Aug 2012. http://drought.unl.edu/ 143 What is Drought: Historical Maps of the Palmer Drought Index., National Drought Mitigation Center, http://drought.unl.edu/ 144 Much of this table was taken from the Washington State 2001 Hazard Identification and Vulnerability Assessment, Washington State Military Department, Emergency Management Division, April 2001, p. 7. 145 Information from U.S. Drought Monitor. Accessed Sept. 23, 2019 at https://droughtmonitor.unl.edu/CurrentMap/StateDroughtMonitor.aspx?WA 146 Washington State Hazard Mitigation Plan, Washington State Military Department, Emergency Management Division http://www.emd.wa.gov/plans/documents/DroughtNov2007Tab5.3.pdf 147 Pierce County Hazard Identification and Vulnerability Analysis, Pierce County Department of Emergency Management, September 2002, p. 18. 148 Portions of this section on impacts were taken from http://library.thinkquest.org/16132/html/droughtinfo/effects.html and http://library.thinkquest.org/16132/html/droughtinfo/effects1.html and then modified to fit more accurately the Pierce County experience. 149 U.S. Drought Portal accessed Sept. 23, 2019 at https://www.drought.gov/drought/data-gallery/us-droughtmonitor 150 National Drought Mitigation Center. Retrieved March 14, 2015 from http://droughtreporter.unl.edu/ The Drought Impact Reporter is an active map that can be narrowed down by County. The figure provides the list of impacts effecting Pierce County directly. 151 Fire flow is the quantity of water needed to put out a fire of expected size. It can be specified by the equation (quantity = rate x duration). This means that the specific quantity of water for an individual fire in a combination of the rate the water can be applied to the fire and the length of time that flow must be maintained. Distribution system requirements for fire protection, by American Water Works Association, AWWA Manual M31, pps. 1-2. 152 Columbia River Basin, Department of Ecology, 12/16/02, http://www.ecy.wa.gov/programs/wr/cwp/crwmp.html 153 Established by the Watershed Management Act of 1998 (ESHB2514) and formalized under Washington Administrative Code (WAC) 173-500-040 and authorized under the Water Resources Act of 1971, Revised Code of 129
ENDNOTES – PAGE 4-361 REGION 5 ALL HAZARD MITIGATION PLAN – 2020-2025 EDITION BASE PLAN
Washington (RCW) 90.54. The Water Resource Inventory Areas were created to complete an inventory of water resources and develop strategies for their future use. Within Pierce County these include the Puyallup-White River Basin, (WRIA 10), the Nisqually (WRIA 11), the Chambers/Clover (WRIA 12), the Kitsap (WRIA 15) and the Cowlitz (WRIA 26). 154 This can be the case at both private and state hatcheries run by the Washington Department of Fish and Wildlife. 155 Drought Planning, Washington Department of Fish and Wildlife, http://wdfw.wa.gov/ 156 Young, Leroy, Fjsh Habitat and Flow: What’s the Connection? Aquatic Resources Section in the Commission's Division of Environmental Services, http://www.fish.state.pa.us/anglerboater/2001/ma2001/habtflow.htm 157 The Climate Zone Map was from http://growingtaste.com/usda_map.shtml 158 C.P. Lyons, J.M. Dent & Sons Trees, shrubs and flowers to know in Washington, , Canada, Limited, Toronto, 1977, pp7-11. 159 Terrell, Cindy The Damaging Effects of Drought, monograph published by the Morton Arboretum., July 1, 2005. 160 Research: Snails were overlooked contributors to marsh destruction, University of Florida News,12/15/05 http://news.ufl.edu/2005/12/15/snail-marsh/ 161 National Drought Mitigation Center, http://www.drought.unl.edu/risk/environment.htm 162 This entire section has been modified from PC HIVA, Storms Section, September 5, 2002, pp.41-45. http://www.co.pierce.wa.us/xml/abtus/ourorg/dem/HIVAWEB.pdf 163 National Weather Service Glossary. Accessed Sept. 23, 2019 from https://w1.weather.gov/glossary/ 164 The largest hailstone in US history was a 7” wide chunk of ice slightly smaller than a soccer ball. It is referenced in National Geographic News on August 4, 2003, http://news.nationalgeographic.com/news/2003/08/0804_030804_largesthailstone.html In contrast the heaviest hailstone recorded comes from northern India on March 10, 1939 and weighed 7.5 lbs. It is referenced on the MultiCommunity Environmental Storms Observatory website at http://www.mcwar.org/articles/hail.pdf 165 The Storm King, Windstorm Events Roughly Broken Down by Track Type, http://www.ocs.orst.edu/ 166 South Wind Event, Pierce County Planning and Land Services ,Map developed by Karen Truman with assistance from Ted Buehner with National Weather Service, 2002. 167 East Wind Event, Pierce County Planning and Land Services ,Map developed by Karen Truman with assistance from Ted Buehner with National Weather Service, 2002. 168 A tornado in the West, Special to the NY Times, Published October 9th, 1899. http://query.nytimes.com/mem/archivefree/pdf?_r=1&res=9B06EFDB173DE433A2575AC0A9669D94689ED7CF&oref=slogin 169 Phone conversation with Ted Buehner of the National Weather Service, NOAA, Department of Commerce, Seattle office, March 6, 2008. 170 Centers for Disease Control Lightning: Victim Data. Accessed September 24, 2019 from https://www.cdc.gov/disasters/lightning/victimdata.html 171 NOAA Satellite Photo of Hanukkah windstorm approaching the Washington Coast, 12/13/06. 172 Photos from before and after of Greensburg Kansas, Google Earth and May 2007 CATF3 photo 173 Ice Storms: Hazardous Beauty, Keith C. Heidorn, PhD, The Weather Doctor, December 2001, http://www.islandnet.com/~see/weather/elements/icestorm.htm 174 Ice Storms: Hazardous Beauty, Keith C. Heidorn, PhD, The Weather Doctor, December 2001, http://www.islandnet.com/~see/weather/elements/icestorm.htm 175 Photo from Pierce County Public Works Road Operations, December 14, 2006. 176 Definition from the National Interagency Fire Center. Accessed September 26, 2019 from https://www.nifc.gov/prevEdu/comm_guide/ch2.html 177 “Is Montana at Risk? Identified Hazards for The State of Montana.” Montana Disaster and Emergency Services. http://dma.mt.gov/des/risks.asp [Internet Accessed February, 2007]. 178 Modified from PC HIVA, WUI Fire Section, September 5, 2002, p.33. http://www.co.pierce.wa.us/xml/abtus/ourorg/dem/HIVAWEB.pdf 179 Fires in Washington Report, 2018, Washington State Fire Marshal’s Office. 180 Washington State 2018 Hazard Inventory and Vulnerability Assessment, https://mil.wa.gov/enhanced-hazardmitigation-plan 181 Ibid. 182 Ibid. 183 Ibid pg. 519. 184 Graphic from A Progress Report on the National Fire Plan in Washington State, Department of Natural Resources, September 2002.
ENDNOTES – PAGE 4-362 REGION 5 ALL HAZARD MITIGATION PLAN – 2020-2025 EDITION BASE PLAN
185
Washington Department of Natural Resources fire danger protection district map created by WA Department of Natural Resources S. Krock on Dec. 12, 2019. For real time information on the status of these zones go to https://fortress.wa.gov/dnr/protection/firedanger/. 186 The Washington State Industrial Fire Precaution Level System, Public Use Restrictions, Washington State Department of Natural Resources, www.dnr.wa.gov/htdocs/rp/ifpl.htm#4 187 DNR Fire Statistics 2008-Present, Washington Geospatial Open Data Portal. Accessed September 26, 2019 from http://geo.wa.gov/datasets/wadnr::dnr-fire-statistics-2008-present 188 Spies et al 2018. Spies, T. A., P. F. Hessburg, C. N. Skinner, K. J. Puettmann, M. J. Reilly, R. J. Davis, J. A. Kertis, J. W. Long, and D. C. Shaw. 2018. Old growth, disturbance, forest succession, and management in the area of the Northwest Forest Plan. In T. A. Spies, P. Stine, R. Gravenmier, J. W. Long, and M. J. Reilly, editors. Synthesis of Science to inform land management within the northwest forest plan area. PNW‐GTR‐966. USDA Forest Service, Pacific Northwest Research Station, Portland, Oregon, USA. 189 In Western Washington the 100 to 150 year burning cycle is based on a normal forest regrowth after a major fire that burns a large section of a forest. These fires are called “Stand Replacement Fires.” Once a stand replacement fire has happened it takes that long to develop enough vegetative material to support a repeat of the previous fire. Information from personal conversation with Chuck Frame, Fire Operations Manager, DNR South Puget Sound Region, 02/01/2008. 190 Harvey, B., Donato, D., and J. Halofsky. December 2018. After the smoke clears: A virtual field trip to the 2017 Norse Peak Fire. Paper presented at Managing Western Washington Wildfire Risk in a Changing Climate, Tulalip, WA. 191 Fuel Moisture Content is the quantity of moisture in the fuel expressed as a percent of the oven-dried weight. http://www.pfmt.org/fire/glossary.htm 192 WA Department of Natural Resources Fire Prevention and Fuel Management Mapping System. Accessed December 5, 2019 from https://fmanfire.dnr.wa.gov/default.aspx# 193 The Department of Natural Resources classifies the fires that they respond to as a Statistical or Classified Fire, an Unclassified Fire, a False Alarm, or Other Agency Response. Statistical Fire (Classified Fire): an uncontrolled fire requiring suppression action by DNR or it’s cooperators to prevent the fire from spreading to or burning on any lands for which the Department of Natural Resources (DNR) has the protection responsibility. Unclassified Fire: fires that have gone out naturally without burning onto forest lands, or that result from legitimate prescribed burning or debris burning that are extinguished by the causative agency without extra cost to DNR. It includes abandoned campfires which cannot spread or are confined to fireplaces or stoves and burning buildings, automotive equipment, haystacks, etc., which under prevailing conditions do not threaten DNR protected lands. An Other Agency Fire is one that another agency responded to within the framework of DNR land to initiate a quicker response than DNR would have been able to do. From Department of Natural Resources Fire Classification sent via correspondence from Chuck Frame at Washington DNR. 194 The DNR South Puget Sound Region consists of King, Pierce, and Snohomish Counties. 195 Data from statistics compiled by the Department of Natural Resources and received in a meeting with Chuck Frame, Fire Operations Manager, DNR South Puget Sound Region, 02/28/08. 196 Personal phone conversation with Chuck Frame, Fire Operations Manager, DNR South Puget Sound Region, March 3, 2008. 197 2018 Fire in Washington Annual Report was Prepared by the Washington State Fire Marshal’s Office and can be accessed at http://www.wsp.wa.gov/wp-content/uploads/2019/04/FIRE-IN-WASHINGTON2018.pdf 198 California Wildfires — Psychological Effects; Psychologist is Available to Discuss Trauma, From the Business Wire Oct. 26, 2003, from http://findarticles.com/p/articles/mi_m0EIN/is_2003_Oct_26/ai_109257122 199 Ibid. 200 https://apps.usfa.fema.gov/firefighter-fatalities/fatalityData/incidentDataReport 201 Wildland Fire Operations Risk Management Information Paper, Emphasis on risk management in wildland fire operations for 2007, FEMA, U.S. Fire Administration, U.S. Fire Administration, 16825 S. Seton Ave., Emmitsburg, MD 21727, available at www.usfa.dhs.gov/fireservice/subjects/wildfire/risk_management.shtm (301) 447-1000 Fax: (301) 447-1346 Admissions Fax: (301) 447-1441 202 Various issues of Safety Gram including, http://www.nifc.gov/wfstar/safety_gram07.pdf http://www.wildlandfire.com/docs/2009/safe/08FinalSafetyGram123108.pdf, http://www.nwcg.gov/teams/shwt/safety-grams/sg_2009-d.pdf 203 Safety Gram: Fatalities, Entrapments and Serious Accident Summary for 2008 http://safenet.nifc.gov/notice.nsf/0c09f454f5ecec4c87256a17005edd36/39b02626dc0932f38725755200771ee0/$FIL E/2008%20Final%20Safety%20Gram_12-31-08.pdf
ENDNOTES – PAGE 4-363 REGION 5 ALL HAZARD MITIGATION PLAN – 2020-2025 EDITION BASE PLAN
204
Fire Engineering, Fire Chief Dan Packer Dies in California Wildfire, http://community.fireengineering.com/forum/topic/show?id=1219672%3ATopic%3A69181 205 Ketron, Anderson, McNeil and Herron Islands are accessible only by ferry and Raft and Fox Islands are accessible by two lane road and a bridge, as is Day Island which is not a true island being barely connected to the mainland at its south end The final one, Tanglewood Island has only 4 homes and is reachable only by boat. 206 Ecological Effects of Fire Fighting Foams and Retardants, Robyn Adams and Dianne Simmons, Conference Proceedings, Australian Bushfire Conference, Albury, July 1999. from web http://www.csu.edu.au/special/bushfire99/papers/adams/ 207 Perfluorinated Surfactants and the Environmental Implication of Their Use in Fire-Fighting Foams, Cheryl A. Moody and Jennifer A Field, Environmental Science & Technology, Vol. 34, NO. 18, 2000, pps.3864 – 3870. as referenced at http://www.csu.edu.au/special/bushfire99/papers/adams/ 208 FEMA news release. Nearly 500 million federal grants and loans wildfire survivors. April 18, 2019 accessed April 28, 2020 from https://www.fema.gov/news-release/2019/04/18/4407/nearly-500-million-federal-grants-andloans-wildfire-survivors 209 Ashley Blazina, Washington State Department of Natural Resources, Community Wildfire Preparedness Coordinator, November 1, 2019. 210 Schasse, Koler, Eberle, and Christie, The Washington State Coal Mine Map Collection: A Catalog, Index, and User’s Guide, Open File Report 94-7, June 1984, pps. 93-100 211 Gertsch, Richard and Bullock, Richard Lee, editors, Techniques in Underground Mining, Selections from Underground Mining Methods Handbook, Chapter 5, Room-and-Pillar Method of Open-Stope Mining, by Bullock, P. 159 et. seq. as shown at http://books.google.com/books?id=s5bcuu3fQQsC&pg=PA160&lpg=PA160&dq=breast+and+pillar+mining+syste m&source=bl&ots=DapN0r20VY&sig=b-VY179VR-2CAHCHehL1OynqUI&hl=en&ei=2YpTStz7DIr0sgPyxsHoBw&sa=X&oi=book_result&ct=result&resnum=1 212 Schasse, Koler, Eberle, and Christie, The Washington State Coal Mine Map Collection: A Catalog, Index, and User’s Guide, Open File Report 94-7, June 1984, p. 15. 213 Photo by Joseph Daniels 09/1914, in The Coal Fields of Pierce County September 1914, from Washington Geologic Survey Bulletin #10, Plate #XXIII. Courtesy of William Kombol, Palmer Coking Coal Company, Black Diamond, Washington. 214 Coal Mining in an east Pierce County area known as Pittsburg (1989-1909), Spiketon (1910-1916), and finally Morristown (1917-1927), HistoryLink.org Essay 8262, http://www.historylink.org/index.cfm?DisplayPage=output.cfm&file_id=8262 215 Pierce County Code, Developmental Regulations, Chapter 18E.100, Mine Hazard Areas 216 Personal conversations with Pierce County Sheriff’s Department (PCSD) SAR Coordinator Cyndie Fajardo, and previous PCSD SAR Coordinator Tom Miner, July 08, 2009. 217 Personal conversation with Robert Peloli of Wilkeson, who was a miner in a number of the mines in the area bounded by Spiketon on the north and Carbonado on the south, July 08, 2009. 218 Initial report by Ella Robertson of Tacoma, confirmed by personal conversation with Walter and JoAnne Bevan of Burnett, March 10, 2010. 219 Personal conversation with Robert Peloli of Wilkeson, who was a miner in a number of the mines in the area bounded by Spiketon on the north and Carbonado on the south, July 08, 2009. 220 (Pacific Coast Coal 007- No. 1 or 4 (?) Mine tipple; Carbonado, Washington. A Carbonado mine tipple is perched above the Carbon River with the resulting coal slag dumped into the river below. At one time the Carbon Hill Coal Company’s Carbonado operations were the largest producing coal mines in Washington. Over seven mine opening were used to recover an average of 200,000 tons per year. In total, the Carbonado mines produced 10.6 million tons from 1884-1973 comprising nearly half of the Pierce County total production. This photo came from the studios of Frank Jacob and from the collection of Frank Guidetti. Courtesy of William Kombol, Palmer Coking Coal Company.) 221 IS-907- Active Shooter: What Can You Do? (Online Video Training), Department of Homeland Security, Viewed on March 26, 2013. http://emilms/fema.gov/IS907/index.htm 222 Raymond W. Kelly, Police Commissioner, Active Shooter Recommendations and Analysis for Risk Mitigation, New York City Police Department, 2012 Edition, page 7, www.nyc.gov/html/nypd/downloads/pdf/counterterrorism/ActiveShooter2012Edition.pdf 223 FBI, Quick Look: 250 Active Shooter Incidents in the United States from 2000 to 2017, accessed Aug. 22, 2019 at https://www.fbi.gov/about/partnerships/office-of-partner-engagement/active-shooter-incidents-graphics
ENDNOTES – PAGE 4-364 REGION 5 ALL HAZARD MITIGATION PLAN – 2020-2025 EDITION BASE PLAN
224
FBI Active Shooter Incidents in the United States in 2018, accessed Aug. 8, 2019 at https://www.fbi.gov/filerepository/active-shooter-incidents-in-the-us-2018-041019.pdf/view 225 Federal Bureau of Investigation Joint Intelligence Bulletin Recent Active Shooter Incidents Highlight Need for Continued Vigilance, 27 December 2012, http://publicintelligence.net/dhs-fbi-bulletin-recent-shooters/, page 2 226 James P. Gaffney, Defeat School Shooters Before the First Shot, Law Enforcement Today, http://lawenforcementtoday.com/tag/five-stages-of-the-active-shooters/ 227 Active Shooter: How to Respond, United States Department of Homeland Security training brief, October 2008, http://www.dshs.gov/activeshooter 228 Chuck Ergenbright, Defeating the Active Shooter: Applying Facility Upgrades in Order to Mitigate the Effects of Active Shooters in High Occubancy Facilities “A Meaningful Change”, Center for Infrastructure Protection and Homeland Security CIP Report Volume 11 Number 9, March 2013, page 3 229 FBI Joint Intelligence Bulletin, page 2 230 Mark Coulson, PHD, Prevention Rather Than ‘Cure’: Identifying the Active Shooter-in-Waiting, Center for Infrastructure Protection and Homeland Security, CIP Report Volume 11 Number 9, March 2013, page 4 231 J. Pete Blair and M. Hunter Martaindale, Texas State University, Advanced Law Enforcement Rapid Response Training, United States Active Shooter Events from 2000-2010: Training and Equipment Implications, page 5 232 CBSnews.com, Texas Slasher Suspect Dylan Quick Fantasized About Stabbing People Since Elementary School: Police, http://cbsnews.com/2012-505263_162-57578798.html 233 Raymond W. Kelly, pages 33, 37, 43, 98, 117, 127, 149, 159, 195 234 Occurrences obtained by the FBI assessment from 2000-2018 235 Mark Coulson, page 4 236 J. Pete Blair and M. Hunter Martaindale, page 5 237 http://definitions.uslegal.com/c/civil-disturbance/ 238 Ibid. 239 Leland Athow, “A brief history of the Adam Byrd branch of the Byrd family.” As recorded on
http://www.usgennet.org/usa/wa/state/andrewbyrd.html
Puget’s Sound: A Narrative of Early Tacoma and the Southern Sound, Murray Morgan, University of Washington Press, Seattle & London, 1979, pps. 212-244. 241 Multiple references at http://www.ilwu19.com/history/1934.htm 242 Coxey Marches on Washington, Historycentral.com, History’s Home on the WEB, 240
http://www.historycentral.com/Industrialage/CoxeyMarchWash.html 243
City of Puyallup Natural Hazard Mitigation Plan, March 7th, 2005, p. 2-7. Puyallup Tribe of Indians: Fishing, http://www.puyallup-tribe.com/history/fishing/ 245 The Fish-in Protests at Franks Landing, Gabriel Chrisman, Seattle Civil Rights and Labor History Project, 244
http://depts.washington.edu/civilr/fish-ins.htm 246
White supremacy extremist groups increasing recruitment efforts, Special Agent John Palmer, Air Force Office of Special Investigation, www.peterson.af.mil/news/story.asp?id=123149980 247 1992 Los Angeles riots, article in Wikipedia, the free encyclopedia,
http://en.wikipedia.org/wiki/Los_Angeles_riots_of_1992 248
Centrifugal tendencies are the movement away from a center, from others, or to separate from a mean or to separate from other groups. 249 Computer Security Resource Center. National Institute of Standards and Technology. Accessed April 28, 2020 from https://csrc.nist.gov/glossary/term/Cyber_Attack 250 Taylor, R. W., Fritsch, E. J., Liederbach, J., & Holt, T. J. (2011). Digital crime and digital terrorism (2nd ed.). Upper Saddle River, NJ, New Jersey: Prentice Hall. 251 Ibid. 252 Federal Bureau of Investigation. “What We Investigate, Cyber Crime”. Accessed April 28, 2020 from https://www.fbi.gov/investigate/cyber 253 President Barak Obama speech on “Securing Our Nation’s Cyber Infrastructure”, March 29, 2009, http://www.whitehouse.gov/the_press_office/Remarks-by-the-President-on-Securing-Our-Nations-CyberInfrastructure 254 Dr. Joseph M. Kizza, University of Tennessee at Chattanooga, PowerPoint presentation- “Chapter 3: Types of Cyber Attacks”, www.utc.edu/~jkizza/Books/CyberEthics/CyberNotes/Chapter3.ppt 255 Ibid.
ENDNOTES – PAGE 4-365 REGION 5 ALL HAZARD MITIGATION PLAN – 2020-2025 EDITION BASE PLAN
Department of Homeland Security, Industrial Control Systems- Cyber Emergency Response Team, “Overview of Cyber Vulnerabilities”, http://ics-cert.us-cert.gov/content/overview-cyber-vulnerabilities 257 James Andrew Lewis, Center for Strategic and International Studies, Significant Cyber Incidents Since 2006, March 18, 2013, http://csis.org/files/ublications/1303189_significant_syber_incidents_since_2006.pdf 258 David Goleman, CNNMoney, Hacker Hits on U.S. Power and Nuclear Targets Spiked in 2012, http://money.cnn/com/2013/01/09/technology/security/infrastructure-cyber-attacks/index 259 Sharon Weinberger, AOL News, Five New Frightening Types of Cyberattacks, http://www.aolnews.com/2010/10/18/five-new-frightening-types -of-cyberattacks/ 260 Ibid. 261 Dennis K. Nilsson and Ulf E. Larson, A Roadmap for Securing Vehicles Against Cyber Attacks, http://varma.ece.cmu.edu/Auto-CPS/Nilsson_Chalmers.pdf 262 James Andrew Lewis. 263 Ponemon Institute, 2012 Cost of Cyber Crime Study: United States, October 2012, page 3, http://www.ponemon.org/local/upload/file/2012_US_Cost_of_Cyber_Crime_Study_FINAL6%20.pdf 264 Ponemon Institute, page 4. 265 Kristin M. Finklea, Congressional Research Service, Identity Theft: Trends and Issues, February 15, 2012, page 1, http://www.fas.org/sgp/crs/misc/R40599.pdf 266 Dam, Washington Department of Ecology, Glossary at http://www.ecy.wa.gov/programs/wr/cwp/images/pdf/legsrpt/chptr7_glossry_111506.pdf 267 Dam Failure, NOAA, National Weather Service, Glossary at http://www.nws.noaa.gov/glossary/index.php?letter=d 268 Notable Dam Failures, Washington State Department of Ecology, http://www.ecy.wa.gov/PROGRAMS/wr/dams/failure.html 269 Inventory of Dams Report June 11, 2019, Washington Department of Ecology, Water Resources Program, Dam Safety Office Revised Edition June 2018 Publication #94-16 270 Legacy classifications are used to measure the hazard downstream impacts. 1A = Greater than 300 lives at risk 1B = From 31-300 lives at risk 1C = From 7-30 lives at risk. These are all considered in the high category. https://fortress.wa.gov/ecy/publications/publications/94016.pdf 271 Notable Dam Failures and Incidents in Washington State, Department of Ecology http://www.ecy.wa.gov/programs/wr/dams/Reports/damfailure_ws.pdf 272 Information on the Mill Creek Dam failure came from Dam Failures, Dam Incidents (Near Failures), Association of State Dam Safety Officials, http://www.damsafety.org/news/?p=412f29c8-3fd8-4529-b5c98d47364c1f3e 273 Mud Mountain Dam and intake structure showing the dam in its normal empty state. Photo from the Army Corps of Engineers – Seattle District. 274 FEMA. Accessed February 2020 from https://Ready.gov/floods 275 Floods 101, Christina Nunez, National Geographic access August 13, 2019 at https://www.nationalgeographic.com/environment/natural-disasters/floods/ 276 Ibid. 277 Federal Guidelines for Dam Safety, prepared by the Interagency Committee on Dam Safety, Federal Emergency Management Agency, June 1979, reprinted April 2004, pp. 39-42. 278 Water Resources Program Policy 5404, Washington State Department of Ecology, Dam Safety Office as shown at http://www.ecy.wa.gov/programs/wr/rules/images/pdf/pol5404.pdf 279 WAC 173-175-705 Periodic inspection by the department, as shown at http://apps.leg.wa.gov/wac/default.aspx?cite=173-175-705 280 Definitions provided by the Washington State Department of Commerce State Energy Office. 281 Richard J. Campbell, Congressional Research Service, Weather Related Power Outages and Electric System Resiliency, August 28, 2011, page 1, http://www.fas.org/sgp/crs/misc/R42696.pdf 282 Institute for Energy Research, Washington Energy Facts, www.institute forenergyresearch.org/states 283 Weare, Christopher. (2003). The California Electricity Crisis: Causes and Policy Options. Retrieved March 18 from, http://www.ppic.org/content/pubs/report/R_103CWR.pdf 284 Royal Academy of Engineering, Extreme space weather: Impacts on engineered systems and infrastructure, February 2013, http://www.raeng.org.uk/news/publications/list/reports/space_weather_full_report_final.pdf 285 U.S. Department of Energy. (March 2013). Insurance as a Risk Management Instrument for Energy Infrastructure Security and Resilience. Page 46. Retrieved March 13, 2015 from http://energy.gov/sites/prod/files/2013/03/f0/03282013_Final_Insurance_EnergyInfrastructure.pdf 256
ENDNOTES – PAGE 4-366 REGION 5 ALL HAZARD MITIGATION PLAN – 2020-2025 EDITION BASE PLAN
286
Ibid. Michael Sean Sullivan, The News Tribune, In Late 1929, Tacoma Had No Electricity; The US Lexington Brought the Power, http://www/thenewstribune.com/2012/12/22/2411474/when-a-giant-ship-powered-tacoma.html 288 U.S. Department of Energy. (March 2013). Insurance as a Risk Management Instrument for Energy Infrastructure Security and Resilience. Page 46. Retrieved March 13, 2015 from http://energy.gov/sites/prod/files/2013/03/f0/03282013_Final_Insurance_EnergyInfrastructure.pdf 289 Committee on the Societal and Economic Impacts of Severe Space Weather Events: A Workshop, National Research Council, Severe Space Weather Events-Understanding Societal and Economic Impacts, 2013, http://www.nap.edu/openbook.php?record_id=12643&page=4 290 Federal Emergency Management Agency, Space Weather, February 2013, http://www.ready.gov/space-weather 291 Lexington in Tacoma, photo from NavSource Online, http://www.navsource.org/archives/02/02.htm 292 Washington Military Department, Windstorm Response After Action Report, March 2007, page ii, http://www.emd.wa.gov/publications/documents/FINAL_AAR_040407.pdf 293 http://washington.stateguidesusa.com/answers-to-my-questions/what-are-the-average-monthly-temperatures-inwashington?/ 294 Gas Buddy Online, http://gasbuddy.com/gb_retail_price_chart.aspx 295 Ronald Turner, National Response to a Severe Space Weather Event, March 2012, http://www.agu.org/journals/sw/swa/review/swa/feature/article/print.php?id=2011SW000756 296 James Hamilton, OilPrice.com, The Diminishing Effects of Gras Price Spikes on the Economy, http://oilprice.com/Energy/Gas-Prices/The-Diminishing-Effects-of-Gas-Price-Spikes-on-the-Economy.html 297 The Economist, Pakistan’s Energy Crisis, Power Politics, Page 1, http://www.economist.com/blogs/banyan/2012/05/pakistan%E2%80%99s-energy-crisis 298 Allianz, Power Trip, page 1, http://www.agcs.allianz.com/insights/expert-risk-articles/energy-risks/ 299 Richard J. Campbell, page 1. 300 Office of the Federal Coordinator for Meteorological Services and Supporting Research National Space Weather Program Council, Report on Space Weather Observing Systems: Current Capability and Requirements for the Next Decade, April 2013. 301 This assessment was reviewed by the Tacoma Pierce County Health Department in January of 2020. 302 Centers for Disease Control. (2012). Principle of Epidemiology in Public Health Practice (3rd. ed.). Section 11: Epidemic Diseases Occurrence. Retrieved March 16, 2015 from http://www.cdc.gov/ophss/csels/dsepd/ss1978/lesson1/section11.html 303 U.S. Department of Human and Health Services. Pandemic Flu History. Retrieved March 1, 2015 from http://www.flu.gov/pandemic/history/ 304 Colwell, Rita R. (20 Dec. 1996). Global Climate and Infectious Disease: The Cholera Paradigm. Science. Vol 274 (2025-2031). Retrieved March 18, 2015 from http://www.sciencemag.org/content/274/5295/2025.full.pdf 305 Influenza: Overview, World Health Organization (WHO), http://www.who.int/mediacentre/factsheets/2003/fs211/en/ 306 Influenza: Overview, World Health Organization (WHO), http://www.who.int/mediacentre/factsheets/2003/fs211/en/ 307 NW Area Committee. (February 2015). Bakken crude oil pamphlet Page 2. Retrieved on February 27, 2015 from http://www.rrt10nwac.com/Files/FactSheets/150213064220.pdf 308 Ibid, page 2. 309 Ibid. 310 Bhopal Gas Tragedy Relief and Rehabilitation Department, Government of Madhya Pradesh, http://www.mp.gov.in/bgtrrdmp/default.htm 311 NW Area Committee. (February 2015). Bakken crude oil pamphlet. Retrieved on February 27, 2015 from http://www.rrt10nwac.com/Files/FactSheets/150213064220.pdf 312 Ibid, page 7. 313 Thousands could have been exposed to deadly gas on Tacoma’s Tideflats Susan Gordan, Tacoma News Tribune, 03/09/08, updated 04/01/10, http://www.thenewstribune.com/2008/03/09/304409/thousands-could-have-beenexposed.html 314 Dalco Passage Spill, U.S. Coast Guard and Washington Department of Ecology Timeline. 315 Polar Texas – Conoco Phillips Spill, Washington Department of Ecology, http://www.ecy.wa.gov/programs/spills/incidents/dalco/dalcobase.htm 287
ENDNOTES – PAGE 4-367 REGION 5 ALL HAZARD MITIGATION PLAN – 2020-2025 EDITION BASE PLAN
316
Information presented by Dave Byers the Spills Prevention, Preparedness, and Response Program Manager with Washington State Department of Ecology on May 2, 2019. A copy of the presentation can be found at https://www.co.pierce.wa.us/6367/Risk-Assessment-Past-Events 317 Pierce County becoming a model for combating meth, Pierce County Front Page News, Thursday Jan 16, 2003, http://www.co.pierce.wa.us/cfapps/internet/news.cfm?node_id=11325&media=P 318 Meth Incidents by County by Month, WA Only – Summary 2009, Washington Department of Ecology, http://www.ecy.wa.gov/programs/spills/response/drug_labs/MethLabSummary2009.pdf 319 NW Area Committee. (February 2015). Bakken crude oil pamphlet. Retrieved on February 27, 2015 from http://www.rrt10nwac.com/Files/FactSheets/150213064220.pdf 320 Ibid, page 5 states that “Structural firefighters’ protective clothing will only provide limited protection.” 321 Exxon Valdez oil spill impacts lasting far longer than expected, scientists say, David Williams, University of North Carolina News Services, http://www.unc.edu/news/archives/dec03/peters121803.html 322 Dalco Passage Oil Spill Photo Album, U.S. Coast Guard, Department of Homeland Security, http://www.uscg.mil/d13/diraux/albums/dalco/slides/02060026.asp 323 Final Report on the Recovery of the Upper Sacramento River – Subsequent to the 1991 Cantara Spill, The Cantara Trustee Council, 2007, p. 3. 324 Cornell University Law School Legal Information Institute. 49 U.S. Code § 60101 – Definitions. Retrieved March 18, 2015 from https://www.law.cornell.edu/uscode/text/49/60101 325 Office of the Law Revision Council United States Code. Accessed Sept. 23, 2019 from https://uscode.house.gov/view.xhtml?path=/prelim@title49/subtitle8/chapter601&edition=prelim 326 Williams Northwest Pipeline website on Northwest Pipeline Operations, http://www.northwest.williams.com/NWP_Portal/extLoc.action?Loc=FilesNorthwest&File=pipelineInfo.html 327 Phone Conversation with Grant Jensen of Williams Pipeline Corp, 04/13/2010. 328 Washington Counties, Cities and Towns with Interstate Pipelines, Municipal Research and Services Center of Washington, http://www.mrsc.org/Subjects/PubSafe/pipecities.aspx 329 Olympic Pipe Line Company Spill Response Plan, prepared by TRP (Technical Response Planning Corporation, 8203 Willow Place South, Suite 160, Houston, Texas 77070, 2002, Appendix C, pp. 2-4 330 McChord Pipeline Company website, http://www.mcchordpipeline.com/ 331 Olympic Pipe Line accident in Bellingham kills three youths on June 10, 1999, on historylink.org at http://www.historylink.org/index.cfm?DisplayPage=output.cfm&File_Id=5468 332 Washington Significant Incidents Listing, U.S. Department of Transportation, Pipeline and Hazardous Materials Safety Administration, http://primis.phmsa.dot.gov/comm/reports/safety/IncDetSt_st_WA_flt_sig.html?nocache=8206#_ngtrans 333 Incident Response: Natural Gas and Electric Incidents, booklet published by Puget Sound Energy, 411 108th Ave. N.E., Bellevue, EA 98004, p.4 334 The range can vary due to differences in the chemical composition of the gas, “as well as temperature pressure and humidity”, Incident Response: Natural Gas and Electric Incidents, booklet published by Puget Sound Energy, 411 108th Ave. N.E., Bellevue, EA 98004, p.5 335 Washington Significant Incidents Listing, U.S. Department of Transportation, Pipeline and Hazardous Materials Safety Administration, http://primis.phmsa.dot.gov/comm/reports/safety/IncDetSt_st_WA_flt_sig.html?nocache=8206#_ngtrans 336 Public Health Statement for Automotive Gasoline, Agency for Toxic Substances and Disease Registry, http://www.atsdr.cdc.gov/toxprofiles/phs72.html 337 Olympic Pipe Line accident in Bellingham kills three youths on June 10, 1999, on historylink.org at http://www.historylink.org/index.cfm?DisplayPage=output.cfm&File_Id=5468 338 Olympic Pipe Line accident in Bellingham kills three youths on June 10, 1999, on historylink.org at http://www.historylink.org/index.cfm?DisplayPage=output.cfm&File_Id=5468 339 The Oiled Wildlife Care Network, Wildlife Health Center, U. C. Davis, http://www.vetmed.ucdavis.edu/owcn/oiled_wildlife/index.cfm 340 Federal Bureau of Investigation. 2019. Terrorism Webpage. Accessed online on 8/26/19 from https://www.fbi.gov/investigate/terrorism. 341 Zapotosky, Matt. July 23, 2019. Wray says FBI has recorded about 100 domestic terrorism arrests in fiscal 2019 and many investigations involve white supremacy. The Washington Post. Accessed online on 8/26/19 from https://www.washingtonpost.com/national-security/wray-says-fbi-has-recorded-about-100-domestic-terrorismarrests-in-fiscal-2019-and-most-investigations-involve-white-supremacy/2019/07/23/600d49a6-aca1-11e9-bc5ce73b603e7f38_story.html.
ENDNOTES – PAGE 4-368 REGION 5 ALL HAZARD MITIGATION PLAN – 2020-2025 EDITION BASE PLAN
342
Kim, Hana. December 11, 2015. FBI investigating 70 to 100 cases in Washington State with possible ties to terrorism. Q13 Fox News. Accessed online on 8/26/19 from https://q13fox.com/2015/12/11/fbi-investigating-up-toa-100-cases-possibly-linked-to-terrorism-in-washington/. 343 Barrett, Devlin. March 9, 2019. Arrests in domestic terror probes outpace those inspired by Islamic extremists. The Washington Post. Accessed online on 8/26/19 from https://www.washingtonpost.com/world/nationalsecurity/arrests-in-domestic-terror-probes-outpace-those-inspired-by-islamic-extremists/2019/03/08/0bf329b6-392f11e9-a2cd-307b06d0257b_story.html. 344 Dilanian, Ken. August 9, 2019. There is no law that covers 'domestic terrorism.' What would one look like? NBC News. Accessed online on 8/26/19 from https://www.nbcnews.com/politics/justice-department/there-no-law-coversdomestic-terrorism-what-would-one-look-n1040386. 345 Mid-America Regional Council. 2015. Regional Multi-Hazard Mitigation Plan. Accessed online on 8/26/19 from https://www.marc.org/Emergency-Services-9-1-1/pdf/2015HMPdocs/HMP2015_Sec4-HAZ-Terrorism.aspx. 346 National Counterterrorism Center. 2018. Planning and Preparedness Can Promote an Effective Response to a Terrorist Attack at Open-Access Events. Accessed online on 8/26/19 from https://www.dni.gov/files/NCTC/documents/jcat/firstresponderstoolbox/First-Responders-Toolbox---PlanningPromotes-Effective-Response-to-Open-Access-Events.pdf. 347 National Counterterrorism Center. 2018. Planning and Preparedness Can Promote an Effective Response to a Terrorist Attack at Open-Access Events. Accessed online on 8/26/19 from https://www.dni.gov/files/NCTC/documents/jcat/firstresponderstoolbox/First-Responders-Toolbox---PlanningPromotes-Effective-Response-to-Open-Access-Events.pdf. 348 United Nations Development Programme. 2016. Prevent Violent Extremism Through Promoting Inclusive Development, Tolerance and Respect for Diversity. Accessed online on 8/26/19 from https://www.undp.org/content/dam/norway/undp-ogc/documents/Discussion%20Paper%20%20Preventing%20Violent%20Extremism%20by%20Promoting%20Inclusive%20%20Development.pdf. 349 Shayanian, Sara. March 28, 2018. Man charged with sending explosives to D.C. military sites. United Press Internationa. Accessed online on 8/26/19 from https://www.upi.com/Top_News/US/2018/03/28/Man-charged-withsending-explosives-to-DC-military-sites/5591522255789/. 350 Department of Justice. Friday, March 31, 2017. Two Women Sentenced for Providing Material Support to Terrorists. Accessed online on 8/26/19 from https://www.justice.gov/opa/pr/two-women-sentenced-providingmaterial-support-terrorists. 351 Meyers, Donald W. August 31, 2016. Bail decision delayed in Selah explosives case. The Seattle Times. Accessed online on 8/26/19 from https://www.seattletimes.com/seattle-news/crime/bail-decision-delayed-in-selahexplosives-case/. 352 The Associated Press. September 10, 2015. Video shows object thrown in Planned Parenthood arson. The Seattle Times. Accessed online on 8/26/19 from https://www.seattletimes.com/seattle-news/video-shows-object-thrown-inplanned-parenthood-arson-in-pullman/. 353 McCarty, Kevin. August 10, 2015. Man arrested after 2 bombs discovered outside Pierce County hardware store. KIRO 7. Accessed online on 8/26/19 from https://www.kiro7.com/news/man-arrested-after-two-bombs-discoveredoutside-pi/28802706. 354 Carter, Mike. July 31, 2014. Man who set fire in Capitol Hill nightclub sentenced to 10 years. The Seattle Times. Accessed online on 8/26/19 from https://www.seattletimes.com/seattle-news/man-who-set-fire-in-capitol-hillnightclub-sentenced-to-10-years/. 355 Collins, Laura. September 18, 2014. Revealed, one man's terrifying 'jihad' on U.S. soil: Extremist 'executed four in revenge for American attacks in the Middle East and carried out bank fraud for the Cause'. Daily Mail Online. Accessed online on 8/26/19 from https://www.dailymail.co.uk/news/article-2759901/Revealed-terrifying-one-manjihad-U-S-soil-Extremist-executed-four-revenge-American-attacks-Middle-East-carried-bank-fraud-Cause.html. 356 Kron, Josh. October 30, 2011. American Identified as Bomber in Attack on African Union in Somalia. The New York Times. Accessed online on 8/26/19 from https://www.nytimes.com/2011/10/31/world/africa/shabab-identifyamerican-as-bomber-in-somalia-attack.html?_r=0. 357 Carter, Mike. May 29, 2012. Felon admits he tried to run Marines off I-5. The Seattle Times. Accessed online on 8/26/19 from https://www.seattletimes.com/seattle-news/felon-admits-he-tried-to-run-marines-off-i-5/. 358 The Associated Press. June 5, 2012. Seattle terror suspect wants evidence tossed. Fox News. Accessed online on 8/26/19 from https://www.foxnews.com/us/seattle-terror-suspect-wants-evidence-tossed#ixzz28jz1MkOE. 359 Pignolet, Jennifer. Wednesday, June 12, 2013. Clarkston man convicted of trying to aid terrorists The Spokane Spokesman-Review. Accessed online on 8/26/19 from https://www.spokesman.com/stories/2013/jun/12/bombmaker-sentenced/.
ENDNOTES – PAGE 4-369 REGION 5 ALL HAZARD MITIGATION PLAN – 2020-2025 EDITION BASE PLAN
360
Clouse, Thomas. December 20, 2011. MLK bomb maker gets 32 years in prison. The Spokane SpokesmanReview. Accessed online on 8/26/19 from https://www.spokesman.com/stories/2011/dec/20/mlk-parade-bomberseeks-guilty-plea-withdrawal/. 361 Pierce County Hazard Identification and Vulnerability Analysis, September 2002, p. 94. 362 National Counterterrorism Center. 2018. Planning and Preparedness Can Promote an Effective Response to a Terrorist Attack at Open-Access Events. Accessed online on 8/26/19 from https://www.dni.gov/files/NCTC/documents/jcat/firstresponderstoolbox/First-Responders-Toolbox---PlanningPromotes-Effective-Response-to-Open-Access-Events.pdf. 363 A copy of the full scenario can be found on the Pierce County Emergency Management Risk Committee Webpage https://www.piercecountywa.gov/6081/Risk-Committee. Note that locations are provided in the full version of the scenario. The scenario was developed with the intent that local jurisdictions could take this scenario and personalize by changing the locations or timeframe for planning purposes. For instance, the timeframes could be changed so that school is in session and that students are reacting to the cyber impact. 364 Most information in this section is taken from the September 2002 edition of the Pierce County HIVA and the Report done by Glenn Cramer Consulting LLC. (May 30, 2014). Pierce County HAZMAT Truck Flow Study. 365 Bakken Crude Oil distributed by the NW Area Committee. February 2015. Data for calculation of statistics can be found on page 3. 366 Ibid, page 7. 367 Harborview Marina Fire at Gig Harbor, Washington Department of Ecology, report at http://www.ecy.wa.gov/programs/spills/accidents/harborviewmarina/HarborViewMarinaFirebase.htm 368 Department of Ecology. (Dec. 1, 2011). BNSF Train Derailment. Retrieved February 23, 2015 from http://www.ecy.wa.gov/programs/spills/accidents/ChambersBayDerailment/ChambersBayDerailment.html 369 Attachment distributed by the NW Area Committee in an email from Lori Gifford with the Washington Military Department lorri.giffore@mil.wa.gov dated 2/24/2015. Currently (dated Feb. 2015) around 19 trains/week in Washington State transport Bakken Crude Oil, of which 15 enter Pierce County. Bakken Oil is unloaded at (48,000 barrels/day) at U.S. Oil and (75,000 barrels/day) at Targa Sound in Tacoma. 370 Information on this accident came from the incident logs, situation reports and other archived ICS documents from the incident. 371 Final Report on the Recovery of the Upper Sacramento River – Subsequent to the 1991 Cantara Spill, The Cantara Trustee Council, 2007, p. 3.
ENDNOTES – PAGE 4-370 REGION 5 ALL HAZARD MITIGATION PLAN – 2020-2025 EDITION BASE PLAN
Section 5 Mitigation Strategy Requirements Mitigation Strategy---Requirement §201.6(c)(3): The plan shall include a strategy that provides the jurisdiction’s blueprint for reducing the potential losses identified in the risk assessment, based on existing authorities, policies, programs and resources, and its ability to expand on and improve these existing tools. Local Hazard Mitigation Goals---Requirement §201.6(c)(3)(i): [The hazard mitigation strategy shall include a] description of mitigation goals to reduce or avoid longterm vulnerabilities to the identified hazards. • Does the plan include a description of mitigation goals to reduce or avoid long-term vulnerabilities to the identified hazards? Identification and Analysis of Mitigation Measures---Requirement §201.6(c)(3) (ii): [The mitigation strategy shall include a] section that identifies and analyzes a comprehensive range of specific mitigation actions and projects being considered to reduce the effects of each hazard, with particular emphasis on new and existing buildings and infrastructure. • • •
Does the plan identify a comprehensive range of specific mitigation actions and projects for each hazard? Do the identified range of mitigation actions and projects address reducing the effects of hazards on new buildings and infrastructure? Do the identified range of mitigation actions and projects address reducing the effects of hazards on existing buildings and infrastructure?
Implementation of Mitigation Measures---Requirement: §201.6(c)(3) (iii): [The mitigation strategy section shall include] an action plan describing how the actions identified in section (c)(3)(ii) will be prioritized, implemented, and administered by the local jurisdiction. Prioritization shall include a special emphasis on the extent to which benefits are maximized according to a cost benefit review of the proposed projects and their associated costs. • • •
Does the mitigation strategy include how the actions are prioritized? Does the mitigation strategy address how the actions will be implemented and administered? Does the prioritization process include an emphasis on the use of cost-benefit review?
PAGE 5-1 REGION 5 ALL HAZARD MITIGATION PLAN – 2020-2025 EDITION BASE PLAN
SECTION 5 REGION 5 ALL HAZARD MITIGATION PLAN 2020-2025 EDITION MITIGATION STRATEGY Table of Contents SECTION 5 ...............................................................................................................1 MITIGATION STRATEGY REQUIREMENTS ..................................................................1 TABLE OF CONTENTS ...............................................................................................2 MITIGATION STRATEGY DEVELOPMENT ....................................................................3 GOALS .............................................................................................................................................3 OBJECTIVES ......................................................................................................................................3 MITIGATION MEASURES .......................................................................................................................4
PAGE 5-2 REGION 5 ALL HAZARD MITIGATION PLAN – 2020-2025 EDITION BASE PLAN
Mitigation Strategy Development The hazard mitigation strategy includes a description of mitigation goals to reduce or avoid longterm vulnerabilities to the hazards identified in the Risk Assessment. The mitigation strategy includes sections that identify and analyze a comprehensive range of specific mitigation measures that reduce the effects of each hazard. Many jurisdictions focused their emphasis on new and existing buildings and infrastructure. Mitigation strategy development began with a review of the categories of mitigation goals, as outlined by FEMA. Using this template and adjusting it to fit the mission statements of all participating jurisdictions, the Planning Team developed goals specific to the Planning Area. Through incorporation of the analysis and conclusions found in the Risk Assessment and the Capability Identification, each jurisdiction identified specific mitigation measures and prioritized them through a process of public participation and cost/benefit review tailored to each jurisdiction’s unique needs and capabilities. Central to this entire process is continued public involvement.
Goals Goals are general guidelines that explain what you want to achieve. They are usually broad policy-type statements, long term, and represent global visions. However, mitigation goals should be consistent with the state’s goals and should not contradict other jurisdiction or community goals such as those expressed in the local comprehensive or general plan. The goals the group has selected for the Region 5 All Hazard Mitigation Plan are as follows: Protect Life and Property Ensure Continuity of Operations Establish and Strengthen Partnerships for Implementation Protect the Environment Increase Public Preparedness for Disasters Promote a Sustainable Economy To help achieve each goal, the Plan identifies mitigation measures; specific actions or projects that help mitigate risk for each jurisdiction. The planning process of data-collection, research, regional collaboration and public participation leads to the development of these measures. This process ensures that the measures speak to the risks and that these measures can be implemented. The Risk Assessment is central to the process of selecting mitigation measures from the Plan’s goals.
Objectives Objectives define strategies or implementation steps to attain the identified goals. Unlike goals, objectives are specific and measurable. Jurisdiction team members were encouraged to develop their own specific jurisdiction objectives. They were encouraged to include time frames and PAGE 5-3 REGION 5 ALL HAZARD MITIGATION PLAN – 2020-2025 EDITION BASE PLAN
specific targets within those time frames as part of their objectives. These objectives then operated as working objectives that were used in the development of the mitigation measures.
Mitigation Measures Mitigation Measures are specific actions that help to achieve goals and objectives. While the Goals that were developed are universal for all 76 jurisdictions the Objectives and Mitigation Measures vary, based on each jurisdiction’s values, identity and culture. The outcomes of the Risk Assessment, specifically the Population Exposure, Infrastructure Exposure, and Vulnerability Analysis General Exposure, illustrate the hazards to which the jurisdiction has the most vulnerability. The Risk Assessment provides focus for the Goals through identification of each jurisdiction’s vulnerability to specific hazards. Based on these hazards, the individual jurisdiction identified their specific mitigation measures. The mitigation measures are broken down into four categories depending on the implementation mechanism. These are shown on each jurisdiction’s Mitigation Strategy Matrix. The measures are prioritized within each category. The first category is Startup. The Startup category for all jurisdictions includes existing mitigation actions and plan maintenance. Both are automatic with adoption of each plan. The second category is Hazard Mitigation Forum (HMF). This includes each jurisdiction’s membership as part of the Pierce County Hazard Mitigation Forum, a group composed of all County jurisdictions that have an accepted mitigation plan. The third category is Jurisdiction Specific and delineates who will oversee pushing forward with each separate mitigation project. The fourth group includes all Public Education programs that the jurisdiction would like to develop. Each mitigation measure included has a short write up consisting of 11 points. They are: • • • • • • • • • • •
Name of the Measure; The Hazards the measure addresses; A paragraph explaining what the measure includes; The Goals addressed; The Cost of the Measure; Funding source and situation; The Lead Jurisdiction and/or Agency; Timeline for implementation; Who or What benefits; Life of the Measure; and Community Reaction.
PAGE 5-4 REGION 5 ALL HAZARD MITIGATION PLAN – 2020-2025 EDITION BASE PLAN
Section 6 Infrastructure Requirements Assessing Vulnerability: Identifying Structures---Requirement §201.6(c)(2) (ii)(A): The plan should describe vulnerability in terms of the types and numbers of existing and future buildings, infrastructure, and critical facilities located in the identified hazard areas. • •
Does the new or updated plan describe vulnerability in terms of the types and numbers of existing buildings, infrastructure, and critical facilities located in the identified hazard areas? Does the new or updated plan describe vulnerability in terms of the types and numbers of future buildings, infrastructure, and critical facilities located in the identified hazard areas?
Assessing Vulnerability: Estimating Potential Losses---Requirement §201.6(c)(2) (ii)(B): The plan should describe vulnerability in terms of an] estimate of the potential dollar losses to vulnerable structures identified in paragraph (c)(2)(i)(A) of this section and a description of the methodology used to prepare the estimate. • •
Does the new or updated plan estimate potential dollar losses to vulnerable structures? Does the new or updated plan describe the methodology used to prepare the estimate?
PAGE 6-1 REGION 5 ALL HAZARD MITIGATION PLAN – 2020-2025 EDITION BASE PLAN
SECTION 6 REGION 5 ALL HAZARD MITIGATION PLAN 2015-2020 EDITION INFRASTRUCTURE SECTION Table of Contents INFRASTRUCTURE REQUIREMENTS .......................................................................1 TABLE OF CONTENTS ...........................................................................................2 INFRASTRUCTURE SECTION FORMAT ....................................................................3 PUBLIC DISCLOSURE ............................................................................................3
PAGE 6-2 REGION 5 ALL HAZARD MITIGATION PLAN – 2020-2025 EDITION BASE PLAN
The infrastructure portion of the jurisdictions plans is an optional component. It was decided that in order to make the individual plans more comprehensive, a survey of the infrastructure and an evaluation of the hazards threatening that infrastructure would be beneficial.
Infrastructure Section Format The individual jurisdictions’ infrastructure sections are a series of summary tables that show the relationship between the infrastructure and the jurisdiction. The tables include: •
An Infrastructure Summary giving the number of pieces of infrastructure and their value.
•
An Infrastructure Category Summary that summarizes the primary Homeland Security Segment that the pieces of infrastructure fall under.
•
An Infrastructure Vulnerability Dependency Summary that shows how many of the pieces of infrastructure are dependent on Emergency Services, Power, Sewer, Telecommunication, Transportation and Water.
•
An Infrastructure Vulnerability Hazard Summary that looks at the number of pieces of infrastructure that the hazards can impact.
•
An Infrastructure Dependency Matrix that shows the individual jurisdictions or agencies that support the individual jurisdiction.
•
An Infrastructure Matrix showing the individual pieces of infrastructure, some of their attributes and their vulnerability to the various natural hazards addressed in the Plan.
Public Disclosure The infrastructure sections of the various plans are considered exempt from public disclosure pursuant to RCW 42.56.420. Each jurisdiction has assigned an individual or group of individuals to review any requests for information on the infrastructure lists to determine if it is prudent to release the information.
PAGE 6-3 REGION 5 ALL HAZARD MITIGATION PLAN – 2020-2025 EDITION BASE PLAN
(This page intentionally left blank)
PAGE 6-4 REGION 5 ALL HAZARD MITIGATION PLAN – 2020-2025 EDITION BASE PLAN
Section 7 Plan Maintenance Procedures Requirements Monitoring, Evaluating, and Updating the Plan---Requirement §201.6(c)(4)(i): [The plan maintenance process shall include a] section describing the method and schedule of monitoring, evaluating, and updating the mitigation plan within a five-year cycle. •
Does the new or updated plan describe the method and schedule for monitoring the plan, including the responsible department? • Does the new or updated plan describe the method and schedule for evaluating the plan, including how, when and by whom (i.e. the responsible department)? • Does the new or updated plan describe the method and schedule for updating the plan within the five-year cycle? Incorporation into Existing Planning Mechanisms---Requirement §201.6(c)(4) (ii): [The plan shall include a] process by which local governments incorporate the requirements of the mitigation plan into other planning mechanisms such as comprehensive or capital improvement plans, when appropriate… •
Does the new or updated plan identify other local planning mechanisms available for incorporating the mitigation requirements of the mitigation plan? • Does the new or updated plan include a process by which the local government will incorporate the mitigation strategy and other information contained in the plan (e.g., risk assessment) into other planning mechanisms, when appropriate? • Does the updated plan explain how the local government incorporated the mitigation strategy and other information contained in the plan (e.g., risk assessment) into other planning mechanisms, when appropriate? Continued Public Involvement---Requirement §201.6(c)(4) (iii): [The plan maintenance process shall include a] discussion on how the community will continue public participation in the plan maintenance process. •
Does the new or updated plan explain how continued public participation will be obtained? (For example, will there be public notices, an on-going mitigation plan committee, or annual review meetings with stakeholders?)
PAGE 7-1 REGION 5 ALL HAZARD MITIGATION PLAN – 2020-2025 EDITION BASE PLAN
SECTION 7 REGION 5 ALL HAZARD MITIGATION PLAN 2020-2025 EDITION PLAN MAINTENANCE PROCEDURES Table of Contents PLAN MAINTENANCE PROCEDURES REQUIREMENTS ......................................................1 TABLE OF CONTENTS ...................................................................................................2 PLAN ADOPTION...........................................................................................................3 MAINTENANCE STRATEGY ............................................................................................3 IMPLEMENTATION ................................................................................................................................... 4 PLAN EVALUATION AND UPDATE ................................................................................................................. 4
CONTINUED PUBLIC INVOLVEMENT ..............................................................................4
PAGE 7-2 REGION 5 ALL HAZARD MITIGATION PLAN – 2020-2025 EDITION BASE PLAN
The plan update process undertaken by the 76 jurisdictions during the last 18 months continues the foundation of breaking the disaster cycle by planning for a disaster resistant Region 5. This section details the individual jurisdictions’ formal processes that will guarantee their plans remain active and relevant. The individual Plan Maintenance Sections include a description of each jurisdiction’s documentation citing the Plan's formal adoption by their jurisdiction. The Section also describes: the method and schedule of monitoring, evaluating, and updating within the required five-year cycle; the process for incorporating the mitigation strategy into existing mechanisms, and; the process for integrating public participation throughout the plan maintenance. The section also serves as a guide for implementation of the hazard mitigation strategy. The Plan Maintenance Section is divided into three separate parts: 1. Plan Adoption 2. Maintenance Strategy 3. Continued Public Involvement.
Plan Adoption The Plan Adoption portion discusses how the individual plans will be submitted for pre-adoption review to Washington State Emergency Management Division (EMD). The EMD has 30 days to then take action on the Plan and forward it to the Federal Emergency Management Agency (FEMA) Region X for review. This review, which is allowed 45 days by law, will address the federal criteria outlined in FEMA Interim Final Rule 44 CFR Part 201.6. In completing this review there may be revisions requested by the EMD and/or FEMA. Revisions could include changes to background information, editorial comments, and the alteration of technical content. Pierce County Department of Emergency Management (PCDEM) will call a Planning Team Meeting to address any revisions needed and then resubmit the changes. Once the Plan has passed the Pre-Adoption Review, each jurisdiction has an individual or lead and a group that is responsible for adopting the plan. Once the Plan is adopted the jurisdiction will be responsible for submitting it, with a copy of the formal adoption, to the State Hazard Mitigation Officer at the Washington State EMD. EMD will then take action on the Plan and forward it to FEMA Region X for final approval. Upon approval by FEMA, the jurisdiction will gain eligibility for both Hazard Mitigation Grant Program and Pre-Disaster Mitigation Grant Program funds. Appendix A will list the dates and include a copy of the signed Resolution from the jurisdiction as well as a copy of the FEMA approval of the jurisdiction’s Plan. In future updates of the Plan, Appendix C will be used to track changes and/or updates. This plan will have to be re-adopted and re-approved prior to the five-year deadline of November 22, 2025.
Maintenance Strategy The Maintenance Strategy delineated in each jurisdiction’s Plan has a method for implementing, monitoring and evaluating the Plan. It provides a structure that encourages collaboration, information transference and innovation. Through a multi-tiered implementation method, each jurisdiction will provide its citizens a highly localized approach to loss reduction while serving their PAGE 7-3 REGION 5 ALL HAZARD MITIGATION PLAN – 2020-2025 EDITION BASE PLAN
needs through coordinated policies and programs. The method’s emphasis on all levels of participation promotes public involvement and adaptability to changing risks and vulnerabilities. Finally, it will provide a tangible link between citizens and the various levels of government service, ranging from community action to the Department of Homeland Security. Through this strategy, each jurisdiction will achieve a more disaster resistant community.
Implementation In order to ensure efficient and effective implementation, each jurisdiction will make use of its capabilities, infrastructure, and dedicated population. Individual jurisdictions will implement their mitigation strategies over the next five years dependent upon what capabilities they have identified. Each jurisdiction has identified a person or group to oversee the implementation process. In addition, once each plan is adopted the jurisdiction automatically becomes part of the Hazard Mitigation Forum. The Hazard Mitigation Forum is comprised of a representative from all jurisdictions in Pierce County that have an adopted and approved hazard mitigation plan. The Forum will serve as a coordinating body for projects of a multi-jurisdictional nature and will provide a mechanism to share success and increase cross jurisdiction cooperation.
Plan Evaluation and Update Each jurisdiction must reevaluate and update their plan at a minimum every 5 years. Depending on the jurisdiction some have decided to reevaluate it every year, and many have decided to put it on a two- or three-year cycle. Most of the jurisdictions will do a full review and rewrite every 5 years, even if they have done a partial review at an earlier time. Each jurisdiction is also required to do a review of their plan following each disaster. This review is to see what mitigation measures might be added as a result of the disaster and will be separate from the normal review schedule. At the end of five years, each jurisdiction must re-submit the Plan to the State and FEMA with any updates. This process will be coordinated by PCDEM through the Pierce County Hazard Mitigation Forum. In 2025, and every five years following, jurisdictions will submit the updated plan to PCDEM. PCDEM’s Mitigation and Recovery Program Coordinator will collect updates from the Region 5 Plan jurisdictions and submit them to the State EMD and FEMA
Continued Public Involvement Part of the Plan review is continued public involvement in review and updates of the Plan. Therefore prior to submitting the Plan to WA EMD and FEMA for the five-year review, the jurisdictions will hold public information and comment meetings. These meetings will provide the public a forum during which citizens can express their concerns, opinions, or ideas about the jurisdictions’ Plans. These meetings will be advertised through a variety of media relevant to the individual community.
PAGE 7-4 REGION 5 ALL HAZARD MITIGATION PLAN – 2020-2025 EDITION BASE PLAN
APPENDIX A REGION 5 ALL HAZARD MITIGATION PLAN 2020-2025 EDITION ACRONYM LIST
Acronym AC ACE ADA AED AP APA ARC ASCE ASDSO ATC-20 BCP BIA BLM BLR BP BPA BSSC C CDMG CEMP CERT CF CFR CFS CIG COG COOP COPS CPC CPFR CPR CRS CTED
Description Asbestos Cement Army Corps of Engineers Americans with Disabilities Act Automated External Defibrillator Auxiliary Power American Planning Association American Red Cross American Society of Civil Engineers Association of State Dam Safety Officials Applied Technology Council – Procedures for Post-earthquake Safety Evaluation of Buildings Business Continuity Plan Bureau of Indian Affairs Bureau of Land Management Buildable Lands Report Before Present (Before 1950) Bonneville Power Administration Building Seismic Safety Council Critical California Division of Mines and Geology Comprehensive Emergency Management Plan Community Emergency Response Teams Cubic Feet Code of Federal Regulations Cubic Feet per Second Climate Impact Group Continuity of Government Continuity of Operations Plan Community Oriented Policing Services Climate Prediction Center Central Pierce Fire & Rescue Cardio-pulmonary Resuscitation Community Rating System Community Trade and Economic Development APPENDIX A-1 REGION 5 ALL HAZARD MITIGATION PLAN – 2020-2025 EDITION BASE PLAN
Acronym CVO D DART DEM DHP DMA DNR DOE DR DSR E EAS EMD EMP EMS EMT EOC EPA ERP F FAST Corridor FAST FEMA FHBM FIRES FIRM FIS FMA FSAC GEES GETS GHMWC GIS GISS GPS HAP HIRL HIRA HLS HMEP HMF HMGP
Description Cascade Volcano Observatory Drought Disaster Assistance Response Team Department of Emergency Management Disaster Housing Program Disaster Mitigation Act Department of Natural Resources Department of Ecology Disaster Declaration Number Damage Survey Reports Earthquake Emergency Alert System Emergency Management Division Emergency Management Plan Emergency Medical Services Emergency Medical Technician Emergency Operations Center Environmental Protection Agency Emergency Response Plan Flood Freight Action Strategy for the Everett-Seattle-Tacoma Corridor Functional Assessment Service Teams - Pierce County Federal Emergency Management Agency Flood Hazard Boundary Map Finance, Insurance, Real Estate and Services Flood Insurance Rate Map Fidelity National Information Services (Flood Services) Flood Mitigation Assistance Program Forest Service Avalanche Center Geotechnical Earthquake Engineering Server Government Emergency Telecommunications Graham Hill Mutual Water Company Geographic Information Systems Goddard Institute for Space Studies Global Positioning Systems Housing Assistance Program High Incident Response Level Hazard Identification and Risk Assessment Homeland Security Hazardous Materials Emergency Preparedness (Grant) Hazard Mitigation Forum Hazard Mitigation Grant Program APPENDIX A-2 REGION 5 ALL HAZARD MITIGATION PLAN – 2020-2025 EDITION BASE PLAN
Acronym HSGP HVAC ICS IFGP IFPL IMT IPCC JISAO KPN KPS KVA L LID LIDAR M MM MOU/MOA MRNP MRSC Ms MSDS MSH Mw NA or N/A NCEF NDMC NEHRP NESDIS NET NFDRS NFP NFIP NFPA NGDC NIMS NOAA NOPP NPDES NPS NRC NSIDC NSGP NSSL
Description Homeland Security Grant Program Heating, Ventilation & Air Conditioning Incident Command System Individual and Family Grants Program Industrial Fire Precaution Levels Incident Management Team Intergovernmental Panel on Climate Change Joint Institute for the Study of the Atmosphere & Ocean Key Peninsula North Key Peninsula South Kilo Volt – Amps Landslide Local Improvement District Light Detection and Ranging Magnitude Manmade (to include terrorism) Memorandum of Understanding/Memorandum of Agreement Mount Rainier National Park Municipal Research Services Center (of Washington) Surface Wave Magnitude Material Safety Data Sheet Mount St. Helens Moment Magnitude Not Applicable or Not Available National Clearinghouse for Educational Facilities National Drought Mitigation Center National Earthquake Hazards Reduction Program National Environmental Satellite, Data and Information Services Neighborhood Emergency Teams National Fire Danger Rating System National Fire Plan National Flood Insurance Program National Fire Protection Association National Geophysical Data Center National Incident Management System National Oceanic and Atmospheric Association National Oceanographic Partnership Program National Pollutant Discharge Elimination System National Park Service National Research Council National Snow and Ice Data Center Nonprofit Security Grants Program National Severe Storms Laboratory APPENDIX A-3 REGION 5 ALL HAZARD MITIGATION PLAN – 2020-2025 EDITION BASE PLAN
Acronym NWAC NWS OAR OCB OCS OFM ONA OPSG OWSC PALS PC PCFD PC-NET PCSD PD PDM PPD-8 PDSI PLU PMEL PNSN PNW Ppm PSAP PSCORT PSE PSGP PSRC PTA PW RCW S SCADA SBA SFHA SHSP SIC SOP SPCC SR SW T TAC
Description Northwest Avalanche Center National Weather Service Oceanic and Atmospheric Research Ocean Conveyor Belt Oregon Climate Service Office of Financial Management Other Needs Assistance Operation Stonegarden Office of the Washington State Climatologist Planning and Land Services Pierce County Pierce County Fire District Pierce County Neighborhood Emergency Teams Pierce County Sheriff Department Police Department Pre-Disaster Mitigation Grant Program Presidential Policy Directive / PPD-8: National Preparedness Palmer Drought Severity Index Pacific Lutheran University Pacific Marine Environmental Laboratory Pacific Northwest Seismic Network Pacific Northwest Parts per million Public Safety Answering Point Pierce County Search & Operation Teams Puget Sound Energy Port Security Grant Program Puget Sound Regional Council (FAST Corridor consolidated in the PSRC) Parent Teacher Association Project Worksheets Revised Code of Washington Shelter Supervisory, Command & Data Acquisition Small Business Association Special Flood Hazard Area State Homeland Security Program Standard Industrial Classification Standard Operating Procedure Spill Prevention, Control & Countermeasure State Route Severe Weather Tsunami Tactical Unit APPENDIX A-4 REGION 5 ALL HAZARD MITIGATION PLAN – 2020-2025 EDITION BASE PLAN
Acronym TBD TIME TMR TPCHD TSGP U/I UASI UCAR UGA UNFCCC USDA USFA USFS USGS UWPCC V VAC VIPS WABO WAC WCI WDFW WESC WMA WRCC WRH WRIA WSDOT WSP WUI WW
Description To Be Determined Tsunami Inundation Mapping Efforts Tacoma Mountain Rescue Tacoma Pierce County Health Department Transit Security Grant Program Urban Interface Urban Areas Security Initiative University Corporation for Atmospheric Research Undeveloped Geographical Area United Nations Framework Convention on Climate Control United States Department of Agriculture United States Fire Administration United States Forest Service United States Geological Survey University of Washington Program on Climate Change Volcano Volts Alternating Current Volunteers in Police Service Program Washington Association of Building Officials Washington Administrative Code Western Climate Initiative Washington Department of Fish & Wildlife Washington Economic Steering Committee Watershed Management Act (of 1998) Western Regional Climate Center Western Region Headquarters (National Weather Service) Water Resource Inventory Area Washington State Department of Transportation Washington State Patrol Wildland/Urban Interface Wastewater
APPENDIX A-5 REGION 5 ALL HAZARD MITIGATION PLAN – 2020-2025 EDITION BASE PLAN
(This page intentionally left blank)
APPENDIX A-6 REGION 5 ALL HAZARD MITIGATION PLAN – 2020-2025 EDITION BASE PLAN
APPENDIX B REGION 5 ALL HAZARD MITIGATION PLAN 2020-2025 EDITION MAPS, FIGURES AND TABLES Geological Hazards Map, Figure or Table Title
Page Number
AVALANCHE Figure 4.1-1 Slab Avalanche
Pg. 4-22
Map 4.1-1 Areas Vulnerable to Avalanche
Pg. 4-24
Table 4.1-1 Pierce County Avalanches of Record
Pg. 4-25
EARTHQUAKE Figure 4.2-1 What is an Earthquake?
Pg. 4-29
Figure 4.2-2 Types of Earthquakes
Pg. 4-30
Map 4.2-1 Pierce County Earthquake Sources
Pg. 4-31
Map 4.2-2 Seattle and Tacoma Fault Segments
Pg. 4-34
Map 4.2-3 Magnitude 6.9 Scenario Earthquake – Tacoma Fault Zone
Pg. 4-36
Map 4.2-4 Magnitude 7.2 Scenario Earthquake – Seattle Fault Zone
Pg. 4-37
Map 4.2-5 Magnitude 9.3 Scenario Earthquake – Cascadia Megathrust
Pg. 4-38
Map 4.2-6 Pierce County Liquefaction Susceptibility
Pg. 4-40
Map 4.2-7 Major Pacific Northwest Earthquakes
Pg. 4-41
Table 4.2-1 Notable Earthquakes Felt in Pierce County
Pg. 4-41
Figure 4.2-3 Salmon Beach, Tacoma Washington – Following Feb. 2001 Earthquake Figure 4.2-4 Liquefaction, Niigata Japan 1964
Pg. 4-45
Figure 4.2-5 Lateral Spreading – March 2001
Pg. 4-48
Figure 4.2-6 Bridge Seismic Screening Tool (BSST) Projected Reopening Times of Highway Bridges in WA After the CSZ Scenario LANDSLIDE
Pg. 4-52
Figure 4.3-1 Northeast Tacoma – Landslide 01/2007
Pg. 4-55
APPENDIX B-1 REGION 5 ALL HAZARD MITIGATION PLAN – 2020-2025 EDITION BASE PLAN
Pg. 4-48
Geological Hazards Map, Figure or Table Title
Page Number
Figure 4.3-2 Pierce County Landslide Deposits, Scarps and Flanks, and Susceptibility Table 4.3-1 Landslide Facts for Pierce County – Shallow Landslide Susceptibility Map 4.3-1 Pierce County Deep Landslide Hazard Area
Pg. 4-57
Map 4.3-2 Pierce County Shallow Landslide Hazard Area
Pg. 4-59
Map 4.3-3 Pierce County Slope Stability Areas
Pg. 4-60
Figure 4.3-3 Pierce County Comparison of Landslide Susceptible Areas
Pg. 4-61
Table 4.3-2 Notable Landslides in Pierce County
Pg. 4-62
Figure 4.3-4 Ski Park Road – Landslide 1/31/03
Pg. 4-63
Figure 4.3-5 SR 165 Bridge Along Carbon River – Landslide 2/1996
Pg. 4-64
Figure 4.3-6 Aldercrest Drive – Landslide 1-1999
Pg. 4-65
Pg. 4-57 Pg. 4-58
TSUNAMI Figure 4.4-1 Hawaii 1957 – Residents Explore Ocean Floor Before Tsunami
Pg. 4-67
Figure 4.4-2 Hawaii 1949 – Wave Overtakes a Seawall
Pg. 4-68
Figure 4.4-3 Tsunamis in Washington State
Pg. 4-70
Map 4.4-1 Seattle and Tacoma Faults
Pg. 4-71
Figure 4.4-4 Tsunami Inundation and Current Based on Earthquake Scenario
Pg. 4-73
Table 4.4-1 Notable Tsunamis in Pierce County
Pg. 4-75
Figure 4.4-5 Salmon Beach, Pierce County, 1949 – Tsunamigenic Subaerial Landslide Figure 4.4-6 Damage in Tacoma from the 1894 Tsunami
Pg. 4-76 Pg. 4-78
VOLCANIC Figure 4.5-1 Volcanic Hazards
Pg. 4-83
Table 4.5-1 Tephra Types and Sizes
Pg. 4-85
Map 4.5-1 Lahars, Lava Flows, and Pyroclastic Hazards of Mt. Rainier
Pg. 4-87
Table 4.5-2 Estimated Lahar Travel Times for Lahars 10(7) to 10(8) Cubic
Pg. 4-89
Map 4.5-2 Probability of Measurable Ashfall in Tacoma from Rainier
Pg. 4-90
Map 4.5-3 Mt. Rainier Identified Tephra, last 10,000 years
Pg. 4-91
Table 4.5-4 Pierce County River Valley Debris Flow History
Pg. 4-92
APPENDIX B-2 REGION 5 ALL HAZARD MITIGATION PLAN – 2020-2025 EDITION BASE PLAN
Meteorological Hazards Map, Figure or Table Title
Page Number
CLIMATE CHANGE Figure 4.6-1 IPCC Models on Global Temperature Change: 1900 to 2100
Pg. 4-106
Table 4.6-1 Recent and Projected Temperatures for the Pacific Northwest
Pg. 4-108
Figure 4.6-2 Puget Sound Projected Warming
Pg. 4-109
Figure 4.6-3 Puget Sound Projected Precipitation Change
Pg. 4-110
Figure 4.6-4 Puyallup River: Projected Change in Monthly Hydrograph
Pg. 4-111
Figure 4.6-5 Projected Decline in Snowpack
Pg. 4-112
Table 4.6-2 Projected Sea Level Risk: Tacoma
Pg. 4-113
Figure 4.6-6 Sea Level Risk Inundation Area in 2100 Tacoma Tideflats
Pg. 4-113
Figure 4.6-7 Climate Impacts and Natural Hazards
Pg. 4-116
Figure 4.6-8 Comparison of the South Cascade Glacier: 1928 to 2003
Pg. 4-120
Figure 4.6-9 Lower Nisqually Glacier Retreat: 1912 to 2001
Pg. 4-121
DROUGHT Figure 4.7-1 Sequence of Drought Impacts
Pg. 4-124
Table 4.7-1 Palmer Drought Severity Index
Pg. 4-125
Map 4.7-1 Pierce County Watersheds
Pg. 4-126
Figure 4.7-2 % Area Basin in Drought Conditions Since 1895
Pg. 4-127
Map 4.7-2 % of Time in Severe to Extreme Drought: 1895-1995
Pg. 4-128
Map 4.7-3 % of Time in Severe to Extreme Drought: 1985-1995
Pg. 4-128
Table 4.7-3 Notable Droughts Affecting Pierce County
Pg. 4-129
Figure 4.7-3 National Drought Mitigation Center Drought Impact Reporter
Pg. 4-131
Map 4.7-4 Columbia River Basin
Pg. 4-132
Map 4.7-5 USDA Climate Zones – Washington State
Pg. 4-136
FLOOD Map 4.8-1 Lower Puyallup River
Pg. 4-143
Table 4.8-1 Historical Flooding in Lower Puyallup River
Pg. 4-144
Table 4.8-2 Levees and Revetments in the Lower Puyallup River
Pg. 4-146
Table 4.8-3 Summary of Damages to Lower Puyallup River Facilities (19962017)
Pg. 4-147
APPENDIX B-3 REGION 5 ALL HAZARD MITIGATION PLAN – 2020-2025 EDITION BASE PLAN
Meteorological Hazards Map, Figure or Table Title
Page Number
Map 4.8-2 Middle Puyallup River
Pg. 4-149
Table 4.8-4 Historical Flooding in Middle Puyallup River
Pg. 4-150
Table 4.8-5 Levees and Revetments in the Middle Puyallup River
Pg. 4-152
Table 4.8-6 Summary of Damages to Middle Puyallup River Facilities (19962017) Map 4.8-3 Upper Puyallup River
Pg. 4-153-156 Pg. 4-158
Table 4.8-7 Historical Flooding in Upper Puyallup River
Pg. 4-159
Table 4.8-8 Levees and Revetments in the Upper Puyallup River
Pg. 4-161
Table 4.8-9 Summary of Damages to Upper Puyallup River Facilities (19962017) Map 4.8-4 Lower White River Table 4.8-10 Historical Flooding in Lower White River Table 4.8-11 Levees and Revetments in the Lower White River
Pg. 4-162-170 Pg. 4-172 Pg. 4-173 Pg. 4-174-175
Table 4.8-12 Summary of Damages to Lower White River Facilities (19962017) Map 4.8-5 Upper White River
Pg. 4-176
Table 4.8-13 Historical Flooding in Upper White River
Pg. 4-179
Table 4.8-14 Levees and Revetments in the Upper White River
Pg. 4-180
Table 4.8-15 Summary of Damages to Upper White River Facilities (19962017) Map 4.8-6 Greenwater River
Pg. 4-181-
Table 4.8-16 Historical Flooding in Greenwater River
Pg. 4-184
Map 4.8-7 Carbon River
Pg. 4-187
Table 4.8-17 Historical Flooding in Carbon River
Pg. 4-188
Table 4.8-18 Levees and Revetments in the Carbon River
Pg. 4-190
Table 4.8-19 Summary of Damages to Carbon River Facilities (1996-2017)
Pg. 4-178
Pg. 4-183
Pg. 4-190-198
Map 4.8-8 South Prairie Creek
Pg. 4-200
Table 4.8-20 Historical Flooding in South Prairie Creek
Pg. 4-201
Map 4.8-9 Middle Nisqually River
Pg. 4-204
Table 4.8-21 Historical Flooding in Middle Nisqually River
Pg. 4-205
Map 4.8-10 Upper Nisqually River
Pg. 4-208
APPENDIX B-4 REGION 5 ALL HAZARD MITIGATION PLAN – 2020-2025 EDITION BASE PLAN
Meteorological Hazards Map, Figure or Table Title
Page Number
Table 4.8-22 Historical Flooding in Upper Nisqually River
Pg. 4-209
Table 4.8-23 Summary of Damages to Upper Nisqually River Facilities (19902017) Map 4.8-11 Mashel River
Pg. 4-210
Table 4.8-24 Historical Flooding on Mashel River
Pg. 4-214
Figure 4.8-1 Nov. 2006 Flooding River Park Estates – Along Puyallup River
Pg. 4-216
Pg. 4-213
SEVERE WEATHER Table 4.9-1 Fujita Tornado Damage Scale
Pg. 4-224
Figure 4.9-1 Windstorm Tracks
Pg. 4-226
Map 4.9-1 Pierce County Severe Weather Wind Hazard – South Wind Event
Pg. 4-227
Map 4.9-2 Pierce County Severe Weather Wind Hazard – East Wind Event
Pg. 4-228
Table 4.9-2 Notable Severe Weather in Pierce County
Pg. 4-229-231
Figure 4.9-2 Snowstorm 01/2004 Downtown Tacoma
Pg. 4-233
Figure 4.9-3 Satellite Image – Hanukkah Eve Windstorm
Pg. 4-234
Figure 4.9-4 Before/After Tornado Damage Greensburg, KS 05/04/07
Pg. 4-236
Figure 4.9-5 Tacoma Narrows Bridge – November 7, 1940 Windstorm
Pg. 4-239
Figure 4.9-6 County Road December 2006 Windstorm
Pg. 4-241
WILDLAND URBAN INTERFACE FIRE Map 4.10-1 Washington State Fire Hazard Map
Pg. 4-247
Map 4.10-2 Industrial Fire Precaution Level Shutdown Zones
Pg. 4-248
Figure 4.10-1 Carbon Copy Fire August 2006
Pg. 4-249
Map 4.10-3 Washington State DNR Wildland Fire Statistics: 1973-2018
Pg. 4-251
Table 4.10-1 DNR Wildland Response South Puget Sound Region: 2010-2019
Pg. 4-252
Map 4.10-4 Pierce County Fire Occurrences 2010-2019
Pg. 4-253
Table 4.10-2 Pierce, King and Snohomish County Fires
Pg. 4-254
APPENDIX B-5 REGION 5 ALL HAZARD MITIGATION PLAN – 2020-2025 EDITION BASE PLAN
Technological Hazards Map, Figure, or Table Title
Page Number ABANDONED MINES
Figure 4.11-1 Warning Sign Posted at Mine Entrance
Pg. 4-259
Table 4.11-1 Some Pierce County Named Coal Mines
Pg. 4-260
Figure 4.11-2 Lady Wellington Mine Tipple
Pg. 4-261
Map 4.11-1 Mine Hazard Areas of Pierce County
Pg. 4-262
Figure 4.11-3 Pacific Coast Coal Mine Tipple, Carbonado
Pg. 4-264
ACTIVE THREAT / ATTACK TACTICS Figure 4.12-1 250 Active Shooter Incidents in the US from 2000-2017: Incidents per Year
Pg. 4-270
Figure 4.12-2 250 Active Shooter Incidents in the US from 2000-2017: Casualty Breakdown by Year
Pg. 4-271
Figure 4.12-3 250 Active Shooter Incidents in the US from 2000-2017: Location Categories
Pg. 4-272
Table 4.12-1 Occurrences in the Puget Sound
Pg. 4-274
CIVIL DISTURBANCE Map 4.13-1 Civil Disturbance High Probability Locations
Pg. 4-281
Map 4.13-2 Civil Disturbance High Probability Locations Zoomed In
Pg. 4-282
CYBER ATTACK Table 4.14-1 Reported Incidents in the US between late 2010 to early 2013
Pg. 4-289
DAM FAILURE Figure 4.15-1 Reasons for Dam Failures Nationally
Pg. 4-293
Table 4.15-1 Pierce County Dams that Pose a High or Significant Risk to the Public Map 4.15-1 Pierce County High and Significant Risk Dams
Pg. 4-295
Table 4.15-2 Select Dam Failures in Washington State
Pg. 4-299
Figure 4.15-2 Mud Mt. Dam Intake
Pg. 4-300
Pg. 4-298
ENERGY EMERGENCY Figure 4.16-1 The Carrier Lexington Providing Electricity to the City of Tacoma EPIDEMIC/PANDEMIC APPENDIX B-6 REGION 5 ALL HAZARD MITIGATION PLAN – 2020-2025 EDITION BASE PLAN
Pg. 4-307
Figure 4.17-1 Individuals Hoping to Avoid Contacting Disease
Pg. 4-318
HAZARDOUS MATERIALS Table 4.18-1 List of constituents or ingredients found in Bakken crude oil
Pg. 4-321
Table 4.18-2 Environmental Protection Agency’s Identified Top Five Facilities Figure 4.18-1 Exxon Valdez Oil Spill, 1989
Pg. 4-322
Table 4.18-3 Pierce County Spill Data from May 2018 to May 2019
Pg. 4-324
Figure 4.18-2 Dalco Passage Oil Spill Clean Up
Pg. 4-326
Pg. 4-323
PIPELINE EMERGENCY Table 4.19-1 Cities & Towns with Interstate Pipelines within, or within 1 Mile of City Limits Map 4.19-1 Pierce County Pipelines
Pg. 4-330
Figure 4.19-1 Whatcom Falls Park, 2003
Pg. 4-335
Pg. 4-332
TERRORISM Not applicable TRANSPORTATION ACCIDENTS Table 4.21-1 Airports in Pierce County
Pg. 4-345
Table 4.21-2 Ferry Service in Pierce County
Pg. 4-347
Table 4.21-3 Transportation Accidents/Catastrophic Failures in Pierce County
Pg. 4-348
APPENDIX B-7 REGION 5 ALL HAZARD MITIGATION PLAN – 2020-2025 EDITION BASE PLAN
(This page intentionally left blank)
APPENDIX B-8 REGION 5 ALL HAZARD MITIGATION PLAN – 2020-2025 EDITION BASE PLAN
APPENDIX C REGION 5 ALL HAZARD MITIGATION PLAN 2020-2025 EDITION GLOSSARY
A Anthropogenic – Resulting from human influence on nature. Aquifer – An underground layer of water permeable rock or unconsolidated material, like sand or gravel, from which ground water can be extracted. Attenuate – To lessen, the amount, force, magnitude or value of something. In the case of earthquake waves it has to do with their decrease in size and energy as they progress out from the Focus over time and distance.
B Benioff Zone – A deep active seismic area within a subducting plate; also called Benioff-Wadati Zone or Wadati-Benioff Zone. Biotic Zone – An area easily defined by the similar plants and animals living throughout it. Brownout – A period of lowered illumination from reduced electrical distribution when demand exceeds a utility’s ability to respond to that demand.
C Clastic – Rock composed of fragments of older rocks. Climate Change – A generic term, that refers to the variations in weather, on either regional or global scales, over time. Cordilleran Ice Sheet – The large ice sheet that covered much of North America and expanded south from British Columbia into Western Washington around 15,000 years ago, extending south into Thurston County. See Fraser Glaciation. Cornice – A mass of snow projecting over a ridge. Coseismic Subsidence – Subsidence happening simultaneously with an earthquake. Coseismic Uplift – Surface uplift happening simultaneously with an earthquake. Critical Facilities – Those facilities, or portions of the infrastructure, that must be continually maintained for the preservation of the community. APPENDIX C-1 REGION 5 ALL HAZARD MITIGATION PLAN – 2020-2025 EDITION BASE PLAN
D Deltaic – Relating to or having aspects of a delta. Disaster – The impact on a community of one or more hazards that outstrips the community’s ability to cope with injury, death, property damage, or disruption to essential functions. It is the intersection of a hazard with the human environment that produces a disaster. Drift – The general term for unconsolidated sediment transported by glaciers and deposited directly on land or in the sea. Duff - Partially and fully decomposed organic matter on forest floor.
E Epicenter – The point on the earth’s surface directly over an earthquake’s Focus.
F FEMA Region X – FEMA Administrative Region consisting of the states of Alaska, Idaho, Oregon and Washington. Focus – The point along a fault where an earthquake first occurs. Fraser Glaciation – The period of extensive glacial advance, retreat and readvance into the Puget lowlands, lasting approximately 10,000 years and ending around 11,000 years ago. See Cordilleran Ice Sheet. Fuel Moisture Content – The quantity of moisture in the fuel expressed as a percent of the overall oven dried weight.
G Glacial Outburst Flood – A sudden release of water that was impounded within the confines of a glacier, causing a debris flow. These are not usually of great size. Glacial Outwash – Stratified material, generally composed of sand and gravel, carried away from a glacier by the meltwater stream and deposited at some point downstream. Graupel – Granular snow pellets, also called soft hail.
H Hazard – A condition, natural or technological, that has the potential to threaten human life and property. HLS Region 5 – See Homeland Security Region 5. Hoarfrost - A deposit of interlocking ice crystals (hoar crystals) formed on objects, which have a surface sufficiently cooled, mostly by nocturnal radiation, to cause the direct sublimation of the water vapor contained in the ambient air. In the case of hoarfrost development on the surface of a
APPENDIX C-2 REGION 5 ALL HAZARD MITIGATION PLAN – 2020-2025 EDITION BASE PLAN
hillside covered by previously fallen snow, it can form a very weak layer that when covered by a new layer of snow may increase the tendency for the slope to avalanche. Homeland Security Region 5 – The geographic area of Pierce County. Hydrothermal Alteration – The process where water percolating down through cracks in volcanic rock is heated to steam, becomes a weak sulfuric acid solution that then begins to change the chemical composition of the rock, transforming it into clay. Hyperconcentrated Stream Flow – An intermediate level between a normal stream flow and a debris flow. They are flows with a sediment load usually ranging between 4% and 60% by volume or 10% and 80% by weight.
I Interplate – The processes that occur on the boundary area between two tectonic plates. Intraplate – Occurring within a tectonic plate. Infrastructure – The underlying physical structure that supports a community and maintains the community’s quality of life.
L Lapilli – Tephra ranging in size from 2 to 64 millimeters in size. Lateral Spreading – Essentially a landslide that occurs on very shallow or level slopes due to the horizontal movement of the ground surface from liquefaction. See Liquefaction. Liquefaction – The tendency for soft soils, especially with a high water content, to soften further or liquefy, with ground shaking so as to be unable to support structures built on them. Water within the soils is frequently expressed to the surface and may form small boils of sand or mud. Liquefiable Soils – Soil types that tend to soften or lose structural integrity with ground shaking. See Liquefaction.
M Magmatic – Relating to magma. In the case of volcanoes Magmatic Events are eruption related events. Magnitude – A measure of size. To measure the size of an earthquake a number of Magnitude Scales are used. These include, among others, the Richter scale, the Body Wave Magnitude Scale and the Moment Magnitude Scale. Each one measures a different portion of an earthquake. The Moment Magnitude Scale is the closest to measuring an earthquakes size because it measures the actual energy released by the earthquake. Mitigation – Those actions taken to reduce or eliminate the long-term risk to people, property, the social infrastructure, or the environment from hazards and their effects.
APPENDIX C-3 REGION 5 ALL HAZARD MITIGATION PLAN – 2020-2025 EDITION BASE PLAN
N Natural Hazard – Hazards that are part of the natural environment.
O Ocean Conveyor Belt - The global recirculation of water masses that determines today’s climate.
P Peak Ground Acceleration – Measurement of ground acceleration created by earthquake waves as a percent of gravity. Acceleration is usually along all three axes, albeit at different rates. Pluton – A body of igneous rock formed beneath the surface of the earth by the consolidation and cooling of magma. Pre-Adoption Review – A review of a plan by the Washington State Emergency Management Division and FEMA to correct any errors or omissions prior to local adoption. Probability of Exceedance – The percentage chance that something will occur more frequently than at a specified level. For example a 2% Probability of Exceedance for a specific peak ground acceleration in 10 years means that there is a 1 in 50 chance that there will be an earthquake strong enough to cause higher peak ground acceleration than the specified level during a ten year period. Private Sector – Those portions of the community that are owned, controlled or funded by individuals or businesses. Public Sector – Those portions of the community that are controlled and/or funded by the community at large.
Q Quaternary (Period) – A geologic period and is divided into two epochs: the Pleistocene (2.588 million years ago to 11.7 thousand years ago) and the Holocene (11.7 thousand years ago to today).
R Region 5 – See Homeland Security Region 5. Repetitive Loss Properties – A classification under the National Flood Insurance Program of properties that flood multiple times. Revetment – The armoring by placing a stone facing on an embankment to prevent erosion. Rise – The % increase in steepness of a slope compared with the horizontal. Risk – The probability that any physical, structural or socioeconomic element will be damaged, destroyed or lost to a natural technological or socially derived hazard.. Risk is a combination of the susceptibility (vulnerability) of a jurisdiction and its infrastructure, assets, citizens or environment from a particular threat (hazard) and the potential effects (consequences) if that threat materializes.
APPENDIX C-4 REGION 5 ALL HAZARD MITIGATION PLAN – 2020-2025 EDITION BASE PLAN
Robert T. Stafford Disaster relief and Emergency Assistance Act as Amended – The federal legislation that constitutes the statutory authority for most Federal disaster response activities, especially as they pertain to FEMA and FEMA programs.
S Saltation – On snowfields, the tendency for particles to be picked up and bounced along the surface by the wind. Section 322 – That section of the Stafford Act outlining the requirements that state and local mitigation plans must follow if they wish to be eligible for federal mitigation monies. Seiche - An oscillating water wave in an enclosed or partially enclosed body of water. Serac – A large ice block or pinnacle in a glacier formed at the intersection of two or more crevasses. Since they form on steep convex slopes they tend to be very unstable and frequently collapse. Stafford Act – See Robert T. Stafford Disaster relief and Emergency Assistance Act as Amended. Subaerial Landslide – A landslide located above the still water line of a lake or other body of water. The term is generally used in connection with tsunamis generated by landslides entering a body of water. Subduction – The process where one tectonic plate slides under another. Sublimation - The transition of a substance from the solid phase directly to the vapor phase, or vice versa, without passing through an intermediate liquid phase. Submarine Landslide – A landslide located below the still water line of a lake or other body of water. Subsidence – A sinking of the land.
T Tectonic Plate – Any of a number of large pieces of the earths crust that slowly moves, or slides, independent of other pieces, across the earth’s mantle. Tephra – Airborne volcanic ejecta of any size. Tertiary (Period) – An interval of geologic time, lasting from 65 to c.2 million years ago. Till – Glacially deposited unstratified material consisting of sand, clay, gravel and boulders mixed together. Tsunami – A wave caused by an unusual disturbance of the water, usually caused by an earthquake, landslide or undersea volcanic eruption. Turbulent Suspension – The picking up from the ground and suspension of snow particles in the air by the continued upward movement of air near the surface.
APPENDIX C-5 REGION 5 ALL HAZARD MITIGATION PLAN – 2020-2025 EDITION BASE PLAN
V Volcanoclastic – A clastic rock containing volcanic fragments. Vulnerability – The susceptibility of a jurisdiction, its assets, infrastructure, citizens or environment to damage, destruction, or incapacitation from a particular hazard.
W Water Purveyor – A utility, either public or private, that acts as a water distribution source for a select community or geographic area. Waterspout – A tornado that is on a body of water. WUI Fire (Wildland/Urban Interface Fire) - A fire located in a geographic area with a mixture of human developed land combined with natural vegetative fuels such as forest or grassland.
APPENDIX C-6 REGION 5 ALL HAZARD MITIGATION PLAN – 2020-2025 EDITION BASE PLAN