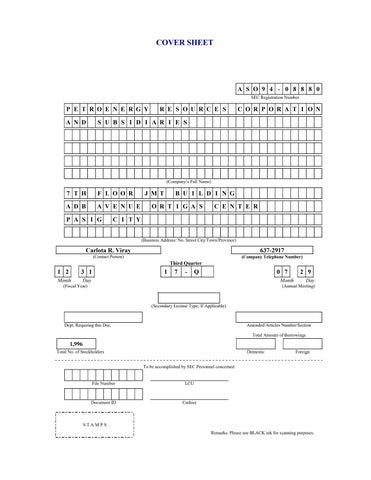
COVER SHEET
A S O 9 4 - 0 8 8 8 0 SEC Registration Number
P E T R O E N E R G Y A N D
R E S O U R C E S
C O R P O R A T I O N
S U B S I D I A R I E S
(Company’s Full Name)
7 T H
F L O O R
A D B
A V E N U E
P A S I G
J M T
B U I L D I N G
O R T I G A S
C E N T E R
C I T Y (Business Address: No. Street City/Town/Province)
Carlota R. Viray
637-2917
(Contact Person)
(Company Telephone Number)
Third Quarter
1 2
3 1
Month
Day
1
7
-
Q
0 7
2 9
Month
(Fiscal Year)
Day
(Annual Meeting)
(Secondary License Type, If Applicable)
Dept. Requiring this Doc.
Amended Articles Number/Section Total Amount of Borrowings
1,996 Total No. of Stockholders
Domestic
Foreign
To be accomplished by SEC Personnel concerned
File Number
LCU
Document ID
Cashier
STAMPS Remarks: Please use BLACK ink for scanning purposes.
-2-
SECURITIES AND EXCHANGE COMMISSION SEC FORM 17-Q QUARTERLY REPORT PURSUANT TO SECTION 11 OF THE SECURITIES REGULATION CODE (SRC) AND SRC RULE 17(a)-1(b) (2) THEREUNDER 1.
30 September 2021 For the quarterly period ended
2.
SEC Identification Number ASO94-08880
4.
PetroEnergy Resources Corporation Exact name of registrant as specified in its charter
5.
Manila, Philippines Province, country or other jurisdiction of incorporation
7.
7th Floor JMT Condominium, ADB Avenue, Pasig City Address of principal office
8.
(632) 637-2917 Registrant’s telephone number, including area code
9.
Not Applicable Former name, former address and former fiscal year, if changed since last report
10.
Securities registered pursuant to Sections 8 and 12 of the Code, or Section 4 and 8 of the RSA Title of Each Class
3. BIR Tax Identification No. 004-471-419-000
6. (SEC Use Only) Industry Classification Code: 1605 Postal Code
Number of Shares of Common Stock Outstanding
Common (par value of P1.00/share)
568,711,842
Amount of Debt Outstanding = P =5,367,078,997 11.
Are any or all of the securities listed on the Philippine Stock Exchange? All issued and outstanding common shares are listed in the Philippine Stock Exchange.
12.
Indicate by check mark whether the registrant: a.
has filed all reports required to be filed by Section 11 of the Securities Regulation Code(SRC) and SRC Rule 11(a)-1 thereunder and Sections 26 and 141 of the Corporation Code of the Philippines, during the preceding 12 months (or for such shorter period the registrant was required to file such reports) Yes [ /]
b.
has been subject to such filing requirements for the past 90 days Yes [/ ]
-3TABLE OF CONTENTS Page no. PART I
FINANCIAL INFORMATION
Item 1. Financial Statements 1. Consolidated Statements of Financial Position As of September 30, 2021, September 30, 2020 and December 31, 2020 2. Consolidated Statements of Income For the quarter ended September 30, 2021 and September 30, 2020 3. Consolidated Statements of Comprehensive Income For the quarter ended September 30, 2021 and September 30, 2020 4. Consolidated Statement of Changes in Equity As of September 30, 2021, September 30, 2020 and December 31, 2020 5. Consolidated Statement of Cash flows As of September 30, 2021, September 30, 2020 and December 31, 2020 6. Notes to Unaudited Financial Statements
4 5 6 7 8 9 - 64
Item 2. Management Discussion and Analysis of Financial Condition and Results of Operations 1. Financial Position – September 30, 2021 and December 31, 2020 2. Results of Operations – For the quarter ended September 30, 2021 and September 31, 2020 3. Financial Position – September 30, 2021 and September 30, 2020 4. Results of Operations - For the nine months ending September 30, 2021 and September 30, 2020 5. Key performance indicators 6. Discussion of Indicators of the Company’s Level of Performance 7. Disclosure in view of the current global financial crisis. 8. Operations review and business outlook
66 - 67 68 - 69 70 - 72 73 - 74 75 76 76 77 - 79
PART II OTHER INFORMATION OTHER SUPPLEMENTARY SCHEDULES Supplementary Information and disclosures required on SRC Rule 68 Schedule of Financial Soundness Indicators Reconciliation of Retained Earnings Available for Dividend Declaration Report on Stock Rights Offering Map of relationships of companies within the group SIGNATURES
80 - 81 82 83 84 85 86
-4PETROENERGY RESOURCES CORPORATION AND SUBSIDIARIES UNAUDITED CONSOLIDATED STATEMENTS OF FINANCIAL POSITION (Amounts in Philippine Peso)
Unaudited
Unaudited
Audited
30-Sep-21
30-Sep-20
31-Dec-20
₱1,469,978,900 7,481,373 287,773,409 16,494,144 983,149,822 2,764,877,648
₱1,219,938,699 6,357,069 284,083,842 5,986,142 930,859,120 2,447,224,872
₱1,267,332,044 7,531,587 273,571,895 35,090,324 697,022,710 2,280,548,560
8,054,159,544 226,022,135 140,876,302 1,700,100,039 369,127,997 5,743,599 1,611,533 377,419,180 10,875,060,329 ₱13,639,937,977
8,398,965,198 195,410,978 1,584,311,420 385,768,345 12,711,363 1,611,533 468,567,332 11,047,346,169 ₱13,494,571,041
8,310,613,046 210,533,496 132,687,182 1,635,213,444 383,032,125 5,651,825 1,611,533 445,434,294 11,124,776,945 ₱13,405,325,505
Current Liabilities Accounts payable and accrued expenses Loans payable - current Lease liability-current Income tax payable Total Current Liabilities
₱422,649,419 874,773,107 39,823,778 8,599,357 1,345,845,661
₱358,104,664 1,149,652,979 16,588,113 8,340,341 1,532,686,097
₱367,581,709 855,279,695 15,393,725 7,973,817 1,246,228,946
Noncurrent Liabilities Loans payable - non current Lease liability- non current Asset retirement obligation
3,591,412,306 286,211,607 115,705,448
3,853,552,855 318,854,915 91,183,236
3,872,924,261 320,057,378 109,159,679
Other non-current liability Total Noncurrent Liabilities Total Liabilities
27,903,975 4,021,233,336 5,367,078,997
14,999,908 4,278,590,914 5,811,277,011
26,037,526 4,328,178,844 5,574,407,790
568,711,842 2,156,679,049 2,220,289,846 80,049,238 (9,663,958) (456,727) 114,499,681 5,130,108,971 2,553,185,059 7,683,294,030 ₱13,494,571,041
568,711,842 2,156,679,049 2,337,064,060 80,049,238 (8,924,964) (263,445) 114,499,681 5,247,815,461 2,583,102,254 7,830,917,715 ₱13,405,325,505
ASSETS Current Assets Cash and cash equivalents Financial assets at fair value through profit and loss (FVPL) Receivables Crude oil inventory Advances, prepaid expenses and other current assets Total Current Assets Noncurrent Assets Property and equipment-net Deferred oil exploration cost Contract assets Investment in Associate Right of use of asset Deferred tax assets-net Investment properties-net Other non-current assets Total Noncurrent Assets TOTAL ASSETS LIABILITIES AND EQUITY
Equity Attributable to equity holders of the Parent Company Capital stock Additional paid- in capital Retained earnings Equity reserve Remeasurement loss on define benefit obligation Share in other comprehensive income of a Joint Venture Cumulative translation adjustment Noncontrolling interest Total Equity TOTAL LIABILITIES AND EQUITY
568,711,842 2,156,679,049 2,660,524,005 80,049,238 (8,924,964) (263,445) 114,499,681 5,571,275,406 2,701,583,574 8,272,858,980 ₱13,639,937,977
-5PETROENERGY RESOURCES CORPORATION AND SUBSIDIARIES UNAUDITED CONSOLIDATED STATEMENTS OF INCOME (Amounts in Philippine Peso) Unaudited 30-Sep-21 For the 3rd Quarter
30-Sep-20 To date
For the 3rd Quarter
To date
REVENUES
583,508,377
1,741,709,510
549,122,193
1,709,367,724
COST OF SALES
301,415,107
858,750,325
276,139,426
893,885,093
GROSS INCOME
282,093,270
882,959,185
272,982,767
815,482,631
37,927,263
118,062,707
35,840,090
113,091,605
(83,050,428) 3,192,779 2,566,082 4,098,028 (877,892)
(252,791,612) 64,886,595 7,599,031 4,732,221 (2,593,340)
(96,814,416) (21,240,659) 2,120,187 (1,837,601) (1,021,235)
(294,556,054) 20,579,116 16,324,161 (2,693,137) (3,114,379)
122,571 3,437,493 (70,511,367)
(50,214) 8,147,631 (170,069,688)
(5,797) 2,883,974 (115,915,547)
(1,883,027) 7,496,354 (257,846,966)
GENERAL AND ADMINISTRATIVE EXPENSES OTHER INCOME (CHARGES) Interest expense Share in net income of an Associate Interest income Net unrealized foreign exchange gain (loss) Accretion expense Net unrealized gain (loss) on fair value changes on financial assets at FVPL Miscellaneous income (charges)
INCOME BEFORE INCOME TAX PROVISION FOR (BENEFIT FROM) INCOME TAX NET INCOME
173,654,640 15,735,201 ₱157,919,439
594,826,790 50,411,925 ₱544,414,865
121,227,130 6,609,521 ₱114,617,609
444,544,060 27,060,045 ₱417,484,015
NET INCOME ATTRIBUTABLE TO: Equity Holders of the Parent Company Noncontrolling interest NET INCOME
89,005,417 68,914,022 ₱157,919,439
323,459,945 220,954,920 ₱544,414,865
41,334,506 73,283,103 ₱114,617,609
202,638,207 214,845,808 ₱417,484,015
0.1565
0.5688
0.0620
0.2836
EARNINGS PER SHARE FOR NET INCOME ATTRIBUTABLE TO EQUITY HOLDERS OF THE PARENT COMPANY- BASIC AND DILUTED
-6PETROENERGY RESOURCES CORPORATION AND SUBSIDIARIES UNAUDITED CONSOLIDATED STATEMENTS OF COMPREHENSIVE INCOME (Amounts in Philippine Peso) Unaudited 30-Sep-21 For the 3rd To date Quarter NET INCOME
₱157,919,439
30-Sep-20 For the 3rd To date Quarter
₱544,414,865
₱114,617,609
₱417,484,015
OTHER COMPREHENSIVE INCOME (LOSS) Item to be reclassified to profit or loss in subsequent periods Movements in cumulative translation adjustment - net of tax Item not to be reclassified to profit or loss in subsequent periods Remeasurement gains on net accrued retirement liability - net of tax Share in other comprehensive income of a joint venture TOTAL OTHER COMPREHENSIVE INCOME (LOSS) 157,919,439 TOTAL COMPREHENSIVE INCOME
544,414,865
114,617,609
417,484,015
TOTAL COMPREHENSIVE INCOME (LOSS) ATTRIBUTATBLE TO: Equity Holders of the Parent Company 89,005,417 Noncontrolling interest 68,914,022 TOTAL COMPREHENSIVE INCOME 157,919,439
323,459,945 220,954,920 544,414,865
41,334,506 73,283,103 114,617,609
202,638,207 214,845,808 417,484,015
-
-
-
-7PETROENERGY RESOURCES CORPORATION AND SUBSIDIARIES UNAUDITED CONSOLIDATED STATEMENTS OF CHANGES IN EQUITY (In Philippine Peso)
CAPITAL STOCK Authorized capital Issued and outstanding Balance beginning of year Issuance during the period Total issued and outstanding
Unaudited
Unaudited
Audited
30-Sep-21
30-Sep-20
31-Dec-20
700,000,000 568,711,842 568,711,842
568,711,842 -
568,711,842 -
568,711,842 -
568,711,842
568,711,842
568,711,842
2,156,679,049
2,156,679,049
2,156,679,049
ADDITIONAL PAID-IN CAPITAL Balance beginning of year Additions during the period UNAPPROPRIATED RETAINED EARNINGS Balance at beginning of year Net Income
REMEASUREMENT OF NET ACCRUED RETIREMENT LIABILITY Balance at beginning of year Remeasurement gain (loss) on accrued retirement liability
-
-
-
2,156,679,049
2,156,679,049
2,156,679,049
2,337,064,060 323,459,945
2,017,651,639 202,638,207
2,017,651,639 319,412,421
2,660,524,005
2,220,289,846
2,337,064,060
(8,924,964) -
(9,663,958) -
(9,663,958) 738,994
(8,924,964)
(9,663,958)
(8,924,964)
(263,445)
(456,727)
(456,727)
SHARE IN OCI OF A JOINT VENTURE Balance at beginning of year Share in other comprehensive income of a Joint Venture
(263,445)
CUMULATIVE TRANSLATION ADJUSTMENT Balance at beginning of year Movement of cumulative translation adjustment
PARENT'S OTHER EQUITY RESERVES
TOTAL EQUITY ATTRIBUTED TO EQUITY HOLDERS OF PARENT NONCONTROLLING INTEREST Balance at beginning of year Net income Remeasurement loss on defined benefit obligation Share in other comprehensive income of a Joint Venture Cash dividends
TOTAL EQUITY
-
193,282
(456,727)
(263,445)
114,499,681 -
114,499,681 -
114,499,681 -
114,499,681
114,499,681
114,499,681
80,049,238
80,049,238
80,049,238
5,571,275,406
5,130,108,971
5,247,815,461
2,583,102,254 220,954,920 (102,473,600)
2,338,339,252 214,845,807 -
2,338,339,252 326,778,799 (2,537,273) 21,476 (79,500,000)
2,701,583,574
2,553,185,059
2,583,102,254
8,272,858,980
7,683,294,030
7,830,917,715
-8PETROENERGY RESOURCES CORPORATION UNAUDITED CONSOLIDATED STATEMENTS OF CASHFLOWS (Amounts in Philippine Peso) Unaudited 30-Sep-2021 For the 3rd Quarter
Unaudited 30-Sep-2020 For the 3rd Quarter
To date
Audited
To date
31-Dec-20
CASH FLOWS FROM OPERATING ACTIVITIES Income before income tax
173,654,640
594,826,790
121,227,130
444,544,060
688,052,932 386,788,348
Adjustments for: 83,050,428
252,791,612
96,814,416
294,556,054
125,862,952
386,437,583
126,480,634
384,382,074
529,123,431
Share in net income (loss) of joint venture
(3,192,779)
(64,886,595)
21,240,659
(20,579,116)
(111,266,383)
Net unrealized foreign exchange loss (gain)
(4,098,028)
(4,732,221)
1,837,601
2,693,137
816,741
-
-
14,667,316
Interest expense Depletion, depreciation and amortization
Provision for probable losses Write-off of deferred development costs Accretion expense Dividend income Gain on sale of property, plant and equipment Net loss (gain) on fair value changes on financial assets at fair value through profit or loss Interest income Movement in accrued retirement liability Operating income before working capital changes
-
-
-
-
-
-
5,959,962
877,892
2,593,340
1,021,235
3,114,379
4,129,022
(1,700) -
(38,100) (590,392)
(387,857)
(71,700)
(71,770)
(664,643)
(662,857)
(122,571)
50,214
5,797
1,883,027
708,509
(2,566,082)
(7,599,031)
(2,120,187)
(16,324,161)
(18,362,302)
-
-
-
-
(3,018,565)
373,464,752
1,158,853,200
366,119,428
1,093,533,111
1,496,864,384
93,337,183
(14,123,878)
76,162,585
47,878,630
59,857,904
-
-
(132,687,182)
Decrease (increase) in: Receivables Contract Assets Input VAT Other current assets Increase in Accounts payable and accrued expenses Cash generated from (used in) operations
-
-
1,995,792
116,734,785
1,480,706
30,205,667
2,915,446
(254,874,031)
(267,530,932)
19,766,069
(33,227,668)
10,638,198
8,002,628
(2,141,502)
(20,571,463)
50,182,093
56,274,625
221,926,324
991,791,673
442,957,325
1,188,571,833
1,493,863,375
2,318,616
7,521,395
2,716,273
17,251,312
19,280,794
Income taxes paid, including movement in CWT
(21,465,579)
(49,786,385)
(9,125,691)
(22,738,838)
(33,966,707)
Net cash provided by (used in) operating activities
202,779,361
949,526,683
436,547,907
1,183,084,307
1,479,177,462
(31,422,104)
(97,358,762)
(46,548,223)
(187,936,673)
(219,209,060)
Interest received
CASH FLOWS FROM INVESTING ACTIVITIES Acquisitions of property, plant and equipment Acquisitions of intangibles (Increase)/decrease in Other noncurrent assets Withdrwal from (Contribution to) restricted cash (Increase)/decrease in deferred oil exploration costs (Increase)/decrease in deferred development costs
(12,067,282) (3,196,709)
(76,039,074) (15,488,639)
-
-
(2,102,105)
4,948,196
310,257
3,577,849
(175,249,276)
(164,547,807)
8,272,283
(33,125,437)
(39,915,658) (3,210,454)
-
-
1,235
(3,190,356)
-
Proceeds from: disposals of property, plant and equipment Dividends received Net cash used in investing activities
-
999,484
387,857
664,643
825,000
1,700
38,100
-
71,700
40,071,770
(46,684,395)
(187,848,891)
(387,753,673)
(219,962,658)
150,000,000
776,349,462
(208,187,928)
CASH FLOWS FROM FINANCING ACTIVITIES Proceeds from: Availments of loans
-
78,500,000
-
Payments of: Loans Interest Dividends to Non-Controlling Interest Lease liabilities Increase in other noncurrent liabilities Net cash provided by financing activities EFFECT OF FOREIGN EXCHANGE RATE CHANGES ON CASH AND CASH EQUIVALENTS NET INCREASE (DECREASE) IN CASH AND CASH EQUIVALENTS CASH AND CASH EQUIVALENTS, BEGINNING CASH AND CASH EQUIVALENTS, END
(355,674,675)
(2,150,000)
(464,931,818)
(1,369,699,350)
(15,594,174)
(178,334,269)
(15,635,089)
(307,048,570)
(348,317,765)
(102,473,600)
(102,473,600)
-
-
(1,822,140)
(1,319,939)
(25,687,508)
(79,500,000) (36,596,442)
(8,772,576)
(7,819,128)
8,460,970
10,910,558
(126,840,350)
(567,623,812)
(10,644,058)
(636,757,338)
(1,057,764,095)
-
7,339,512
8,592,876
(3,433,461)
(5,332,674)
(816,742)
36,594,128
202,646,856
214,282,460
153,240,622
200,633,967
1,433,384,772 1,469,978,900
1,267,332,044 1,469,978,900
1,005,656,239 1,219,938,699
1,066,698,077 1,219,938,699
1,066,698,077 1,267,332,044
-9-
PETROENERGY RESOURCES CORPORATION AND SUBSIDIARIES NOTES TO CONSOLIDATED FINANCIAL STATEMENTS 1. Corporate Information a. Organization PetroEnergy Resources Corporation (“PERC” or “PetroEnergy” or the “Parent Company”) is a publicly-listed domestic corporation. Its registered office and principal place of business is 7th Floor, JMT Building, ADB Avenue, Ortigas Center, Pasig City. PERC was organized on September 29, 1994 as Petrotech Consultants, Inc. to provide specialized technical services to its then parent company, Petrofields Corporation, and to companies exploring for oil in the Philippines. In 1997, PERC simultaneously adopted its present name and changed its primary purpose to oil exploration and development and mining activities. Subsequently in 1999, PERC assumed Petrofields’ oil exploration contracts in the Philippines and the Production Sharing Contract covering the Etame discovery block in Gabon, West Africa. On August 11, 2004, PERC’s shares of stock were listed at the Philippine Stock Exchange (PSE) by way of introduction. In 2009, following the enactment of Republic Act No. 9513, otherwise known as the “Renewable Energy Act of 2008” (RE Law), PERC amended its articles of incorporation to include among its purposes the business of generating power from renewable sources such as, but not limited to, biomass, hydro, solar, wind, geothermal, ocean and such other renewable sources of power. On March 31, 2010, PERC incorporated PetroGreen Energy Corporation (“PetroGreen” or “PGEC”), its 90%-owned subsidiary, to act as its renewable energy arm and holding company. PGEC ventured into renewable energy development and power generation through its subsidiaries and affiliate: (a) Maibarara Geothermal, Inc. (“MGI”, 65%-owned) - owner and Renewable Energy (RE) developer of the 20 MW Maibarara Geothermal Power Project (MGPP-1) in Santo Tomas, Batangas and its expansion, the 12 MW MGPP-2; (b) PetroSolar Corporation (“PetroSolar”, 56%owned) - owner and RE developer of the 50 MWDC Tarlac Solar Power Project (TSPP-1) in Tarlac City and its 20 MWDC expansion (TSPP-2); and (c) PetroWind Energy, Inc. (“PetroWind”, 40%owned associate) - owner and developer of the 36 MW Nabas Wind Power Project (NWPP-1) in Nabas and Malay, Aklan. MGI and PetroSolar are effectively indirect subsidiaries of PetroEnergy through PetroGreen. PetroGreen owns majority of the voting power of MGI and PetroSolar. PetroEnergy, PetroGreen, MGI and PetroSolar are collectively referred to as the “Group” and were incorporated in the Philippines. b. Nature of Operations The Group’s four (4) main energy businesses are: (a) upstream oil exploration and development, and power generation from renewable energy resources such as, (b) geothermal, (c) solar, and (d) wind, through the Group’s affiliate, PetroWind.
- 10 Upstream Oil Exploration and Development Petroleum production is on-going in the Etame (Gabon) concession, while the other petroleum concessions in the Philippines are still in the advanced exploration stages or pre-development stages. Geothermal Energy The geothermal projects are the 20 MW MGPP-1 in Sto. Tomas, Batangas that started commercial operations on February 8, 2014 and its expansion, the 12 MW MGPP-2 that started commercial operations on April 30, 2018. Solar Energy The Solar power projects are the 50 MWDC TSPP-1 in Tarlac City, Tarlac that started commercial operations on February 10, 2016 and its 20 MWDC expansion (TSPP-2) which has been commissioned and tested on April 22, 2019 and is now awaiting the issuance of a Certificate of Compliance (COC) from the Energy Regulatory Commission (ERC). Wind Energy The wind energy project is the 36-MW NWPP-1 in Nabas, Aklan, where PetroWind has a wind farm. It started its commercial operations on June 10, 2015. c.
Approval of Consolidated Financial Statements The accompanying consolidated financial statements were approved and authorized for issue by the Board of Directors (BOD).
2. Basis of Preparation Basis of Preparation The accompanying consolidated financial statements have been prepared under the historical cost basis, except for financial assets carried at fair value through profit or loss (FVTPL) which are measured at fair value and crude oil inventory which is valued at net realizable value (NRV). The financial statements are presented in Philippine Peso (PHP or P =), which is the Parent Company’s functional currency. All amounts are rounded to the nearest PHP unless otherwise stated. Statement of Compliance The accompanying consolidated financial statements have been prepared in compliance with Philippine Financial Reporting Standards (PFRS). 3. Changes in Accounting Policies The accounting policies adopted are consistent with those of the previous financial year, except that the Group has adopted the following new accounting pronouncements starting January 1, 2021. Adoption of these pronouncements did not have any significant impact on the Group’s financial position or performance.
- 11
Amendments to PFRS 9, PFRS 7, PFRS 4 and PFRS 16, Interest Rate Benchmark Reform Phase 2 The amendments provide the following temporary reliefs which address the financial reporting effects when an interbank offered rate (IBOR) is replaced with an alternative nearly risk-free interest rate (RFR): • Practical expedient for changes in the basis for determining the contractual cash flows as a result of IBOR reform • Relief from discontinuing hedging relationships • Relief from the separately identifiable requirement when an RFR instrument is designated as a hedge of a risk component The Group shall also disclose information about: • The about the nature and extent of risks to which the entity is exposed arising from financial instruments subject to IBOR reform, and how the entity manages those risks; and • Their progress in completing the transition to alternative benchmark rates, and how the entity is managing that transition The amendments are effective for annual reporting periods beginning on or after January 1, 2021 and apply retrospectively, however, the Group is not required to restate prior periods.
Pronouncements issued but not yet effective are listed below. The Group does not expect that the future adoption of the said pronouncements to have a significant impact on its financial statements. Effective beginning on or after January 1, 2022
Amendments to PFRS 3, Reference to the Conceptual Framework The amendments are intended to replace a reference to the Framework for the Preparation and Presentation of Financial Statements, issued in 1989, with a reference to the Conceptual Framework for Financial Reporting issued in March 2018 without significantly changing its requirements. The amendments added an exception to the recognition principle of PFRS 3, Business Combinations to avoid the issue of potential ‘day 2’gains or losses arising for liabilities and contingent liabilities that would be within the scope of PAS 37, Provisions, Contingent Liabilities and Contingent Assets or Philippine-IFRIC 21, Levies, if incurred separately. At the same time, the amendments add a new paragraph to PFRS 3 to clarify that contingent assets do not qualify for recognition at the acquisition date. The amendments are effective for annual reporting periods beginning on or after January 1, 2022 and apply prospectively.
Amendments to PAS 16 , Plant and Equipment: Proceeds before Intended Use The amendments prohibit entities deducting from the cost of an item of property, plant and equipment, any proceeds from selling items produced while bringing that asset to the location and condition necessary for it to be capable of operating in the manner intended by management. Instead, an entity recognizes the proceeds from selling such items, and the costs of producing those items, in profit or loss. The amendment is effective for annual reporting periods beginning on or after January 1, 2022 and must be applied retrospectively to items of property, plant and equipment made available for use
- 12 on or after the beginning of the earliest period presented when the entity first applies the amendment. The amendments are not expected to have a material impact on the Group.
Amendments to PAS 37, Onerous Contracts - Costs of Fulfilling a Contract The amendments specify which costs an entity needs to include when assessing whether a contract is onerous or loss-making. The amendments apply a “directly related cost approach”. The costs that relate directly to a contract to provide goods or services include both incremental costs and an allocation of costs directly related to contract activities. General and administrative costs do not relate directly to a contract and are excluded unless they are explicitly chargeable to the counterparty under the contract. The amendments are effective for annual reporting periods beginning on or after January 1, 2022. The amendments are not expected to have a material impact on the Group.
Annual Improvements to PFRSs 2018-2020 Cycle • Amendments to PFRS 1, First-time Adoption of Philippines Financial Reporting Standards, Subsidiary as a first-time adopter The amendment permits a subsidiary that elects to apply paragraph D16(a) of PFRS 1 to measure cumulative translation differences using the amounts reported by the parent, based on the parent’s date of transition to PFRS. This amendment is also applied to an associate or joint venture that elects to apply paragraph D16(a) of PFRS 1. The amendment is effective for annual reporting periods beginning on or after January 1, 2022 with earlier adoption permitted. The amendments are not expected to have a material impact on the Group. •
Amendments to PFRS 9, Financial Instruments, Fees in the ’10 per cent’ test for derecognition of financial liabilities The amendment clarifies the fees that an entity includes when assessing whether the terms of a new or modified financial liability are substantially different from the terms of the original financial liability. These fees include only those paid or received between the borrower and the lender, including fees paid or received by either the borrower or lender on the other’s behalf. An entity applies the amendment to financial liabilities that are modified or exchanged on or after the beginning of the annual reporting period in which the entity first applies the amendment. The amendment is effective for annual reporting periods beginning on or after January 1, 2022 with earlier adoption permitted. The Group will apply the amendments to financial liabilities that are modified or exchanged on or after the beginning of the annual reporting period in which the entity first applies the amendment. The amendments are not expected to have a material impact on the Group.
•
Amendments to PAS 41, Agriculture, Taxation in fair value measurements The amendment removes the requirement in paragraph 22 of PAS 41 that entities exclude cash flows for taxation when measuring the fair value of assets within the scope of PAS 41.
- 13 An entity applies the amendment prospectively to fair value measurements on or after the beginning of the first annual reporting period beginning on or after January 1, 2022 with earlier adoption permitted. The amendments are not expected to have a material impact on the Group. Effective beginning on or after January 1, 2023 Amendments to PAS 1, Classification of Liabilities as Current or Non-current The amendments clarify paragraphs 69 to 76 of PAS 1, Presentation of Financial Statements, to specify the requirements for classifying liabilities as current or non-current. The amendments clarify: • What is meant by a right to defer settlement • That a right to defer must exist at the end of the reporting period • That classification is unaffected by the likelihood that an entity will exercise its deferral right • That only if an embedded derivative in a convertible liability is itself an equity instrument would the terms of a liability not impact its classification The amendments are effective for annual reporting periods beginning on or after January 1, 2023 and must be applied retrospectively. The Group is currently assessing the impact the amendments will have on current practice and whether existing loan agreements may require renegotiation.
PFRS 17, Insurance Contracts PFRS 17 is a comprehensive new accounting standard for insurance contracts covering recognition and measurement, presentation and disclosure. Once effective, PFRS 17 will replace PFRS 4, Insurance Contracts. This new standard on insurance contracts applies to all types of insurance contracts (i.e., life, non-life, direct insurance and re-insurance), regardless of the type of entities that issue them, as well as to certain guarantees and financial instruments with discretionary participation features. A few scope exceptions will apply. The overall objective of PFRS 17 is to provide an accounting model for insurance contracts that is more useful and consistent for insurers. In contrast to the requirements in PFRS 4, which are largely based on grandfathering previous local accounting policies, PFRS 17 provides a comprehensive model for insurance contracts, covering all relevant accounting aspects. The core of PFRS 17 is the general model, supplemented by: • A specific adaptation for contracts with direct participation features (the variable fee approach) • A simplified approach (the premium allocation approach) mainly for short-duration contracts PFRS 17 is effective for reporting periods beginning on or after January 1, 2023, with comparative figures required. Early application is permitted. The adoption is not applicable to the Group since none of the entities within the Group have activities that are predominantly connected with insurance or issue insurance contracts.
Deferred effectivity Amendments to PFRS 10, Consolidated Financial Statements, and PAS 28, Sale or Contribution of Assets between an Investor and its Associate or Joint Venture The amendments address the conflict between PFRS 10 and PAS 28 in dealing with the loss of control of a subsidiary that is sold or contributed to an associate or joint venture. The amendments clarify that a full gain or loss is recognized when a transfer to an associate or joint venture involves
- 14 a business as defined in PFRS 3. Any gain or loss resulting from the sale or contribution of assets that does not constitute a business, however, is recognized only to the extent of unrelated investors’ interests in the associate or joint venture. On January 13, 2016, the Financial Reporting Standards Council deferred the original effective date of January 1, 2016 of the said amendments until the International Accounting Standards Board (IASB) completes its broader review of the research project on equity accounting that may result in the simplification of accounting for such transactions and of other aspects of accounting for associates and joint ventures. The Group continues to assess the impact of the above new and amended accounting standards and interpretations effective subsequent to 2021 on the Group’s financial statements in the period of initial application. Additional disclosures required by these amendments will be included in the financial statements when these amendments are adopted.
4. Summary of Significant Accounting Policies Basis of Consolidation The consolidated financial statements comprise the financial statements of the Group as at September 30, 2021 and December 31, 2020 and for the six months ended September 30, 2021 and September 30, 2020. The financial statements of the subsidiaries are prepared in the same reporting year as the Group’s, using consistent accounting policies. Below are the Group’s subsidiaries, which are all incorporated in the Philippines, with their respective percentage ownership as of September 30, 2021, December 31, 2020 and September 30, 2020: PetroGreen Percentage share of PetroGreen in its subsidiaries: MGI PetroSolar Navy Road Development Corporation (NRDC) – dormant company
90% 65% 56% 100%
Subsidiaries are entities controlled by PERC. PERC controls an investee if and only if PERC has: a) power over the investee (i.e. existing rights that give it the current ability to direct the relevant activities of the investee); b) exposure, or rights, to variable returns from its involvement with the investee; and c) the ability to use its power over the investee the amount of the investor’s returns. When PERC has less than a majority of the voting or similar rights of an investee, PERC considers all relevant facts and circumstances in assessing whether it has power over an investee, including: a) the contractual arrangement with the other vote holders of the investee; b) rights arising from other contractual arrangements; and c) the Group’s voting rights and potential voting rights. PERC re-assesses whether or not it controls an investee if facts and circumstances indicate that there are changes to one or more of the three elements of control. Consolidations of a subsidiary begins when PERC obtains control over the subsidiary and ceases when PERC loses control of the subsidiary. Assets, liabilities, income and expenses of a subsidiary acquired or disposed of during the year are included in the consolidated statement of comprehensive income from the date PERC gains control
- 15 until the date PERC ceases to control the subsidiary. The consolidated financial statements are prepared using uniform accounting policies for like transactions and other events in similar circumstances. Adjustments where necessary are made to ensure consistency with the policies adopted by the Group. All intra-group balances and transactions, intragroup profits and expenses and gains and losses are eliminated during consolidation. All intra-group balances, transactions, income and expenses and profit and losses are eliminated in full. A change in the ownership interest of a subsidiary, without loss of control, is accounted for as an equity transaction, as transactions with the owners in their capacity as owners. For purchases from noncontrolling interests, the difference between any consideration paid and the relevant share acquired of the carrying value of net assets of the subsidiary is recorded in equity. Gains or losses on disposals to non-controlling interests are also recorded in equity. If the Group loses control over a subsidiary, it:
derecognizes the assets (including goodwill) and liabilities of the subsidiary, the carrying amount of any non-controlling interest and the cumulative translation differences recorded in equity. recognizes the fair value of the consideration received, the fair value of any investment retained and any surplus or deficit in the consolidated statement of comprehensive income. reclassifies the parent’s share of components previously recognized in other comprehensive income (OCI) to the consolidated statement of comprehensive income or retained earnings, as appropriate.
Non-controlling interests are presented separately from the Parent Company’s equity. The portion of profit or loss and net assets in subsidiaries not wholly owned are presented separately in the consolidated statement of comprehensive income and consolidated statement of changes in equity, and within equity in the consolidated statement of financial position. Cash and Cash Equivalents Cash includes cash on hand and in banks. Cash equivalents are short-term, highly liquid investments that are readily convertible to known amounts of cash with original maturities of three (3) months or less from the dates of acquisition and that are subject to an insignificant risk of change in value. Financial Instruments A financial instrument is any contract that gives rise to a financial asset of one entity and a financial liability or equity instrument of another entity. Financial assets - Initial recognition and measurement Financial assets are classified, at initial recognition, as subsequently measured at amortized cost, fair value through other comprehensive income (FVOCI), and FVTPL. The classification of financial assets at initial recognition depends on the financial asset’s contractual cash flow characteristics and the Group’s business model for managing them. The Group initially measures a financial asset at its fair value plus, in the case of a financial asset not at fair value through profit or loss, transaction costs. In order for a financial asset to be classified and measured at amortized cost or fair value through OCI, it needs to give rise to cash flow that are ‘solely payments of principal and interest (SPPI)’ on the principal amount outstanding. This assessment is referred to as the SPPI test and is performed at an instrument level.
- 16 The Group’s business model for managing financial assets refers to how it manages its financial assets in order to generate cash flows. The business model determines whether cash flows will result from collecting contractual cash flows, selling the financial assets, or both. Subsequent measurement For purposes of subsequent measurement, financial assets are classified in four categories:
Financial assets at amortized cost (debt instruments) Financial assets at FVOCI with recycling of cumulative gains and losses (debt instruments) Financial assets designated at FVOCI with no recycling of cumulative gains and losses upon derecognition (equity instruments) Financial assets at FVTPL
The Group has no financial asset classified as financial assets at FVOCI. Financial assets at amortized cost (debt instruments) This category is the most relevant to the Group. The Group measures financial assets at amortized cost if both of the following conditions are met:
the financial asset is held within a business model with the objective to hold financial assets in order to collect contractual cash flows; and the contractual terms of the financial asset give rise on specified dates to cash flows that are solely payments of principal and interest on the principal amount outstanding.
Financial assets at amortized cost are subsequently measured using the effective interest (EIR) method and are subject to impairment. Gains and losses are recognized in profit or loss when the asset is derecognized, modified or impaired. The Group’s financial assets at amortized cost include cash and cash equivalents, receivables, restricted cash and refundable deposits. Financial assets at FVTPL Financial assets at fair value through profit or loss include financial assets held for trading, financial assets designated upon initial recognition at fair value through profit or loss, or financial assets mandatorily required to be measured at fair value. Financial assets are classified as held for trading if they are acquired for the purpose of selling or repurchasing in the near term. Derivatives, including separated embedded derivatives, are also classified as held for trading unless they are designated as effective hedging instruments. Financial assets with cash flows that are not solely payments of principal and interest are classified and measured at fair value through profit or loss, irrespective of the business model. Notwithstanding the criteria for debt instruments to be classified at amortized cost or at fair value through OCI, as described above, debt instruments may be designated at fair value through profit or loss on initial recognition if doing so eliminates, or significantly reduces, an accounting mismatch. Financial assets at fair value through profit or loss are carried in the consolidated statement of financial position at fair value with net changes in fair value recognized in the consolidated statement of profit or loss. This category includes derivative instruments and listed equity investments which the Group had not irrevocably elected to classify at fair value through OCI. Dividends on listed equity investments are also recognized as other income in the consolidated statement of profit or loss when the right of payment has been established.
- 17 The Group’s financial assets at FVTPL includes marketable equity securities and investment in golf club shares. Impairment of financial assets The Group recognizes an allowance for ECLs for all debt instruments not held at FVTPL. ECLs are based on the difference between the contractual cash flows due in accordance with the contract and all the cash flows that the Group expects to receive, discounted at an approximation of the original effective interest rate. The expected cash flows will include cash flows from the sale of collateral held or other credit enhancements that are integral to the contractual terms. ECLs are recognized in two stages. For credit exposures for which there has not been a significant increase in credit risk since initial recognition, ECLs are provided for credit losses that result from default events that are possible within the next 12-months (a 12-month ECL). For those credit exposures for which there has been a significant increase in credit risk since initial recognition, a loss allowance is required for credit losses expected over the remaining life of the exposure, irrespective of the timing of the default (a lifetime ECL). The Group may consider a financial asset to be in default when internal or external information indicates that the Group is unlikely to receive the outstanding contractual amounts in full before taking into account any credit enhancements held by the Group. A financial asset is written off when there is no reasonable expectation of recovering the contractual cash flows. Financial Liabilities - Initial recognition and measurement Financial liabilities are classified, at initial recognition, as financial liabilities at FVTPL, financial liabilities at amortized cost (loans and borrowings) or as derivatives designated as hedging instruments in an effective hedge, as appropriate. All financial liabilities are recognized initially at fair value and, in the case of loans and borrowings and payables, net of directly attributable transaction costs. The Group’s financial liabilities include accounts payable and accrued expenses, excluding statutory liabilities, loans payable and lease liabilities. The Group does not have financial liabilities at FVTPL. Subsequent measurement After initial recognition, interest-bearing loans and borrowings are subsequently measured at amortized cost using the EIR method. Gains and losses are recognized in profit or loss when the liabilities are derecognized as well as through the EIR amortization process. Amortized cost is calculated by taking into account any discount or premium on acquisition and fees or costs that are an integral part of the EIR. The EIR amortization is included as finance costs in the statement of comprehensive income. Derecognition of Financial Assets and Financial Liabilities Financial assets A financial asset (or where applicable, a part of a financial asset or part of a group of similar financial assets) is derecognized when:
the rights to receive cash flows from the asset have expired; the Group retains the rights to receive cash flows from the asset, but has assumed an obligation to pay them in full without material delay to a third party under a “pass-through” arrangement; or the Group has transferred its right to receive cash flows from the asset and either (a) has transferred substantially all the risks and rewards of the asset, or (b) has neither transferred nor retained substantially all the risks and rewards of the asset, but has transferred control of the asset.
- 18 When the Group has transferred its rights to receive cash flows from an asset and has neither transferred nor retained substantially all the risks and rewards of the asset nor transferred control of the asset, the asset is recognized to the extent of the Group’s continuing involvement in the asset. Continuing involvement that takes the form of a guarantee over the transferred asset is measured at the lower of the original carrying amount of the asset and the maximum amount of consideration that the Group could be required to repay. Financial liabilities A financial liability is derecognized when the obligation under the liability is discharged, cancelled or has expired. Where an existing financial liability is replaced by another from the same lender on substantially different terms, or the terms of an existing liability are substantially modified, such an exchange or modification is treated as a derecognition of the original liability and the recognition of a new liability, and the difference in the respective carrying amounts is recognized in profit or loss. Offsetting of Financial Instruments Financial assets and financial liabilities are set off and the net amount is reported in the consolidated statement of financial position if there is a currently enforceable legal right to offset the recognized amounts and there is an intention to settle on a net basis, or to realize the asset and settle the liability simultaneously. Fair Value Measurement Fair value is the price that would be received to sell an asset or paid to transfer a liability in an orderly transaction between market participants at the measurement date. The fair value measurement is based on the presumption that the transaction to sell the asset or transfer the liability takes place either:
In the principal market for the asset or liability, or In the absence of a principal market, in the most advantageous market for the asset or liability.
The principal or the most advantageous market must be accessible to by the Group. The fair value of an asset or a liability is measured using the assumptions that market participants would use when pricing the asset or liability, assuming that market participants act in their economic best interest. The Group uses valuation techniques that are appropriate in the circumstances and for which sufficient data are available to measure fair value, maximizing the use of relevant observable inputs and minimizing the use of unobservable inputs. All assets and liabilities for which fair value is measured or disclosed in the financial statements are categorized within the fair value hierarchy, described as follows, based on the lowest level input that is significant to the fair value measurement as a whole:
Level 1 - Quoted (unadjusted) market prices in active markets for identical assets or liabilities Level 2 - Valuation techniques for which the lowest level input that is significant to the fair value measurement is directly or indirectly observable Level 3 - Valuation techniques for which the lowest level input that is significant to the fair value measurement is unobservable
For assets and liabilities that are recognized in the financial statements on a recurring basis, the Group determines whether transfers have occurred between Levels in the hierarchy by re-assessing categorization (based on the lowest level input that is significant to the fair value measurement as a whole) at the end of each reporting period.
- 19 Crude Oil Inventory Crude oil inventory is stated at NRV at the time of production. NRV is the estimated selling price less cost to sell. The estimated selling price is the market values of crude oil inventory at the time of production. Other Current Assets This account comprises restricted cash, supplies inventory, prepayments and advances to suppliers. Restricted cash is recognized when the Group reserves a portion of its cash to pay loan interest charges and loan principal amortization and when cash is deposited in an escrow fund. Restricted cash that are expected to be used for a period of no more than 12 months after the financial reporting period are classified as current assets, otherwise, these are classified as noncurrent assets. Supplies inventory refers to parts purchased for used in operations. Supplies inventory are stated at the lower of cost or NRV. Cost is determined using the specific identification method. NRV is the current replacement cost of supplies inventory. Prepayments are expenses paid in advance and recorded as asset before these are utilized. The prepaid expenses are apportioned over the period covered by the payment and charged to the appropriate accounts in profit or loss when incurred. Prepayments that are expected to be realized for a period of no more than 12 months after the financial reporting period are classified as current assets, otherwise, these are classified as noncurrent assets. Advances to suppliers are reclassified to the proper asset or expense account and deducted from the supplier’s billings as specified in the provisions of the contract. Property, Plant and Equipment Property, plant and equipment, except for land, are stated at cost less accumulated depletion, depreciation and amortization and any accumulated impairment losses. Land is stated at cost less any accumulated impairment losses. The initial cost of the property, plant and equipment consists of its purchase price, including any import duties, taxes and any directly attributable costs of bringing the assets to its working condition and location for its intended use and abandonment costs. Expenditures incurred after the fixed assets have been put into operation, such as repairs and maintenance, are normally charged to the consolidated statement of comprehensive income in the period in which the costs are incurred. In situations where it can be clearly demonstrated that the expenditures have resulted in an increase in the future economic benefits expected to be obtained from the use of an item of property, plant and equipment beyond its originally assessed standard of performance, the expenditures are capitalized as an additional cost of property, plant and equipment. Depreciation of an item of property, plant and equipment begins when it becomes available for use, i.e., when it is in the location and condition necessary for it to be capable of operating in the manner intended by management. Depreciation ceases at the earlier of the date that the item is classified as held for sale (or included in a disposal group that is classified as held for sale) in accordance with PFRS 5, Non-current Assets Held for Sale and Discontinued Operations, and the date the asset is derecognized. Wells, platforms and other facilities related to oil operations are depleted using the units-of-production method computed based on estimates of proved reserves. The depletion base includes the exploration and development cost of the producing oilfields.
- 20 Land improvements consist of betterments, site preparation and site improvements that ready land for its intended use. These include excavation, non-infrastructure utility installation, driveways, sidewalks, parking lots, and fences. Property, plant and equipment are depreciated and amortized using the straight-line method over the estimated useful lives of the assets as follows: Power plant, FCRS and production wells Office condominium units Land improvements Transportation equipment Office improvements Office furniture and other equipment
Number of Years 25 15 5 4 3 2 to 3
The useful lives and depletion, depreciation and amortization methods are reviewed periodically to ensure that the period and method of depletion, depreciation and amortization are consistent with the expected pattern of economic benefits from items of property, plant and equipment. Construction in progress represents property, plant and equipment under construction and is stated at cost. This includes the cost of construction to include materials, labor, professional fees, borrowing costs and other directly attributable costs. Construction in progress is not depreciated until such time the construction is completed. Fully depreciated assets are retained in the accounts until they are no longer in use and no further depreciation is credited or charged to current operations. When the assets are retired or otherwise disposed of, the cost and the related accumulated depletion, depreciation and amortization and any accumulated impairment losses are removed from the accounts and any resulting gain or loss is recognized in profit or loss. Borrowing Costs Borrowing costs directly attributable to the acquisition, construction or production of an asset that necessarily takes a substantial period of time to get ready for its intended use or sale are capitalized as part of the cost of the asset. All other borrowing costs are expensed in the period in which they occur. Borrowing costs consist of interest and other costs that an entity incurs in connection with the borrowing of funds. Deferred Oil Exploration Costs PERC follows the full cost method of accounting for exploration costs determined on the basis of each SC area. Under this method, all exploration costs relating to each SC are tentatively deferred pending determination of whether the area contains oil reserves in commercial quantities. Deferred oil and gas exploration costs are assessed at each reporting period for possible indications of impairment. This is to confirm the continued intent to develop or otherwise extract value from the discovery. When this is no longer the case or is considered as areas permanently abandoned, the costs are written off through the consolidated statement of comprehensive income. Exploration areas are considered permanently abandoned if the related permits of the exploration have expired and/or there are no definite plans for further exploration and/or development. The exploration costs relating to the SC where oil in commercial quantities are discovered are subsequently reclassified to “Wells, platforms and other facilities” shown under “Property and equipment” account in the consolidated statements of financial position upon substantial completion of the development stage. On the other hand, all costs relating to an abandoned SC are written off in the
- 21 year the area is permanently abandoned. SCs are considered permanently abandoned if the SCs have expired and/or there are no definite plans for further exploration and/or development. Deferred Development Costs - Geothermal included in Other Noncurrent Assets All costs incurred in the geological and geophysical activities such as costs of topographical, geological and geophysical studies, rights of access to properties to conduct those studies, salaries and other expenses of geologists, geophysical crews, or others conducting those studies are charged to profit or loss in the year such costs are incurred. If the results of initial geological and geophysical activities reveal the presence of geothermal resource that will require further exploration and drilling, subsequent exploration and drilling costs are accumulated and deferred under the “Other noncurrent assets” account in the consolidated statement of financial position. These costs include the following:
costs associated with the construction of temporary facilities; costs of drilling exploratory and exploratory type stratigraphic test wells, pending determination of whether the wells can produce proved reserves; and costs of local administration, finance, general and security services, surface facilities and other local costs in preparing for and supporting the drill activities, etc. incurred during the drilling of exploratory wells.
If tests conducted on the drilled exploratory wells reveal that these wells cannot produce proved reserves, the capitalized costs are charged to expense except when management decides to use the unproductive wells for recycling or waste disposal. Once the project’s technical feasibility and commercial viability to produce proved reserves are established, the exploration and evaluation assets shall be reclassified to “Property, plant and equipment” and depreciated accordingly. Deferred Development Costs - Solar Power Project included in Other Noncurrent Assets These are costs incurred in the development of the solar plant expansion project. Costs are capitalized if the technological and economic feasibility is confirmed, usually when a project development has reached a defined milestone according to an established project management model. These costs include the following: costs incurred for the expansion of the solar plant project costs of administration, finance, general and security services and other costs attributed to the expansion of the project. Deferred development costs of the Solar Power Project is recognized under “Other noncurrent assets” in the statement of financial position. Once the project’s technical feasibility and commercial viability has been established, development costs shall be reclassified to “Property, plant and equipment” and depreciated accordingly.
- 22 Investment in a Joint Venture (JV) A JV is a type of joint arrangement whereby the parties that have joint control of the arrangement have rights to the net assets of the joint venture. Joint control is the contractually agreed sharing of control of an arrangement, which exists only when decisions about the relevant activities require unanimous consent of the parties sharing control. Investment in a JV is accounted for under the equity method of accounting. Under the equity method, the investment in a JV is initially recognized at cost. The carrying amount of the investment is adjusted to recognize changes in the Group’s share of net assets of the JV since the acquisition date. The consolidated statement of comprehensive income reflects the Group’s share of the financial performance of the joint venture. Any change in OCI of those investees is presented as part of the Group’s OCI. In addition, when there has been a change recognized directly in the equity of the JV, the Group recognizes its share of any changes, when applicable, in the consolidated statement of changes in equity. Unrealized gains and losses from transactions between the Group and the JV are eliminated to the extent of the interest of the JV. The aggregate of the Group’s share in profit or loss of a JV is shown under “Other income (charges)” in the consolidated statement of comprehensive income and represents profit or loss after tax and noncontrolling interests in the subsidiaries of the JV. The financial statements of the JV are prepared in the same reporting period of the Group. When necessary, adjustments are made to bring the accounting policies in line with those of the Group. After application of the equity method for the investment in a JV, the Group determines whether it is necessary to recognize an impairment loss on its investment in a JV. At each reporting date, the Group determines whether there is objective evidence that the investment in JV is impaired. If there is such evidence, the Group calculates the amount of impairment as the difference between the recoverable amount of the JV and its carrying value, then recognizes the loss in the consolidated statement of comprehensive income. Upon loss of joint control over the JV, the Group measures and recognizes any retained investment at its fair value. Any difference between the carrying amount of the joint venture upon loss of joint control and the fair value of the retained investment and proceeds from disposal is recognized in the consolidated statement of comprehensive income. Contract Assets A contract asset is recognized for the earned consideration for goods or services transferred to a customer before the customer pays or before payment is due. Contract assets are measured at the present value of future collections to be received over a period of time. Contract assets that are expected to be received within 12 months after the financial reporting period are classified as current assets, otherwise, these are classified as noncurrent assets. Intangible Assets Intangible assets acquired separately are measured on initial recognition at cost. The cost of intangible assets acquired is their fair value as at the date of acquisition. Following initial recognition, intangible assets are carried at cost less accumulated amortization and accumulated impairment losses, if any.
- 23 Intangible assets with finite lives are amortized over their useful economic lives and assessed for impairment whenever there is an indication that the intangible asset may be impaired. The amortization period and the amortization method for an intangible asset with a finite useful life are reviewed at least at the end of each reporting period. Changes in the expected useful life or the expected pattern of consumption of future economic benefits embodied in the asset is accounted for by changing the amortization period or method, as appropriate, and are treated as changes in accounting estimates. The amortization expense on intangible assets with finite lives is recognized in the consolidated statement of comprehensive income in the expense category consistent with the function of the intangible assets. Intangible assets are amortized using the straight-line method over the estimated useful lives of the assets as follows: Land rights Production license Software license
Number of Years 25 10 1.5 to 3
Gains or losses arising from derecognition of an intangible asset are measured as the difference between the net disposal proceeds and the carrying amount of the asset and are recognized in the consolidated statement of comprehensive income when the asset is derecognized. Investment Properties Investment properties consist of land held for capital appreciation. Land is stated at cost less any impairment in value. The initial cost of the investment properties comprises its purchase price and any directly attributable costs of bringing the asset to its working condition. Expenditures incurred after the investment properties have been put into operation, such as repairs and maintenance, are normally charged to expense in the year when costs are incurred. In situations where it can be clearly demonstrated that the expenditures have resulted in an increase in the future economic benefits expected to be obtained from the use of an item of investment properties beyond its originally assessed standard of performance, the expenditures are capitalized as an additional cost of investment properties. Investment property is derecognized when either it has been disposed of or when the investment property is permanently withdrawn from use and no future economic benefit is expected from its disposal. Any gains or losses on the retirement or disposal of investment properties are recognized in the consolidated statement of comprehensive income in the year of retirement or disposal. Transfers are made to investment properties when, and only when, there is a change in use, evidenced by the end of owner-occupation, commencement of an operating lease to another party or by the end of construction or development. Transfers are made from investment properties when, and only when, there is a change in use, evidenced by commencement of owner-occupation or commencement of development with a view to sell. Interest in Joint Operations A joint operation is a joint arrangement whereby the parties that have joint control of the arrangement have rights to the assets, and obligations for the liabilities, relating to the arrangement.
- 24 The Group recognized in relation to its interest in a joint operation its: assets, including its share of any assets held jointly liabilities, including its share of any liabilities incurred jointly revenue from the sale of its share of the output arising from the joint operation share of the revenue from the sale of the output by the joint operation expenses, including its share of any expenses incurred jointly The Group accounts for the assets it controls and the liabilities it incurs, the expenses it incurs and the share of income that it earns from the sale of crude oil by the joint operations. The Group’s participating interest in the Etame block in Gabon, West Africa and participating interests in Philippine service contracts (SCs) are classified as joint operations. Impairment of Nonfinancial Assets The Group assesses at each reporting date whether there is an indication that an asset (e.g., property, plant and equipment, investment properties, deferred costs, intangible assets and right-of-use assets) may be impaired. If any such indication exists, or when annual impairment testing for an asset is required, the Group estimates the asset’s recoverable amount. An asset’s recoverable amount is the higher of an asset’s or cash-generating unit’s fair value less costs to sell and its value in use and is determined for an individual asset, unless the asset does not generate cash inflows that are largely independent of those from other assets or group of assets. Where the carrying amount of an asset exceeds its recoverable amount, the asset is considered impaired and is written down to its recoverable amount. In assessing value in use, the estimated future cash flows are discounted to their present value using a discount rate that reflects current market assessments of the time value of money and the risks specific to the asset. In determining fair value less costs to sell, an appropriate valuation model is used. These calculations are corroborated by valuation multiples, quoted share prices for publicly traded companies or other available fair value indicators. An assessment is made at each reporting date as to whether there is any indication that previously recognized impairment losses may no longer exist or may have decreased. If such indication exists, the Group makes an estimate of recoverable amount. A previously recognized impairment loss is reversed only if there has been a change in the estimates used to determine the asset’s recoverable amount since the last impairment loss was recognized. If that is the case, the carrying amount of the asset is increased to its recoverable amount. That increased amount cannot exceed the carrying amount that would have been determined, net of depletion, depreciation and amortization had no impairment loss been recognized for the asset in prior years. Capital Stock and Additional Paid-in Capital The Group records common stock at par value and additional paid-in capital in excess of the total contributions received over the aggregate par values of the equity shares. When the Group issues more than one class of stock, a separate account is maintained for each class of stock and the number of shares issued. Incremental costs incurred directly attributable to the issuance of new shares are shown in equity as a deduction from proceeds, net of tax. When any member of the Group purchases the Group’s capital stock (treasury shares), the consideration paid, including any attributable incremental costs, is deducted from equity attributable to the Group’s equity holders until the shares are cancelled, reissued or disposed of. Where such shares are subsequently sold or reissued, any consideration received, net of any directly attributable incremental transaction costs and the related tax effects, is included in equity.
- 25 Deposits for Future Stock Subscriptions Deposits for future stock subscriptions is recorded based on the redeemable amounts received and is presented under liabilities unless the following items were met for classification as part of equity: a. the unissued authorized capital stock of the entity is insufficient to cover the amount of shares indicated in the contract; b. there is BOD approval on the proposed increase in authorized capital stock (for which a deposit was received by the Group); c. there is stockholders’ approval of said proposed increase; and d. the application for the approval of the proposed increase has been filed with the Securities and Exchange Commission (SEC). Deposits represent subscription payments received from prospective investors for the Group’s common shares which are yet to be issued upon approval by the SEC of the application for increase in the authorized capital stock. This will be reclassified to ‘Capital stock’ upon issuance of the subscribed shares. Retained Earnings Retained earnings represent the cumulative balance of consolidated net income, effects of changes in accounting policy and other capital adjustments, net of dividend declaration. Unappropriated retained earnings represent the portion which can be declared as dividends to stockholders after considering the undistributed accumulated equity in a subsidiary, funds appropriated for corporate expansion projects or programs, restrictions under loan agreements and funds retained under special circumstances for probable contingencies. Appropriated retained earnings represent the portion which has been restricted and therefore is not available for any dividend declaration. Cumulative Translation Adjustment Cumulative translation adjustment represents the resulting exchange differences in the remeasurement of accounts due to change in functional currency. Equity Reserve Equity reserve is made up of equity transactions other than equity contributions such as gain or loss resulting from increase or decrease of ownership without loss of control. Dividend Distribution Cash dividends on capital stock are recognized as a liability and deducted from retained earnings when approved by the BOD. Revenue Recognition Revenue is recognized when the control of petroleum and electricity are transferred to the customer at an amount that reflects the consideration which the Group expects to be entitled in exchange for those goods and services. The Group has generally concluded that it is the principal in its revenue arrangements. Electricity sales Revenues from sale of electricity using renewable energy is consummated and recognized over time whenever the electricity generated by the Group is transmitted through the transmission line designated by the buyer, for a consideration.
- 26 Oil revenues Revenue from crude oil is recognized at a point in time when the control of the goods has transferred from the sellers (Consortium) to the buyer at the delivery point. Revenue is measured at the fair value of the consideration received. The revenue recognized from the sale of petroleum products pertains to the Group’s share in revenue from the joint operations. The revenue sharing is accounted for in accordance with PFRS 11, Joint Arrangements. Interest income Interest income is recognized as the interest accrues taking into account the effective yield on the asset. Dividend income Dividend income is recognized according to the terms of the contract, or when the right of the payment has been established. Share in Net Income of a Joint Venture Share in net income of a joint venture represents the Group’s share in profit or loss of its joint venture, PWEI. Miscellaneous Income Miscellaneous income is recognized when the Group’s right to receive the payment is established. Costs and Expenses Cost of electricity sales Costs of electricity sales pertain to direct costs in generating electricity power which includes operating and maintenance costs (O&M) for power plant and fluid collection and reinjection system (FCRS), depreciation and other costs directly attributed to producing electricity. Oil production Oil production are costs incurred to produce and deliver crude oil inventory, including transportation, storage and loading, among others. Change in crude oil inventory Change in crude oil inventory pertains to the movement of beginning and ending crude oil inventory charged as part of cost of sales. General and administrative expenses General and administrative expenses constitute costs of administering the business. Costs and expenses are recognized as incurred. Income Taxes Current Tax Current tax assets and liabilities for the current and prior periods are measured at the amount expected to be recovered from or paid to the taxation authorities. The tax rates and tax laws used to compute the amounts are those that are enacted or substantively enacted at the reporting date. Deferred Tax Deferred tax is provided using the balance sheet liability method on all temporary differences at the reporting date between the tax bases of assets and liabilities and their carrying amounts for financial reporting purposes.
- 27 Deferred tax liabilities are recognized for all taxable temporary differences except to the extent that the deferred tax liabilities arise from the: a) initial recognition of goodwill; or b) the initial recognition of an asset or liability in a transaction which is not: i) a business combination; and ii) at the time of the transaction, affects neither accounting profit nor taxable profit or loss. Deferred tax assets are recognized for all deductible temporary differences with certain exceptions, and carryforward benefits of unused tax credits from excess minimum corporate income tax (MCIT) over RCIT and unused net operating loss carryover (NOLCO), to the extent that it is probable that sufficient taxable income will be available against which the deductible temporary differences and carryforward benefits of unused tax credits from excess MCIT and unused NOLCO can be utilized. Deferred tax assets, however, are not recognized when it arises from the: a) initial recognition of an asset or liability in a transaction that is not a business combination; and b) at the time of transaction, affects neither the accounting income nor taxable profit or loss. The carrying amounts of deferred tax assets are reviewed at each reporting date and reduced to the extent that it is no longer probable that sufficient taxable income will be available to allow all or part of the deferred tax assets to be utilized. Unrecognized deferred tax assets are reassessed at each reporting date, and are recognized to the extent that it has become probable that future taxable income will allow the deferred tax assets to be recovered. The Group does not recognize deferred tax assets and deferred tax liabilities that will reverse during the income tax holiday (ITH). Deferred tax assets and liabilities are measured at the tax rates that are applicable to the period when the asset is realized or the liability is settled, based on tax rates (and tax laws) that have been enacted or substantively enacted as of the reporting date. Deferred tax relating to items recognized outside profit or loss is recognized outside profit or loss. Deferred tax items are recognized in correlation to the underlying transaction either in profit or loss or other comprehensive income. Deferred tax assets and deferred tax liabilities are offset if a legally enforceable right exists to set off current tax assets against current tax liabilities and the deferred taxes relate to the same taxable entity and the same taxation authority. Value-Added Tax (VAT) Revenues, expenses and assets are recognized net of the amount of VAT, if applicable. When VAT from sales of goods or services (output VAT) exceeds VAT passed on from purchases of goods or services (input VAT), the excess is recognized as payable in the consolidated statement of financial position. When VAT passed on from purchases of goods or services (input VAT) exceeds VAT from sales of goods and/or services (output VAT), the excess is recognized as an asset in the consolidated statement of financial position as part of “Other noncurrent assets” to the extent of the recoverable amount. Leases Group as a lessee The Group assesses at contract inception whether a contract is, or contains, a lease. That is, if the contract conveys the right to control the use of an identified asset for a period of time in exchange for consideration.
- 28 Right-of-use assets The Group recognizes right-of-use assets at the commencement date of the lease. Right-of-use assets are measured at cost, less any accumulated depreciation and impairment losses, and adjusted for any remeasurement of lease liability. The cost of right-of-use assets includes the amount of lease liability recognized, and lease payments made at or before the commencement date less any lease incentives received and estimate of costs to be incurred by the lessee in dismantling and removing the underlying asset, restoring the site on which it is located or restoring the underlying asset to the condition required by the terms and conditions of the lease, unless those costs are incurred to produce inventories. Unless the Group is reasonably certain to obtain ownership of the leased asset at the end of the lease term, the recognized right-of-use assets are depreciated on a straight-line basis over the shorter of its estimated useful life and the lease term, as follows: Office space Land
Number of Years 2 18 to 25
Lease liabilities At the commencement date of the lease, the Group recognizes lease liability measured at the present value of lease payments to be made over the lease term. The lease payments include fixed payments less any lease incentives receivable, variable lease payments that depend on an index or a rate, and amounts expected to be paid under residual value guarantees. The lease payments also include the exercise price of a purchase option reasonably certain to be exercised by the Group and payments of penalties for terminating a lease, if the lease term reflects the Group exercising the option to terminate. The variable lease payments that do not depend on an index or a rate are recognized as expense in the period on which the event or condition that triggers the payment occurs. In calculating the present value of lease payments, the Group uses the incremental borrowing rate at the lease commencement date if the interest rate implicit in the lease is not readily determinable. After the commencement date, the amount of lease liability is increased to reflect the accretion of interest and reduced for the lease payments made. In addition, the carrying amount of lease liability is remeasured if there is a modification, a change in the lease term, a change in the in-substance fixed lease payments or a change in the assessment to purchase the underlying asset. Short-term leases and leases of low-value assets The Group applies the short-term lease recognition exemption to its short-term leases (i.e., those leases that have a lease term of 12 months or less from the commencement date and do not contain a purchase option). It also applies to the leases of low-value assets recognition exemption to leases that are considered of low value (i.e., below P =250,000). Lease payments on short-term leases and leases of lowvalue assets are recognized as expense on a straight-line basis over the lease term. Accrued Retirement Liability The net defined benefit liability or asset is the aggregate of the present value of the defined benefit obligation at the end of the reporting period reduced by the fair value of plan assets (if any), adjusted for any effect of limiting a net defined benefit asset to the asset ceiling. The asset ceiling is the present value of any economic benefits available in the form of refunds from the plan or reductions in future contributions to the plan. The cost of providing benefits under the defined benefit plans is actuarially determined using the projected unit credit method.
- 29 Defined benefit costs comprise the following: Service cost Net interest on the net defined benefit liability or asset Remeasurements of net defined benefit liability or asset Service costs which include current service costs, past service costs and gains or losses on non-routine settlements are recognized as expense in the consolidated statement of comprehensive income. Past service costs are recognized when plan amendment or curtailment occurs. These amounts are calculated periodically by independent qualified actuaries. Net interest on the net defined benefit liability or asset is the change during the period in the net defined benefit liability or asset that arises from the passage of time which is determined by applying the discount rate based on government bonds to the net defined benefit liability or asset. Net interest on the net defined benefit liability or asset is recognized as expense or income in the consolidated statement of comprehensive income. Remeasurements comprising actuarial gains and losses, return on plan assets and any change in the effect of the asset ceiling (excluding net interest on defined benefit liability) are recognized immediately in OCI in the period in which they arise. Remeasurements are not reclassified to consolidated statement of comprehensive income in subsequent periods. Plan assets are assets that are held by a long-term employee benefit fund. Plan assets are not available to the creditors of the Group nor can they be paid directly to the Group. Fair value of plan assets is based on market price information. When no market price is available, the fair value of plan assets is estimated by discounting expected future cash flows using a discount rate that reflects both the risk associated with the plan assets and the maturity or expected disposal date of those assets (or, if they have no maturity, the expected period until the settlement of the related obligations). If the fair value of the plan assets is higher than the present value of the defined benefit obligation, the measurement of the resulting defined benefit asset is limited to the present value of economic benefits available in the form of refunds from the plan or reductions in future contributions to the plan. The Group’s right to be reimbursed of some or all of the expenditure required to settle a defined benefit obligation is recognized as a separate asset at fair value when and only when reimbursement is virtually certain. Asset Retirement Obligation (ARO) The Group records present value of estimated costs of legal and constructive obligations required to restore the oilfields and plant sites upon termination of its operations. The nature of these restoration activities includes dismantling and removing structures, rehabilitating settling ponds, dismantling operating facilities, closure of plant and waste sites, and restoration, reclamation and re-vegetation of affected areas. The obligation generally arises when the asset is constructed or the ground or environment at the sites are disturbed. When the liability is initially recognized, the present value of the estimated cost is capitalized as part of the carrying amount of the ARO assets (included under “Property, plant and equipment”) and ARO liability. Liability and capitalized costs included in oil properties is equal to the present value of the Group’s proportionate share in the total decommissioning costs of the consortium on initial recognition. Additional costs or changes in decommissioning costs are recognized as additions or charges to the corresponding assets and ARO when they occur. For closed sites or areas, changes to estimated costs are recognized immediately in the consolidated statement of comprehensive income. If the decrease in liability exceeds the carrying amount of the asset, the excess shall be recognized immediately in profit or loss.
- 30 For the oil operation, the Group depreciates ARO assets based on units-of-production method. For the renewable energy, the Group depreciates ARO assets on a straight-line basis over the estimated useful life of the related asset or the service contract term, whichever is shorter, or written off as a result of impairment of the related asset. The Group regularly assesses the provision for ARO and adjusts the related liability and asset. Foreign Currency-Denominated Transactions and Translation The consolidated financial statements are presented in PHP, which is the Parent Company’s functional and presentation currency. Transactions in foreign currencies are initially recorded in the functional currency using the exchange rate at date of transaction. Monetary assets and liabilities denominated in foreign currencies are reinstated to the functional currency using the closing exchange rate at reporting date. All exchange differences are taken to the consolidated statement of comprehensive income. Nonmonetary items that are measured in terms of historical cost in foreign currency are translated using the exchange rates as at the dates of initial transactions. Non-monetary items measured at fair value in a foreign currency are translated using the exchange rates at the date when the fair value was determined. Earnings Per Share Basic earnings per share is computed on the basis of the weighted average number of shares outstanding during the year after giving retroactive effect to any stock split or stock dividends declared and stock rights exercised during the current year, if any. Diluted earnings per share is computed on the basis of the weighted average number of shares outstanding during the year plus the weighted average number of ordinary shares that would be issued on the conversion of all the dilutive potential ordinary shares into ordinary shares. Segment Reporting The Group’s operating businesses are organized and managed separately according to the nature of the products and services provided, with each segment representing a strategic business unit that offers different products and services, serves different markets subject to different risks and returns. Financial information on business segments is presented in Note 27 to the consolidated financial statements. Provisions and Contingencies Provisions are recognized when the Group has a present obligation (legal or constructive) as a result of a past event, it is probable that an outflow of resources embodying economic benefits will be required to settle the obligation and a reliable estimate can be made of the amount of the obligation. If the effect of the time value of money is material, provisions are determined by discounting the expected future cash flows at a pre-tax rate that reflects current market assessments of the time value of money and, where appropriate, the risks specific to the liability. Where discounting is used, the increase in the provision due to the passage of time is recognized as an interest expense. Provisions are reviewed at each reporting date and adjusted to reflect the current best estimate.
- 31 Contingent liabilities are not recognized in the financial statements. They are disclosed unless the possibility of an outflow of resources embodying economic benefits is remote. Contingent assets are not recognized in the financial statements but are disclosed when an inflow of economic benefits is probable. Contingent assets are assessed continually to ensure that developments are appropriately reflected in the financial statements. If it has become virtually certain that an inflow of economic benefits will arise, the asset and the related income are recognized in the consolidated financial statements.
5. Significant Accounting Judgments, Estimates and Assumptions The preparation of the consolidated financial statements in compliance with PFRS requires the Group to make judgments, estimates and assumptions that affect the reported amounts of assets, liabilities, income and expenses and disclosure of contingent assets and contingent liabilities. Future events may occur which will cause the assumptions used in arriving at the estimates to change. The effects of any change in judgments, estimates and assumptions are reflected in the consolidated financial statements, as they become reasonably determinable. Judgments, estimates and assumptions are continually evaluated and are based on historical experience and other factors, including expectations of future events that are believed to be reasonable under the circumstances. Judgments In the process of applying the Group’s accounting policies, management has made the following judgments, apart from those involving estimations, which has the most significant effect on the amounts recognized in the consolidated financial statements: Determination of Functional Currency The Parent Company determines its functional currency based on economic substance of underlying circumstances relevant to the Parent Company. The functional currency has been determined to be the PHP based on the economic substance of the Parent Company’s business circumstances. Capitalization of Deferred Oil Exploration Costs and Deferred Development Costs Initial capitalization of costs is based on management’s judgment that technological and economic feasibility is confirmed, usually when a product development project has reached a defined milestone according to an established project management model. If the accounting policy on capitalization of development costs are not met, such costs are expensed. As of September 30, 2021 and December 31, 2020, the carrying value of deferred oil explorations costs amounted to P =226.02 million and P =210.53 million, respectively, and the Group’s deferred development costs amounted to P =20.75 million and P =3.86 million as of September 30, 2021 and December 31, 2020, respectively.
- 32 Classification of Joint Arrangements Judgment is required to determine when the Group has joint control over an arrangement, which requires an assessment of the relevant activities and when the decisions in relation to those activities require unanimous consent. The Group assesses their rights and obligations arising from the arrangement and specifically considers: the structure of the joint arrangement - whether it is structured through a separate vehicle when the arrangement is structured through a separate vehicle, the Group also considers the rights and obligations arising from: the legal form of the separate vehicle the terms of the contractual arrangement other facts and circumstances, considered on a case by case basis This assessment often requires significant judgment. A different conclusion about both joint control and whether the arrangement is a joint operation or a joint venture, may materially impact the accounting of the investment. The Group’s investment in PetroWind is structured in a separate incorporated entity. The Group and the parties to the agreement only have the right to the net assets of the joint venture through the terms of the contractual arrangement. Accordingly, the joint arrangement is classified as a joint venture. As of September 30, 2021 and December 31, 2020, the Group’s investment in a joint venture amounted to ₱1.70 billion and P =1.64 billion, respectively. The Group and the parties to the agreement in investment in Gabon, West Africa and investments in petroleum concessions in the Philippines have joint control over its rights to the assets and obligations for the liabilities, relating to the arrangement. Accordingly, the joint arrangements are classified as joint operations. Estimates and Assumptions The key assumptions concerning the future and other key sources of estimation uncertainty at the reporting date that have a significant risk of causing a material adjustment to the carrying amounts of assets and liabilities within the next financial year are discussed below. Estimation of Geothermal Field Reserves The Group performed volumetric reserve estimation to determine the reserves of the Maibarara geothermal field. As a requirement for project financing, The Group engaged at its own cost the New Zealand firm Sinclair Knight Merz (SKM) in 2011 to undertake a comprehensive third-party technical review of the Maibarara geothermal field. This review included analysis of the resource assessment performed in-house by the Group as well as a separate SKM reserve estimation and numerical modeling of the Maibarara reserves. The Group’s simulation indicated a mean (P50) proven reserves of 27.8 MW for 25 years. In contrast, SKM calculated the P50 reserves at 44 MW. At 90% probability (P90), the reserves calculated are 28 MW and 12 MW by SKM and the Group, respectively. SKM concluded that the approach taken by the Group is conservative as it limits reservoir thickness to depths where a maximum thickness of 280°C will be encountered although the measured temperature reached as high as 324°C. There is reasonable confidence that the 20 MW (gross) plant development is feasible as the P90 level appears also conservative as with the Group’s approach. In addition, SKM identified indicated reserves, translating to 10 MW-26 MW in the area south of and outside the current area of development.
- 33 Also, there is a likely geothermal potential south of the proven area where two old wells were drilled and encountered high fluid temperatures (T ~ 300°C). MGI identified the southern block as a probable reserve area. SKM in 2011 suggested that the southern block can be classified as Indicated Resource based on the Australian Code as high temperatures have been intersected by the two wells. SKM estimated that the stored heat in the Southern Block has a resource potential equivalent to 12 MW for a project life of 25 years. An updated reserves estimation using the stored-heat calculation was made in 2015 by the Group as a result of reservoir and production performance and the 2014 drilling campaign. The 2014 drilling proved that the current resource area can produce around 33.1 MW, more than enough to meet the steam requirement of the existing 20 MW power plant plus the 12 MW expansion power plant. Using Monte Carlo simulation to estimate the reserves, the proven resource area has an 80% probability of delivering between 18.1 MW to 50.9 MW over a 25-year operating period. This Monte Carlo simulation also showed that the expected mean reserve for the proven resource area is 30.4 MW for 25 years. The Group engaged a U.S. firm Geothermal Science, Inc. (GSI) in 2015 to perform a third-party technical appraisal of the resource for the planned 12 MW expansion. This third-party review was also made as a requirement for the project financing of MGPP-2 or M2. GSI adopted the technique from the US Geological Survey Circular 790 in making the probabilistic calculation of the geothermal reserves at Maibarara. Based on this approach, GSI estimates that Maibarara has a minimum or proven reserves of 40.2 MW, P90 for 25 years plant life and Most Likely Reserve of 61.6 MW, P50 for 25 years of plant life. The Group commenced producing power commercially last February 8, 2014. To date, the current production wells of M1 and M2 are capable of producing 33.1 MW. These production wells including the complement reinjection wells are concentrated on the proven resource area. As of September 30, 2021 and December 31, 2020, there has been no significant change in the estimated reserves that would affect the carrying value and useful life of the Group’s property, plant and equipment. Estimation of Proved and Probable Oil Reserves The Parent Company assesses its estimate of proved and probable reserves on an annual basis. The estimate is based on the technical assumptions and is calculated in accordance with accepted volumetric methods, specifically the probabilistic method of estimation. Probabilistic method uses known geological, engineering and economic data to generate a range of estimates and their associated probabilities. All proved and probable reserve estimates are subject to revision, either upward or downward, based on new information, such as from development drilling and production activities or from changes in economic factors, including product prices, contract terms or development plans. Estimates of reserves for undeveloped or partially developed fields are subject to greater uncertainty over their future life than estimates of reserves for fields that are substantially developed and depleted. Estimated oil reserves are utilized in the impairment testing and the calculation of depletion expense using the unit of production method of the investments in Gabon, West Africa.
- 34 As of September 30, 2021 and December 31, 2020, the carrying value of Gabon “Wells, Platforms and other Facilities” under “Property, Plant and Equipment” amounted to P =506.99 million and P =557.77 million, respectively. Estimation of Useful Lives of Property, Plant and Equipment The Group reviews on an annual basis the estimated useful lives of property, plant and equipment based on expected asset utilization as anchored on business plans and strategies that also consider expected future technological developments and market behavior. It is possible that future results of operations could be materially affected by changes in these estimates brought about by changes in the factors mentioned. A reduction in the estimated useful lives of property, plant and equipment would increase the recorded depletion, depreciation and amortization expense and decrease noncurrent assets. There is no change in the estimated useful lives of property, plant and equipment as of September 30, 2021 and December 31, 2020. As of September 30, 2021 and December 31, 2020, the Group’s depreciable property, plant and equipment amounted to P =7.18 billion and P =7.38 billion, respectively. Impairment of Nonfinancial Assets The Group assesses at each reporting date, whether there is an indication that an asset may be impaired. If any indication exists, or when annual impairment testing for an asset is required, the Group estimates the asset’s recoverable amount. An asset’s recoverable amount is the higher of an asset’s or cashgenerating unit’s (CGU) fair value less cost of disposal and its value in use. The recoverable amount is the higher of an asset’s or cash-generating unit’s (CGU) fair value less cost of disposal and its value in use. The fair value less cost of disposal is the amount obtainable from the sale of an asset in an arm’s length transaction while value in use is the present value of estimated future cash flows expected to arise from the continuing use of an asset or CGU and from its disposal at the end of its useful life. In determining the present value of estimated future cash flows expected to be generated from the continued use of an asset or CGU, the Group is required to make estimates and assumptions that can materially affect the consolidated financial statements. Facts and circumstances that would require an impairment assessment as set forth in PFRS 6, Exploration for and Evaluation of Mineral Resources, are as follows:
the period for which the Group has the right to explore in the specific area has expired or will expire in the near future, and is not expected to be renewed; substantive expenditure on further exploration for and evaluation of mineral resources in the specific area is neither budgeted nor planned; exploration for and evaluation of mineral resources in the specific area have not led to the discovery of commercially viable quantities of mineral resources and the entity has decided to discontinue such activities in the specific area; and sufficient data exist to indicate that, although a development in the specific area is likely to proceed, the carrying amount of the exploration and evaluation asset is unlikely to be recovered in full from successful development or by sale.
- 35 The related balances of the Group’s nonfinancial assets as of September 30 and December 31 follow:
Property, plant and equipment Right-of-use assets Deferred oil exploration costs Intangible assets Deferred development costs Investment properties
Audited Unaudited 31-Dec-20 30-Sep-21 P8,310,613,046 P =8,054,159,544 = 383,032,125 369,127,997 210,533,496 226,022,135 165,976,162 155,601,255 3,855,596 20,753,544 1,611,533 1,611,533 =9,075,621,958 P =8,827,276,008 P
There are no indicators of impairment that would trigger impairment review in September 30, 2021 and December 31, 2020 other than those mentioned below. Gabon, West Africa The Group believes that the low crude oil prices in the market, political risks in Gabon, discount rates and changes in other assumptions such as change in production profile which is based on continued production until the term of the existing Production Sharing Contract are indicators that the assets might be impaired and thus, prompted the Group to perform impairment testing of the assets. In 2018, the Gabonese Government allowed the sixth amendment to the Exploration Production Sharing Contract (EPSC) that extends the exploitation period for the production licenses by ten (10) years, or from September 2018 until September 2028, extendible by five (5) years and by a final extension of 5 more years. The extension of the EPSC will allow the consortium to maximize the use of the existing facilities that are already in place to increase or maintain production until the field’s extended life. In assessing whether the asset is impaired or if reversal of prior impairment loss is required, the carrying value of the asset is compared with its recoverable amount. The recoverable amount is the higher of the asset’s fair value less costs to sell and value in use. Given the nature of the Group’s activities, information on the fair value of an asset is usually difficult to obtain unless negotiations with potential purchasers or similar transactions are taking place. Consequently, unless indicated otherwise, the recoverable amount used in assessing the impairment loss is value in use. The Group did not recognize an impairment loss (reversal of impairment loss) for the period ended September 30, 2021 and December 31, 2020: As of September 30, 2021 and December 31, 2020, the net carrying value of the assets forming part of the CGU in Gabon, West Africa are as follows:
Wells, platforms and other facilities Production license Deferred oil exploration costs
Unaudited 30-Sep-21 P =506,994,402 32,746,198 39,121,698 P =578,862,298
Audited 31-Dec-20 =557,767,960 P 35,828,192 24,471,370 =618,067,522 P
- 36 Estimating the incremental borrowing rate The Group cannot readily determine the interest rate implicit in the lease, therefore, it uses its incremental borrowing rate (IBR) to measure lease liabilities. The IBR is the rate of interest that the Group would have to pay to borrow over a similar term, and with a similar security, the funds necessary to obtain an asset of a similar value to the right-of-use asset in a similar economic environment. The IBR therefore reflects what the Group ‘would have to pay’, which requires estimation when no observable rates are available or when they need to be adjusted to reflect the terms and conditions of the lease. The Group estimates the IBR by reference to the PH BVAL rate, adjusted by the credit spread of the Group based on current loan agreements. The Group’s lease liabilities amounted to P =326.04 million and P =335.45 million as of September 30, 2021 and December 31, 2020. Estimation of Asset Retirement Obligations The Group has various legal obligation to decommission or dismantle its assets related to the oil production, geothermal energy project and solar power project at the end of each respective service contract. In determining the amount of provisions for restoration costs, assumptions and estimates are required in relation to the expected costs to restore sites and infrastructure when such obligation exists. The Group recognizes the present value of the obligation to dismantle and capitalizes the present value of this cost as part of the balance of the related property, plant and equipment, which are being depreciated and amortized on a straight-line basis over the useful life of the related assets (for the renewable energy) and based on units-of-production method based on estimates of proved reserves (for the oil operations). Cost estimates expressed at current price levels at the date of the estimate are discounted using a rate ranging from 2.84% to 3.92% in 2020 to take into account the timing of payments. Each year, the provision is increased to reflect the accretion of discount and to accrue an estimate for the effects of inflation, with charges being recognized as accretion expense. Changes in the asset retirement obligation that result from a change in the current best estimate of cash flow required to settle the obligation or a change in the discount rate are added to (or deducted from) the amount recognized as the related asset and the periodic unwinding of the discount on the liability is recognized in profit or loss as it occurs. While the Group has made its best estimate in establishing the asset retirement obligation, because of potential changes in technology as well as safety and environmental requirements, plus the actual time scale to complete decommissioning activities, the ultimate provision requirements could either increase or decrease significantly from the Group’s current estimates. The amounts and timing of recorded expenses for any period would be affected by changes in these factors and circumstances. Asset retirement obligation as of September 30, 2021 and December 31, 2020 follows:
PetroEnergy - Oil production MGI - Geothermal energy project PetroSolar - Solar power project
Unaudited 30-Sep-21 P =69,414,610 32,003,409 14,287,429 P =115,705,448
Audited 31-Dec-20 =64,070,738 P 31,209,163 13,879,778 =109,159,679 P
- 37 Recoverability of input VAT The Group maintains an allowance for input VAT based on an assessment of the recoverability of these assets using the historical success rate of VAT refunded from the Bureau of Internal Revenue (BIR). A review is made by the Group on a continuing basis annually to determine the adequacy of the allowance for losses. Allowance for probable losses as of September 30, 2021 and December 31, 2020 amounted to = P4.25 million and P =6.63 million, respectively. The carrying value of input VAT amounted to P =131.66 million and = P206.86 million as of September 30, 2021 and December 31, 2020, respectively (see Note 15). Recognition of deferred tax assets The Group reviews the carrying amounts of deferred tax assets at each reporting date and reduces them to the extent that it is no longer probable that sufficient future taxable profit will be available to allow all or part of the deferred tax assets to be utilized. As of September 30, 2021 and December 31, 2020, the Group did not recognize deferred tax assets on certain NOLCO and MCIT as the Group believes that it may not be probable that sufficient taxable income will be available in the near foreseeable future against which the tax benefits can be realized prior to their expiration. As of September 30, 2021 and December 31, 2020, gross deferred tax assets recognized amounted to P =27.80 million. 6.
Cash and Cash Equivalents Cash on hand and in banks Cash equivalents
Audited Unaudited 31-Dec-20 30-Sept-21 =607,252,608 P P =693,505,503 660,079,436 776,473,397 P1,267,332,044 P =1,469,978,900 =
Cash in banks earn interest at the prevailing bank deposit rates. Cash equivalents are made for varying periods of up to three months depending on the immediate cash requirements of the Group and earn interest at the prevailing short-term deposit rates. Interest income earned on cash and cash equivalents and restricted cash (see Note 9) amounted to =7.6 million and P P =18.03 million as of September 30, 2021 and December 31, 2020, respectively.
7. Receivables Unaudited 30-Sept-21 Accounts receivable from: Electricity sales and other charges to ACEN (formerly PHINMA) Feed-in-Tariff (FiT) revenue from National Transmission Corporation (TransCo) Electricity sales to Wholesale Electricity Spot Market (WESM)/SNAP/NGCP PHESCO, Incorporated (PHESCO) Affiliate (Note 25) Consortium operator Others (Forward)
Audited 31-Dec-20
P =136,197,351
=116,391,600 P
109,048,143
96,878,750
17,156,601 15,245,231 2,987,492 2,682,452 2,638,759
7,641,677 15,245,231 1,933,908 32,808,612 1,932,374
- 38 -
Interest receivables Other receivables Less allowance for impairment losses
Unaudited 30-Sept-21 P =973,582 3,526,250 290,455,861 2,682,452 P =287,773,409
Audited 31-Dec-20 =895,945 P 2,526,250 276,254,347 2,682,452 =273,571,895 P
Receivables are generally on 30 days credit term. Interest income earned from the delayed payment of FiT differential amounted (nil in September 30, 2021 and December 21, 2020). Other receivables in 2020 pertain to the amount due from Rizal Commercial Banking Corporation (RCBC) for withholding tax on interest expense for the Project Loan Facility Agreement advanced by the Group. This amount was subsequently collected in 2021.
8. Financial Assets at Fair Value Through Profit or Loss
Marketable equity securities Investment in golf club shares
Unaudited 30-Sept-21 P =6,711,373 770,000 P =7,481,373
Audited 31-Dec-20 =6,761,587 P 770,000 =7,531,587 P
Net loss on fair value changes on financial assets at FVTPL included in the consolidated statements of comprehensive income amounted to P =0.05 million as of September 30, 2021 and P =0.71 million, as of December 31, 2020. Dividend income received from equity securities amounted to P =0.04 million and =0.07million as of September 30, 2021 and December 31, 2020, respectively. P
9. Other Current Assets
Restricted cash Supplies inventory Advances to suppliers Prepaid expenses Prepaid taxes Others
Unaudited 30-Sept-21 P =781,767,022 103,101,498 53,903,819 40,459,059 1,304,933 2,613,491 P =983,149,822
Audited 31-Dec-20 =549,011,453 P 106,005,350 7,725,445 17,283,912 15,116,146 1,880,404 =697,022,710 P
Restricted Cash Restricted cash includes the amount of fund that the Group is required to maintain in the Debt Service Payment Account (DSPA) and Debt Service Reserve Account (DSRA) pursuant to the Omnibus Loan and Security Agreement (OLSA) of MGI and PetroSolar, respectively (see Note 16). Restricted cash also includes the remaining unused portion of the Stock Rights Offering Proceeds held under an escrow account amounting to ₱154.41 million and ₱154.12 million as of September 30, 2021 and December 31, 2020, respectively.
- 39 Supplies Inventory Supplies inventory refers to purchased supplies and parts that are intended to be used for operations and maintenance. Prepaid Expenses Prepaid expenses include various prepaid insurances, services and rent. Prepaid expenses also include advance payment for Real Property Taxes (RPT), Stand-by Letter of Credit (SBLC) charges and operations and maintenance professional fees. Prepaid Taxes Prepaid taxes pertain to creditable withholding taxes and prior year’s income tax credit. Advances to Suppliers Advances to suppliers pertain to down payments to various suppliers for the purchase of materials and services for the current operations.
- 40 10. Property, Plant and Equipment
Cost Balances at beginning of year Additions Disposal Reclassification Balances at end of year Accumulated depletion and depreciation Balances at beginning of year Depletion and depreciation Disposals Balances at end of year Accumulated impairment losses Net book values
30-Sep-2021 (Unaudited) Office condominium units and Transportation improvements equipment
Power plants
FCRS and production wells - geothermal
Wells, platforms and other facilities
Land and land improvements
P =7,238,918,109 31,472,245 – – 7,270,390,354
P = 1,568,607,925 32,099,465 – 32,248,656 1,632,956,046
P =2,228,718,206 835,408 – – 2,229,553,614
P =296,650,208 3,252,688 – – 299,902,896
P = 41,574,869 – – – 41,574,869
1,406,756,653 230,066,514 – 1,636,823,167 – P = 5,633,567,187
330,420,820 51,169,558 – 381,590,378 – P = 1,251,365,668
1,305,972,395 51,608,964 – 1,357,581,359 158,657,126 P =713,315,129
31,910,941 3,907,142 – 35,818,083 – P =264,084,813
40,839,701 162,252 – 41,001,953 – P = 572,916
Office furniture and other equipment
Construction in progress
Total
P =50,038,846 1,892,203 (1,947,858) – 49,983,191
= 160,162,006 P 2,563,287 (39,583) – 162,685,710
P =163,574,766 25,243,466 – (32,248,656) 156,569,576
P = 11,748,244,935 97,358,762 (1,987,441) – 11,843,616,256
39,530,569 3,128,754 (1,538,766) 41,120,557 – P =8,862,634
123,543,684 13,359,988 (39,583) 136,864,089 – = 25,821,621 P
– – – – – P =156,569,576
3,278,974,763 353,403,172 (1,578,349) 3,630,799,586 158,657,126 P =8,054,159,544
- 41 -
Cost Balances at beginning of year Additions Transfers from deferred oil exploration costs (Note 11) Change in ARO estimate (Note 18) Disposal Reclassifications Balances at end of year Accumulated depletion and depreciation Balances at beginning of year Depletion and depreciation Disposals Balances at end of year Accumulated impairment losses Net book values
31-Dec-2020 (Audited) Office condominium units and Transportation improvements equipment
Power plants
FCRS and production wells - geothermal
Wells, platforms and other facilities
Land and land improvements
Office furniture and other equipment
Construction in progress
Total
=7,211,984,013 P 12,119,628
=1,562,738,120 P –
=2,166,119,173 P 19,175,902
=293,346,620 P 3,303,588
=40,991,861 P 583,008
=51,082,742 P 1,877,102
=144,493,150 P 15,668,856
P18,015,854 = 157,949,831
=11,488,771,533 P 210,677,915
–
–
34,267,669
–
–
–
–
–
34,267,669
2,848,844 – 11,965,624 7,238,918,109
5,444,510 – 425,295 1,568,607,925
9,155,462 – – 2,228,718,206
– – – 296,650,208
– – – 41,574,869
– (2,920,998) – 50,038,846
– – – 160,162,006
1,101,299,995 305,456,658 – 1,406,756,653 – = 5,832,161,456 P
260,867,044 69,553,776 – 330,420,820 – =1,238,187,105 P
1,223,735,862 82,236,533 – 1,305,972,395 158,657,126 =764,088,685 P
26,485,766 5,425,175 – 31,910,941 – =264,739,267 P
40,769,200 70,501 – 40,839,701 – =735,168 P
36,100,378 6,247,975 (2,817,784) 39,530,569 – =10,508,277 P
104,251,114 19,292,570 – 123,543,684 – =36,618,322 P
– – (12,390,919) 163,574,766 – – – – – =163,574,766 P
17,448,816 (2,920,998) – 11,748,244,935 2,793,509,359 488,283,188 (2,817,784) 3,278,974,763 158,657,126 =8,310,613,046 P
- 42 Power plants represent MGI’s geothermal power plant and PetroSolar’s photovoltaic plant. The Group’s construction in progress account as of December 31, 2020 includes mobilization of Drilling Rig for Workover of one (1) unit Well MB-12D Wellhead Replacement of MGPP, civil structural, piping and mechanical works for M2, interconnection of MGPP to NGCP 69kV distribution line, design, facilities study and construction of 70/77 MVA MGI Substation related to MGPP-1&2. The workover for Well MB-12D was completed in April 2021. Change in ARO estimate and transfers from advances to contractors, deferred oil exploration costs and development costs are considered as noncash investing activities. Depletion of wells, platforms and other facilities is presented as a separate item under cost of sales in the consolidated statements of comprehensive income. As of September 30, 2021 and December 31, 2020, the participating interest of PERC in various service contracts areas are as follows: Gabonese Oil Concessions SC 14-C2 – West Linapacan
2.525% 4.137%
11. Deferred Oil Exploration Costs The movements in deferred oil exploration costs follow: Unaudited 30-Sep-21 Cost Balances at beginning of year Additions Transfers to wells and platforms Balances at end of year Accumulated impairment losses Balances at beginning of year Write-off / relinquishment Balances at end of year
Audited 31-Dec-20
P =530,976,224 15,488,639 – 546,464,863
=513,400,918 P 51,842,975 (34,267,669) 530,976,224
P =320,442,728 – 320,442,728 P = 226,022,135
=320,442,728 P – 320,442,728 =210,533,496 P
Details of deferred oil exploration costs follow: Unaudited 30-Sep-21 Cost Gabonese Oil Concessions SC No. 6A - Octon-Malajon Block SC. No. 75 - Offshore Northwest Palawan SC. No. 14 - C2 (West Linapacan) Northwest Palawan
Audited 31-Dec-20
P =357,406,044 158,048,746 28,381,074
=342,755,717 P 157,745,711 28,041,968
2,628,999 546,464,863
2,432,828 530,976,224
- 43 Unaudited 30-Sep-21 Accumulated impairment losses Gabonese Oil Concessions SC. No. 14 - C2 (West Linapacan) Northwest Palawan
Audited 31-Dec-20
318,284,347
318,284,347
2,158,381 320,442,728 P =226,022,135
2,158,381 320,442,728 =210,533,496 P
Philippine Oil Operations – Development Phase Under the SCs entered into with the DOE covering certain petroleum contract areas in various locations in the Philippines, the participating oil companies (collectively known as “Contractors”) are obliged to provide, at their sole risk, the services, technology and financing necessary in the performance of their obligations under these contracts. The Contractors are also obliged to spend specified amounts indicated in the contract in direct proportion to their work obligations. However, if the Contractors fail to comply with their work obligations, they shall pay to the government the amount they should have spent, but did not, in direct proportion to their work obligations. The participating companies have Operating Agreements among themselves which govern their rights and obligations under these contracts. The full recovery of these deferred costs is dependent upon the discovery of oil in commercial quantities from any of the petroleum concessions and the success of future development thereof. As of September 30, 2021 and December 31, 2020, the participating interests of the Group in various Petroleum SC areas are as follows: SC 6A – Octon-Malajon Block SC 75 – Offshore Northwest Palawan
2021 16.667% 15.000%
2020 16.667% 15.000%
12. Investment in a Joint Venture The investment in a joint venture represents PetroGreen’s 40% interest in PetroWind, a company incorporated in the Philippines. The primary purpose of PetroWind is to carry on the general business of generating, transmitting and/or distributing power derived from renewable energy sources. The movements in the carrying value as of Septembere 30, 2021 and December 31, 2020 follow:
Balance at beginning of year Share in net income of a joint venture Dividends received Share in other comprehensive income (loss) Balance at end of year
Audited Unaudited 31-Dec-20 30-Sept-21 P1,563,732,303 P =1,635,213,444 = 111,266,383 64,886,595 (40,000,000) 214,758 =1,635,213,444 P =1,700,100,039 P
- 44 The carrying value of the investment in PetroWind is equivalent to the Group’s 40% share in PetroWind’s equity, plus the fair value adjustment of P =764.49 million recognized when the Group lost control over PetroWind in 2014.
13. Leases The Group entered into lease contracts for office spaces and land used as geothermal field and photovoltaic (PV) solar power facility. The office space lease agreements are for a period of two (2) years and are renewable by mutual agreement of both parties. The land lease agreement (LLA) with NPC and PSALM for the geothermal field in Sto. Tomas, Batangas has a lease term of twenty-five (25) years, extendable for another 25 years upon mutual agreement of both parties. The two lease agreements with Luisita Industrial Park Corporation (LIPCO) for land used for the photovoltaic solar power facility in Tarlac is for a period of 25 years, renewable by mutual agreement of both parties, generally under the same terms and conditions, with escalation clause of 3% every 2 years. The Group’s obligations under these leases are secured by the lessor’s title to the leased assets. The Group is restricted from assigning and subleasing the leased assets. The Group applies the ‘short-term lease’ and ‘lease of low-value assets’ recognition exemptions for all other leases, including leases of vehicles and parking slots. The rollforward analyses of right-of-use assets follow: 30-Sep-2021(Unaudited) Land Office Spaces
Total
Cost Beginning balance Additions Ending balance
P =420,180,224 – 420,180,224
P =9,722,246 3,861,186 13,583,432
P =429,902,470 3,861,186 433,763,656
Accumulated depreciation Beginning balance Depreciation Ending balance Net Book Value
40,197,914 15,868,456 56,066,370 P = 364,113,854
6,672,431 1,896,858 8,569,289 P =5,014,143
46,870,345 17,765,314 64,635,659 P =369,127,997
31-Dec-2020(Audited) Land Office Spaces
Total
Cost Beginning balance Additions Ending balance Accumulated depreciation Beginning balance Depreciation Ending balance Net Book Value
P =420,180,224 – 420,180,224
P =6,563,033 3,159,213 9,722,246
= P426,743,257 3,159,213 429,902,470
20,053,149 20,144,675 40,197,914 P =379,982,310
3,295,407 3,377,024 6,672,431 P =3,049,815
23,348,556 23,521,789 46,870,345 = P383,032,125
- 45 -
The depreciation of the right-of-use of the lands in Tarlac and Batangas are presented as part of “Cost of electricity sales” while the depreciation of the right-of-use of office spaces are presented as part of “General and administrative expenses” in the consolidated statement of comprehensive income. No lease liability was recognized for leases of land that have been prepaid. The rollforward analyses of lease liabilities follow:
Beginning balance Payments Interest expense Additions Ending balance Less current portion Noncurrent portion
Unaudited 30-Sep-21 P =335,451,103 (36,389,067) 23,112,163 3,861,186 326,035,385 39,823,778 P =286,211,607
Audited 31-Dec-20 =337,829,549 P (36,596,442) 31,058,783 3,159,213 335,451,103 15,393,725 =320,057,378 P
14. Investment Properties As of September 30, 2021 and December 31, 2020, this account consists of land and parking lot space (located in Tektite) with cost amounting to P =1.61 million. The fair value of the investment properties of the Group is between P =1 million to P =1.70 million as of September 30, 20221 and December 31, 2020. The Group determined the fair values of the Group’s investment properties on the basis of recent sales of similar properties in the same areas as the investment properties and taking into account the economic conditions prevailing at the time the valuations were made. As of September 30, 2021 and December 31, 2020, the fair value of the investment properties is classified under the Level 2 category. Except for insignificant amounts of real property taxes on the investment properties, no other expenses were incurred, and no income was earned in relation to the investment properties.
15. Other Noncurrent Assets
Intangible assets Input VAT Restricted cash Deferred development costs Advances to contractors Others Less allowance for probable losses
Unaudited 30-Sept-21 P =155,601,255 133,906,870 47,561,342 20,753,544 621,928 23,220,827 381,665,766 4,246,586 P =377,419,180
Audited 31-Dec-20 =165,976,162 P 213,491,296 44,833,232 3,855,595 1,311,357 22,595,698 452,063,340 6,629,046 =445,434,294 P
- 46 Input VAT Input VAT represents VAT passed on from purchases of goods and services that can be claimed against any future liability to the Bureau of Internal Revenue (BIR) for output VAT from sale of goods and services. Input VAT also includes outstanding input VAT claims that were applied by MGI for refund with the BIR. As of September 30, 2021 and December 31, 2020, the outstanding input VAT claims which are still pending with the CTA and SC amounted to P =126.96 million. Intangible assets Intangible assets pertain to land rights, which refers to grant of easement of right of way entered by PetroSolar to construct, operate, maintain, repair, replace and remove poles, wire, cables, apparatus, and equipment and such other apparatus and structures needed for the transmission line. This also includes software licenses of the Group. Restricted cash The restricted cash pertains to the Parent Company’s share in the escrow fund for the abandonment of the Etame Marine Permit amounting to P =44.34 million (or $870,200) and P =41.80 million (or $870,200) as of September 30, 2021 and December 31, 2020, respectively. This also includes escrow to secure payment and discharge of the Parent Company’s obligations and liabilities under the FPSO contract amounting to P =3.22 million and P =3.03 million as of September 30, 2021 and December 31, 2020, respectively. The amount for the share in escrow of the Parent Company’s obligation for the FPSO was deducted from the Parent Company’s share on lifting proceeds during the first lifting made by Etame in November 2002 and will be paid back to the Parent Company at the end of the contract in 2022. Advances to contractors Advances to contractors pertain to the downpayments to various contractors for the purchase of materials and equipment. Others Other noncurrent assets pertain to noncurrent portion of prepaid insurance and security deposits. 16. Accounts Payable and Accrued Expenses
Accounts payable Accrued expenses Utilities Interest Sick/vacation leaves Due to related party Professional fees Profit share Others Withholding taxes and other tax payables Provision for probable loss Due to NRDC
Unaudited 30-Sep-21 P =107,454,340
Audited 31-Dec-20 =108,742,621 P
169,013,821 105,987,340 18,545,039 1,760,071 5,164,271 989,786 3,707,285 6,983,909
138,895,513 46,686,129 17,373,564 1,192,620 20,110,749 8,019,499 7,053,531 12,502,369 3,566,020 2,269,737
–
2,269,737
- 47 -
Others
Unaudited 30-Sep-21 773,820 P =422,649,419
Audited 31-Dec-20 1,169,357 =367,581,709 P
Accounts payable mainly consists of payable to suppliers and contractors that are currently involved in the development, construction and operations of energy projects. Accounts payable also include unclaimed checks pertaining to dividends payable amounting to P =10.66 million as of September 30, 2021 and December 31, 2020. The Group’s accounts payable and accrued expenses are due within one year. 17. Loans Payable The Group’s loans payable as of September 30, 2021 and December 31, 2020 follow:
Principal, balance at beginning of year Add availments during the year Less principal payments during the year Principal, balance at end of year Less unamortized deferred financing cost Less current portion - net of unamortized deferred financing cost Noncurrent portion
Audited Unaudited 31-Dec-20 30-Sep-21 P5,360,170,129 P =4,768,970,779 = 778,500,000 78,500,000 1,369,699,350 355,674,675 4,768,970,779 4,491,796,104 40,766,823 25,610,691 4,728,203,956 4,466,185,413 874,773,107 P =3,591,412,306
855,279,695 =3,872,924,261 P
PetroEnergy’s short-term loans payable PetroEnergy entered into unsecured loan agreements specifically to finance its Etame Expansion Project and investments in Renewable Energy Projects. Omnibus Credit Line Agreement (OCLA) with the Development Bank of the Philippines (DBP) PetroEnergy entered into unsecured loan agreements specifically to finance its Etame Expansion Project and investments in Renewable Energy Projects.
On April 27, 2015, PetroEnergy entered into an OCLA with the DBP which provides a credit facility in the principal amount not exceeding P =420.00 million. On June 29, 2016 the credit facility was increased to P =500.00 million. Loans payable to DBP amounted to P =78.50 million with interest rate of 5.5% and maturity on May 14, 2021. This was rolled-over for another 180 days to mature on November 8, 2021.
Short-term Loan with Rizal Commercial Banking Corporation (RCBC) In 2020, PetroEnergy obtained a clean loan from RCBC amounting to P =150.00 million with interest rate of 4.5% and maturing on November 15, 2021. Interest expense related to these loans amounted to P =8.53 million, P =17.02 million as of September 30, 2021 and December 31, 2020, respectively. Accrued interest payable amounted to P =1.23 million and =1.16 million as of September 30, 2021 and December 31, 2020, respectively. P
- 48 PetroGreen’s long-term loans payable Credit Line Facility with Chinabank On November 17, 2015, PetroGreen entered into a 5-year credit line facility with Chinabank amounting to = P500.00 million, subject to repricing on the third anniversary. On the same date, P =400.00 million out of the total loan facility were drawn by PetroGreen. The loan has an annual interest rate of 5.24% and has no collateral. The loan is payable every 17th of May and November beginning on May 2017. The agreement further specifies that 96.50% of the aggregate principal amount shall be paid on the due date of the loan. On November 29, 2016, PetroGreen has drawn an additional P =30.00 million out of the total loan facility. The additional loan from Chinabank has an annual interest rate of 5.33%. On November 17, 2018, the P =400.00 million and P =30.00 million long-term loans payable with interest rate of 5.24% and 5.33%, respectively, were repriced to 8.28% and 8.47%. In 2019, PetroGreen negotiated for the reduction in the interest rates of the aforementioned loans from 8.28% and 8.47% to 7.14% for both loans. The reduced interest rate was approved by the bank and made effective starting September 19, 2019. This amendment did not result to an extinguishment of the loan. As of December 31, 2019, outstanding balance of the loan, net of unamortized deferred financing costs, amounted to P =416.45 million. The loan was paid in November 17, 2020. Long-term loan with RCBC On November 16, 2020, PetroGreen obtained a new long-term unsecured loan with RCBC amounting to = P400.00 million. The proceeds from this loan was used to pay the outstanding P =417.10 million loan from Chinabank. The new loan bears interest at a fixed rate of 4.74% payable semi-annually. The principal amount is payable in five equal annual installments starting November 11, 2021. As of September 30, 2021 and December 31, 2020, the outstanding balance of the loan, net of unamortized deferred financing costs, amounted to P =398.45 million and P =397.93 million, respectively. Interest expense related to these loans amounted to P =15.72 million and P =31.47 million as of September 30, 2021 and December 31, 2020, respectively. Accrued interest payable amounted to P =6.46 million and = P2.13 million as of September 30, 2021 and December 31, 2020, respectively. MGI’s long-term loans payable Project Loan Facility Agreements with RCBC On May 19, 2016, MGI, together with PetroGreen, PHINMA and PNOC RC executed the Project Loan Facility Agreement with RCBC for a P =1,400.00 million project loan to finance the design, development and construction of MGPP-2 or M2. On September 5, 2016, MGI, together with PetroGreen, PHINMA and PNOC RC executed another Project Loan Facility Agreement with RCBC for a P =2,100.00 million project loan to finance the design, development and construction of MGPP-1 or M1. This was done to consolidate the outstanding principal of the term loan under the 2011 OLSA with RCBC and BPI, incidental costs, general corporate expenditures and working capital requirement.
- 49 a. MGPP-1 or M1 new Loan The new MGPP-1 or M1 loan amounting to P =2,100.00 million has a term of ten (10) years from the drawdown date of October 10, 2016. Interest and principal are payable semi-annually. Interest payment started on October 12, 2016, while the twenty (20) semi-annual principal payments started on April 12, 2017. Interest rate is fixed for the first five (5) years from drawdown date, based on the sum of the prevailing 5-year fixed benchmark rate on the pricing date and the margin of 1.75% (the “Initial Interest Rate”). On the repricing date, the interest for the remaining five (5)-year term of the loan will be the higher of (i) the sum of then prevailing 5-year fixed benchmark rate plus the margin of 1.75%, or (ii) the initial interest rate. As of September 30, 2021 and December 31, 2020, the outstanding balance of this loan amounted to P =1,361.90 million and P =1,465.00 million, respectively. Interest expense recognized from the new M1 Loan amounted to P =63.11 million and P =94.05 million as of September 30, 2021 and December 31, 2020, respectively. b. MGPP-2 or M2 Expansion Loan The MGPP-2 or M2 Expansion Loan amounting to P =1,400.00 million has a term of twelve (12) years including thirty-six (36) months grace period from initial drawdown date of June 2, 2016. Interest and principal are payable semi-annually. Interest payment started on October 12, 2016, while the eighteen (18) semi-annual principal payments started on October 12, 2019. Interest rate is fixed for the first seven (7) years from the initial drawdown date based on the sum of the prevailing 7-year fixed benchmark rate on the pricing date and the applicable margin of (1) 2.25% per annum prior to commercial operations date, or (2) 1.75% per annum from and after the Commercial Operations Date (the “Initial Interest Rate”). For subsequent drawdowns, interest rate will be the three (3) –day simple average interpolated rate based on the remaining tenor and computed using the straight-line method. On the repricing date, the interest for the remaining five (5)-year term of the loan will be the higher of (i) the sum of the then prevailing 5-Year fixed benchmark rate plus the applicable margin, or (ii) the weighted average interest rate during the first seven (7) years of the loan. As of September 30, 2021 and December 31, 2020, the outstanding balance of this loan amounted to = P1,143.21 million and P =1,204.11 million, respectively. Interest expense amounted to =63.31 million, and P P =92.71 million as of September 30, 2021 and December 31, 2020, respectively. Accrued interest payable of MGI’s loans amounted to P =71.20 million and P =35.46 million as of September 30, 2021 and December 31, 2020, respectively. The loan covenants covering the outstanding debt of MGI include, among others, the following conditions: maintenance at all times of Debt-to-Equity (DE) Ratio of not greater than 70:30, Default Debt Service Coverage Ratio (DSCR) of at least 1.10x both until full payment of the Loans, and Dividend DSCR of at least 1.20x. MGI is also required to transfer in the DSPA equivalent to onesixth (1/6) of the amount sufficient to pay for the forthcoming debt service scheduled in April and October of every year until the loan is fully paid off (see Note 9). As of September 30, 2021 and December 31, 2020, MGI has been compliant with the above conditions. PetroSolar’s long-term loans payable On November 12, 2015, the PetroSolar, together with PetroGreen and EEIPC, as third party mortgagors and pledgors, entered into a P =2,600.00 million OLSA with PNB and DBP specifically to partially finance the design, development, procurement, construction, operation and maintenance of its TSPP.
- 50 -
PetroSolar shall fully pay the loan for the pro-rata account of each lender within twelve (12) years from and after the date of the initial drawdown. Interest and principal are payable semi-annually. Interest payment started on May 27, 2016, while the twenty-two (22) semi-annual principal payments started on November 27, 2016. The rate of the interest applicable to the facility or the relevant part thereof for each interest period shall be fixed for the first seven periods (7) from the initial drawdown date (the Initial Interest Rate). Prior to the FIT entitlement and collection of FIT revenues of the borrower, the rate shall be the higher of: (i) the aggregate of the seven (7) year PDST-R2 and the initial credit spread of 2.25%, or (ii) the minimum interest rate of 5.75%. Upon FIT entitlement of at least 40MW and collection of FIT revenues by the borrower equivalent to an aggregate of at least P =473.00 million within a period not exceeding twelve (12) consecutive months, the rate shall be the higher of (i) the weighted average interest rate in previous drawdowns less the step down credit spread of 0.25%, or (ii) minimum interest rate, and which interest rate shall be applied beginning the following month immediately succeeding the month wherein the aforesaid FIT entitlement and FIT revenue collection thresholds were satisfied. PetroSolar met the criteria for FIT entitlement and aggregate collection of at least P =473 million within 12 months which resulted to a lower interest rate effective July 2017. The applicable interest rate for 2021 and 2020 is equal to 6.71%. The loan covenants covering the outstanding debt of PetroSolar include, among others, maintenance of debt-to-equity ratio of 75:25 and establishment of DSPA required balance. As of September 30, 2021 and December 31, 2020, PetroSolar is in compliance with the said loan covenants. As of September 30, 2021 and December 31, 2020, the outstanding balance of this loan amounted to ₱1,340.26 million and P =1,448.54 million, respectively. Interest expense recognized amounted to ₱102.34 million, P =120.94 million as of September 30, 2021 and December 31, 2020, respectively. Accrued interest payable amounted to P =27.10 million and P =7.92 million as of September 30, 2021 and December 31, 2020, respectively. PetroSolar mortgaged all of its property and equipment related to TSPP-1 as collateral in connection with the loan. Deferred financing costs Deferred financing costs are incidental costs incurred in obtaining the loan which includes documentary stamp tax, transfer tax, chattel mortgage, real estate mortgage, professional fees, arranger’s fee and other costs directly attributable in obtaining the loan. The balance of unamortized deferred financing costs is presented as a deduction from the loans payable account and is amortized over the term of the loan using the effective interest rate method.
18. Asset Retirement Obligation The Group has recognized its share in the abandonment costs associated with the Etame, Avouma and Ebouri oilfields located in Gabon, West Africa, geothermal field located in Sto. Tomas Batangas, and photovoltaic (PV) solar power facility in Tarlac.
- 51 Movements in this account follow: Audited 31-Dec-20 =90,621,021 P 17,448,816 4,129,022 (3,039,180) =109,159,679 P
Unaudited 30-Sep-21 P =109,159,679
Balance at beginning of year Change in estimates Accretion expense Foreign exchange adjustment Balance at end of year
–
2,593,340 3,952,429 P = 115,705,448
19. Equity Under the existing laws of the Republic of the Philippines, at least 60% of the Parent Company’s issued capital stock should be owned by citizens of the Philippines for the Parent Company to own and hold any mining, petroleum or renewable energy contract area. As of September 30, 2021 and December 31, 2020, the total issued and subscribed capital stock of the Parent Company is 99.83% Filipino and 0.17% non-Filipino. As of September 30, 2021 and December 31, 2020, paid-up capital consists of: Capital stock - P =1 par value Authorized - 700,000,000 shares Issued and outstanding Additional paid-in capital
P =568,711,842 2,156,679,049 = P2,725,390,891
The Group’s track record of capital stock follows:
Listing by way of introduction August 11, 2004 Add (deduct): 25% stock dividend 30% stock dividend 1:1 stock rights offering December 31, 2010 Deduct: Movement December 31, 2011 Deduct: Movement December 31, 2012 Deduct: Movement December 31, 2013 Deduct: Movement December 31, 2014 Add (Deduct): 2:1 stock rights offering December 31, 2015 Deduct: Movement December 31, 2016 Deduct: Movement December 31, 2017
Number of shares registered
Issue/offer price
Date of SEC approval
84,253,606
P =3/share
August 4, 2004
21,063,402 31,595,102
P =1/share P =1/share
September 6, 2005 September 8, 2006
136,912,110 273,824,220 − 273,824,220 − 273,824,220 − 273,824,220
=5/share P
May 26, 2010 2,149 (26) 2,123 (10) 2,113 (41) 2,072 (29) 2,043
273,824,220 136,912,110 410,736,330 − 410,736,330 − 410,736,330
Number of holders as of year-end
P =4.38/share
June 3, 2015
(15) 2,028 (1) 2,027 (15) 2,012
- 52 Add (Deduct): 1.2:6 stock rights offering December 31,2018 Deduct: Movement December 31,2019 Deduct: Movement December 31,2020 Movement September 30,2021
157,975,512 568,711,842 − 568,711,842 − 568,711,842 − 568,711,842
P =4.8/share
January 8, 2018
(8) 2004 (5) 1,999 (1) 1,998 (2) 1996
On July 26, 2017, at the BOD meeting, the Parent Company was authorized to raise approximately one billion pesos (P =1,000,000,000) in capital, by offering and issuing to all eligible stockholders as of record date, the rights to subscribe up to all of the existing unissued common shares of the Parent Company (“Stock Rights Offer”). On September 29, 2017, the Parent Company filed its application for the listing and trading of rights shares with the PSE. On December 13, 2017, the PSE approved the application to list the Rights Shares. The rights offer entitled eligible stockholders as of record date of January 12, 2018 to subscribe to one rights share for every 2.6 shares held at an offer price of P =4.80 per share. The rights offer was undertaken on January 22 to 26, 2018. Following the close of the offer period, the Parent Company successfully completed the stock rights offer for 157,975,512 common shares with gross proceeds of P =758.28 million and was subsequently listed on the PSE on February 2, 2018. The proceeds from the stock rights offer were used for the development and expansion plans of the Group’s renewable energy projects, general corporate requirements, and payments of loans and the related interest. Appropriated Retained Earnings On January 15, 2008, the BOD approved the appropriation of P =20.00 million for the development of the Ebouri oilfield in Gabon, West Africa in addition to the P =30.00 million originally appropriated amount. On July 24, 2008, the BOD approved additional appropriation of retained earnings amounting to =44.14 million for the development of the Ebouri oil field in Gabon, West Africa. P On February 19, 2013, the BOD approved additional appropriated retained earnings amounting to =44.45 million to cover for the Group’s share in the cost of the committed wells in the Etame oilfield P in Gabon, West Africa. On July 12, 2018, the BOD approved the reversal of the appropriation amounting to P =138.59 million to unappropriated retained earnings since the above appropriations have been served. Dividends On July 26, 2018, the Parent Company declared cash dividends amounting to P =28,435,592 or P =0.05 per share to stockholders of record as of August 24, 2018 and was paid on September 20, 2018 (nil in 2019 and 2020). Cumulative Translation Adjustment In 2018, because of the change in business circumstances of the Parent Company, management changed its functional currency from United States Dollar (USD) to PHP effective January 31, 2018. All
- 53 resulting exchange differences in the remeasurement of USD balances to PHP balances were recognized as ‘Cumulative Translation Adjustment’. Equity Reserve On June 9, 2015, PetroEnergy sold its 10% interest in PetroGreen to EEIPC, bringing its ownership in PetroGreen from 100% to 90%. The transaction was accounted as an equity transaction since there was no change in control. The effect of change in the ownership interest in PetroGreen on the equity attributable to owners of PetroEnergy is summarized as follows: Consideration received from non-controlling interest Carrying amount of non-controlling interest sold, net of related cost Excess of consideration received recognized in equity
P =206,000,000 (125,950,762) P =80,049,238
Capital Management The primary objective of the Group’s capital management is to ensure that it maintains a strong credit rating and healthy capital ratios in order to support its business and maximize shareholders’ value. The Group manages its capital structure and makes adjustments to it, in light of changes in economic conditions. To maintain or adjust the capital structure, the Group may increase its debt from creditors, adjust the dividend payment to shareholders or issue new shares. As of September 30, 2021 and December 31, 2020, the Group monitors capital using a debt-to-equity ratio, which is total liabilities divided by total equity. The Group’s sources of capital as of September 30, 2021 and December 31, 2020 are as follows:
Loans payable Capital stock Additional paid-in capital Retained earnings Equity reserve
Audited Unaudited 31-Dec-20 30-Sept-21 P4,728,203,956 P =4,466,185,413 = 568,711,842 568,711,842 2,156,679,049 2,156,679,049 2,337,064,060 2,660,524,005 80,049,238 80,049,238 =9,870,708,145 P =9,932,149,547 P
The table below demonstrates the debt-to-equity ratio of the Group as of September 30, 2021 and December 31, 2020:
Total liabilities Total equity Debt-to-equity ratio
Audited Unaudited 31-Dec-20 30-Sept2-1 P5,574,407,790 P =5,367,078,997 = 7,830,917,715 8,272,858,978 0.71:1 0.65:1
Based on the Group’s assessment, the capital management objectives were met in September 30, 2021 and December 31, 2020.
- 54 -
20. Revenues For the periods ended (Unaudited) 30-Sept-20 30-Sept-21 =1,373,845,299 P =1,363,330,959 P 241,747,751 336,169,289 93,774,674 42,209,262 =1,709,367,724 P =1,741,709,510 P
Electricity sales Oil revenues Other revenues
21. Cost of Sales For the periods ended (Unaudited) 30-Sept-20 30-Sept-21 =583,026,028 P P =577,551,983 212,933,713 220,737,629 5,177,408 18,596,180 92,747,944 41,864,533 =893,885,093 P P =858,750,325
Cost of sales - Electricity Cost of sales - Oil Production Change in crude oil inventory Other cost of sales
22. Related Party Transactions Parties are considered to be related if one party has the ability, directly or indirectly, to control the other party or exercise significant influence over the other party in making financial and operating decisions. Parties are considered to be related if one party has the ability, directly or indirectly, to control the other party in making financial and operating decisions or the parties are subject to common control or common significant influence (referred to as ‘Affiliates’). Related parties may be individuals or corporate entities. Significant transactions with related parties are as follows:
Related Party/Nature Investor House of Investments, Inc Internal audit services Joint Venture PetroWind Rental income Timewriting fee Management income Advances
(Forward)
Outstanding Balance Transactions for the Period Receivables (Payables) 31-Dec-2020 30- Sep-2021 31-Dec-2020 30-Sep-2021 655,200
=1,483,821 P
642,857 7,149,997 1,500,000 6,106,341
857,143 11,252,890 2,000,000 8,301,126
=1,192,620) (P =1,760,071) (P
− 1,611,274 − 760,218 2,371,492
− 578,331 − 123,577 701,908
Terms and Conditions Note a
Note b Note c Note c
- 55 -
Related Party/Nature Affiliate AC Energy Corporation (ACEN) Electricity sales Wheeling/NGCP Charges
Affiliate EEI Power Corporation Other income
Outstanding Balance Transactions for the Period Receivables (Payables) 30-Sep-2021 31-Dec-2020 30- Sep-2021 31-Dec-2020
749,502,970 42,209,262
1,044,249,958 116,377,508
-
=550,000 P
Terms and Conditions
104,392,538 103,806,730 31,804,814 12,584,870 136,197,352 116,391,600
Note d Note d
=1,232,000 P =1,232,000 P P117,132,888 P =138,040,773 =
Note e
a. PetroEnergy has an Internal Audit Engagement arrangement with House of Investments, Inc. (HI). The internal audit services amounted to P =873,600 for 2020. In 2020, HI rendered additional internal audit service amounting to P =610,221 (nil as of September 30, 2021) .These are non-interest bearing and are due and demandable. b. PetroGreen charges rental fees to PetroWind amounting to P =71,429 every month. These are non-interest bearing and payable when due and demandable. c. Timewriting fees are charged by PetroGreen for accounting, legal management and other support services rendered to PetroWind. Management income refers to charges by PetroEnergy to PetroWind. These are non-interest bearing and are due and demandable.Advances represent reimbursements of costs and expenses. d. Electricity sales to ACEN (formerly PHINMA) is pursuant to the Electricity Supply Agreement. This is due and payable on the last business day of the month succeeding the billing period and non-interest bearing if paid within the due date. e. In 2020, PetroGreen charged EEI Power Corporation (EEIPC) amounting to ₱550,000 plus VAT representing charges for the equity valuation study, (nil as of September 30, 2021). f.
On November 12, 2015, PetroSolar entered into a P =2.6 billion OLSA with PNB and DBP. PetroGreen and EEIPC signed as the third party mortgagors and pledgors.
g. PetroWind executed an OLSA with DBP for a loan facility amounting to P =3.0 billion. PetroEnergy signed as guarantor and PetroGreen signed as guarantor, pledgor and third-party mortgagor. 23. Financial Instruments The Group’s principal financial instruments include cash and cash equivalents, financial assets at FVTPL, receivables, restricted cash, loans payable, accounts payable, accrued expenses and dividends payable. The main purpose of these financial instruments is to fund the Group’s working capital requirements. Categories and Fair Values of Financial Instruments As of September 30, 2021 and December 31, 2020 the carrying amounts of the Group’s financial assets and financial liabilities approximate their fair values except for loans payable and lease liabilities. The
- 56 fair value of the loans payable as of September 30, 2021 and December 31, 2020 amounted to P =4.83 billion and the fair value of lease liabilities amounted to P =466.80 million. The methods and assumptions used by the Group in estimating the fair value of financial instruments are: Financial instruments Cash and cash equivalents, restricted cash, receivables, accounts payable and accrued expenses, and short-term loans payable
Considerations Due to the short-term nature of the instruments, carrying amounts approximate fair values as at the reporting date.
Equity securities
Fair values are based on published quoted prices.
Golf club shares
Fair values are based on quoted market prices at reporting date.
Long-term loans payable
Fair value is based on the discounted value of expected future cash flows using the applicable interest rate for similar type of instruments. The fair value is derived using the prevailing PH BVAL rate.
Lease liabilities
Estimated fair value is based on the discounted value of future cash flows using the prevailing PH BVAL rate.
The fair value is based on the source of valuation as outlined below:
quoted prices in active markets for identical assets or liabilities (Level 1); those involving inputs other than quoted prices included in Level 1 that are observable for the asset or liability, either directly or indirectly (Level 2); and those with inputs for the asset or liability that are not based on observable market data (unobservable inputs) (Level 3).
As of September 30, 2021 and December 31, 2020, there were no transfers of financial instruments among all levels. Financial Risk Management Objectives and Policies The Group manages and maintains its own portfolio of financial instruments in order to fund its own operations and capital expenditures. Inherent in using these financial instruments are the following risks on liquidity, market and credit. Financial Risks The main financial risks arising from the Group’s financial instruments are liquidity risk, market risk and credit risk. Liquidity Risk Liquidity risk is the risk that the Group is unable to meet its financial obligations when due. The Group monitors its cash flow position and overall liquidity position in assessing its exposure to liquidity risk. The Group maintains a level of cash and cash equivalents deemed sufficient to finance its operations and to mitigate the effects of fluctuation in cash flows. To cover its short-term and long-term funding requirements, the Group intends to use internally generated funds as well as to obtain loan from financial institutions. As of September 30, 2021 and December 31, 2020, the Group has existing credit line facilities from which they can draw funds from.
- 57 -
The tables below summarize the maturity profile of the Group’s financial assets and financial liabilities as of September 30, 2021 and December 31, 2020 based on contractual payments:
On demand Financial Assets Financial assets at FVTPL Financial assets at amortized cost: Cash and cash equivalents Accounts receivable Other receivables Interest receivable Refundable deposits Restricted cash Financial Liabilities Financial liabilities at amortized cost: Loans payable Lease liabilities Accounts payable and accrued expenses Net financial assets (liabilities)
Financial Liabilities Financial liabilities at amortized cost: Loans payable** Lease liabilities Accounts payable and accrued expenses* Net financial assets (liabilities)
Total
P =7,481,373
P =−
P =−
P = 7,481,373
1,469,978,900 18,232,723 − 973,582 − 154,417,937 1,651,084,515
− 262,402,095 − − 324,721 627,349,086 890,075,902
− 2,638,759 3,526,250 − 5,161,372 47,561,341 58,887,722
1,469,978,900 283,273,577 3,526,250 973,582 5,486,093 829,328,364 2,600,048,139
− −
874,773,107 39,823,778
3,591,412,306 286,211,607
4,466,185,413 326,035,385
− 914,596,885 (P = 24,520,983)
− 3,877,623,913 (P = 3,818,736,191)
422,649,419 5,214,870,217 (P = 2,614,822,078)
422,649,419 422,649,419 P =1,228,435,096
On demand Financial Assets Financial assets at FVTPL Financial assets at amortized cost: Cash and cash equivalents Accounts receivable Interest receivable Other receivables Refundable deposits Restricted cash
30-Sep-2021(Unaudited) More than 1 year or less 1 year
31-Dec-2020 (Audited) More than 1 year or less 1 year
Total
P =7,531,587
= P−
= P−
P =7,531,587
1,267,332,044 29,035,850 − 895,945 − 154,118,649 1,458,914,075
− 240,119,247 − − 324,721 394,892,804 635,336,772
− 994,603 2,526,250 − 16,583,984 44,833,232 64,938,069
1,267,332,044 270,149,700 2,526,250 895,945 16,908,705 593,844,685 2,159,188,916
− − 416,485,403 416,485,403 P =1,042,428,672
855,988,810 35,383,562 − 891,372,372 (P =256,035,600)
4,093,526,940 723,514,761 − 4,817,041,701 (P =4,752,103,632)
4,949,515,750 758,898,323 416,485,403 6,124,899,476 (P =3,965,710,560)
*Excluding statutory payables **Includes future interest payments
b. Market Risk Market risk is the risk of loss on future earnings, on fair values or on future cash flows that may result from changes in market prices. The value of a financial instrument may change as a result of changes in equity prices, foreign currency exchanges rates, interest rates and other market changes. Foreign Exchange Risk Foreign currency risk is the risk that the value of the Group’s financial instruments denominated other than the Group’s functional currency diminishes due to unfavorable changes in foreign exchange rates. The Group’s transactional currency exposures arise from cash and cash equivalents, receivables and accounts payable and accrued expenses.
- 58 The Group’s foreign currency-denominated financial instruments as September 30, 2021 and December 31, 2020 follow:
Financial assets Cash and cash equivalents Receivables Restricted Cash Financial liabilities Accounts payable and accrued expenses Net exposure
31-Dec-2020 US Peso Dollar Equivalent
US Dollar
30-Jun-2021 Peso Equivalent
$2,126,696 965,007 870,201 3,961,904
P =108,374,301 49,175,792 44,344,573 201,894,666
$504,969 627,158 933,325 2,065,452
=24,256,708 P 30,126,160 44,833,232 99,216,100
– $–
– P =–
276,820 $1,788,632
13,297,309 P85,918,791 =
As of September 30, 2021 and December 31, 2020, the exchange rates used for conversion are ₱50.959 and P =48.036 per $1, respectively. There is no other impact on the Group’s equity other than those already affecting income before income tax. Interest Rate Risk The Group’s exposure to market risk for changes in interest rates relates primarily to the Group’s loans payable. Interest rate of loans payable is fixed for the first five (5) years or first seven (7) years and will be repriced thereafter. There is no other impact on the Group’s equity other than those already affecting income before income tax. c. Credit Risk Credit risk is the possibility of loss for the Group if its receivable counterparties fail to discharge their contractual obligations. With respect to credit risk arising from the other financial assets of the Group, which comprise of cash and cash equivalents, receivables, financial assets at FVTPL, and restricted cash, the Group’s exposure to credit risk could arise from default of the counterparty. The Group trades only with recognized, creditworthy third parties. However, the Group’s credit risk exposure is concentrated on a few counterparties as inherent in the oil exploration and production and renewable energy businesses. The Group has a well-defined credit policy and established credit procedures. In addition, receivable balances are being monitored on a regular basis to ensure timely execution of necessary intervention efforts.
- 59 The table below summarizes the Group’s gross maximum credit risk exposure from its financial instruments and contract asset. These amounts are gross of collateral and credit enhancements, but net of any amounts offset and allowance for impairment losses: 30-Sep-2021
31-Dec-2020
Financial assets: Cash in banks and cash equivalents Receivables Financial assets at FVTPL Refundable deposits Restricted cash Contract asset
=1,263,308,043 P =1,465,954,900 P 273,571,895 287,773,409 7,531,587 7,481,373 16,908,705 5,161,372 593,844,685 829,328,364 146,067,517 140,876,302 =2,301,232,432 P =2,736,575,720 P An impairment analysis is performed at each reporting date using a provision matrix to measure ECL. The mechanics of the ECL calculations and the key elements are, as follows: a. Probability of default (PD) is an estimate of the likelihood of default over a given time horizon. b. Exposure at default (EAD) is an estimate of the exposure at a future default date taking into account expected changes in the exposure after the reporting date. c. Loss given default (LGD) is an estimate of the loss arising in the case where a default occurs at a given time. ECLs are recognized in two stages. For credit exposures for which there has not been a significant increase in credit risk since initial recognition, ECLs are provided for credit losses that result from default events that are possible within the next 12-months (a 12-month ECL). For those credit exposures for which there has been a significant increase in credit risk since initial recognition, a loss allowance is required for credit losses expected over the remaining life of the exposure, irrespective of the timing of the default (a lifetime ECL). In its ECL models, the Group relies on a broad range of forward-looking information as economic inputs. The inputs and models used for calculating ECLs may not always capture all characteristics of the market at the date of the financial statements. To reflect this, qualitative adjustments or overlays are occasionally made as temporary adjustments when such differences are significantly material. The table below shows the aging by class of asset for the Group’s financial assets and contract asset as of September 30, 2021 and December 31, 2020: 30-Sep-2021(Unaudited)
Current Financial assets: Cash and cash equivalents* P = 1,465,954,900 Accounts receivable 283,273,577 Other receivables 3,526,250 Interest receivable 973,582 Financial assets at FVTPL 7,481,373 Refundable deposits 5,161,372 Restricted cash 829,328,364 Contract asset 140,876,302 P = 2,736,575,720 *excluding cash on hand
More than 90 days
Credit impaired
Total
P =− − − −
P =− P = 1,465,954,900 2,682,452 285,956,029 − 3,526,250 − 973,582
− − − − P =−
− 7,481,373 − 5,161,372 − 829,328,364 − 140,876,302 P =2,682,452 P = 2,739,258,172
- 60 -
31-Dec-2020 (Audited)
Current Financial assets: Cash and cash equivalents* Accounts receivable Interest receivable Other receivables Financial assets at FVTPL Refundable deposits Restricted cash Contract asset
More than 90 days
Credit impaired
Total
P =1,263,308,043 270,149,700 2,526,250 895,945
=− P − − −
=− P P =1,263,308,043 2,682,452 272,832,152 − 2,526,250 − 895,945
7,531,587 16,908,705 593,844,685 146,067,517 = P2,301,232,432
− − − − =− P
− 7,531,587 − 16,908,705 − 593,844,685 − 146,067,517 =2,682,452 P P =2,303,914,884
*excluding cash on hand
Financial assets are classified as high grade if the counterparties are not expected to default in settling their obligations. Thus, credit risk exposure is minimal. Financial assets are classified as a standard grade if the counterparties settle their obligation with the Group with tolerable delays. Low grade accounts are accounts, which have probability of impairment based on historical trend. These accounts show propensity of default in payment despite regular follow-up actions and extended payment terms. The Group’s cash in banks, cash equivalents, accounts receivable, interest receivable and restricted cash have high grade credit quality. 24. Segment Information For management purposes, the Group is organized into business units based on their products and has four reportable segments as follows:
The oil production segment is engaged in the oil and mineral exploration, development and production. The geothermal energy segment develops and operates geothermal steamfields and power plants. The solar energy segment carries out solar energy operations of the Group. Other activities pertain to research and investment activities.
No operating segments have been aggregated to form the above reportable operating segments. Management monitors the operating results of its business units separately for the purpose of making decisions about resource allocation and performance assessment. Segment performance is evaluated based on operating profit or loss and is measured consistently with operating profit or loss in the consolidated financial statements. Oil Production P =336,169,289 139,286,496 –
Geothermal Energy P =791,712,231 188,022,033 –
30-Sep-2021 (Unaudited) Other Solar Energy Activities P =613,827,990 =– P 279,808,127 209,268,077 – –
Elimination Consolidated Segment revenue P =– P =1,741,709,510 Net income (loss) (271,969,868) 544,414,865 Other comprehensive income (loss) – – Other information: Segment assets except deferred tax assets = P3,574,131,170 P =6,008,357,795 P =4,268,675,415 P =2,742,106,351 (P =2,959,076,353) P =13,634,194,378 Deferred tax assets - net P =777,332 P =3,969,332 P =996,935 = P– P =– P = 5,743,599 Segment liabilities except deferred tax liabilities P =327,167,116 P =2,959,027,921 P =1,736,818,832 P =425,804,793 (P =81,739,665) P =5,367,078,997 Deferred tax liabilities - net P =– P =– P =– =– P P =– P =– Provision for (benefit from) income tax P =10,746,953 P =12,436,400 P =26,983,615 P = 244,957 P =– P =50,411,925 Capital expenditures P =3,369,694 P =79,088,397 P =3,238,371 P =11,662,300 P =– P =97,358,762
- 61 Deferred oil exploration costs Depletion, depreciation and amortization
P =226,022,135 P =56,905,609
P =– P =190,561,618
Geothermal Energy = P1,160,627,466 282,923,201 (6,516,645)
P =– P =133,513,385
P =– P =3,364,915
P =– (P =219,440)
P =226,022,135 P =384,126,087
31-Dec-2020 (Audited) Other Solar Energy Activities = P879,290,407 P =– 413,412,580 197,987,673 111,889 1,331,146
Oil Production Elimination Consolidated Segment revenue P =292,573,199 =– = P P2,332,491,072 Net income (loss) (93,295,082) (154,837,152) 646,191,220 Other comprehensive income (loss) 3,490,089 – (1,583,521) Other information: Segment assets except deferred tax assets P =3,446,590,391 P =5,910,320,833 = P4,294,097,136 = P2,759,679,512 (P =3,016,663,233) P =13,394,024,639 Deferred tax assets - net P =777,332 P =3,969,332 =905,161 P = P– =– P = P5,651,825 Segment liabilities except deferred tax liabilities P =338,912,834 P =2,969,012,990 P =1,835,356,905 P =425,683,647 (P =207,627) P =5,568,758,749 Deferred tax liabilities - net P =– = P– =– P = P– =– P P =– Provision for (benefit from) income tax P =7,384,343 P =70,287 =33,707,896 P P =699,186 =– P = P41,861,712 Capital expenditures =26,168,256 P =162,001,340 P =21,346,049 P P1,162,270 = =– P =210,677,915 P Deferred oil exploration costs =210,533,496 P =– P =– P =– P =– P =210,533,496 P Depletion, depreciation and amortization =95,845,289 P =252,171,511 P P =176,667,277 =4,731,938 P (P =292,587) P =529,123,428
InterGroup investments, revenues and expenses are eliminated during consolidation. 25. Basic/Diluted Earnings Per Share The computation of the Group’s earnings per share follows: 30-Sep-2021 Net income attributable to equity holders of the Parent Company Weighted average number of shares Basic/diluted earnings per share
30-Sep-2020
31-Dec-2020
P =323,459,945
=202,638,207 P
P =319,412,421
568,711,842 P =0.5688
568,711,842 =0.2836 P
568,711,842 P =0.5616
Earnings per share are calculated using the net income attributable to equity holders of the Parent Company divided by the weighted average number of shares. PERC does not have potentially dilutive common stock.
- 62 -
26. Non-controlling Interests As of September 30, 2021 and December 31, 2021, non-controlling interests (NCI) pertain to the 10% shareholdings of EEIPC in PetroGreen, total shareholdings of ACEN (formerly PHINMA) [25%] and PNOC-RC (10%) in MGI and 44% shareholdings of EEIPC in PetroSolar. As of September 30, 2021 and December 31, 2020, the accumulated balances of and net income attributable to non-controlling interests are as follows: Unaudited 30-Sep-21 Accumulated balances of non-controlling interests: PetroSolar MGI PetroGreen
P =1,114,455,548 1,096,654,722 490,473,304 P =2,701,583,574 Unaudited 30-Sep-21
Net income attributable to non-controlling interests: PetroSolar MGI PetroGreen
P =123,115,576 65,807,711 32,031,633 P =220,954,920
Audited 31-Dec-20 =955,293,206 P 958,604,717 424,441,329 =2,338,339,252 P Audited 31-Dec-20 P92,169,424 = 112,516,161 36,411,310 =241,096,895 P
- 63 -
27. Other Matters In a move to contain the COVID-19 outbreak, on March 13, 2020, the Office of the President of the Philippines issued a Memorandum directive to impose stringent social distancing measures in the National Capital Region effective March 15, 2020. On March 16, 2020, Presidential Proclamation No. 929 was issued, declaring a State of Calamity throughout the Philippines for a period of six (6) months and imposed an enhanced community quarantine throughout the island of Luzon until April 12, 2020. For selected areas, including Metro Manila, this was subsequently extended to May 31, 2020. The ECQ was lifted and replaced by general community quarantine (GCQ) starting June 1, 2020. On March 27, 2021, NCR and neighboring areas were placed under ECQ until April 11, 2021. These measures have caused disruptions to businesses and economic activities, and its impact on businesses continue to evolve. Manpower for operations may be affected due to the stateimposed self-quarantine, partial lockdown, and curfew. With the enforcing of national and localized community quarantines, the Group has issued guidelines to mitigate risks, ensure business continuity, and safeguard the health and safety of its employees. As an energy company with investments in petroleum and renewable energy, the Group is exposed to operational risks. Manpower for operations may be affected due to state-imposed self-quarantine, partial lockdown, and curfew. To address this, the management has devised an alternative working arrangement of workfrom-home and skeletal workforce scheme for its employees. Business support units were equipped with appropriate protocols and digital tools to be able to support the operations unit and ensure continuity of business operations. The management also ensured that the insurance coverage maintained for the Group would adequately compensate for any business interruptions. Due to travel restrictions, scheduled power plant maintenance by third-party foreign suppliers may also be affected. In preparation for this, the Group has communicated with its Operations and Maintenance (O&M) providers to strengthen its remote support and provide contingencies. The Group has also ensured that the insurance coverage maintained for the Group, its subsidiaries and affiliates, would adequately compensate for any business interruptions. For the oil operations in Gabon, the Group constantly communicated with the Operator and monitored the effect of the COVID-19 pandemic in the Gabon oil field. The Operator ensured that there is continued operations in the oil field, even with travel restrictions in the country. In addition, there is also the risk relating to compliance with regulatory permits and submissions due to changes in work schedule in both the public and private sectors. As a response, the Group regularly monitors the advisories from relevant Government agencies, such as the DOE, to ensure that requirements are submitted on time. The Group considered the events surrounding the outbreak in its financial position and performance as of September 30, 2021 and December 31, 2020. Even the impact for periods thereafter will be considered. Considering the evolving nature of this outbreak, the Group cannot determine at this time the impact to its financial position, performance and cash flows subsequent to September 30, 2021. The Group will continue to monitor the situation.
- 64 -
28. Others a. The Interim Financial Report (September 30, 2021) is in compliance with generally accepted accounting principles. b. The same policies and methods of computation were followed in the preparation of the interim financial report compared to the December 31, 2020 Consolidated Audited Financial Statements. c. No unusual item or items affected the assets, liabilities, equity and cash flows of the September 30, 2021 Financial Statements. d. Earnings per share is presented in the face of the unaudited statements of income for the period ended September 30, 2021 and December 31, 2020. e. No significant events happened during the quarter that will affect the September 30, 2021 Unaudited Financial Statements. f.
There are no seasonal aspects that had a material effect on the financial condition or results of operation of the Company.
g. There is no foreseeable event that will trigger direct or contingent financial obligation that is material to the Company, including any default of accelerated obligation. h. There are no material off-balance sheet transactions, arrangements, obligations and other relationships of the Company with other entities or persons that were created during the period. i.
There are no changes in estimates of amounts reported in prior periods of the current financial year or changes in estimates of amounts reported in prior financial years that could have material effect in the current period.
j.
Our Company has no contingent liabilities or assets during the period.
- 65 Item 2 - Management’s Discussion and Analysis or Plan of Operation 1. Management’s Discussion and Analysis (Amounts are in Philippine Peso (P)) 1. Consolidated Financial Position (As of September 30, 2021 and December 31, 2020) Unaudited 30-Sep-21 ASSETS Cash and cash equivalents Financial assets at fair value through profit and loss (FVPL) Receivables Crude oil inventory Prepaid expenses and other current assets Property and equipment-net Deferred oil exploration cost Contract assets Investment in Associate Right of use of asset Investment properties-net Deferred tax assets-net Other noncurrent assets TOTAl ASSETS LIABILITIES AND EQUITY Accounts payable and accrued expenses Loans payable - current Lease Liability-current Income tax payable Loans payable - net of current portion Lease Liability-non-current Asset retirement obligation Other noncurrent liability TOTAL LIABILITIES EQUITY Attributable to equity holders of the Parent Company Non-controlling interest TOTAL EQUITY TOTAL LIABILITIES AND EQUITY
Audited 31-Dec-20
% Change
% in Total Assets
1,469,978,900
1,267,332,044
15.99%
10.78%
7,481,373 287,773,409
7,531,587 273,571,895
-0.67% 5.19%
0.05% 2.11%
16,494,144
35,090,324
-53.00%
0.12%
983,149,822 8,054,159,544 226,022,135 140,876,302 1,700,100,039 369,127,997 1,611,533 5,743,599 377,419,180 P13,639,937,977
697,022,710 8,310,613,046 210,533,496 132,687,182 1,635,213,444 383,032,125 1,611,533 5,651,825 445,434,294 P13,405,325,505
41.05% -3.09% 7.36% 6.17% 3.97% -3.63% 0.00% 1.62% -15.27% 1.75%
7.21% 59.05% 1.66% 1.03% 12.46% 2.71% 0.01% 0.04% 2.77% 100.00%
422,649,419 874,773,107 39,823,778 8,599,357
367,581,709 855,279,695 15,393,725 7,973,817
14.98% 2.28% 158.70% 7.84%
3.10% 6.41% 0.29% 0.06%
3,591,412,306 286,211,607 115,705,448 27,903,975 5,367,078,997
3,872,924,261 320,057,378 109,159,679 26,037,526 5,574,407,790
-7.27% -10.57% 6.00% 7.17%
26.33% 2.10% 0.85% 0.20%
-3.72%
39.35%
5,571,275,406
5,247,815,461
6.16%
40.85%
2,701,583,574 8,272,858,980
2,583,102,254 7,830,917,715
4.59%
19.81%
5.64%
60.65%
P13,639,937,977
P13,405,325,505
1.75%
100.00%
Total assets amounted to P13.640 billion and P13.405 billion as of September 30, 2021 and December 31, 2020, respectively. Cash and cash equivalents consist of cash on hand, cash in banks and money market placements with original maturities of not more than three months. The 15.99% net increase from P1.267 billion as of December 31, 2020 to P1.470 billion as of September 30, 2021 is mainly due to the continuous cash inflows from operations of the group, net of payment of loan amortization, interest expense and other working capital requirements during the period.
- 66 -
Financial assets at fair value through profit and loss (FVPL) amounted to P7.481 million and P7.532 million as of September 30, 2021 and December 31, 2020, respectively. The 0.67% net decrease is due to net downward movement of the market prices of the Company’s investments in stocks traded in the Philippine Stock Exchange (PSE). The Receivables account mainly consists of receivables from electricity sales and lifting/sales of crude oil . The 5.19% increase is mainly due to continuous sales from electricity generation and higher receivables from crude oil lifting due to the recovery of crude oil price, net of collections during the period. The 53% decline in the crude oil inventory is mainly due to lower production barrels left unsold during the period.. Prepaid expenses and other current assets consist of restricted cash, supplies inventory, prepaid expenses, crude oil inventory and other current assets. The bulk of the 41.05% increase from P697.023 million to P983.15 million is mainly due to funding of the debt service payment account, and additional prepayments made for the period. Property, plant and equipment (PPE) amounted to P8.054 billion as of September 30, 2021 and P8.311 billion as of December 31, 2020. The 3.09% net decrease is mainly due to the continuous depreciation of the Renewable Energy Power Plants and depletion of the oil assets. Deferred oil exploration cost increased by 7.36% resulting from the continuous development in the Gabon oil fields. The Contract assets amounted to P140.876 million and P132.687 million as of September 30, 2021 and December 31, 2020. The 6.17% increase is due to additional FIT arrears recorded by PetroSolar covering the period January 1 to February 9, 2021 amounting to P8.189 million. Investment in associate refers to the remaining 40.00% shareholdings in PWEI. The 3.97% net increase mainly pertains to the Group’s share in net income of PWEI during the period. Right of use of asset - decline pertains to the amortization of the account for the period. The Investment properties account remains the same as of September 30, 2021. Deferred tax assets – net occurs due to timing differences in recognizing temporary deductible expenses and temporary taxable revenues such as accrued profit share, accretion expenses, accrued retirement liability, provision for probable losses, unrealized gains or losses and change in crude oil inventory. As of September 30, 2021 and December 31, 2020, this amounted to P5.744 million and P5.652 million, respectively. Other non-current assets amounted to P377.419 million and P445.434 million as of September 30, 2021 and December 31, 2020, respectively. The 15.27% net decrease is mainly due to collection of VAT refund of PetroSolar. Accounts payable and accrued expenses amounted to P422.649 million and P367.582 million as of September 30, 2021 and December 31, 2020, respectively. The 14.98% increase mainly pertains to additional accruals of interest expenses on loans and other expenses during the period. The total change in Current portion and long-term portion of loan payable is mainly due to payment of semi-annual amortization due on principal and interest on outstanding loans and amortization of deferred
- 67 financing cost. The increase in current portion of the loans payable is mainly due to reclassification of the currently maturing debts. The change in the Lease liability - current and non-current portion is mainly due to the reclassification of non-current portion to current portion. The bulk of the Income tax payable pertains to PSC’s outstanding tax payable of 5.00% of gross income under the PEZA incentives and for MGPP, 10% tax rate, after the income tax holiday (for the M1), which ended last February 8, 2021, as part of its BOI incentives under RE Law. Asset retirement obligation amounted to P115.705 million and P109.160 million as of September 30, 2021 and December 31, 2020, respectively. The 6%% net increase in this account pertains to the additional accretion during the period. Other non-current liabilities amounted to P27.904 million and P26.038 million as of September 30, 2021 and December 31, 2020, respectively. The 7.17% net increase mainly pertains to accretions made during the period. Equity attributable to equity holders of the Parent Company amounted to P5.571 billion or P9.80 book value per share as of September 30, 2021 as compared with P5.247 billion or P9.23 book value per share as of December 31, 2020. The increase is mainly due to continuous income provided by the Renewable Energy projects and the oil operations. Non-controlling interest (NCI) pertains to the following: 10% share of EEI-PC in PetroGreen;
25% share of Trans-Asia, the 10% share of PNOC-RC, and 10% of the 65% share of EEI-PC (indirect) in MGI;
44% share of EEI-PC (direct) and 10% of 56% share (indirect) in PSC;
Non-controlling interest increased by 4.59% from P2.583 billion to 2.702 billion due to the additional net income from the Renewable Energy projects.
- 68 2. Consolidated Results of Operation (for the quarter ending September 30, 2021 and September 30, 2020)
Unaudited 30-Sep-21 30-Sep-20
% Change
% to Total Revenues
REVENUES
583,508,377
549,122,193
6.26%
100.00%
COST OF SALES
301,415,107
276,139,426
9.15%
51.66%
GROSS INCOME
282,093,270
272,982,767
3.34%
48.34%
37,927,263
35,840,090
5.82%
6.50%
(83,050,428) 3,192,779 2,566,082 4,098,028 (877,892)
(96,814,416) (21,240,659) 2,120,187 (1,837,601) (1,021,235)
-14.22% 115.03% 21.03% 323.01% -14.04%
-14.23% 0.55% 0.44% 0.70% -0.15%
122,571 3,437,493 (70,511,367) 173,654,640 15,735,201 157,919,439
(5,797) 2,883,974 (115,915,547) 121,227,130 6,609,521 114,617,609
-2214.39% 19.19% -39.17% 43.25% 138.07% 37.78%
0.02% 0.59% -12.08% 29.76% 2.70% 27.06%
89,005,417 68,914,022 157,919,439
41,334,506 73,283,103 114,617,609
115.33% -5.96% 37.78%
15.25% 11.81% 27.06%
GENERAL AND ADMINISTRATIVE EXPENSES OTHER INCOME (CHARGES) Interest expense Share in net income of an Associate Interest income Net unrealized foreign exchange gain (loss) Accretion expense Net unrealized gain on fair value changes on financial assets at FVPL Miscellaneous income (charges) INCOME BEFORE INCOME TAX PROVISION FOR INCOME TAX NET INCOME NET INCOME ATTRIBUTATBLE TO: Equity Holders of the Parent Company Noncontrolling interest NET INCOME Note: Differences in amounts are due to rounding off
The Group’s consolidated net income amounted to P157.919 million for the 3rd quarter 2021, a 37.78% increase from the P114.618 million in the same period in 2020. The Group’s consolidated net income attributable to equity holders of the Parent Company amounted to P89.005 million 115.33% increase from the P41.334 million in the same period 2020. The increases are mainly due to the improvement in crude oil price and upturn of the share in the returns of the investment in PWEI. Revenues: The Group’s Revenues are from the electricity sales from the MGPP and TSPP, oil revenues from the Etame Gabon project and other miscellaneous revenues. For the 3rd quarter 2021, 77% of the total revenues is from the electricity sales while, 17% is from the oil revenues. The 6.26% net increase in revenues came mainly from oil revenues due to improved crude oil prices from an average of $43.22/bbl to $72.86/bbl.
- 69 Costs and Expenses: The Costs of sales consist of the costs of electricity sales in generating electricity power including operating and maintenance costs (O&M) of power plants and fluid collection and reinjection system (FCRS), depreciation, and other costs directly attributed to producing electricity; cost of oil production in the Etame Gabon oil operations and other costs. For the 3rd quarter 2021, 65% of the cost of sales is from the costs of electricity sales, 29% from the cost of oil production, and 6% from other costs . The 9.15% increase is due to higher variable costs of oil production due to improvement in crude oil price and costs of well-workover General and administrative expenses, Other Income (Charges) and Provision for Income Tax: The minimal 5.82% increase in General and administrative expenses (G&A) of mainly due to increased costs during the period. Below presents the itemized discussion of the changes in other income (charges):
14.22% decline in interest expense is due to the installment payment of principal loans; Upturn in share in net income of an associate is due to higher net income of PWEI for the period resulting from higher generation; Increase in interest income of 21.03% is due to higher amount of money market placements during the period; Upturn in net unrealized forex gain is mainly due to changes in forex rates from P48.465:1US$ to P50.959:1US$; Decline in accretion expense mainly due to change in estimates; Turn around in unrealized changes on financial assets at FVTPL due to slight recovery of the market values of investment in stocks; 19.19% increase in miscellaneous income due to higher time charges
Provision for income tax current pertains to PSC’s tax payable - 5.00% provision for income tax under the PEZA incentives and for MGPP, 10% tax rate, after the income tax holiday (for the M1), which ended last February 8, 2021, as part of its BOI incentives under RE Law. Non-controlling interest (NCI) as of September 30, 2021 and same period 2020 pertains to the following: 10% share of EEI-PC in PetroGreen; 25% share of Trans-Asia, the 10% share of PNOC-RC, and 10% of the 65% share of EEI-PC (indirect) in Maibarara; 44% share of EEI-PC (direct) and 10% of 56% share (indirect) in to PetroSolar;
- 70 -
3.
Consolidated Financial Position (September 30, 2021 and September 30, 2020) Unaudited 30-Sep-21
ASSETS Cash and cash equivalents Financial assets at fair value through profit and loss (FVPL) Receivables Crude oil inventory Prepaid expenses and other current assets Property and equipment-net Deferred oil exploration cost Contract assets Investment in Associate Right of use of asset Investment properties-net Deferred tax assets-net Other noncurrent assets TOTAl ASSETS LIABILITIES AND EQUITY Accounts payable and accrued expenses Loans payable - current Lease Liability-current Income tax payable Loans payable - net of current portion Lease Liability-non-current Asset retirement obligation Other noncurrent liability TOTAL LIABILITIES EQUITY Attributable to equity holders of the Parent Company Non-controlling interest TOTAL EQUITY TOTAL LIABILITIES AND EQUITY
Audited 30-Sep-20
% Change
% in Total Assets
1,469,978,900
1,219,938,699
20.50%
10.78%
7,481,373 287,773,409
6,357,069 284,083,842
17.69% 1.30%
0.05% 2.11%
16,494,144
5,986,142
175.54%
0.12%
983,149,822 8,054,159,544 226,022,135 140,876,302 1,700,100,039 369,127,997 1,611,533 5,743,599 377,419,180 P13,639,937,977
930,859,120 8,398,965,198 195,410,978 1,584,311,420 385,768,345 1,611,533 12,711,363 468,567,332 P13,494,571,041
5.62% -4.11% 15.67% 0.00% 7.31% -4.31% 0.00% -54.82% -19.45% 1.08%
7.21% 59.05% 1.66% 1.03% 12.46% 2.71% 0.01% 0.04% 2.77% 100.00%
422,649,419 874,773,107 39,823,778 8,599,357
358,104,664 1,149,652,979 16,588,113 8,340,341
18.02% -23.91% 140.07% 3.11%
3.10% 6.41% 0.29% 0.06%
3,591,412,306 286,211,607 115,705,448 27,903,975 5,367,078,997
3,853,552,855 318,854,915 91,183,236 14,999,908 5,811,277,011
-6.80% -10.24% 26.89% 86.03%
26.33% 2.10% 0.85% 0.20%
-7.64%
39.35%
5,571,275,406
5,130,108,971
8.60%
40.85%
2,701,583,574 8,272,858,980
2,553,185,059 7,683,294,030
5.81%
19.81%
7.67%
60.65%
P13,639,937,977
P13,494,571,041
1.08%
100.00%
Total assets amounted to P13.640 billion and P13.495 billion as of September 30, 2021 and September 30, 2020, respectively. Cash and cash equivalents consist of cash on hand, cash in banks and money market placements with original maturities of not more than three months. The 20.50% net increase from P1.219 billion to P1.470 billion is mainly due to continuous receipt from electricity sales and oil revenues, net of payment of amortization of loans , interest expenses and other working capital requirements. Financial assets at fair value through profit and loss (FVPL) amounted to P7.481 million and P6.357 million as of September 30, 2021 and same period 2020, respectively. The 17.69% net increase is due to slight recovery of the market prices of the Company’s investments in stocks traded in the Philippine Stock
- 71 Exchange (PSE). The Receivables account mainly consists of receivables from electricity sales and lifting/sales of crude oil The 1.30% increase is mainly due to continuous sales from electricity generation and higher receivables from crude oil lifting due to the recovery of crude oil price, net of collections during the period. Increase in crude oil inventory account is mainly due to higher number of barrels left unsold and higher crude oil price. Prepaid expenses and other current assets consist of restricted cash, supplies inventory, prepaid expenses, crude oil inventory and other current assets. The bulk of the 5.62% increase is mainly due advance payment made on the October 2021 cash call for the Oil Operations and funding of the reserve accounts. Property, plant and equipment (PPE) amounted to P8.054 billion and P8.399 billion as of September 30, 2021 and September 30, 2020, respectively. The 4.11% net decrease is mainly due to continuous depreciation of the Renewable Energy Power Plants and depletion of the oil assets. The 15.67% movement of Deferred oil exploration cost is mainly due to the continuous development in the Gabon oil fields. Investment in associate refers to the remaining 40.00% shareholdings in PWEI. The 7.31% net increase mainly pertains to the Group’s share in net income of PWEI during the period, net of dividend declaration. Right of use of asset declined by 4.31% mainly because of the amortization of the account. Deferred tax assets – net occurs due to timing differences in recognizing temporary deductible expenses and temporary taxable revenues such as accrued profit share, accretion expenses, accrued retirement liability, provision for probable losses, unrealized gains or losses and change in crude oil inventory. As of September 30, 2021 and September 30, 2020, this amounted to P5.744 million and P12.711 million, respectively. Other non-current assets declined by 19.45% mainly due to amortization of land rights and intangible assets. Accounts payable and accrued expenses amounted to P422.649 million and P358.105 million as of September 30, 2021 and September 30, 2020, respectively. The 18.02% increase mainly pertains to set-up of payables during the period. Loans payable - current and Loans payable –non-current portion declined mainly because of settlement and amortization of principal due. The bulk of the Income tax payable pertains to PSC’s outstanding tax payable of 5.00% of gross income under the PEZA incentives and for MGPP, 10% tax rate, after the income tax holiday (for the M1), which ended last February 8, 2021, as part of its BOI incentives under RE Law. Asset retirement obligation increased by 26.89% mainly due to changes in estimates made during the period. Other non-current liabilities increased by 86.03% mainly because of changes in estimates of the retirement liability accounts.
- 72 Equity attributable to equity holders of the Parent Company amounted to P5.571 billion or P9.80 book value per share and P5.130 billion or P9.02 book value per share as of September 30, 2021 and same period 2020, respectively. Non-controlling interest (NCI) pertains to the following: 10% share of EEI-PC in PetroGreen;
25% share of Trans-Asia, the 10% share of PNOC-RC, and 10% of the 65% share of EEI-PC (indirect) in MGI;
44% share of EEI-PC (direct) and 10% of 56% share (indirect) in PSC;
Non-controlling interest increased by 7.67% due to continuous net income from the RE projects, net of dividend declared during the period.
- 73 4.
Consolidated Results of Operation (for the nine months ending September 30, 2021 and September 31, 2020)
Unaudited (Nine months ending) 30-Sep-21 30-Sep-20
% Change
% to Total Revenues
1,741,709,510
1,709,367,724
1.89%
100.00%
COST OF SALES
858,750,325
893,885,093
-3.93%
49.31%
GROSS INCOME
882,959,185
815,482,631
8.27%
50.69%
GENERAL AND ADMINISTRATIVE EXPENSES
118,062,707
113,091,605
4.40%
6.78%
(256,075,919) 64,886,595 7,599,031 4,732,221 (2,593,340)
(294,556,054) 20,579,116 16,324,161 (2,693,137) (3,114,379)
-13.06% 215.30% -53.45% -275.71% -16.73%
-14.70% 3.73% 0.44% 0.27% -0.15%
(50,214) 11,431,938 (170,069,688) 594,826,790 50,411,925 544,414,865
(1,883,027) 7,496,354 (257,846,966) 444,544,060 27,060,045 417,484,015
-97.33% 52.50% -34.04% 33.81% 86.30% 30.40%
0.00% 0.66% -9.76% 34.15% 2.89% 31.26%
323,459,945 220,954,920
202,638,207 214,845,808
59.62% 2.84%
18.57% 12.69%
REVENUES
OTHER INCOME (CHARGES) Interest expense Share in net income of an Associate Interest income Net unrealized foreign exchange gain (loss) Accretion expense Net unrealized gain on fair value changes on financial assets at FVPL Miscellaneous income (charges) INCOME BEFORE INCOME TAX PROVISION FOR INCOME TAX NET INCOME NET INCOME ATTRIBUTATBLE TO: Equity Holders of the Parent Company Noncontrolling interest
The Group’s consolidated net income amounted to P544.415 million as of September 31, 2021, a 30.40% increase from the P417.484 million in the same period in 2020. The Group’s consolidated net income attributable to equity holders of the Parent Company amounted to P323.46 million 59.62% increase from the P202.638 million in the same period 2020. The increases are mainly due to the improvement of the returns from the renewable energy projects, TSPP, improvement of the crude oil prices and increase in share in the Net income of an Associate, PWEI, due to high winds and recording of FIT arrears. Revenues: The Group’s Revenues are from the electricity sales from the MGPP and TSPP, oil revenues from the Etame Gabon project and other miscellaneous revenues. As of September 30, 2021, 78% of the total revenues is from the electricity sales while, 19% is from the oil revenues. The main driver of the 1.89% increase in revenues is from the increased oil revenues resulting from the improved crude oil prices from an average of $40.15/bbl to $67.38/bbl. Costs and Expenses: The Costs of sales consist of the costs of electricity sales in generating electricity power including operating and maintenance costs (O&M) of power plants and fluid collection and reinjection system (FCRS), depreciation, and other costs directly attributed to producing electricity; cost of oil production in the Etame Gabon oil operations and other costs.
- 74 As of September 30, 2021, 67% of the cost of sales is from the costs of electricity sales, 26% is from the cost of oil production and the remaining, from other cost of sales. The 3.93% decrease is mainly due to lower cost of wheeling charges. The 4.4% increase in General and administrative expenses (G&A) is mainly due to professional fees paid to consultant in relation to the VAT refund collected by to PetroSolar during the period. This is offset by lower expenses incurred during the period, specifically travel and transportation, gas and oil, meeting and representation expenses, resulting from travel restrictions brought about by the Covid 19 pandemic. Below presents the itemized discussion of the changes in other income (charges): 13.06% decrease in interest expense due to the installment payment of principal loans; Increase in share in net income of an Associate of 215.3% is because of higher electricity generation and the recording of FIT arrears during the first half of the period; Decrease in interest income of 53.45% is due to lower interest rates on money market placements during the period; Upturn forex gain resulting from the fluctuations of the USD vs. Php; Lower loss on fair value changes on FVPTL due to negative market changes of prices of the stock investments; Increase in miscellaneous income of 52.5% mainly due to higher timewriting charges
Provision for income tax current pertains to PSC’s tax payable - 5.00% provision for income tax under the PEZA incentives and for MGPP, 10% tax rate, after the income tax holiday (for the M1), which ended last February 8, 2021, as part of its BOI incentives under RE Law. Non-controlling interest (NCI) as of September 30, 2021 and same period 2020 pertains to the following: 10% share of EEI-PC in PetroGreen; 25% share of Trans-Asia, the 10% share of PNOC-RC, and 10% of the 65% share of EEI-PC (indirect) in Maibarara; 44% share of EEI-PC (direct) and 10% of 56% share (indirect) in to PetroSolar;
- 75 Material Commitments Aside from the committed developments of the prospective projects, there are no other foreseen material commitments during the period. Productivity Program For the electricity sales, the development of the prospective projects will increase the Group’s capacity and power generation For oil revenue, the consortium of the Etame Marine completed the three-well drilling program, which was conducted in October 2019 to March 2020, contributed positively in maintaining and increasing overall production from ~11,000 barrels of oil per day (BOPD) to ~22,000 BOPD. Receivable Management The group’s receivables are mainly due from sale of electricity to AC Energy and Transco and crude oil in Etame Gabon, through the consortium operator. These are being recorded once sale is made. Payment is received every 30-45 days following each sale. For electricity sales form TSPP and NWPP, the payment for the Actual FIT Revenue is sourced from the FIT-All Fund, specifically the Actual FIT Differential (FD) and the Actual Cost Recovery Revenue (ACRR). The FD is the difference between the Actual FIT Revenue and the ACRR and is collected from on-grid consumers as a uniform charge and applied to all billed kilowatt-hours. For FIT-Eligible RE Plants connected to the Wholesale Electricity Spot Market (“WESM”), the ACRR refers to the WESM proceeds remitted to the FIT-All Fund by the Independent Electricity Market Operator of the Philippines, Inc. (“IEMOP”), which took over the Philippine Electricity Market Corporation (“PEMC”) as operator of the electricity spot market. PWEI and PSC regularly receive the both the ACRR and FD components within45 days after billing date. PWEI and PSC manage this risk through proper and meticulous allocation of funds, proper timing of expenditures, employment of cost-cutting measures, and sourcing short-term funding requirements from local banks and investment houses or from affiliated companies. For the eighteen (18) years since oil production inception, there was no event that the buyer failed to remit the proceeds of the sale. However, the group is willing to look for another buyer should there be some problem that may happen in the future. Liquidity Management Management of liquidity requires a flow and stock perspective. Constraint such as political environment, taxation, foreign exchange, interest rates and other environmental factors can impose significant restrictions on firms in management of their financial liquidity. The Group considers the above factors and pays special attention to its cash flow management. The Company identifies all its cash requirements for a certain period and invests unrestricted funds to money market placements to maximize interest earnings. The Group does not anticipate any cash flow or liquidity problems within the next twelve (12) months. The Group is not in default of any, note, loan, lease, or other indebtedness or financing arrangement requiring it to make payments. Inventory Management The only inventory is the crude oil produced in Gabon. The buyer lifts certain volume and pays the same in 30 days. The operator sees to it that crude oil inventory does not reach 800,000 barrels at any one time
- 76 to avoid overflow and to generate revenues to cover production costs. Cost Reduction Efforts In order to reduce costs, the Group employs a total of one hundred thirty five (133) employees with multitask assignments. The group also implements request for quotations to compare prices, quality of the products and services and negotiate the payment terms. The Company’s general and administrative expense is equivalent to 6.92% of the total revenue. Rate of Return of Each Stockholder The Company has no existing dividend policy. However, the Company intends to declare dividends in the future in accordance with the Corporation Code of the Philippines. Dividend declared for two (2) most recent years. Date of Declaration April 26, 2012 April 26, 2012 July 04, 2013 July 26, 2018
Dividends per Share Cash Stock 10% 10% 5% 5%
Record Date May 18, 2012 September 21, 2012 July 25, 2013 August 24, 2018
Payment Date June 14, 2012 October 17, 2012 August 20, 2013 September 20, 2018
Financial Disclosures in view of the current global financial condition: Assess the financial risks exposures of the Company and its subsidiaries particularly on currency, interest credit, and market and liquidity risks. If any change thereof would materially affect the financial condition and results of operation of the Company, provide a discussion in the report on quantitative impact or such risks and include a description of enhancement in the company’s risk management policies to address the same: The Group’s principal financial instruments include cash and cash equivalents, trading and investment securities (financial assets at FVPL) and receivables. The main purpose of these financial instruments is to fund the Company’s working capital requirements. Effect of the Covid 19 Pandemic: The Group have secured long-term offtake rates (for MGPP1 & MGPP2) and secured FIT rates (for the TSPP1 and NWPP) for its Renewable Energy operations, thus, the revenue generation and eventual sale are not affected by the current pandemic. Aside from the work-from-home arrangement at the home office, there are no other significant impact caused by the pandemic. Financial Risk Management Objectives and Policies. Please refer to Note 21.
- 77 -
Operations Review and Business Outlook A. OIL EXPLORATION Foreign Operations Gabon, West Africa The daily oil production of the four oil fields (Ebouri, Etame, North Tchibala and Avouma) as of September 30, 2021 ranged from zero to 18,080 barrels of oil per day (BOPD). The fluctuations in the daily production were due to the following: 1) 6-day annual field maintenance shutdown, and 2) 8-hour FPSO maintenance, both in September 2021. The total cargo lifted by the consortium in Q3 2021 amounted to 1.45 Million barrels of oil (MMBO). To date, the Etame Marin Field has produced ~123 MMBO since inception in 2002. Philippine Operations Service Contract 6A – Octon-Malajon, Northwest Palawan For the quarter, Operator The Philodrill Corporation has been continuing its review of a third-party technical evaluation on the block for a potential farm-in opportunity. Service Contract 14C2 – West Linapacan, Northwest Palawan For the quarter, the SC 14C2 consortium proceeded with a third-party technical evaluation of the West Linapacan B field, to assess potential production opportunities. Service Contract 75 – Offshore Northwest Palawan The SC 75 consortium has approved the signing of the contract for the ~1,100 sq.km 3D seismic survey over SC 75. The survey will be conducted during Q2, 2022. Summary of Petroleum Properties: Contract Expiry Production Sharing Contract (PSC) 93 – 2028 Gabon Service Contracts (SC) – Philippines SC 6A – Octon-Malajon, Northwest Palawan 2024 SC 14C2 – West Linapacan, Northwest 2025 Palawan SC 75 – Offshore Northwest Palawan 2025 Contract No.
Participating Interest % 2.525%
Gabon Offshore
16.667% 4.137%
Northwest Palawan Northwest Palawan
15.000%
Northwest Palawan
Location
The Company derives its petroleum revenues from its Gabon Operations. All contractual obligations with the Gabonese Government are complied with. Some of the Company’s petroleum Service Contracts in the Philippines are in exploration stage and some contracts are being farmed out to reduce risk inherent to the business.
- 78 B. RENEWABLE ENERGY PROJECTS Maibarara Geothermal Power Project The 20-MW Maibarara-1 (MGPP-1) and 12-MW Maibarara-2 (MGPP-2) Geothermal Power Plants are on continuous operations. From July 01 – September 30, 2021, the combined net exported output is 66,096 MWh (41,645 MWh from MGPP-1 and 24,451 MWh from MGPP-2). MGPP-1 and MGPP-2 operated at almost 100% availability during the above period. Nabas Wind Power Project The 36-MW Nabas-1 Wind Power Plant (NWPP-1) has been operating normally, and for the period of July 01 – September 30, 2021, the total net energy exported to the grid reached 16,351 MWh. For the planned 14-MW Nabas-2 Wind Power Project (NWPP-2), PetroWind Energy Inc (PWEI) is carrying out the following on-going activities; namely 1) technical and commercial review of latest EPC proposals, and 2) final environmental permitting with the DENR Central Office. Tarlac Solar Power Project The 50-MWDC Tarlac-1 (TSPP-1) and 20-MWDC Tarlac-2 (TSPP-2) Solar Power Plants are on continuous operations. From July 01 – September 30, 2021, the combined net exported output is 24,225 MWh (17,205 MWh from TSPP-1 and 7,020 MWh from TSPP-2). To date, PetroSolar Corporation (PSC) is still awaiting the Energy Regulatory Commission’s (ERC) approval and release of TSPP-2’s Certificate of Compliance (COC), which will determine the official Commercial Operations Date (COD) for TSPP-2. Puerto Princesa Solar Power Project PGEC is still exploring alternative offtake arrangements for this project. San Vicente Wind Hybrid Power Project In July 2021, PGEC’s contractor completed the installation works for the 60-meter meteorological mast for the San Vicente Wind Hybrid Power Project (SVWHPP). The said mast will gather wind data for two (2) years to assess the long-term wind resource to support a potential wind-hybrid power project in San Vicente. Plan of operations for the next 12 months: Gabon, West Africa Crude production will continue from the existing wells, as the Gabon Consortium is currently firming up the most feasible Integrated Field Development Plan (IFDP) to extract the remaining recoverable oil volumes until at least 2028. SC 6A – Octon-Malajon, Northwest Palawan Operator Philodrill will continue its review of a third-party technical evaluation on the southern portion of the block for a potential farm-in opportunity.
- 79 SC 14C2 - West Linapacan, Northwest Palawan Operator Philodrill will conduct further G&G activities to validate the feasibility of extracting the remaining recoverable volumes in West Linapacan. SC 75 - Offshore Northwest Palawan Subject to government’s safely and security clearance over the prospect area, the SC 75 Consortium will continue its preparations for the ~1,100 sq.km 3D seismic survey in SC 75, scheduled for Q2, 2022. Maibarara Geothermal Power Project Power generation from both Maibarara-1 and Maibarara-2 will continue. Nabas Wind Power Project The windfarm will be in continuous operation. For the project’s Phase 2, environmental permitting and tender evaluation works will continue. Tarlac Solar Power Project TSPP-1 and TSPP-2 will continue to supply electricity to the grid. Further, PSC aims to secure the ERC’s approval for the TSPP-2’s COC within the year. Puerto Princesa Solar Power Project PGEC is exploring alternative offtake arrangements for this project. San Vicente Wind Hybrid Power Project After the completion of the meteorological mast in July 2021, PGEC will undertake the three-year predevelopment stage, consisting of: 1) Two-year wind measurement campaign, 2) LGU and regulatory permitting works, and 3) technical and economic feasibility works for a potential wind-hybrid system in San Vicente.
PART II - Other Information The Company has no other information that need to be disclosed other than disclosures made under SEC Form 17-C (if any).
77
PETROENERGY RESOURCES CORPORATION AND SUBSIDIARIES SUPPLEMENTARY INFORMATION AND DISCLOSURES REQUIRED ON REVISED SRC RULE 68 SEPTEMBER 30, 2021 Philippine Securities and Exchange Commission (SEC) issued the revised Securities Regulation Code Rule SRC Rule 68 which consolidates the two separate rules and labeled in the amendment as “Part I” and “Part II”, respectively. It also prescribed the additional information and schedule requirements for issuers of securities to the public. Below are the additional information and schedules required by Revised SRC Rule 68 that are relevant to the Group. This information is presented for purposes of filing with the SEC and is not required part of the basic financial statements. Schedule A. Financial Assets The Group is not required to disclose the financial assets in equity securities as the total financial assets at fair value through profit and loss securities amounting to P =7.481 million do not constitute 5% or more of the total current assets of the Group as at September 30, 2021. Schedule B. Amounts Receivable from Directors, Officers, Employees, Related Parties and Principal Stockholders (Other than Related Parties) As of September 30, 2021, there are no amounts receivable from directors, officers, employees, related parties and principal stockholders that aggregates each to more than P =100,000 or 1% of total assets whichever is less. Schedule C. Amounts Receivable from Related Parties which are Eliminated during the Consolidation of Financial Statements The following is the schedule of receivables from related parties, which are eliminated in the consolidated financial statements as at September 30, 2021:
Name and Designation of debtor PetroGreen Energy Corporation Maibarara Geothermal, Inc. PetroSolar Corporation
Balance at beginning of period P =32,078 732,221 66,798 =831,097 P
Additions P =1,887,997 3,254,376 2,563,494 P =7,705,867
Amounts Collected P =1,632,949 3,827,225 2,504,291 P =7,964,465
Amounts written off P =– – – P =–
Balance at Not Current end of period =– P = 287,126 P – 159,372 – 126,001 =– P =572,499 P
Please refer to Note 20 of the Consolidated Financial Statements. Schedule D. Long-term Debt Please refer to the Consolidated Audited Financial Statement, Note 17 for details of the loans. Schedule E. Indebtedness to Related Parties (Long-Term Loans from Related Companies) The Group has no outstanding long-term indebtedness to related parties as of September 30, 2021. Schedule F. Guarantees of Securities of Other Issuers The Group does not have guarantees of securities of other issuers as of September 30, 2021.
Schedule G. Capital Stock
Title of issue Common Shares
Number of shares authorized 700,000,000
Number of shares issued and outstanding as shown under related balance sheet caption 568,711,842
Number of Shares reserved for options, warrants, conversion and other rights –
Number of shares held by related parties 165,468,725
Directors, Officers and Employees 5,960,751
Others 397,282,366
77
PETROENERGY RESOURCES CORPORATION AND SUBSIDIARIES SCHEDULE OF FINANCIAL SOUNDNESS INDICATORS AS OF SEPTEMBER 30, 2021 AND DECEMBER 31, 2020 Financial Soundness Indicators Below are the financial ratios that are relevant to the Group for the year ended September 30, 2021, September 30, 2020 and year ended December 31, 2020. Unaudited Unaudited Audited Financial ratios Formula 30-Sept-2021 30-Sept-2020 31-Dec-2020 Current ratio (under page 31, KPI)
Total current assets
2.05:1
1.60:1
1.83:1
0.17:1
0.14:1
0.21:1
0.65:1
0.76:1
0.71:1
1.65:1
1.76:1
1.71:1
3.35:1
2.51:1
2.78:1
31.26%
24.42%
27.70%
P =0.5688
=0.3563 P
P =0.5616
P =7.12
=8.73 P
=6.66 P
0.49:1
0.56:1
0.55:1
3.66
4.23
Total current liabilities Solvency ratio
After tax net profit + depreciation Long-term + short-term liabilities
Debt-to-Equity Ratio (under page 31, KPI)
Total liabilities Total stockholder's equity
Asset-to-Equity Ratio (under page 31, KPI)
Total assets Total stockholder's equity
Interest rate coverage ratios
Earnings before interest and taxes (EBIT) Interest expense*
Return on revenue
Net income Total revenue
Earnings per share
Net income Weighted average no. of shares
Price Earnings Ratio
Closing price Earnings per share
Long term debt-to-equity ratio
Long term debt Equity
EBITDA to total interest paid
EBITDA**
4.08 Total interest paid *Interest expense is capitalized as part of the construction-in-progress account under PPE. **Earnings before interest, taxes, depreciation and amortization (EBITDA)
PETROENERGY RESOURCES CORPORATION SCHEDULE OF RETAINED EARNINGS AVAILABLE FOR DIVIDEND
DECLARATION SEPTEMBER 30, 2021
Unappropriated retained earnings, beginning Prior year adjustments: Recognized gross deferred income tax assets, beginning Unrealized marked-to-market gain on FVTPL Unappropriated retained earnings, as adjusted, January 1, 2019 Net income based on the face of unaudited financial statements Movement in gross deferred tax assets Unrealized foreign exchange loss - net (except those attributable to cash and cash equivalents) Fair value adjustment - marked-to-market loss Net loss actual/realized TOTAL RETAINED EARNINGS AVAILABLE FOR DIVIDEND DECLARATION
P =24,215,877 20,282,351 (4,128,274) 40,369,954 139,286,496 –
(176,860) 50,214 139,159,850 P =179,529,804
PETROENERGY RESOURCES CORPORATION REPORT ON SRO PROCEEDS September 30, 2021 On July 26, 2017, at the BOD meeting, the Parent Company was authorized to raise approximately one billion pesos (P =1,000,000,000) in capital, by offering and issuing to all eligible stockholders as of record date, the rights to subscribe up to all of the existing unissued common shares of the Parent Company (“ Stock Rights Offer”). On September 29, 2017, the Parent Company filed its application for the listing and trading of rights shares with the PSE. On December 13, 2017, the PSE approved the application to list the Rights Shares. The rights offer entitled eligible stockholders as of record date of January 12, 2018 to subscribe to one rights share for every 2.6 shares held at an offer price of P =4.80 per share. The rights offer was undertaken in January 22 to 26, 2018. Following the close of the offer period, the Parent Company successfully completed the stock rights offer for 157,975,512 common shares with gross proceeds of P =758.28 million and was subsequently listed on the PSE on February 2, 2018. The proceeds from the stock rights offer will be used for the development and expansion plans of the Group’s renewable energy projects and general corporate requirements. The table below shows the gross and net proceeds; each expenditure item where the proceeds were used:
Proceeds from the Stock Rights Offering Gross Proceeds Less: Listing and Registration Fees Net Proceeds
PhP758,282,458 5,988,316 PhP752,294,142 Total As of 31-Dec-20
Less: Expenditures A. Development and expansion of Renewable Energy Projects
2nd Quarter 30-Jun-21
3rd Quarter 30-Sep-21
370,129,536
-
-
370,129,536
B. General and Corporate requirements C. Loans and Interest
36,774,276
-
-
36,774,276
177,720,542
-
-
177,720,542
Total Expenses Allocated to Proceeds
584,624,354
-
-
584,624,354
Remaining proceeds as of September 30, 2021
PhP167,669,788
PETROENERGY RESOURCES CORPORATION AND SUBSIDIARIES MAP OF RELATIONSHIPS OF THE COMPANIES WITHIN THE GROUP Group Structure Below is a map showing the relationship between and among the Group and its subsidiaries as of September 30, 2021: PETROENERGY RESOURCES CORPORATION GROUP STRUCTURE PetroEnergy Resources Corporation
Navy Road Development Corporation 100%
90%
PetroGreen Energy Corporation 65% Maibarara Geothermal, Inc.
*Investment in a joint venture.
56% PetroSolar Corporation
40% PetroWind Energy, Inc.*
SIGNATURES Pursuant to the requirements of the Securities Regulation Code, the registrant has duly caused this report to be signed on behalf of the undersigned thereunto duly authorized.
Registrant
:
PETROENERGY RESOURCES CORPORATION
Signature and Title
:
Milagros V. Reyes - President
Signature and Title
:
Carlota R. Viray – Asst. Vice President for Finance
Date
:
November 15, 2021