2012 ANNUAL REPORT
A
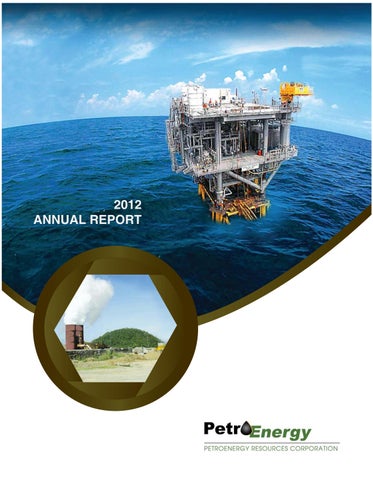
bout the Cover
PetroEnergy’s petroleum operations in Gabon remain as the Company’s main business and principal source of revenue. This year, the Company highlights its contribution in developing clean and renewable energy, as it prepares for the commercial operation of the 20 MW Maibarara Geothermal Power Project, considered as the country’s first geothermal facility since 2007.
TABLE OF CONTENTS Message from the President and Chairman
05
Financial Highlights
23
Statement of Management’s Responsibility for Financial Statements
26
Independent Auditor’s Report
27
Financial Reports
29
Notes to Financial Statements
34
Board of Directors
108
Officers
109
Corporate Directory
110
Construction of 20MW Maibarara Geothermal Steamfield and Power Plant
Message from the Chairman and the President
D
EAR FELLOW STOCKHOLDERS,
I
n 2012, your Company built on the significant achievements of 2011 to deliver focused and efficient performance in all its energy ventures. The central underlying goal of the past year was to put the projects to a position of long-term growth and revenue, thru the aggressive drilling campaign and major facilities expansion in Gabon, the determined construction and development in our geothermal
project, and meeting operational challenges in our local oil Service Contracts. 0
5
10
15
Our Gabon-Etame concession produced a cumula2009 tive 72 Million barrels of oil since commercial production started in 2002. In 2012, crude pro2010 duction of 7.04 Million barrels was lower than 2011’s production of 8.06 Million barrels. This 2011 arose due to a combination of reservoir-related 2012 and operational constraints, resulting to a slight drop in our net income from US$ 3.70 Million in 2011 to US$ 3.37 Million this year. Our book value per share changed from US$ 0.149 in the previous year to US$ 0.156 this year. Our earOil Revenue Net Income nings per share dipped slightly from US$ 0.013 in (US$ MILLION) 2011 to US$ 0.012 in 2012. In our renewable energy ventures, the 20 MW Maibarara geothermal power project in Batangas Progress in our Philippine petroleum service successfully and efficiently completed in 2012 contracts, where PERC is a minority partner, the well requirements for steam supply and brine remained mixed in 2012. Preparations for reinjection. We are now focused on power plant drilling in 2013 in the East Visayan Basin (SC-51) and transmission line construction in time for by operator Otto Energy were significant, while commercial operation by 4th quarter of 2013. On RMA (HK) Ltd, operator of the SC-14C2 acreage the other hand, we have submitted to the DOE in West Linapacan, offshore Palawan was comour application for commerciality for our 50 MW pleting several reservoir studies prior to recomNabas wind power project. We have started the mending a final drilling and development strategy bidding process among Wind Turbine Generator for the block. On the other hand, no significant (WTG) suppliers and balance of plant contractors advances have been made by operators Pitkin as we await the DOE’s commerciality decision and Petroleum for our SC-6A block in Octon, northfeed-in-tariff allocation rules. west Palawan and PNOC-EC for our SC-47 service contract in offshore Mindoro.
Annual Report 2012
5
Gabon Operations
T
otal crude production in 2012 reached 7.04 Million barrels, with daily oil production ranging from 13,500 – 21,600 barrels of oil per day from three oil fields – Etame, Avouma and Ebouri. But due to natural depletion of the field, increased gas contents in a few wells and transient production
downtimes, average daily production was reduced to ~18,000-19,000 barrels per day compared to 2011’s average of 21,000-22,000 barrels. Nonetheless, our consortium managed 14 liftings for the year resulting to a net crude export of 7.00 Million barrels. High crude oil price for the year averaging US$112 per barrel allowed us to avoid significant revenue decline due to lower production volumes.
Alongside current production activities in the three fields, the Etame joint venture partners pursued several major activities aimed at enhancing the ultimate oil recovery from the Etame fields and increasing profitability through major facilities upgrade and expansion as well as aggressive exploration of the entire contract area.
Oyem
Makokou
LIBREVILLE Kango
Booue Gentil Lambarene
Lastoursville oursvville e
Brownfield Projects Upgrade The upgrade of both Avouma and Ebouri platforms were carried out in 2012 and are nearing completion. Both platforms were extended to accommodate additional well slots for future drilling. With these additions, the electrical systems of the platforms were likewise upgraded to accommodate additional electrical submersible pumps to be installed. A water knock-out system will also be installed in the Avouma platform, which will increase crude
6
PetroEnergy Resources Corporation
Mouila
Tchibanga Mayumba
Franceville ille e
throughput going to the FPSO by enhancing the platform’s capacity to separate water from the oil. As of end-2012, the water knock-out system had been completely fabricated and was waiting transport and installation in the platform.
Etame Expansion Project This project, which aims to increase production to at least 25,000 bbls/day, requires new platforms in the central Etame production field and in the greenfield SouthEast Etame/North Tchibala sector. VAALCO Energy Inc., the jointventure Operator, contracted the engineering firm McDermott to conduct the Detailed Engineering Studies for the new platforms. In November 2012, the partners approved the Final Investment Decision (FID) for this project. Once completed by the 3rd quarter of 2014, the new platforms can accommodate more production wells for drilling.
GABON GABON
FPSO Integrity Assessment Related to the “Etame Expansion Project” is the assessment of the existing Floating Production Storage and Offloading (FPSO) Vessel, Petroleo Nautipa, as to its suitability in the enhanced production plan. Allied Marine Services and BASS, well-known marine engineering firms, were contracted to assess the FPSO vessel’s life extension while SGS was engaged to undertake a Topsides Integrity Assessment. The collective output of the three contractors is the identification of corrective actions to maintain the vessel’s structural integrity and ensure continuous operation throughout the life of the field.
Shallow Water Exploration Project (SWEP) The 3D seismic data acquired in 2011 over the concession’s shallow water region was processed and, along with existing joint-venture seismic data, analyzed and interpreted in 2012. By mid-2012, exploration leads were already mapped; towards the end of the year, some of these had been matured into drillable prospects.
Annual Report 2012
7
Given that some of these leads and prospects are situated inside the environmentally sensitive Mayumba marine park, the consortium is also analyzing options on possible drilling and development of these prospects. In parallel, existing prospects in the deeper portion of the concession area west of the Etame production field, are also being considered for drilling. Schedule and appropriate rig availability may dictate how the consortium carries out its drilling campaign for both deep and shallow exploratory targets.
Drilling Campaign for 2012 – 2013 The planned start of drilling in mid-2012 was postponed towards the end of the year due to rig unavailability in the region. Nevertheless, engagement of third-party services was readied in anticipation of the late 4th quarter mobilization of the Ben Rinnes rig from Saldanha Bay in South Africa. As of end of December 2012, the rig had already been towed to the Avouma platform for drilling of the first well, EAVOM-3P/3H. The 2012-2013 campaign involves drilling two production wells and one exploratory well, work-over of three wells, and servicing of the two Ebouri wells that recently manifested high gas levels. Drilling activities will continue into 2014 for two more exploration wells and new production wells in the expanded Etame field.
Production Field Shallow water exploration leads Deep water leads
8
PetroEnergy Resources Corporation
PetroEnergy’s Petroleum Service Contracts
SC 6A OCTON
SC 14C2 WEST LINAPACAN
PECR 4 AREA 4 NORTHWEST PALAWAN
SC 47 OFFSHORE MINDORORO SC 51 EASTERN VISAYAN BASIN
Philippine Oil Projects
A
ctivities in our Philippine petroleum blocks for 2012 concentrated on securing the technical and financial resources in pursuit of further exploration drilling or field re-development. In three of the blocks, further geological and geophysical (G&G) activities were conducted to locate drilling
locations and optimize well design and drilling program. In the fourth block, a potential investor expressed interest in joining our Consortium to fund and spearhead exploration activities.
SERVICE CONTRACT 6A Octon, Northwest Palawan After the DOE approval of UK-based firm Pitkin Petroleum Plc’s farm-in and Operatorship of SC6A last December 6, 2011, Pitkin commenced preparation for Phase 1 activities, consisting of the acquisition, processing and interpretation of ~500km of 3D seismic data. This new 3D seismic program will help further refine the drilling potential of the prospects and leads in the area. In mid-March 2012, Pitkin sent out tenders to ten (10) seismic firms to carry out the 3D seismic survey with the intention of commencing the survey by mid-February, 2013. However, actual start will depend on securing the approval of local Palawan regulatory agencies. In parallel, environmental permitting as well as information, education, and communication (IEC) activities with the Palawan local government units were also conducted. PetroEnergy’s participating interest in the Octon block was reduced from 16.667% to 5.001% after
Pitkin’s farm-in, but the Company will be carried free in all subsequent exploration costs up to the drilling of two Octon wells.
SERVICE CONTRACT 14C2 West Linapacan, Northwest Palawan On April 10, 2012, the DOE officially approved the transfer of the service contract’s Operatorship from Pitkin Petroleum to RMA (HK) Ltd, a subsidiary of Australia-based Resource Management Associates Pty Ltd. Inspite of this operatorship transfer and the preceding farm-out to RMA (HK) Ltd of Pitkin’s 29.145% interest in the concession, PetroEnergy would remain carried free for all exploration costs leading to the drilling of one well and up to first oil. This planned drilling, originally targeted by late 2012, had to be rescheduled due to the delay in completion of the reservoir simulation study which is a pre-condition for the JV partners’ approval of the drilling program and budget. To
Annual Report 2012
11
address the risks on the anticipated rig mobilization and drilling posed by the existing 1990 West Linapacan subsea production facilities, the original farmors approved a budget to fund a third-party technical study on the best abandonment method. In the meantime, the programmed environmental impact assessment for the drilling activity had been moved to early 2013, after the completion of the reservoir simulation. Drilling of the West Linapacan well, coded WLA-7, has been set on or before the end of June, 2014.
SERVICE CONTRACT 47 Offshore Mindoro and Panay PNOC-EC, the service contract Operator, requested for a one-year extension of the contract’s Subphase 2 to July 10, 2012 to conduct detailed source rock-to-reservoir rock migration studies and acquisition of 500km 2D seismic data. These proposed studies were intended to further de-risk the area and attract potential farminees who have been stymied by the discouraging results of the last deep oil well drilled in 2007 by Malaysia’s Petronas. As of end-2012, the application for Subphase 2 extension was still pending approval by the DOE. While awaiting DOE approval, the SC 47 Consortium has been actively seeking potential farminees to carry out the drilling of one (1) exploratory well, as programmed for the subsequent Subphase 3. PetroEnergy’s participating interest in SC 47 remains at 2.00%, PNOC-EC at 97%, and Basic Energy at 1%.
SERVICE CONTRACT 51 East Visayan Basin On January 25, 2012, the DOE approved the Subphase 4 (SP4) Work Program & Budget (WP&B) of SC 51. This WP&B includes the acquisition, processing and interpretation of 100km of 2D seismic
12 PetroEnergy Resources Corporation
data over the Duhat prospect in onshore north west Leyte (“North Block”) with a total budget of US$ 4.35MM. The operator of the block, Otto Energy, contracted Beijing-based BGP Asia to conduct the 2D seismic survey. Mobilization of the seismic crew started in February 2012. Actual data shooting and acquisition for the 102 line-km 2D seismic survey over the Duhat prospect was conducted from August to October 2012, at a cost of US$ 3.38MM. Following the completion of the 2D seismic program, the consortium elected on December 12, 2012 to enter SP 5 with a one well drilling commitment. This made way for commencement of Otto’s well design planning and activities to secure a suitable rig to drill the Duhat-2 well in mid-2013.
Meanwhile in the “South Block” (offshore Cebu), Swan Oil & Gas relinquished its participating interest to the Filipino partners Trans-Asia Oil and Energy Development Corporation, Alcorn Gold and PetroEnergy. On October 23, 2012, the South Block consortium entered into a Farm-in Option Agreement with Frontier Oil Corporation, regarding the latter’s interest to drill Argao in exchange for 80% participating interest and Operatorship of the South Block. As of end-2012, Frontier is continuing its evaluation of Argao and will decide on its forward plans in early 2013.
AREA 4 – Philippine Energy Contracting Round 4 (PECR-4) PERC formed a consortium with Philex Petroleum Corp. and PNOC-EC in 2012 and submitted a petroleum tender for Area 4 in the West Philippine Sea. Area 4, a deep-water frontier oil exploration block west of Palawan, is one of 15 blocks on offer by the DOE in PECR4, which kicked off in July 2011. The area is in the same petroliferous northwest Palawan basin where Malampaya, Nido, and other petroleum discoveries are located. However, this lies further west and in much deeper waters. Our consortium, Philex (50%), PNOC EC (35%), and PetroEnergy (15%), submitted the tender in July 2012. One other local oil company submitted a competing offer for the block. DOE decision on the winning bidder is expected by early 2013.
3D of Top Nido Formation Viewed from NE
Annual Report 2012
13
Construction of MGPP Steamfield & Power Plant
Nabas Proposed Wind Farm
Renewable Energy Projects
Maibarara Geothermal Power Project In 2011, our joint-venture company Maibarara Geothermal, Inc. (MGI) achieved a milestone when the 20MW Maibarara project was declared commercial by the DOE. Maibarara became the first RE project to get such DOE approval to proceed to commercial development out of more than 200 service contracts awarded by the government under the 2008 Renewable Energy Law. Shortly after, MGI mobilized its team and subcontractors with four concrete goals for 2012: 1) complete the steam production and reinjection well capacities, 2) expedite the construction of the steamfield and power plant facilities, 3) secure the right-of-way and initiate the erection of the transmission line, and 4) fortify our relationship with the host community. The completion of the steam requirement for the 20 MW plant was successfully achieved when MGI drilled its first production well, MB-12D, in July-August, 2012 to a total depth of over 2,000m. After a month of heat-up, MB-12D was successfully flowed for 2 months yielding chemically benign, low-gas, and high-enthalpy fluid with a power output of as much as 12MW. Along with existing wells Mai-6D and Mai-9D which were worked-over in 2011, MB-12D completed the steam supply requirement for our 20MW plant. Similarly, the drilling of new condensate injection well MB-14RD to a depth of 1,900 m in October, 2012 with resulting good permeability satisfied the well requirement for condensate fluid reinjection. Along with the 2011 work-
over of well Mai-11D to be used for hot brine injection, MGI has the necessary wells for the 20 MW facility’s reinjection load. The construction of the steamfield’s piping system, went full blast and neared 53% completion by end 2012. While the engineering design and procurement of the steamfield piping materials were directly handled by MGI, several reputable firms were tapped to construct different engineering components of the steamfield facility. In 2013, the steamfield construction works for electrical and insulation will be started. Parallel power plant engineering, procurement, and construction activities by EEI Corp. reached over 50% completion by end 2012. Foundation works and some vertical structures were already done for many elements of the power plant facility such as the turbine-generator building, workshop building, and raw water tanks. At the same time, Fuji Electric of Japan, the project’s supplier of major power plant equipment, reported 72% completion of its task in November, 2012. Fuji Electric assured MGI that it will be able to ship the plant equipment within the first quarter of 2013. Major challenges, however, delayed start-up of the transmission line (T/L) installation. To address the hurdles, MGI opted for a shorter, 6 km-long, 115 kV line to connect to Meralco’s existing 115 kV substation at the First Philippine Industrial Plant (FPIP) complex in Calamba. This necessitated signing a new interconnection
Annual Report 2012
15
agreement with Meralco and amending the separate transmission agreement between MGI and NGCP. These new contractual relationships effectively mean that MGI’s power output will have to pass through Meralco’s distribution line if it is to be sold by our aggregator Trans-Asia to parties other than Meralco. MGI finally signed the tri-partite agreement with Meralco and TransAsia, the interconnection agreement with Meralco, and the T/L EPC contract with Miescor all on December, 2012. Construction activities for the 115 kV T/L will start in early 2013. If all the major construction activities are achieved on schedule, the project should be ready for initial commissioning tests by the 3rd quarter of 2013 and for commercial operations by 4th quarter of 2013. Finally, our continuing efforts to fortify a mutually productive relationship with the host communities expanded in 2012 and are detailed in the following section of this report.
Nabas Wind Power Project In 2012, the key activities centered on securing critical government permits, completing technical feasibility studies, and initiating request for engineering, procurement, and construction bids for the wind farm. PGEC obtained the Certificate of Non-Overlap from the National Commission on Indigenous
Peoples (NCIP) on February 2012. The critical Environmental Compliance Certificate (ECC) for the 50 MW Nabas wind power project was released by the Department of Environment and Natural Resources (DENR) Region 6 office on June 2012. This gave PGEC clearance to proceed to site development, from road rehabiliation, access road construction, wind turbine installation, transmission line erection, and operation and maintenance of the facility subject to compliance to standard environmental regulations. Another government approval sought was DOE’s Declaration of Commerciality for the project which was applied on September 10, 2012. As part of this application process, the DOE-Renewable Energy Management Bureau conducted a site visit on November 27-29 to meet with local municipal and barangay officials and DENR staff who assured the DOE team of the strong support for the project. With more than two years of wind data, our consultant, COWI A/S the Danish engineering company completed its technical feasibility study on August, 2012 concluding the viability of the site to generate 50MW of wind power with a high capacity factor. At the same time, NGCP completed its own system impact study that stressed that the four wind turbine models from different suppliers are all compliant with NGCP standards; further, NGCP recommended the location and type of transmission connection for Nabas. Using these two major technical studies, PGEC completed in August its own conceptual engineering design of the project, recommending a phased development with an initial phase of about 36 MW capacity and a second 14 MW phase. Given the positive results of various technical studies, PGEC moved to obtain costing and commitment from several likely construction partners for various project components. On December 7, 2012, PGEC invited four pre-qualified international firms – Alstom, CNTIC, Gamesa, and Vestas – to submit bids for the supply, delivery, installation, and maintenance of wind turbine generators (WTGs). Bid submission deadline was set for February 28, 2013.
DOE Personnel Visited Nabas Site
All the foregoing activities were prompted not only by the positive results of various technical feasibility studies, but also by the Energy Regulatory Commission’s (ERC) decision to grant a feed-in-tariff rate of P 8.53/kwh to qualified wind farm developers.
WTG Bidders Visited Mast 1 in Brgy. Pawa, Nabas, Aklan
MGPP Development
Steamfield & Powerplant C
2012 Drilling & Steam Requirement Completion
2011 Early Construction Phase
Towards Clean, Indigenous, & Renewable Energy
nt Construction
n
2010
Corporate Social Responsibility
o
ur corporate social responsibility program continued to focus on education as a way to empower communities and contribute to local and
national growth. For 2012, we implemented two new social initiatives in Laguna-Batangas and continued our on-going project in Palawan.
Puerto Princesa, Palawan PetroEnergy’s Teacher’s Training Program, aimed at enhancing teaching skills for primary and secondary public school teachers in English, Science, and Mathematics, completed 10 training sessions involving two national high schools and four elementary schools of Puerto Princesa from 2009 to 2011. From September to December, 2012, our program partner Malayan Colleges Laguna (MCL) conducted an evaluation study to gauge the outcome of our training initiative. Feedback from the participating teachers and principals indicated qualitative improvement on teachers’ conduct of lessons, resourcefulness in instructional tools, and classroom management.
Laguna and Batangas In December 2011, MGI completed the community profiling study aimed at identifying practical, effective, and sustainable livelihood program for the residents of Sitio Capuz hosting our geothermal power project. Based on the
20 PetroEnergy Resources Corporation
study’s conclusion that direct employment rather than any livelihood assisted program is still the best option for social improvement, MGI initiated a Housekeeping and Janitorial Training last April 2012 to eleven (11) qualified out-of-school youths from Sitio Capuz (Sto.Tomas, Batangas) and Brgy. Puting Lupa (Calamba, Laguna). Our main objective is to equip them with employable skills needed by MGI, its construction sub-contractors as well as nearby industries in the economic zones of Batangas and Laguna. Immediately after the training, conducted by YGC affiliate Gulf Asia International Corp. (GAIC), 7 of the 11 graduates successfully secured employment in various firms operating in the area, including our power plant EPC contractor EEI Corp. Parallel to the employment initiative for out-ofschool youths, MGI and our sub-contractors expanded the hiring of unemployed but able residents as contractual employees. As of end 2012, 98 residents from both Sitio Capuz and Brgy. Puting Lupa have been given contractual employment by MGI and our sub-contractors. In keeping with both our DENR ECC and DOE service contract commitments, MGI launched another new community relations effort on November 2012 – a feeding program for elementary students in Puting Lupa Elementary School. The latter, though located in adjacent Calamba, is the nearest public primary school where children from our host Sitio Capuz of Sto. Tomas, Batangas
attend. The program involves thrice a week lunch feeding of 41 malnourished Grades 1-6 students of the school and is planned to be completed by the end of the current school year in March 2013. A similar program is slated for adjoining Barangay Kanayunan in Sto. Tomas, Batangas for school year 2013-2014. As part of our on-going assistance to public schools, MGI also constructed a concrete foot pathway at the Sta. Anastacia-San Rafael National High School in Sto. Tomas. The unpaved pathway becomes flooded during the rainy season, making it unsafe and unhealthy for students to use. On August 23, 2012, MGI turned over to the school authorities the concreted pathway measuring 1.5m x 90 m. As PERC’s energy ventures in the country bear fruits in the coming years, we shall strive to enhance our community outreach efforts.
Focused Mission As the company ends 2012 and embarks on 2013, we acknowledge our shareholders’ unwavering trust and support. Your abiding faith in our team is crucial to our officers’ and staff’s singular focus to put our energy projects into a trajectory of higher and sustained earnings. Together we shall reap the benefits of their mutual trust, dedication, and hard work.
Helen Y. Dee Chairman
22 PetroEnergy Resources Corporation
Milagros V. Reyes President
Financial Highlights
(In thousand US dollars, except per share and ratio values and oil price)
CONSOLIDATED
PARENT
2012
2011
2012
2011
CHANGE
Assets
91,453
60,565
43,873
42,164
4%
Liabilities
44,337
17,510
1,070
1,448
-26%
Stockholder’s Equity
47,116
43,055
42, 802
40,716
5%
Oil Revenue
11,990
13,544
11,990
13,544
-11%
Operating Income
5,342
6,257
5,342
6,257
-15%
Net Income
2,558
2,926
3,374
3,670
-8%
Book Value per Share
0.151
0.157
0.156
0.149
5%
Earnings per Share
0.009
0.011
0.012
0.013
-5%
Current Ratio
6.04:1
8.66:1
17.19:1
16.51:1
Debt-to-Equity Ratio
0.941:1
0.407:1
0.025:1
0.036:1
Average Crude Oil Price
$111.31
$111.92
$111.31
$111.92
-1%
7,045
8,064
7,045
8,064
-13%
Oil Production
Annual Report 2012
23
Consolidated Financial Statements
Statement of Management’s Responsibilty for Financial Statements
26 PetroEnergy Resources Corporation
Annual Report 2012
27
Opinion In our opinion, the consolidated financial statements present fairly, in all material respects, the financial position of PetroEnergy Resources Corporation and Subsidiaries as at December 31, 2012 and 2011, and their financial performance and their cash flows for each of the three years in the period ended December 31, 2012 in accordance with Philippine Financial Reporting Standards. Emphasis of Matter Without qualifying our opinion, we draw attention to Note 10 to the consolidated financial statements, which discusses the suspension of the production activities in the West Linapacan Oilfield. Among the other operations of the Group, the suspension of the production activities in the West Linapacan Oilfield raises uncertainties as to the profitability of the petroleum operations for the said oilfield. The profitability of petroleum operations related to the said oilfield is dependent upon discoveries of oil in commercial quantities as a result of the success of redevelopment activities thereof.
SYCIP GORRES VELAYO & CO.
C yril Jasmin B. Valencia Cyril Partner CPA Certificate No. 90787 SEC Accreditation No. 1229-A (Group A), May 31, 2012, valid until May 30, 2015 Tax Identification No. 162-410-623 BIR Accreditation No. 08-001998-74-2012, April 11, 2012, valid until April 10, 2015 PTR No. 3670033, January 2, 2013, Makati City
February 19, 2013
28 PetroEnergy Resources Corporation
PETROENERGY RESOURCES CORPORATION AND SUBSIDIARIES CONSOLIDATED STATEMENTS OF FINANCIAL POSITION (In U.S. Dollars) December 31 2011 2012 ASSETS Current Assets Cash and cash equivalents (Notes 6 and 24) Financial assets at fair value through profit or loss (Notes 7 and 24) Receivables (Notes 5, 8 and 24) Crude oil inventory Advances, prepaid expenses and other current assets (Notes 9 and 16) Total Current Assets Noncurrent Assets Property, plant and equipment (Notes 5 and 10) Deferred oil exploration costs (Notes 5 and 11) Deferred tax assets - net (Notes 5 and 20) Investment properties (Notes 5 and 12) Advances and other noncurrent assets (Notes 14 and 24) Total Noncurrent Assets
LIABILITIES AND EQUITY Current Liabilities Accounts payable and accrued expenses (Notes 15, 18 and 24) Income tax payable (Notes 18 and 20) Total Current Liabilities Noncurrent Liabilities Loans payable (Notes 9, 16, 18 and 24) Accrued retirement liability (Notes 5, 18 and 19) Asset retirement obligation (Notes 5, 17 and 18) Total Noncurrent Liabilities Total Liabilities Equity Attributable to equity holders of the Parent Company Capital stock (Note 18) Additional paid-in capital (Note 18) Retained earnings Appropriated (Note 18) Unappropriated (Note 18) Cumulative translation adjustment (Notes 5 and 18) Noncontrolling interests (Notes 18 and 27) Total Equity
$21,622,222
$21,904,284
142,827 1,982,027 414,764
109,018 2,076,016 447,499
6,490,701 30,652,541
7,500,974 32,037,791
51,455,856 6,643,203 146,806 31,417 2,522,942 60,800,224 $91,452,765
21,297,963 5,831,668 82,203 31,417 1,284,338 28,527,589 $60,565,380
$5,002,365 75,015 5,077,380
$3,455,507 243,474 3,698,981
38,943,444 78,755 237,668 39,259,867 44,337,247
13,295,139 41,862 474,293 13,811,294 17,510,275
6,321,533 25,244,737
6,321,533 25,244,737
2,055,555 6,907,942 778,372 41,308,139 5,807,379 47,115,518 $91,452,765
2,055,555 5,637,881 (56,228) 39,203,478 3,851,627 43,055,105 $60,565,380
See accompanying Notes to Consolidated Financial Statements.
Annual Report 2012
29
PETROENERGY RESOURCES CORPORATION AND SUBSIDIARIES CONSOLIDATED STATEMENTS OF INCOME (In U.S. Dollars)
Years Ended December 31 2011 2010 2012 OIL REVENUES
$11,990,120
$13,544,412
$10,784,257
5,026,209 1,622,262 6,648,471
5,432,149 1,855,082 7,287,231
4,321,258 1,521,188 5,842,446
GROSS INCOME
5,341,649
6,257,181
4,941,811
GENERAL AND ADMINISTRATIVE EXPENSES (Note 22)
3,011,913
2,692,091
2,495,376
506,150 384,278
524,558 95,112
389,101 767,877
24,880 (31,895) 20,220 903,633
(79,588) (62,433) 1,428 479,077
5,856 (75,420) (4,497) 1,082,917
COSTS OF SALES Oil production (Note 21) Depletion (Note 10)
OTHER INCOME (CHARGES) Interest income Net foreign exchange gain Net gain (loss) on fair value changes on financial assets at fair value through profit or loss (Note 7) Accretion expense (Note 17) Miscellaneous income (expense)
INCOME BEFORE INCOME TAX
3,233,369
4,044,167
3,529,352
898,769
1,337,986
857,870
NET INCOME
$2,334,600
$2,706,181
$2,671,482
NET INCOME (LOSS) ATTRIBUTABLE TO: Equity holders of the Parent Company Noncontrolling interests (Note 27)
$2,557,737 (223,137)
$2,926,268 (220,087)
$2,787,723 (116,241)
NET INCOME
$2,334,600
$2,706,181
$2,671,482
$0.009
$0.011
$0.014
PROVISION FOR INCOME TAX (Note 20)
EARNINGS PER SHARE FOR NET INCOME ATTRIBUTABLE TO EQUITY HOLDERS OF THE PARENT COMPANY - BASIC AND DILUTED (Note 26) See accompanying Notes to Consolidated Financial Statements.
30 PetroEnergy Resources Corporation
PETROENERGY RESOURCES CORPORATION AND SUBSIDIARIES CONSOLIDATED STATEMENTS OF COMPREHENSIVE INCOME (In U.S. Dollars)
Years Ended December 31 2011 2012 NET INCOME OTHER COMPREHENSIVE INCOME (LOSS) Movement in cumulative translation adjustment TOTAL COMPREHENSIVE INCOME TOTAL COMPREHENSIVE INCOME (LOSS) ATTRIBUTABLE TO: Equity holders of the Parent Company Noncontrolling interests (Note 27)
$2,334,600 834,600
$2,706,181 (115,391)
2010
$2,671,482 59,163
$3,169,200
$2,590,790
$2,730,645
$3,392,337 (223,137) $3,169,200
$2,810,877 (220,087) $2,590,790
$2,846,886 (116,241) $2,730,645
See accompanying Notes to Consolidated Financial Statements.
Annual Report 2012
31
32 PetroEnergy Resources Corporation $3,358,068 − − − 2,963,465 − $6,321,533
Balances at beginning of year Net income (loss) Movement in cumulative translation adjustment Total comprehensive income (loss) Stock issuances (Note 18) Cash dividends (Note 18) Balances at end of year
See accompanying Notes to Consolidated Financial Statements.
− − $25,244,737
− − $6,321,533 $13,390,875 − − − 11,853,862 − $25,244,737
$25,244,737 − − −
– – $25,244,737
– – $6,321,533 $6,321,533 − − −
$25,244,737 − − –
$6,321,533 − − –
Capital Stock
− (1,261,071) $39,203,478 $21,226,962 2,787,723 59,163 2,846,886 14,817,327 (1,237,503) $37,653,672
For the Year Ended December 31, 2010 $2,055,555 $2,422,464 $– – 2,787,723 – – – 59,163 − 2,787,723 59,163 – – – − (1,237,503) – $2,055,555 $3,972,684 $59,163
− (1,261,071) $5,637,881
− − ($56,228)
− − $2,055,555
$37,653,672 2,926,268 (115,391) 2,810,877
For the Year Ended December 31, 2011 $2,055,555 $3,972,684 $59,163 − 2,926,268 − − − (115,391) − 2,926,268 (115,391)
$39,203,478 2,557,737 834,600 3,392,337 – (1,287,676) $41,308,139
– (1,287,676) $6,907,942
($56,228) − 834,600 834,600
Total
– – $778,372
– – $2,055,555
For the Year Ended December 31, 2012 $2,055,555 $5,637,881 − 2,557,737 − − – 2,557,737
Attributable to Equity Holders of the Parent Company Appropriated Cumulative Retained Unappropriated Additional Translation Earnings Retained Paid-in (Note 18) Adjustment Earnings Capital
Balances at beginning of year Net income (loss) Movement in cumulative translation adjustment Total comprehensive income (loss) Increase in noncontrolling interests - Stock issuances (Note 27) Cash dividends (Note 18) Balances at end of year
Balances at beginning of year Net income (loss) Movement in cumulative translation adjustment Total comprehensive income (loss) Increase in noncontrolling interests - Stock issuances (Note 27) Cash dividends (Note 18) Balances at end of year
(In U.S. Dollars)
PETROENERGY RESOURCES CORPORATION AND SUBSIDIARIES CONSOLIDATED STATEMENTS OF CHANGES IN EQUITY
$21,226,962 2,671,482 59,163 2,730,645 16,164,166 (1,237,503) $38,884,270
2,841,116 (1,261,071) $43,055,105
$38,884,270 2,706,181 (115,391) 2,590,790
2,178,889 (1,287,676) $47,115,518
$43,055,105 2,334,600 834,600 3,169,200
Total
$− (116,241) – (116,241) 1,346,839 – $1,230,598
2,841,116 − $3,851,627
$1,230,598 (220,087) − (220,087)
2,178,889 – $5,807,379
$3,851,627 (223,137) − (223,137)
Noncontrolling Interests
PETROENERGY RESOURCES CORPORATION AND SUBSIDIARIES CONSOLIDATED STATEMENTS OF CASH FLOWS (In U.S. Dollars) Years Ended December 31 2011 2012 CASH FLOWS FROM OPERATING ACTIVITIES Income before income tax Adjustments for: Net unrealized foreign exchange gain Depletion, depreciation and amortization (Note 10) Increase in accrued retirement liability Accretion expense (Note 17) Interest income Net loss (gain) on fair value changes on financial assets at fair value through profit or loss (Note 7) Gain on sale of property, plant and equipment Loss on sale of financial assets at fair value through profit or loss Operating income before working capital changes Decrease (increase) in: Receivables Crude oil inventory Advances, prepaid expenses and other current assets Increase (decrease) in accounts payable and accrued expenses Cash generated from operations Interest received Income taxes paid Net cash provided by operating activities CASH FLOWS FROM INVESTING ACTIVITIES Acquisitions of property, plant and equipment (Notes 10 and 28) Proceeds from disposals of: Property, plant and equipment (Note 10) Financial assets at fair value through profit or loss Increase in capitalized interest Increase in advances and other noncurrent assets Increase in deferred oil exploration costs (Note 11) Increase in deferred geothermal costs Net cash used in investing activities CASH FLOWS FROM FINANCING ACTIVITIES Proceeds from long-term debt (Note 16) Additional capital from noncontrolling interest (Note 27) Dividends paid (Note 18) Interest paid Proceeds from stock rights offering (Note 18) Net cash provided by financing activities EFFECT OF FOREIGN EXCHANGE RATE CHANGES ON CASH AND CASH EQUIVALENTS NET INCREASE (DECREASE) IN CASH AND CASH EQUIVALENTS
$3,233,369 (384,278) 1,863,392 34,203 31,895 (506,150) (24,880) (17,892)
$4,044,167 (95,112) 2,003,389 (1,355) 62,433 (524,558)
2010 $3,529,352 (767,877) 1,673,030 (2,192) 75,420 (389,101)
79,588 –
(5,856) –
– 4,229,659
– 5,568,552
6,500 4,119,276
77,537 32,735 1,035,269 1,104,893 6,480,093 482,433 (1,131,830) 5,830,696
502,844 (247,087) (486,341) 2,701,284 8,039,252 684,443 (1,369,614) 7,354,081
(958,169) (70,308) (38,063) 261,305 3,314,041 193,206 (663,670) 2,843,577
(32,353,911)
(8,775,750)
(1,375,627)
81,997 – 2,157,885 (1,263,600) (811,535) – (32,189,164)
– 1,363,640 10,039 (6,862,760) (996,291) – (15,261,122)
25,648,305 2,178,890 (1,252,489) (1,708,953) – 24,865,753
12,111,820 2,841,116 (1,243,767) – – 13,709,169
1,210,653 (282,062)
76,510 503,355 – (2,265,635) (1,203,953) (4,265,350) – 1,346,839 (1,209,080) 14,817,327 14,955,086
17,672
661,392
5,819,800
14,194,705
CASH AND CASH EQUIVALENTS AT BEGINNING OF YEAR
21,904,284
16,084,484
CASH AND CASH EQUIVALENTS AT END OF YEAR (Note 6)
$21,622,222
$21,904,284
1,889,779 $16,084,484
See accompanying Notes to Consolidated Financial Statements.
Annual Report 2012
33
PETROENERGY RESOURCES CORPORATION AND SUBSIDIARIES NOTES TO CONSOLIDATED FINANCIAL STATEMENTS (In U.S. Dollars)
1.
Corporate Information a.
Organization PetroEnergy Resources Corporation (the “PetroEnergy” or the “Parent Company”) was incorporated in the Philippines on September 29, 1994 and started commercial operations in 1995. The registered office address of the Company is 7th Floor, JMT Building, ADB Avenue, Ortigas Center, Pasig City. PetroEnergy Resources Corporation and its subsidiaries are involved in the exploration and development of petroleum, geothermal and wind energy resources. The Parent Company’s shares of stock are listed and are currently traded at the Philippine Stock Exchange (PSE). On July 22, 2009, the Board of Directors (BOD) and Stockholders approved the amendment of articles of incorporation of the Parent Company to include the business of generating power from conventional sources such as coal, fossil fuel, natural gas, nuclear and other traditional sources of power and from renewable sources such as, but not limited to, biomass, hydro, solar, wind, geothermal, ocean and such other renewable sources of power. The amendment was approved by the Philippine Securities and Exchange Commission (SEC) on September 23, 2009. On February 1, 2010, the Parent Company signed Geothermal Renewable Energy Service Contract (GRESC) No. 2010-02-012 covering the Maibarara Geothermal Field (“the field”) in Laguna and Batangas, following a Philippine Energy Contracting Round for Geothermal held by the Department of Energy (DOE) in November, 2009, where the Parent Company emerged as the lone qualified bidder. The field had been previously explored and relevant resource data identify certain portions thereof as having potential stored heat capacity that can produce electricity in commercial quantities. On February 23, 2010, the BOD approved the creation of a wholly owned subsidiary, PetroGreen Energy Corporation (“PetroGreen or PGEC”) that shall carry out the renewable energy projects for the Parent Company. The SEC approved the incorporation of PetroGreen on March 31, 2010. On May 19, 2010, PetroGreen signed a Joint Venture Agreement (JVA) with Trans-Asia Oil and Energy Development Corporation (“Trans-Asia”) and PNOC Renewables Corporation (“PNOC-RC”) (collectively the “JV Partners”), whereby the JV Partners agreed to pool their resources together and enter into a joint venture to develop and operate the Maibarara Geothermal Field through the formation of a joint venture named Maibarara Geothermal, Inc. (MGI). On August 11, 2010, the SEC approved the incorporation of MGI, whose principal business is to develop and operate geothermal steam fields and power plants. Pursuant to the JVA, PetroGreen holds a 65% interest in MGI, while Tran-Asia and PNOC-RC hold 25% and 10%, respectively. MGI is effectively, a subsidiary of the Parent Company through PetroGreen, since the Parent Company wholly owns PetroGreen and PetroGreen owns more than half of the voting power of MGI. The Parent Company, PetroGreen and MGI are collectively referred to as the Group.
34 PetroEnergy Resources Corporation
b.
Nature of Operations The Group’s three (3) main energy businesses are petroleum, wind and geothermal energy. Petroleum Petroleum production is on-going in the Etame (Gabon) concession, while the other petroleum concessions in the Philippines (Northwest Palawan, Offshore Mindoro, Eastern Visayas) are still in the advanced exploration stages or pre-development stages. See Note 10 for updates on the Group’s petroleum operations. Wind Energy The wind project in Nabas, Aklan is in the 3rd and final year of feasibility studies while the other wind service contract in Sual was dropped due to low potential. In 2012, PGEC moved to further advance the project towards eventual commerciality. The key activities centered on securing critical government permits, completing technical feasibility studies, and initiating request for engineering, procurement, and construction bids for the wind farm. See Note 33 for more updates on Wind Energy Service Contract. Geothermal Energy The geothermal project is the 20 MW Maibarara project in Sto. Tomas, Batangas where MGI is now constructing the power plant for commercial operations by late 2013. In 2012, the highlights of the Maibarara Geothermal Power Project (MGPP) are as follows: Drilling of MB 12-D, the third production well; Drilling of MB-14RD, which will be used as reinjection for power plant condensates; Work-over of Mai-9D; On-going Fluid Collection and Reinjection System (FCRS) and Power Plant construction; Engaging Meralco Industrial and Engineering Services Corporation (MIESCOR) as contractor for the Engineering Procurement and Construction (EPC) on the transmission lines; Signing of the Interconnection Agreement (ICA) with Manila Electric Company (MERALCO) for the physical interconnection facilities of MGI’s 20 MW power plant to MERALCO’s distribution system; Execution of a Memorandum of Agreement (MOA) between MGI, MERALCO and TRANS-ASIA. See Note 10 for more updates on the Group’s geothermal energy operations.
The accompanying consolidated financial statements were approved and authorized for issue by the BOD on February 19, 2013.
Annual Report 2012
35
2.
Basis of Preparation The accompanying consolidated financial statements have been prepared under the historical cost convention method, except for financial assets carried at fair value through profit or loss (FVPL) and the Parent Company’s crude oil inventory that have been measured at fair value. Figures are presented in United States (US) Dollar ($), the Parent Company’s functional currency. All amounts are rounded to the nearest dollar unless otherwise indicated. Statement of Compliance The accompanying consolidated financial statements have been prepared in compliance with Philippine Financial Reporting Standards (PFRS). Basis of Consolidation The consolidated financial statements comprise the financial statements of the Group as at December 31, 2012 and 2011. The financial statements of the subsidiaries are prepared for the same reporting year as the Parent Company, using consistent accounting policies.
PGEC MGI Navy Road Development Corporation (NRDC)
Percentage of Ownership 2011 2012 100% 100% 65% 65%
2010 100% 65%
100%
100%
100%
Subsidiaries are consolidated when control is transferred to the Group and cease to be consolidated when control is transferred out of the Group. Control is presumed to exist when the Group owns directly or indirectly through subsidiaries, more than half of the voting power of an entity unless in exceptional cases, it can be clearly demonstrated that such ownership does not constitute control. The consolidated financial statements are prepared using uniform accounting policies for like transactions and other events in similar circumstances. All intercompany balances and transactions, intercompany profits and expenses and gains and losses are eliminated in the consolidation. All intercompany balances, transactions, income and expense and profit and loss are eliminated in full. Non-controlling interests are presented separately from the Parent Company’s equity. The portion of profit or loss and net assets in subsidiaries not wholly-owned are presented separately in the consolidated statement of comprehensive income and consolidated statement of changes in equity, within equity in the consolidated statement of financial position. Losses within a subsidiary are attributed to the non-controlling interests even if that results in a deficit balance. A change in the ownership interest of a subsidiary, without a loss of control, is accounted for as an equity transaction. If the Group loses control over a subsidiary, it: Derecognizes the assets and liabilities of the subsidiary, the carrying amount of any noncontrolling interest and the cumulative translation differences, recorded in equity. Recognizes the fair value of the consideration received, the fair value of any investment retained and any surplus or deficit in profit or loss.
36 PetroEnergy Resources Corporation
Reclassifies the Parent Company’s share of components previously recognized in other comprehensive income to profit or loss or retained earnings, as appropriate.
3.
Changes in Accounting Policies The accounting policies adopted are consistent with those of the previous financial year except for the adoption of the following PFRS, Improvements to PFRS and Philippine Interpretations effective beginning January 1, 2012. Except as otherwise indicated, the adoption of these standards did not have any significant impact on the accounting policies, financial position or performance of the Group. PFRS 7, Financial Instruments: Disclosures - Transfers of Financial Assets (Amendments) The amendments require additional disclosures about financial assets that have been transferred but not derecognized to enhance the understanding of the relationship between those assets that have not been derecognized and their associated liabilities. In addition, the amendments require disclosures about continuing involvement in derecognized assets to enable users of financial statements to evaluate the nature of, and risks associated with, the entity’s continuing involvement in those derecognized assets. The amendments are effective for periods beginning on or after July 1, 2011. Philippine Auditing Standards (PAS) 12, Income Taxes - Deferred Tax: Recovery of Underlying Assets (Amendments) This amendment to PAS 12 clarifies the determination of deferred tax on investment properties measured at fair value. The amendment introduces a rebuttable presumption that the carrying amount of investment properties measured using the fair value model in PAS 40, Investment property, will be recovered through sale and, accordingly, requires that any related deferred tax should be measured on a ‘sale’ basis. The presumption is rebutted if the investment properties is depreciable and it is held within a business model whose objective is to consume substantially all of the economic benefits in the investment properties over time (‘use’ basis), rather than through sale. Furthermore, the amendment introduces the requirement that deferred tax on non-depreciable assets measured using the revaluation model in PAS 16, Property, Plant and Equipment, always be measured on a sale basis of the asset. The amendments are effective for periods beginning on or after January 1, 2012. Future Changes in Accounting Policies The Group will adopt the following new and amended PFRS and Philippine Interpretation enumerated below when these become effective. Except as otherwise indicated, the following new and amended PFRS and Philippine Interpretation will not have significant impact to the consolidated financial statements: Effective in 2013 PAS 1, Presentation of Financial Statements - Presentation of Items of Other Comprehensive Income or OCI (Amendments) The amendments to PAS 1 change the grouping of items presented in OCI. Items that can be reclassified (or “recycled”) to profit or loss at a future point in time (for example, upon derecognition or settlement) will be presented separately from items that will never be recycled. The amendments affect presentation only and have no impact on the Group’s
Annual Report 2012
37
financial position or performance. The amendment becomes effective for annual periods beginning on or after July 1, 2012. The amendments will be applied retrospectively and will result to the modification of the presentation of items of OCI. PFRS 7, Financial instruments: Disclosures - Offsetting Financial Assets and Financial Liabilities (Amendments) These amendments require an entity to disclose information about rights of set-off and related arrangements (such as collateral agreements). The new disclosures are required for all recognized financial instruments that are set off in accordance with PAS 32, Financial Instruments: Presentation. These disclosures also apply to recognized financial instruments that are subject to an enforceable master netting arrangement or ‘similar agreement’, irrespective of whether they are set-off in accordance with PAS 32. The amendments require entities to disclose, in a tabular format unless another format is more appropriate, the following minimum quantitative information. This is presented separately for financial assets and financial liabilities recognized at the end of the reporting period: a) The gross amounts of those recognized financial assets and recognized financial liabilities; b) The amounts that are set off in accordance with the criteria in PAS 32 when determining the net amounts presented in the statement of financial position; c) The net amounts presented in the statement of financial position; The amounts subject to an enforceable master netting arrangement or similar agreement that are not otherwise included in (b) above, including: i.
Amounts related to recognized financial instruments that do not meet some or all of the offsetting criteria in PAS 32; and ii. Amounts related to financial collateral (including cash collateral); and d) The net amount after deducting the amounts in (d) from the amounts in (c) above. The amendments to PFRS 7 are to be retrospectively applied and are effective for annual periods beginning on or after January 1, 2013. The amendments affect disclosures only and have no impact on the Group’s financial position or performance. PFRS 10, Consolidated Financial Statements PFRS 10 replaces the portion of PAS 27, Consolidated and Separate Financial Statements, that addresses the accounting for consolidated financial statements. It also includes the issues raised in SIC 12, Consolidation - Special Purpose Entities. PFRS 10 establishes a single control model that applies to all entities including special purpose entities. The changes introduced by PFRS 10 will require management to exercise significant judgment to determine which entities are controlled, and therefore, are required to be consolidated by a parent, compared with the requirements that were in PAS 27. The standard becomes effective for annual periods beginning on or after January 1, 2013. A reassessment of control was performed by the Parent Company on all its interests in other entities and has determined that there are no additional entities that need to be consolidated or entities to be deconsolidated.
38 PetroEnergy Resources Corporation
PFRS 11, Joint Arrangements PFRS 11 replaces PAS 31, Interests in Joint Ventures, and SIC 13, Jointly Controlled Entities - Non-Monetary Contributions by Venturers. PFRS 11 removes the option to account for jointly controlled entities using proportionate consolidation. Instead, jointly controlled entities that meet the definition of a joint venture must be accounted for using the equity method. The standard becomes effective for annual periods beginning on or after January 1, 2013. PFRS 12, Disclosure of Interests in Other Entities PFRS 12 includes all of the disclosures related to consolidated financial statements that were previously in PAS 27, as well as all the disclosures that were previously included in PAS 31 and PAS 28, Investments in Associates. These disclosures relate to an entity’s interests in subsidiaries, joint arrangements, associates and structured entities. A number of new disclosures are also required. The standard becomes effective for annual periods beginning on or after January 1, 2013. The Group will comply with the disclosure requirements of PFRS 12. The adoption will not have an impact on the Group’s financial position or performance. PFRS 13, Fair Value Measurement PFRS 13 establishes a single source of guidance under PFRSs for all fair value measurements. PFRS 13 does not change when an entity is required to use fair value, but rather provides guidance on how to measure fair value under PFRS when fair value is required or permitted. This standard should be applied prospectively as of the beginning of the annual period in which it is initially applied. Its disclosure requirements need not be applied in comparative information provided for periods before initial application of PFRS 13. The standard becomes effective for annual periods beginning on or after January 1, 2013. The Group does not anticipate that the adoption of this standard will have a significant impact on its financial position and performance. PAS 19, Employee Benefits (Revised) Amendments to PAS 19 range from fundamental changes such as removing the corridor mechanism and the concept of expected returns on plan assets to simple clarifications and rewording. The revised standard also requires new disclosures such as, among others, a sensitivity analysis for each significant actuarial assumption, information on asset-liability matching strategies, duration of the defined benefit obligation, and disaggregation of plan assets by nature and risk. The amendments become effective for annual periods beginning on or after January 1, 2013. Once effective, the Group has to apply the amendments retroactively to the earliest period presented.
Annual Report 2012
39
The Group reviewed its existing employee benefits and determined that the amended standard has significant impact on its accounting for retirement benefits. The Group obtained the services of an external actuary to compute the impact to the financial statements upon adoption of the standard. The effects are below: As at December 31, 2011 Consolidated statement of financial position Increase (decrease) in: Net defined benefit liability Deferred tax asset Retained earnings Other comprehensive income
($8,853) (2,656) 19,780 (13,583)
As at January 1, 2011
($29,593) (8,878) 20,715 –
2011 Consolidated statement of income Increase (decrease) in: Net pension expense Deferred tax benefit Profit for the year Attributable to equity holders of the Parent Company Attributable to non-controlling interests
$1,298 389 ($909) ($909) – $909 2011
Consolidated statement of comprehensive income Increase (decrease) in: Profit for the year Remeasurements of net defined liability (net of tax) Total comprehensive income Attributable to equity holders of the Parent Company Attributable to non-controlling interests
($909) (13,583) ($14,492) ($14,492) – ($14,492)
PAS 27, Separate Financial Statements (as revised in 2011) As a consequence of the issuance of the new PFRS 10, Consolidated Financial Statements, and PFRS 12, Disclosure of Interests in Other Entities, what remains of PAS 27 is limited to accounting for subsidiaries, jointly controlled entities, and associates in the separate financial statements. The adoption of the amended PAS 27 will not have a significant impact on the separate financial statements of the entities in the Group. The amendment becomes effective for annual periods beginning on or after January 1, 2013.
40 PetroEnergy Resources Corporation
PAS 28, Investments in Associates and Joint Ventures (as revised in 2011) As a consequence of the issuance of the new PFRS 11 and PFRS 12, PAS 28, Investments in Associates has been renamed PAS 28, Investments in Associates and Joint Ventures, and describes the application of the equity method to investments in joint ventures in addition to associates. The amendment becomes effective for annual periods beginning on or after January 1, 2013. Philippine Interpretation IFRIC 20, Stripping Costs in the Production Phase of a Surface Mine This interpretation applies to waste removal costs (“stripping costs”) that are incurred in surface mining activity during the production phase of the mine (“production stripping costs”). If the benefit from the stripping activity will be realized in the current period, an entity is required to account for the stripping activity costs as part of the cost of inventory. When the benefit is the improved access to ore, the entity should recognize these costs as a non-current asset, only if certain criteria are met (“stripping activity asset”). The stripping activity asset is accounted for as an addition to, or as an enhancement of, an existing asset. After initial recognition, the stripping activity asset is carried at its cost or revalued amount less depreciation or amortization and less impairment losses, in the same way as the existing asset of which it is a part. The Group expects that this interpretation will not have any impact on its financial position or performance. This interpretation becomes effective for annual periods beginning on or after January 1, 2013. Effective in 2014 PAS 32, Financial Instruments: Presentation - Offsetting Financial Assets and Financial Liabilities (Amendments) The amendments clarify the meaning of “currently has a legally enforceable right to set-off” and also clarify the application of the PAS 32 offsetting criteria to settlement systems (such as central clearing house systems) which apply gross settlement mechanisms that are not simultaneous. The amendments affect presentation only and have no impact on the Group’s financial position or performance. The amendments to PAS 32 are to be retrospectively applied for annual periods beginning on or after January 1, 2014. Effective in 2015 PFRS 9, Financial Instruments PFRS 9, as issued, reflects the first phase on the replacement of PAS 39, Financial Instruments: Recognition and Measurement and applies to the classification and measurement of financial assets and liabilities as defined in PAS 39. Work on impairment of financial instruments and hedge accounting is still ongoing, with a view to replacing PAS 39 in its entirety. PFRS 9 requires all financial assets to be measured at fair value at initial recognition. A debt financial asset may, if the fair value option (FVO) is not invoked, be subsequently measured at amortized cost if it is held within a business model that has the objective to hold the assets to collect the contractual cash flows and its contractual terms give rise, on specified dates, to cash flows that are solely payments of principal and interest on the principal outstanding. All other debt instruments are subsequently measured at fair value through profit or loss. All equity financial assets are measured at fair value either through other comprehensive income (OCI) or profit or loss. Equity financial assets held for trading must be measured at fair value through profit or loss. For FVO liabilities, the amount of change in the fair value of a liability that is attributable to changes in credit risk must be presented in OCI.
Annual Report 2012
41
The remainder of the change in fair value is presented in profit or loss, unless presentation of the fair value change in respect of the liability’s credit risk in OCI would create or enlarge an accounting mismatch in profit or loss. All other PAS 39 classification and measurement requirements for financial liabilities have been carried forward into PFRS 9, including the embedded derivative separation rules and the criteria for using the FVO. The adoption of the first phase of PFRS 9 will have an effect on the classification and measurement of the Group’s financial assets, but will potentially have no impact on the classification and measurement of financial liabilities. PFRS 9 is effective for annual periods beginning on or after January 1, 2015. SEC Memo 3-2012 In compliance with SEC memorandum Circular No.3, series of 2012, the Group has conducted a study on the impact of an early adoption of PFRS 9. After careful consideration of the results on the impact evaluation, the Group has decided not to early adopt PFRS 9 for its 2012 annual financial reporting. Therefore, these consolidated financial statements do not reflect the impact of the said standard. Philippine Interpretation IFRIC 15, Agreements for the Construction of Real Estate This interpretation covers accounting for revenue and associated expenses by entities that undertake the construction of real estate directly or through subcontractors. The interpretation requires that revenue on construction of real estate be recognized only upon completion, except when such contract qualifies as construction contract to be accounted for under PAS 11 or involves rendering of services in which case revenue is recognized based on stage of completion. Contracts involving provision of services with the construction materials and where the risks and reward of ownership are transferred to the buyer on a continuous basis will also be accounted for based on stage of completion. The SEC and the Financial Reporting Standards Council (FRSC) have deferred the effectivity of this interpretation until the final Revenue standard is issued by the International Accounting Standards Board (IASB) and an evaluation of the requirements of the final Revenue standard against the practices of the Philippine real estate industry is completed. Annual Improvements to PFRSs (2009-2011 cycle) The Annual Improvements to PFRSs (2009-2011 cycle) contain non-urgent but necessary amendments to PFRSs. The amendments are effective for annual periods beginning on or after January 1, 2013 and are applied retrospectively. Earlier application is permitted. PFRS 1, First-time Adoption of PFRS - Borrowing Costs The amendment clarifies that, upon adoption of PFRS, an entity that capitalized borrowing costs in accordance with its previous generally accepted accounting principles, may carry forward, without any adjustment, the amount previously capitalized in its opening statement of financial position at the date of transition. Subsequent to the adoption of PFRS, borrowing costs are recognized in accordance with PAS 23, Borrowing Costs. The amendment does not apply to the Group as it is not a first-time adopter of PFRS.
42 PetroEnergy Resources Corporation
PAS 1, Presentation of Financial Statements - Clarification of the requirements for comparative information The amendments clarify the requirements for comparative information that are disclosed voluntarily and those that are mandatory due to retrospective application of an accounting policy, or retrospective restatement or reclassification of items in the consolidated financial statements. An entity must include comparative information in the related notes to the consolidated financial statements when it voluntarily provides comparative information beyond the minimum required comparative period. The additional comparative period does not need to contain a complete set of financial statements. On the other hand, supporting notes for the third balance sheet (mandatory when there is a retrospective application of an accounting policy, or retrospective restatement or reclassification of items in the consolidated financial statements) are not required. The amendments affect disclosures only and have no impact on the Group’s financial position or performance. PAS 16, Property, Plant and Equipment - Classification of servicing equipment The amendment clarifies that spare parts, stand-by equipment and servicing equipment should be recognized as property, plant and equipment when they meet the definition of property, plant and equipment and should be recognized as inventory if otherwise. The amendment will not have any significant impact on the Group’s financial position or performance. PAS 32, Financial Instruments: Presentation - Tax effect of distribution to holders of equity instruments The amendment clarifies that income taxes relating to distributions to equity holders and to transaction costs of an equity transaction are accounted for in accordance with PAS 12. The Group expects that this amendment will not have any impact on its financial position or performance. PAS 34, Interim Financial Reporting - Interim financial reporting and segment information for total assets and liabilities The amendment clarifies that the total assets and liabilities for a particular reportable segment need to be disclosed only when the amounts are regularly provided to the chief operating decision maker and there has been a material change from the amount disclosed in the entity’s previous annual financial statements for that reportable segment. The amendment affects disclosures only and has no impact on the Group’s financial position or performance.
4.
Summary of Significant Accounting Policies Revenue Recognition Revenue is recognized to the extent that it is probable that the economic benefits will flow to the Group and the income can be reliably measured. The Group assesses its revenue arrangements against specific criteria in order to determine if it is acting as principal or agent. The Group has concluded that it is acting as principal in all of its revenue arrangements. The following specific recognition criteria must also be met before revenue is recognized: Oil Revenues Revenues from oil wells are recognized as income at the time of production.
Annual Report 2012
43
Interest Income Interest income is recognized as the interest accrues taking into account the effective yield on the asset. Miscellaneous Income Miscellaneous income include dividend income and gain on sale of transportation equipment. Revenue is recognized when the Group’s right to receive the payment is established. Cash and Cash Equivalents Cash includes cash on hand and in banks. Cash equivalents are short-term, highly liquid investments that are readily convertible to known amounts of cash with original maturities of three (3) months or less from the dates of acquisition and that are subject to an insignificant risk of change in value. Financial Instruments Date of recognition The Group recognizes a financial asset or a financial liability in the consolidated statement of financial position when it becomes a party to the contractual provisions of the instrument. Purchases or sales of financial assets that require delivery of assets within the time frame established by regulation or convention in the marketplace are recognized on the settlement date. Initial Recognition and Measurement Financial assets within the scope of PAS 39 are classified as either financial assets at fair value through profit or loss (FVPL), loans and receivables, held to maturity (HTM) investments and available-for-sale (AFS) financial assets, as appropriate. Financial liabilities are classified as either financial liabilities at FVPL or other financial liabilities. The classification depends on the purpose for which the investments are acquired and the Group determines the classification of the financial instruments at initial recognition and, where allowed and appropriate, re-evaluates this designation at each financial year-end. All financial assets are initially recognized at fair value plus, in the case of financial assets not at FVPL, directly attributable transaction costs. All financial liabilities are initially recognized at fair value, less, in the case of financial liabilities not at FVPL, directly attributable transaction costs. The Group’s financial assets include financial assets at FVPL and loans and receivables and its financial liabilities are of the nature of other financial liabilities. Subsequent Measurement The subsequent measurement bases for financial assets depend on the classification. Financial assets that are classified as loans and receivables are measured at amortized cost using the effective interest rate (EIR) method. Amortized cost is calculated by taking into account any discount, premium and transaction costs on acquisition, over the period to maturity. Amortization of discounts, premiums and transaction costs are taken directly to the consolidated statement of comprehensive income. Determination of Fair Value The fair value for financial instruments traded in active markets at the consolidated reporting date is based on their quoted market price or dealer price quotations (bid price for long positions and ask price for short positions), without any deduction for transaction costs. When current bid and ask prices are not available, the price of the most recent transaction provides evidence of the current fair value as long as there has not been a significant change in economic circumstances since the time of the transaction.
44 PetroEnergy Resources Corporation
For all other financial instruments not listed in an active market, the fair value is determined by using appropriate valuation techniques. Valuation techniques include net present value technique, comparison to similar instruments for which market observable prices exist and other relevant valuation models. Day 1 Difference Where the transaction price in a non-active market is different to the fair value from other observable current market transactions in the same instrument or based on a valuation technique whose variables include only data from observable market, the Group recognizes the difference between the transaction price and fair value (a Day 1 difference) in the consolidated statement of comprehensive income unless it qualifies for recognition as some other type of asset or liability. In cases where variables used is made of data which is not observable, the difference between the transaction price and model value is only recognized in the consolidated statement of comprehensive income when the inputs become observable or when the instrument is derecognized. For each transaction, the Group determines the appropriate method of recognizing the ‘Day 1’ difference amount. Loans and Receivables Loans and receivables are financial assets with fixed or determinable payments and fixed maturities that are not quoted in an active market. They are not entered into with the intention of immediate or short-term resale and are not designated as AFS financial assets or financial assets at FVPL. After initial measurement, loans and receivables are subsequently measured at amortized cost using the EIR method, less allowance for impairment. Amortized cost is calculated by taking into account any discount or premium on acquisition and fees that are an integral part of the EIR. Classified under this category are the Group’s cash in banks, short-term investments, receivables, and restricted cash (see Notes 6, 8, 19 and 14). Financial Assets and Financial Liabilities at FVPL Financial assets and financial liabilities at FVPL include financial assets and financial liabilities held for trading purposes, derivative instruments, or those designated by management upon initial recognition as at FVPL, subject to any of the following criteria: the designation eliminates or significantly reduces the inconsistent treatment that would otherwise arise from measuring the assets or liabilities or recognizing gains or losses on them on a different basis; or the assets and liabilities are part of a group of financial assets, financial liabilities or both which are managed and their performance are evaluated on a fair value basis, in accordance with a documented risk management or investment strategy; or the financial instrument contains an embedded derivative, unless the embedded derivative does not significantly modify the cash flows or it is clear, with little or no analysis, that it would not be separately recorded. Financial assets and financial liabilities at FVPL are recorded in the consolidated statement of financial position at fair value. Changes in fair value are reflected in the consolidated statement of comprehensive income. Interest earned or incurred is recorded in interest income or expense, respectively.
Annual Report 2012
45
Dividend income is recognized according to the terms of the contract, or when the right of the payment has been established. Classified as financial assets at FVPL are the Group’s marketable equity securities held for trading purposes and investment in golf club shares (see Note 7). Derivative Financial Instruments Derivative financial instruments (including bifurcated embedded derivatives), if any, are initially recognized at fair value on the date at which the derivative contract is entered into and is subsequently remeasured at fair value. Any gains or losses arising from changes in fair value of the derivative (except those accounted for as accounting hedges) is taken directly to the consolidated statement of comprehensive income under “Miscellaneous income”. The derivative is carried as asset when the fair value is positive and as liability when the fair value is negative. The Group has no derivative financial instruments as at December 31, 2012 and 2011. Embedded Derivatives An embedded derivative is separated from the host financial or non-financial contract and accounted for as a derivative if all of the following conditions are met: the economic characteristics and risks of the embedded derivative are not closely related to the economic characteristic of the host contract; a separate instrument with the same terms as the embedded derivative would meet the definition of a derivative; and the hybrid or combined instrument is not recognized at FVPL. The Group assesses whether embedded derivatives are required to be separated from host contracts when the Group first becomes a party to the contract. Reassessment only occurs if there is a change in the terms of the contract that significantly modifies the cash flows that would otherwise be required. Embedded derivatives that are bifurcated from the host contracts are accounted for as financial assets or liabilities at FVPL. Changes in fair values are included in the consolidated statement of comprehensive income. As of December 31, 2012 and 2011, the Group has no embedded derivatives requiring bifurcation. AFS Financial Assets AFS financial assets are those which are designated as such and are purchased and held indefinitely, and may be sold in response to liquidity requirements or changes in market conditions. AFS financial assets include equity securities. After initial measurement, AFS financial assets are measured at fair value. The unrealized gains and losses arising from the fair valuation of AFS financial assets are excluded from reported earnings and are reported in the consolidated statement of financial position and consolidated statement of changes in equity.
46 PetroEnergy Resources Corporation
When the security is disposed of, the cumulative gain or loss previously recognized in the consolidated statement of changes in equity is recognized in the consolidated statement of comprehensive income. Where the Group holds more than one investment in the same security, these are deemed to be disposed of on a first-in first-out basis. Dividends earned in AFS financial assets are recognized in the consolidated statement of comprehensive income when right to receive payment has been established. The losses arising from impairment of such investments are recognized in the consolidated statement of comprehensive income. As of December 31, 2012 and 2011, the Group has no AFS financial assets. HTM investments HTM investments are quoted nonderivative financial assets with fixed or determinable payments and fixed maturities for which management has the positive intention and ability to hold to maturity. Where the Group sells other than an insignificant amount of HTM investments, the entire category would be tainted and reclassified as AFS financial assets. After initial measurement, these investments are measured at amortized cost using the effective interest method, less impairment in value. Amortized cost is calculated by taking into account any discount or premium on acquisition and fees that are integral parts of the effective interest rate. The amortization is included in interest income in the consolidated statement of income. Gains and losses are recognized in the consolidated statement of income under “Other income” when the HTM investments are derecognized and impaired, as well as through the amortization process. As of December 31, 2012 and 2011, the Group has no HTM investments. Other Financial Liabilities All financial liabilities are initially recognized at the fair value of the consideration received less directly attributable transaction costs. After initial recognition, other financial liabilities are subsequently measured at amortized cost using the EIR method. Gains and losses are recognized in the consolidated statement of comprehensive income when the liabilities are derecognized or impaired, as well as through the amortization process. Classified under this category are the Group’s accounts payable, accrued expenses and loans payable (see Notes 15, 16 and 24). Classification of Financial Instruments between Debt and Equity A financial instrument is classified as debt, if it provides for a contractual obligation to: deliver cash or another financial asset to another entity; or exchange financial assets or financial liabilities with another entity under conditions that are potentially unfavorable to the Group; or satisfy the obligation other than by the exchange of a fixed amount of cash or another financial asset for a fixed number of own equity shares. If the Group does not have an unconditional right to avoid delivering cash or another financial asset to settle its contractual obligation, the obligation meets the definition of a financial liability. The components of issued financial instruments that contain both liability and equity elements are accounted for separately, with the equity component being assigned the residual amount, after deducting from the instrument as a whole the amount separately determined as the fair value of the liability component on the date of issue.
Annual Report 2012
47
The Group has no financial instruments that contain both liability and equity elements. Impairment of Financial Assets The Group assesses at each reporting date whether a financial or group of financial assets is impaired. A financial asset or a group of financial assets is deemed to be impaired if, and only if, there is objective evidence of impairment as a result of one or more events that has occurred after the initial recognition of the asset (an incurred ‘loss event’) and that loss event (or events) has an impact on the estimated future cash flows of the financial asset or the group of financial assets that can be reliably estimated. Evidence of impairment may include indications that the borrower or a group of borrowers is experiencing significant financial difficulty, default or delinquency in interest or principal payments, the probability that they will enter bankruptcy or other financial reorganization and where observable data indicate that there is measurable decrease in the estimated future cash flows, such as changes in arrears or economic conditions that correlate with defaults. Loans and Receivables The Group first assesses whether objective evidence of impairment exists individually for financial assets that are individually significant or collectively for financial assets that are not individually significant. If there is an objective evidence that an impairment loss on loans and receivables carried at amortized cost has been incurred, the amount of the loss is measured as the difference between the asset’s carrying amount and the present value of estimated future cash flows (excluding future expected credit losses that have not been incurred) discounted at the financial asset’s original effective interest rate (i.e., the effective interest rate computed at initial recognition). If it is determined that no objective evidence of impairment exists for an individually assessed financial asset loan or receivable, whether significant or not, the asset is included in a group of financial assets with similar credit risk characteristics and that group of financial assets is collectively assessed for impairment. Assets that are individually assessed for impairment and for which an impairment loss is or continues to be recognized are not included in a collective assessment of impairment. The carrying amount of the asset is reduced through the use of an allowance for impairment loss account. The amount of the loss shall be recognized in the consolidated statement of comprehensive income. If, in a subsequent period, the amount of the impairment loss decreases, and the decrease can be related objectively to an event occurring after the impairment was recognized, the previously recognized impairment loss is reversed. Any subsequent reversal of an impairment loss is recognized in the consolidated statement of comprehensive income, to the extent that the carrying value of the asset does not exceed what would have been the amortized cost at the reversal date had there been no impairment recognized. AFS Financial Assets If an AFS financial asset is impaired, an amount comprising the difference between its cost (net of any principal payment and amortization) and its current fair value, less any impairment loss previously recognized in profit and loss, is transferred from the consolidated statement of changes in equity to profit and loss. Impairment reversals in respect of equity instruments classified as AFS financial assets are not recognized in the consolidated statement of income. Reversals of
48 PetroEnergy Resources Corporation
impairment losses on debt instruments are reversed through profit and loss, if the increase in fair value of the instrument can be objectively related to an event occurring after the impairment loss was recognized in profit and loss. The amount of reversal is limited to the amount that brings the carrying value of the debt instrument to what it could have been had there been no impairment in the first place. Derecognition of Financial Assets and Liabilities A financial asset (or where applicable, a part of a group of financial assets) is derecognized when: the rights to receive cash flows from the assets have expired; the Group retains the right to receive cash flows from the asset, but has assumed an obligation to pay them in full without material delay to a third-party under a “pass-through” arrangement; or the Group has transferred substantially all the risks and rewards of the asset, or has neither transferred nor retained substantially all the risks and rewards of the asset, but has transferred control of the asset. Where the Group has transferred the rights to receive cash flows from an asset or has entered into a pass-through arrangement and has neither transferred nor retained substantially all the risks and rewards of the asset nor transferred control of the asset, the asset is recognized to the extent of the Group’s continuing involvement in the asset. Continuing involvement that takes the form of a guarantee over the transferred asset is measured at the lower of the original carrying amount of the asset and the maximum amount of consideration that the Group could be required to repay. Financial Liabilities Financial liabilities are derecognized when the obligation under the liability is discharged, cancelled or has expired. Where an existing financial liability is replaced by another from the same lender on substantially different terms, or the terms of an existing liability are substantially modified, such an exchange or modification is treated as a derecognition of the original liability and the recognition of a new liability, and the difference in the respective carrying amounts is recognized in the consolidated statement of comprehensive income. Offsetting Financial Instruments Financial assets and financial liabilities are offset and the net amount reported in the consolidated statement of financial position if, and only if, there is a currently enforceable legal right to offset the recognized amounts and there is an intention to settle on a net basis, or to realize the asset and settle the liability simultaneously. Crude Oil Inventory Crude oil inventory is stated at fair market value. Advances, Prepaid Expenses and Other Current Assets Advances, prepaid expenses and other current assets pertain to resources controlled by the Group as a result of past events and from which future economic benefits are expected to flow to the Group.
Annual Report 2012
49
Property, Plant and Equipment Property, plant and equipment are stated at cost less accumulated depletion, depreciation and amortization and any accumulated impairment losses. The initial cost of the property, plant and equipment consists of its purchase price, including any import duties, taxes and any directly attributable costs of bringing the assets to its working condition and location for its intended use and abandonment costs. Expenditures incurred after the fixed assets have been put into operation, such as repairs and maintenance, are normally charged to income in the period in which the costs are incurred. In situations where it can be clearly demonstrated that the expenditures have resulted in an increase in the future economic benefits expected to be obtained from the use of an item of property, plant and equipment beyond its originally assessed standard of performance, the expenditures are capitalized as an additional cost of property, plant and equipment. Depreciation of an item of property, plant and equipment begins when it becomes available for use, i.e., when it is in the location and condition necessary for it to be capable of operating in the manner intended by management. Depreciation ceases at the earlier of the date that the item is classified as held for sale (or included in a disposal group that is classified as held for sale) in accordance with PFRS 5, Non-current Assets Held for Sale and Discontinued Operations, and the date the asset is derecognized. When the assets are retired or otherwise disposed of, the cost and the related accumulated depreciation are removed from the accounts and any resulting gain or loss is reflected in the consolidated statements of income. Wells, platforms and other facilities are depleted using the units-of-production method computed based on estimates of proved reserves. The depletion base includes the exploration and development cost of the producing oilfields. FCRS and production wells - geothermal are depreciated using the straight line method over the useful lives of the assets. The useful life of these assets shall be determined once in the condition necessary for these assets to be capable of operating in the manner intended by management. Other property, plant and equipment are depreciated and amortized using the straight-line method over the estimated useful lives of the assets as follows:
Office condominium units Land improvements Transportation equipment Office improvements Office furniture and other equipment
Number of Years 15 5 4 3 2-3
Wells in progress pertain to those development costs relating to the Service Contract (SC) where oil in commercial quantities are discovered and are subsequently reclassified to “Wells, platforms and other facilities” shown under “Property, plant and equipment” account in the consolidated statements of financial position upon commercial production. Depletion of wells in progress commences upon transfer to property, plant and equipment and related main assets are in the condition necessary for it to be capable of operating in the manner intended by management.
50 PetroEnergy Resources Corporation
The useful lives and depletion, depreciation and amortization methods are reviewed periodically to ensure that the period and method of depletion, depreciation and amortization are consistent with the expected pattern of economic benefits from items of property, plant and equipment. Construction in progress represents property, plant and equipment under construction and is stated at cost. This includes the cost of construction to include materials, labor, professional fees, borrowing costs and other directly attributable costs. Construction in progress is not depreciated until such time the construction is completed. Deferred Oil Exploration Costs The Group follows the full cost method of accounting for exploration costs determined on the basis of each SC area. Under this method, all exploration costs relating to each SC are tentatively deferred pending determination of whether the area contains oil reserves in commercial quantities. The exploration costs relating to the SC where oil in commercial quantities are discovered are subsequently reclassified to “Wells, platforms and other facilities” shown under “Property, plant and equipment” in the consolidated statement of financial position upon substantial completion of the development stage. On the other hand, all costs relating to an abandoned SC are written off in the year the area is permanently abandoned. SCs are considered permanently abandoned if the SCs have expired and/or there are no definite plans for further exploration and/or development. Deferred Geothermal Costs All costs incurred in the geological and geophysical activities such as costs of topographical, geological and geophysical studies; rights of access to properties to conduct those studies; salaries and other expenses of geologists, geophysical crews, or others conducting those studies are charged to profit or loss in the year such costs are incurred. If the results of initial geological and geophysical activities reveal the presence of geothermal resource that will require further exploration and drilling, subsequent exploration and drilling costs are accumulated and deferred under the “Deferred geothermal costs” account in the consolidated statement of financial position. These costs include the following: Costs associated with the construction of temporary facilities; Costs of drilling exploratory and exploratory type stratigraphic test wells, pending determination of whether the wells can produce proved reserves; and Costs of local administration, finance, general and security services, surface facilities and other local costs in preparing for and supporting the drill activities, etc. incurred during the drilling of exploratory wells. If tests conducted on the drilled exploratory wells reveal that these wells cannot produce proved reserves, the capitalized costs are charged to expense except when management decides to use the unproductive wells for recycling or waste disposal. Once the project’s technical feasibility and commercial viability to produce proved reserves are established, the exploration and evaluation assets shall be reclassified to property, plant and equipment.
Annual Report 2012
51
Investment Properties Investment properties consist of land held for capital appreciation or rental to others. Land is stated at cost less any impairment in value. The initial cost of the investment properties comprises of purchase price and any directly attributable costs of bringing the asset to its working condition. Expenditures incurred after the investment properties has been put into operation, such as repairs and maintenance, are normally charged to expense in the year when costs are incurred. In situations where it can be clearly demonstrated that the expenditures have resulted in an increase in the future economic benefits expected to be obtained from the use of an item of investment properties beyond its originally assessed standard of performance, the expenditures are capitalized as an additional cost of investment properties. Investment property is derecognized when either it has been disposed of or when the investment property is permanently withdrawn from use and no future economic benefit is expected from its disposal. Any gains or losses on the retirement or disposal of an investment properties are recognized in the consolidated statements of income in the year of retirement or disposal. Transfers are made to investment properties when, and only when, there is a change in use, evidenced by the end of owner-occupation, commencement of an operating lease to another party or by the end of construction or development. Transfers are made from investment properties when, and only when, there is a change in use, evidenced by commencement of owner-occupation or commencement of development with a view to sell. Interest in Joint Venture Operations A jointly controlled operation involves the use of assets and other resources of the Group and other venturers rather than the establishment of a corporation, partnership or other entity. The Group accounts for the assets it controls and the liabilities it incurs, the expenses it incurs and the share of income that it earns from the sale of crude oil by the joint venture. Impairment of Nonfinancial Assets The Group assesses at each reporting date whether there is an indication that an asset (e.g., property, plant and equipment, investment properties, and deferred oil exploration costs) may be impaired. If any such indication exists, or when annual impairment testing for an asset is required, the Group estimates the asset’s recoverable amount. An asset’s recoverable amount is the higher of an asset’s or cash-generating unit’s fair value less costs to sell and its value in use and is determined for an individual asset, unless the asset does not generate cash inflows that are largely independent of those from other assets or group of assets. Where the carrying amount of an asset exceeds its recoverable amount, the asset is considered impaired and is written down to its recoverable amount. In assessing value in use, the estimated future cash flows are discounted to their present value using a pre-tax discount rate that reflects current market assessments of the time value of money and the risks specific to the asset. In determining fair value less costs to sell, an appropriate valuation model is used. These calculations are corroborated by valuation multiples, quoted share prices for publicly traded companies or other available fair value indicators.
52 PetroEnergy Resources Corporation
An assessment is made at each reporting date as to whether there is any indication that previously recognized impairment losses may no longer exist or may have decreased. If such indication exists, the Group makes an estimate of recoverable amount. A previously recognized impairment loss is reversed only if there has been a change in the estimates used to determine the asset’s recoverable amount since the last impairment loss was recognized. If that is the case, the carrying amount of the asset is increased to its recoverable amount. That increased amount cannot exceed the carrying amount that would have been determined, net of depreciation, had no impairment loss been recognized for the asset in prior years. Such reversal is recognized in the consolidated statements of income unless the asset is carried at revalued amount, in which case the reversal is treated as a revaluation increase. Equity The Group records common stock at par value and additional paid-in capital in excess of the total contributions received over the aggregate par values of the equity shares. When the Group issues more than one class of stock, a separate account is maintained for each class of stock and the number of shares issued. Incremental costs incurred directly attributable to the issuance of new shares are shown in equity as a deduction from proceeds, net of tax. When any member of the Group purchases the Group’s capital stock (treasury shares), the consideration paid, including any attributable incremental costs, is deducted from equity attributable to the Group’s equity holders until the shares are cancelled, reissued or disposed of. Where such shares are subsequently sold or reissued, any consideration received, net of any directly attributable incremental transaction costs and the related tax effects is included in equity. Retained earnings represent accumulated earnings of the entities within the Group less dividends declared and with consideration of any changes in accounting policies and errors applied retroactively. The retained earnings of the Parent Company and its subsidiaries are available for dividends only upon approval and declaration of each of their respective BOD. The Parent Company’s retained earnings available for dividend declaration as of December 31, 2012, 2011 and 2010 amounted to $8.68 million, $6.73 million and $4.83 million, respectively. Taxes Current Income Tax Current income tax assets and liabilities for the current and prior periods are measured at the amount expected to be recovered from or paid to the taxation authorities. The tax rates and tax laws used to compute the amounts are those that are enacted or substantively enacted at the reporting date. Deferred Income Tax Deferred income tax is provided using the balance sheet liability method on temporary differences at the reporting date between the tax bases of assets and liabilities and their carrying amounts for financial reporting purposes. Deferred income tax liabilities are recognized for all taxable temporary differences, with certain exceptions. Deferred income tax assets are recognized for all deductible temporary differences with certain exceptions, and carry forward benefits of unused tax credits from excess minimum corporate income tax (MCIT) over regular corporate income tax (RCIT) and unused net operating loss carryover (NOLCO), to the extent that it is probable that taxable income will be available against which the deductible temporary differences and carry forward benefits of unused tax credits from excess MCIT and unused NOLCO can be utilized.
Annual Report 2012
53
The carrying amount of deferred income tax assets is reviewed at each reporting date and reduced to the extent that it is no longer probable that sufficient taxable income will be available to allow all or part of the deferred income tax asset to be utilized. Unrecognized deferred income tax assets are earned at each reporting date and are recognized to the extent that it has become probable that future taxable income will allow all as part of the deferred income tax and to be recovered. The Group does not recognize deferred income tax assets and deferred income tax liabilities that will reverse during the income tax holiday. Deferred income tax assets and deferred income tax liabilities are offset if a legally enforceable right exists to set off current income tax assets against current income tax liabilities and the deferred income taxes relate to the same taxable entity and the same taxation authority. Retirement Expense Retirement expense is actuarially determined using the projected unit credit valuation method. This method reflects services rendered by employees up to the date of valuation and incorporates assumptions concerning employees’ projected salaries. Actuarial valuations are conducted with sufficient regularity, with option to accelerate when significant changes to underlying assumptions occur. Retirement expense includes current service cost, interest cost, expected return on plan assets, recognized actuarial gains and losses and the effect of any curtailments or settlements. The liability recognized by the Group in respect of the defined benefit plan is the present value of the defined benefit obligation at the reporting date less the fair value of the plan assets, together with adjustments for unrecognized actuarial gains or losses and past service costs that shall be recognized in later periods. The present value of the defined benefit obligation is determined by discounting the estimated future cash inflows using long term government bond risk-free interest rates that have terms to maturity approximating the terms of the related pension liability or applying a single weighted average discount rate that reflects the estimated timing and amount of benefit payments. The Group applies the corridor method whereby actuarial gains and losses are recognized as income or expenses when the cumulative unrecognized actuarial gains or losses of the plan exceed 10% of the higher of the defined benefit obligation and the fair value of plan assets. These gains and losses are recognized over the expected average remaining working lives of the employee participating in the plan. Costs and Expenses Oil production operating expenses are costs incurred to sell crude oil inventory, including transportation, storage and loading, among others. General and administrative expenses constitute costs of administering the business. Costs and expenses are recognized as incurred. Asset Retirement Obligation Provision for asset retirement obligation is recognized when the recognition criteria for a provision are met. Asset retirement obligation are recorded based on the present value of costs expected to settle a legal or constructive obligation to retire an asset. Accretion expense on asset retirement obligation is included in the consolidated statement of comprehensive income. The estimated future costs of dismantling costs are reviewed annually and adjusted as appropriate.
54 PetroEnergy Resources Corporation
Leases The determination of whether an arrangement is, or contains a lease, is based on the substance of the arrangement at inception date, and requires an assessment of whether the fulfillment of the arrangement is dependent on the use of a specific asset or assets, and the arrangement conveys a right to use the asset. A reassessment is made after inception of the lease only if one (1) of the following applies: a. b. c. d.
there is a change in contractual terms, other than a renewal or extension of the arrangement; a renewal option is exercised or an extension granted, unless that term of the renewal or extension was initially included in the lease term; there is a change in the determination of whether fulfillment is dependent on a specified asset; or there is a substantial change to the asset.
Where a reassessment is made, lease accounting shall commence or cease from the date when the change in circumstances gave rise to the reassessment for any of the scenarios above, and at the date of renewal or extension period for the second scenario. Group as a Lessee Leases where the lessor retains substantially all the risks and benefits of ownership of the asset are classified as operating leases. Operating lease payments are recognized as an expense in the profit and loss on a straight-line basis over the lease term. Minimum lease payments are recognized on a straight-line basis while the variable rent is recognized as an expense based on the terms of the leased contract. Group as Lessor Leases where the Group retains substantially all the risk and benefits of ownership of the assets are classified as operating leases. Lease payments received are recognized as income in the consolidated statement of comprehensive income on a straight-line basis over the lease term. Contingent rents are recognized as revenue in the period in which they are earned. Indirect costs incurred in negotiating an operating lease are added to the carrying value of the leased asset and recognized over the lease term on the same basis as the lease income. Jointly Controlled Operation A jointly controlled operation involves the use of assets and other resources of the Group and other venturers rather than the establishment of a corporation, partnership or other entity. The Group accounts for the assets it controls and the liabilities it incurs, the expenses and costs it incurs and the share of income that it earns from the sale of goods or services by the joint venture. Research and Development Costs Research costs are expensed as incurred. Development expenditures on an individual project are recognized as an intangible asset when the Group can demonstrate all of the following: the technical feasibility of completing the intangible asset so that it will be available for use or sale; its intention to complete and its ability to use or sell the asset; how the asset will generate future economic benefits; the availability of resources to complete the asset; and the ability to measure reliably the expenditure during development.
Annual Report 2012
55
Borrowing Costs Interest and other related financing charges on borrowed funds used to finance the acquisition and construction of a qualifying asset (included under property, plant and equipment) are capitalized to the appropriate asset accounts. Capitalization of borrowing costs commences when the expenditures and borrowing costs are being incurred during the construction and related activities necessary to prepare the asset for its intended use are in progress. It is suspended during extended periods in which active development is interrupted and ceases when substantially all the activities necessary to prepare the asset for its intended use are complete. The capitalization is based on the weighted average borrowing cost. The borrowing costs capitalized as part of property and equipment are amortized using the straight-line method over the estimated useful lives of the assets. If after capitalization of the borrowing costs, the carrying amount of the asset exceeds its recoverable amount, an impairment loss is recorded in the consolidated statement of comprehensive income. Interest expense on loans and borrowings is recognized using the EIR method over the term of the loans and borrowings. Provisions Provisions are recognized when the Group has a present obligation (legal or constructive) as a result of a past event, it is probable that an outflow of resources embodying economic benefits will be required to settle the obligation and a reliable estimate can be made of the amount of the obligation. Where the Group expects a provision to be reimbursed, the reimbursement is recognized as a separate asset but only when the reimbursement is virtually certain. If the effect of the time value of money is material, provisions are determined by discounting the expected future cash flows at a pre-tax rate that reflects current market assessments of the time value of money and, where appropriate, the risks specific to the liability. Where discounting is used, the increase in the provision due to the passage of time is recognized as an interest expense. Provisions are reviewed at each reporting date and adjusted to reflect the current best estimate. Contingencies Contingent liabilities are not recognized in the consolidated financial statements. They are disclosed unless the possibility of an outflow of resources embodying economic benefits is remote. Contingent assets are not recognized in the consolidated financial statements but disclosed when an inflow of economic benefit is probable. Foreign Currency-denominated Transactions and Translation The consolidated financial statements are presented in US Dollars, which is the Parent Company’s functional and presentation currency. Each entity in the Group determines its own functional currency and items included in the consolidated financial statements of each entity are measured using that functional currency. Transactions in foreign currencies are initially recorded in the functional currency rate at the date of the transaction. Monetary assets and liabilities denominated in foreign currencies are retranslated at the functional currency closing rate at the reporting date.
56 PetroEnergy Resources Corporation
All differences are taken to the consolidated statements of income with the exception of differences on foreign currency borrowings that provide, if any, a hedge against a net investment in a foreign entity. These are taken directly to equity until disposal of the net investment, at which time they are recognized in the consolidated statements of income. Non-monetary items that are measured in terms of historical cost in foreign currency are translated using the exchange rates as at the dates of initial transactions. Non-monetary items measured at fair value in a foreign currency are translated using the exchange rates at the date when the fair value was determined. The functional currency of the Parent Company’s immediate subsidiary, PGEC, and PGEC’s subsidiary, MGI, is Philippine Peso. As at reporting date, the assets and liabilities of these subsidiaries are translated into the presentation currency of the Group (the US Dollars) at the exchange rate at the reporting date and the consolidated statements of income accounts are translated at weighted average exchange rates for the year. The exchange differences arising on the translation are taken directly to “Cumulative translation adjustment” account in the equity section of the consolidated statements of financial position. Upon disposal of a subsidiary, the deferred cumulative translation adjustment amount recognized in equity relating to that particular subsidiary is recognized in the consolidated statements of income. Earnings Per Share (EPS) Basic earnings per share are computed on the basis of the weighted average number of shares outstanding during the year after giving retroactive effect for any stock dividends declared in the current year. Diluted earnings per share are computed on the basis of the weighted average number of shares outstanding during the year plus the weighted average number of ordinary shares that would be issued on the conversion of all the dilutive potential ordinary shares into ordinary shares. Operating Segment The Group’s operating businesses are organized and managed separately according to the nature of the products and services provided, with each segment representing a strategic business unit that offers different products and services and serves different markets. Financial information on business segments is presented in Note 25 to the consolidated financial statements. Events after the Reporting Period Post year-end events that provide additional information about the Group’s situation at the reporting date (adjusting events) are reflected in the consolidated financial statements, if any. Post year-end events that are not adjusting events are disclosed in the notes to consolidated financial statements when material.
5.
Significant Accounting Judgments, Estimates and Assumptions The preparation of the consolidated financial statements in compliance with PFRS requires the Group to make judgments, estimates and assumptions that affect the reported amounts of assets, liabilities, income and expenses and disclosure of contingent assets and contingent liabilities. Future events may occur which will cause the assumptions used in arriving at the estimates to change. The effects of any change in judgments, estimates and assumptions are reflected in the consolidated financial statements, as they become reasonably determinable. Judgments, estimates and assumptions are continually evaluated and are based on historical experience and other factors, including expectations of future events that are believed to be reasonable under the circumstances.
Annual Report 2012
57
Judgments In the process of applying the Group’s accounting policies, management has made the following judgments, apart from those involving estimations, which has the most significant effect on the amounts recognized in the consolidated financial statements: Determination of Functional Currency The entities within the Group determine the functional currency based on economic substance of underlying circumstances relevant to each entity within the Group. The Parent Company’s functional currency is the US Dollar. The functional currency of PGEC and MGI is Philippine Peso. As of December 31, 2012 and 2011, the Group’s cumulative translation adjustment amounted to $0.78 million and ($0.06 million), respectively. Impairment of Deferred Oil Exploration Costs The Group assesses impairment on deferred oil exploration costs when facts and circumstances suggest that the carrying amount of the asset may exceed its recoverable amount. Until the Group has sufficient data to determine technical feasibility and commercial viability, deferred oil exploration costs need not be assessed for impairment. Facts and circumstances that would require an impairment assessment as set forth in PFRS 6, Exploration for and Evaluation of Mineral Resources, are as follows: The period for which the Group has the right to explore in the specific area has expired or will expire in the near future, and is not expected to be renewed; Substantive expenditure on further exploration for and evaluation of mineral resources in the specific area is neither budgeted nor planned; Exploration for and evaluation of mineral resources in the specific area have not led to the discovery of commercially viable quantities of mineral resources and the entity has decided to discontinue such activities in the specific area; and Sufficient data exist to indicate that, although a development in the specific area is likely to proceed, the carrying amount of the exploration and evaluation asset is unlikely to be recovered in full from successful development or by sale. As of December 31, 2012 and 2011, the carrying value of deferred oil exploration costs amounted to $6.64 million and $5.83 million, respectively (see Note 11). Based on the above mentioned criteria, the Group did not recognize any impairment of deferred oil exploration costs in 2012 and 2011. Estimates and Assumptions The key assumptions concerning the future and other key sources of estimation uncertainty at the reporting date that have a significant risk of causing a material adjustment to the carrying amounts of assets and liabilities within the next financial year are discussed below. Determination of Fair Values of Financial Assets and Liabilities The fair value determinations for financial assets and liabilities are based generally on listed market prices or broker or dealer price quotations. If prices are not readily determinable or if liquidating the positions is reasonably expected to affect market prices, fair value is based on either internal valuation models or management’s estimate of amounts that could be realized under current market conditions, assuming an orderly liquidation over a reasonable period of time (please see Note 24 for the fair value of financial assets and liabilities).
58 PetroEnergy Resources Corporation
Estimating Impairment of Receivables The Group reviews its receivables to assess impairment at least on an annual basis. In determining whether an impairment loss should be recorded in the consolidated statements of income, the Group makes judgments as to whether there is any observable data indicating that there is a measurable decrease in the estimated future cash flows from its receivables. This evidence normally includes direct information about the financial condition and historical payments of the borrower. No impairment losses were recognized in 2012 and 2011. As of December 31, 2012 and 2011, the carrying value of receivables amounted to $1.98 million and $2.08 million, respectively. Accumulated impairment losses amounted to $0.07 million and $0.06 million as of December 31, 2012 and 2011, respectively (see Note 8). Fair Values of Financial Assets and Financial Liabilities The Group carries certain financial assets and liabilities at fair value, which requires extensive use of accounting estimates and judgment. While significant components of fair value measurement were determined using verifiable objective evidence (i.e., foreign exchange rates, interest rates), the amount of changes in fair value would differ if the Group utilized different valuation methodologies. Any changes in fair value of these financial assets and liabilities would affect directly the consolidated statement of comprehensive income (see Note 7). Where the fair values of certain financial assets and financial liabilities recorded in the consolidated statement of financial position cannot be derived from active markets, they are determined using valuation techniques using generally accepted market valuation models. The inputs to these models are taken from observable markets where possible, but where this is not feasible, estimates are used in establishing fair values. Capitalization of Development Costs Development costs are capitalized in accordance with the accounting policy discussed in Note 3. Initial capitalization of costs is based on management’s judgment that technological and economical feasibility is confirmed, usually when a product development project has reached a defined milestone according to an established project management model. If accounting policy on capitalization of development costs are not met, such costs are expensed. Estimating Geothermal Field Reserves MGI performed volumetric reserve estimation and numerical modeling to determine the reserves of the Maibarara geothermal field. As a requirement for project financing, MGI also engaged at its own cost the New Zealand firm Sinclair Knight Merz (SKM) to undertake a comprehensive third-party technical review of the Maibarara geothermal field. This review included analysis of the resource assessment performed in-house by MGI as well as a separate SKM reserve estimation and numerical modeling of the Maibarara reserves. MGI’s simulation indicated a mean (P50) proven reserves of 27.8 MW for 25 years. In contrast, SKM calculated the P50 reserves at 46 MW. At 90% probability (P90), the reserves calculated are 28 MW and 12 MW by SKM and MGI, respectively. SKM concluded that the approach taken by MGI is conservative as it limits reservoir thickness to depths where a maximum thickness of 280°C will be encountered although the measured temperature reached as high as 324°C. There is reasonable confidence that the 20 MW (gross) plant development is feasible as the P90 level appears also conservative as with MGI’s approach.
Annual Report 2012
59
In addition, SKM identified indicated reserves, translating to 10 MW-26 MW in the area south of and outside the current area of development. Since this area is not being tapped at the moment for the 20 MW project, MGI preferred not to estimate such reserves at the moment; however, this provides additional confidence for future project capacity expansion. The results of the reserves calculation are given below.
Reserves Type Proven MGI SKM Indicated SKM MGI
MW Generation Capacity for 25 Years Probability P90 Probability P50 Probability P10 12 28
28 44
51 66
10 -
16 -
26 -
Estimating Proved Group Oil Reserves The Group assesses its estimate of proved reserves on an annual basis based on the report from an independent party hired by the consortium operator to estimate the oil reserves. The independent party estimates the reserves of oil in accordance with accepted volumetric methods, specifically the probabilistic method of estimation. Probabilistic method uses known geological, engineering and economic data to generate a range of estimates and their associated probabilities. Estimating Useful Lives of Property, Plant and Equipment The Group reviews on an annual basis the estimated useful lives of property, plant and equipment based on expected asset utilization as anchored on business plans and strategies that also consider expected future technological developments and market behavior. It is possible that future results of operations could be materially affected by changes in these estimates brought about by changes in the factors mentioned. A reduction in the estimated useful lives of property and equipment would increase the recorded depreciation and amortization expense and decrease noncurrent assets. As of December 31, 2012 and 2011, the Group’s property, plant and equipment amounted to $51.46 million and $21.30 million, respectively (see Note 10). Estimating Impairment of Nonfinancial Assets The Group assesses impairment on its nonfinancial assets (e.g., property, plant and equipment and investment properties) whenever events or changes in circumstances indicate that the carrying amount of an asset may not be recoverable. Among others, the factors that the Group considers important which could trigger an impairment review on its nonfinancial assets include the following: For property, plant and equipment and investment properties, an impairment loss is recognized whenever the carrying amount of an asset exceeds its recoverable amount. The recoverable amount is the higher of an asset’s net selling price and value in use. The net selling price is the amount obtainable from the sale of an asset in an arm’s length transaction while value in use is the present value of estimated future cash flows expected to arise from the continuing use of an asset and from its disposal at the end of its useful life.
60 PetroEnergy Resources Corporation
In determining the present value of estimated future cash flows expected to be generated from the continued use of property, plant and equipment and investment properties, the Group is required to make estimates and assumptions that can materially affect the consolidated financial statements. As discussed in Note 10, production activities in the West Linapacan Oilfield (WLO) remained on suspension mode for the last fifteen (15) years. The investment in WLO included in “Wells, Platforms and Other Facilities” account under property, plant and equipment in the consolidated statements of financial position amount to $6.65 million as of December 31, 2012 and 2011. Management assessed that the said investment is fully recoverable as SC 14-C is not yet expired, with the 15-year extension of the SC as approved by the Department of Energy (DOE), from December 18, 2010 to December 18, 2025 and the existing redevelopment activities led by Pitkin Petroleum Ltd. (Pitkin). Thus, no impairment was recognized for 2012 and 2011. As of December 31, 2012 and 2011, the carrying value of property, plant and equipment amounted to $51.46 million and $21.30 million, respectively (see Note 10); and the carrying value of investment properties amounted to $0.03 million (see Note 12). Retirement Obligation The determination of obligation and cost of pension is dependent on the selection of certain assumptions used in calculating such amounts. Those assumptions, which are described in Note 19 to the consolidated financial statements, include, among others, discount rates and salary increase rates. Actual results that differ from the Group’s assumptions are accumulated and amortized over future periods and therefore, generally affect the recognized expense and recorded obligation in such future periods. While the Group believes that the assumptions are reasonable and appropriate, significant differences in the actual experience or significant changes in the assumptions may materially affect the pension obligations. The related balances follow (see Note 19):
Net pension liabilities Pension benefit obligation Unrecognized net actuarial gains
2012 $78,755 164,092 27,343
2011 $41,862 125,108 15,592
Asset Retirement Obligation - Oil Production Plug and abandonment costs are based on estimates made by the service contract operator. The timing and amount of future expenditures are reviewed annually. Liability and capitalized costs included in property, plant and equipment is equal to the present value of the Group’s proportionate share in the total plug and abandonment costs of the consortium on initial recognition. The amount of asset retirement obligation in the consolidated statements of financial position is increased by the accretion expense charged to operations using the fifteen percent (15%) EIR method over the estimated remaining term of the obligation. As of December 31, 2012 and 2011, asset retirement obligation amounted to $0.24 million and $0.47 million, respectively (see Note 17).
Annual Report 2012
61
Asset Retirement Obligation - Wind Energy and Geothermal Energy Projects In determining the amount of provisions for dismantling, removal and restoration costs, assumptions and estimates are required in relation to the expected costs to dismantle, remove or restore sites and infrastructure when such obligation exists. As of December 31, 2012 and 2011, the Group made an assessment that such obligation does not exist yet in the current stage of operations of the wind energy and geothermal energy projects. Deferred Tax Assets The Group reviews the carrying amounts of deferred tax assets at each reporting date and reduces them to the extent that it is no longer probable that sufficient future taxable profit will be available to allow all or part of the deferred tax assets to be utilized. The Group believes that it will generate sufficient future taxable profit to allow all of the deferred tax assets to be utilized. As of December 31, 2012 and 2011, deferred tax assets amounted to $0.15 million and $0.08 million, respectively. As of December 31, 2012 and 2011, the Group did not recognize deferred tax assets amounting to $0.32 million and $0.19 million because the Group believes that it may not be probable that sufficient taxable income will be available in the near foreseeable future against which the tax benefits can be realized (see Note 20).
6.
Cash and Cash Equivalents Cash on hand and in banks Short-term investments
2012 $1,020,234 20,601,988 $21,622,222
2011 $942,852 20,961,432 $21,904,284
Cash in banks earn interest at the prevailing bank deposit rates. Short-term deposits are made for varying periods of up to three months depending on the immediate cash requirements of the Group, and earn interest at the prevailing short-term deposit rates. In 2012, the Group invested $0.81 million to short-term investments with periods more than three months but less than one year. These investments were presented under advances, prepaid expenses and other current assets (see Note 9). Interest income earned on cash in banks and short-term investments amounted to $0.51 million, $0.52 million and $0.39 million in 2012, 2011 and 2010, respectively.
7.
Financial Assets at FVPL
Marketable equity securities Investment in golf club shares
2012 $125,531 17,296 $142,827
2011 $98,069 10,949 $109,018
Net gain (loss) on fair value changes on financial assets at FVPL included in consolidated statements of income amounted to $24,880, ($79,588) and $5,856 in 2012, 2011 and 2010, respectively.
62 PetroEnergy Resources Corporation
8.
Receivables
Accounts receivable from: Consortium operator Others Interest receivable Less allowance for impairment losses
2012
2011
$2,021,687 1,969 23,717 2,047,373 65,346 $1,982,027
$2,096,717 4,476 36,010 2,137,203 61,187 $2,076,016
The Group’s receivables are mainly due from consortium operator and are due within one year. Carrying values as of year-end approximate their fair values (see Note 24). The table below shows the disclosure of reconciliation of allowance for impairment losses for receivables from a consortium operator: 2012 $61,187 4,159 $65,346
Balances at beginning of year Effect of foreign currency translation Balances at end of year
9.
2011 $61,187 − $61,187
Advances, Prepaid Expenses and Other Current Assets
Advances to contractors - current portion Short-term investments Input VAT Prepaid expenses Deferred financing costs - undrawn portion (Note 16) Others
2012 $3,817,795 814,741 709,412 575,655 542,498 30,600 $6,490,701
2011 $5,991,040 – 452,374 169,188 862,218 26,154 $7,500,974
Advances to contractor pertains to the downpayment to EEI Corporation and various contractors for the construction of power plant in the MGPP (see Note 10). This will be applied against future billings in the course of construction. The current portion of $3.82 million and $5.99 million as of December 31, 2012 and 2011, respectively, which are estimated to be applied against progress billings within one year from reporting date are classified under “Advances, prepaid expenses and other current assets”. Short-term investments pertain to money market placements with maturities of more than three months but less than one year. Input VAT is recoverable in future periods. Prepaid expenses include prepaid insurance and professional fees.
Annual Report 2012
63
Deferred financing cost (DFC) undrawn portion represents the portion of the incidental costs incurred in obtaining the loan pertaining to the undrawn amount of the total loan. As of December 31, 2012 and 2011, DFC - undrawn portion amounted to $0.54 million and $0.86 million, respectively (see Note 16). “Others” pertain to software licenses, advances to employees, supplies and deposits.
64 PetroEnergy Resources Corporation
Annual Report 2012
65
61,798 36,434 98,232 $130,526
506,714 39,751 546,465 $178,008
– – – $5,223,832
8,391,972 1,855,082 10,247,054 $11,294,017
– 228,758
– 724,473
5,223,832 5,223,832
1,176,786 21,541,071
199,415 114,942 (10,163) 304,194 $383,755
$362,986 335,126 (10,163) − 687,949
129,493 69,922 199,415 $163,571
– 362,986
$261,737 101,249 –
Office Furniture and Transportation Equipment Other Equipment $168,244 60,514 –
FCRS and Wells, Platforms and Other Production Wells Geothermal Facilities
2011
98,232 51,764 (46,509) 103,487 $502,380
$228,758 455,334 (78,225) − 605,867
Office Furniture and Transportation Equipment Other Equipment
2012
$627,363 97,110 –
Office Condominium Units and Improvements
$– – –
546,465 84,887 – 631,352 $185,258
− − – – $12,751,733
10,247,054 1,622,262 – 11,869,316 $10,158,066
$20,136,998 218,220 9,067
$724,473 92,137 − − 816,610
$5,223,832 7,527,901 − − 12,751,733
$21,541,071 754,831 – (268,520) 22,027,382
FCRS and Wells, Platforms and Other Production Wells Geothermal Facilities
Office Condominium Units and Improvements
– – – $867,672
– 867,672
$– 867,672 –
Land and Land Improvements
− − – − $918,741
$867,672 51,069 − − 918,741
Land and Land Improvements
– – – $3,440,337
– 3,440,337
$– 3,440,337 –
Construction in Progress
− − – − $26,555,923
$3,440,337 23,115,586 − − 26,555,923
Construction in Progress
Depletion of wells, platforms and other facilities is part of oil production under cost of sales in the consolidated statements of income.
Cost Balance at beginning of year Additions (Note 16) Change in ARO estimate (Notes 17 and 29) Reclassification from deferred oil exploration and geothermal costs (Note 11) Balance at end of year Accumulated depletion and depreciation Balance at beginning of year Depletion and depreciation (Note 22) Balance at end of year Net book value
Cost Balance at beginning of year Additions (Note 16) Disposals Change in ARO estimate (Notes 17 and 29) Balance at end of year Accumulated depletion and depreciation Balance at beginning of year Depletion and depreciation (Note 22) Disposals Balance at end of year Net book value
10. Property, Plant and Equipment
9,089,977 2,001,189 11,091,166 $21,297,963
6,400,618 32,389,129
$21,194,342 4,785,102 9,067
Total
11,091,166 1,873,855 (56,672) 12,908,349 $51,455,856
$32,389,129 32,331,984 (88,388) (268,520) 64,364,205
Total
Foreign Operations Gabon, West Africa Total crude production reached 7.04 Million barrels (mmbo), with daily oil production ranging from 13,500 – 21,600 barrels of oil per day (bopd) from the three oil fields – Etame, Avouma and Ebouri. But due to natural depletion of the field, increased gas contents in a few wells, and transient production downtimes, average daily production was reduced to ~18,000-19,000 bopd compared to 2011’s average of 21,000-22,000 bopd. Nonetheless, the Consortium managed 14 liftings for the year resulting to a net crude export of 7.00 mmbo. High crude oil price for the year averaging US$112 per barrel (bbl) allowed the avoidance of significant revenue decline due to lower production volumes. Alongside current production activities in the three fields, the Etame joint venture partners pursued several major activities aimed at enhancing the ultimate oil recovery from the Etame field and increasing profitability through major facilities upgrade and expansion as well as aggressive exploration of the entire contract area. Etame Expansion Project (EEP) The EEP is an on-going effort led by the block Operator – VAALCO Energy, Inc. - to evaluate the possibility of increasing production to 25,000-30,000 bopd. Tapping both internal Consortium technical resources and external third-party Consultants, the EEP comprises four separate but related investigations: Subsurface simulation study to determine remaining recoverable reserves in low, mid, and high cases; Drilling and completion review to ascertain drilling costs, duration, and design modifications for future well drilling and completion; Facilities evaluation of thirteen (13) potential development options that led to the identification of six hybrid development concepts; and duration, risks, and profitability. In 2011, the EEP team recommended two options to be carried further into the pre-front end engineering design (Pre-FEED) stage. These are the “Etame Production Platform” option and the “Nautipa” option. The former will entail the construction of a full production platform in the central Etame producing field. The other, more preferred, scheme will continue to utilize the current Floating Production Storage and Offloading (FPSO) vessel Petroleo Nautipa throughout the field life combined with a new wellhead platform in Etame. Both cases are now the subject of pre-FEED analysis. This project, which aims to increase production to at least 25,000 bopd, requires new platforms in the central Etame production field and in the greenfield SouthEast Etame/North Tchibala sector. VAALCO Energy Inc., the joint-venture Operator, contracted the engineering firm McDermott to conduct the Detailed Engineering Studies for the new platforms. In November 2012, the partners approved the Final Investment Decision (FID) for this project. Once completed by the 3 rd quarter of 2014, the new platforms can accommodate more production wells for drilling.
66 PetroEnergy Resources Corporation
Brownfield Projects Upgrade The upgrade of both Avouma and Ebouri platforms were carried out in 2012 and are nearing completion. Both platforms were extended to accommodate additional well slots for future drilling. With these additions, the electrical systems of the platforms were likewise upgraded to accommodate additional electrical submersible pumps to be installed. A water knock-out system will also be installed in the Avouma platform, which will increase crude throughput going to the FPSO by enhancing the platform’s capacity to separate water from the oil. As of end of 2012, the water knock-out system had been completely fabricated and was waiting transport and installation in the platform. FPSO Integrity Assessment Related to the “Etame Expansion Project” is the assessment of the existing Floating Production Storage and Offloading (FPSO) Vessel, Petroleo Nautipa, as to its suitability in the enhanced production plan. Allied Marine Services and BASS, well-known marine engineering firms, were contracted to assess the FPSO vessel’s life extension while SGS was engaged to undertake a Topsides Integrity Assessment. The collective output of the three contractors is the identification of corrective actions to maintain the vessel’s structural integrity and ensure continuous operation throughout the life of the field. Shallow Water Exploration Project (SWEP) Current production in the Gabon concession is limited to known fields lying at the center of the permit area in about 80 meters of water. The goal of SWEP is to identify petroleum prospects for future drilling in the northern and northeastern parts of the concession close to the Gabon shore where water depths are 30 meters or less. The SWEP kicked off in 2011 with the interpretation of existing 3D seismic data acquired in 1997. Geological analyses were also performed on boreholes within the Etame permit block and from wells in adjoining blocks via data trade with other Operators. The Partners carried out a new 3D seismic data acquisition from late October to mid November 2011 over a 240 square kilometer area. The 3D seismic data acquired in 2011 over the concession’s shallow water region was processed and, along with existing joint-venture seismic data, analyzed and interpreted in 2012. By mid2012, exploration leads were already mapped; towards the end of the year, some of these leads had been matured into drillable prospects. Given that some of these leads and prospects are situated inside the environmentally sensitive Mayumba marine park, the Consortium is also analyzing options on possible drilling and development of these prospects. In parallel, existing prospects in the deeper portion of the concession area west of the Etame production field, are also being considered for drilling. Schedule and appropriate rig availability may dictate how the Consortium carries out its drilling campaign for both deep and shallow exploratory targets.
Annual Report 2012
67
Drilling Campaign for 2012-2013 The planned start of drilling in mid-2012 was postponed towards the end of the year due to rig unavailability in the region. Nevertheless, engagement of third-party services was readied in anticipation of the late 4th quarter mobilization of the Ben Rinnes rig from Saldanha Bay in South Africa. As of end of December 2012, the rig had already been towed to the Avouma platform for drilling of the first well, EAVOM-3P/3H. The 2012-2013 campaign involves drilling two production wells and one exploratory well, work-over of three wells, and servicing of the two Ebouri wells that recently manifested high gas levels. Drilling activities will continue into 2014 for two more exploration wells and new production wells in the expanded Etame field. Philippine Operations SC 14-C2 - West Linapacan, Northwest Palawan The Parent Company has a working interest in Block “C” of SC 14 situated in offshore Northwest Palawan where oil discoveries were made. On December 15, 1975, pursuant to Section 7 of the Oil Exploration and Development Act of 1972, the Joint Venture (JV) partners entered into a service contract with the Philippine Government through the Department of Energy (DOE) for the exploration, exploitation and development of contract area in offshore Northwest Palawan, Philippines, which was amended from time to time. Production activities in the West Linapacan Oilfield (WLO) remained on suspension mode for the last fifteen (15) years. The investment in WLO included in “Wells, platforms and other facilities” account under “Property, plant and equipment” in the consolidated statements of financial position amounted to $6.65 million as of December 31, 2012 and 2011. Management assessed that the said investment is fully recoverable as SC 14-C is not yet expired, with the 15-year extension of the SC as approved by the DOE, from December 17, 2010 to December 17, 2025, and the existing redevelopment activities led by Pitkin Petroleum Plc (Pitkin). Pitkin completed during the first quarter of 2008 a farm-in to SC 14-C (WLO) on the following terms: To earn 58.29% participating interest in consideration of $1.5 million and to pay the cost of a Geological and Geophysical (G & G) Work Program; Option to fund the drilling of one well; and Option to fund the development costs of the oilfield attributable to the participating interest of the Farmors. As part of the farm-in obligations of Pitkin to maintain the SC in good standing, Pitkin obtained from DOE the 15-year final extension of SC 14-C (WLO), from December 17, 2010 to December 17, 2025 in line with similar extensions granted to other SCs in Palawan, (e.g., SC 6-A Octon and Cadlao). The extension carries the following financial obligation to the DOE: 1) One-time development assistance of $30,000; 2) One-time scholarship fund of $20,000; and 3) Yearly training fund of $20,000 during exploration period and $50,000 during production period.
68 PetroEnergy Resources Corporation
The aforementioned obligations may be treated as operating expenses that are cost-recoverable during production. Earlier plans by Operator Pitkin to drill West Linapacan by 2011 failed to materialize due to unresolved technical questions on the reservoir character of the field. Instead, Pitkin farmed-out half of its 58.29% interest in SC14C2 to RMA (HK) Ltd., a subsidiary of Resource Management Associates Pty Ltd of Australia. The Deed of Assignment for this farm-out filed on April 13, 2011 was subsequently approved by the DOE on July 4, 2011. The farm-out has no effect on the Parent Company’s 1.034% interest and status as free-carried up to the drilling of one well. On April 10, 2012, the DOE officially approved the transfer of the service contract’s Operatorship from Pitkin Petroleum to RMA (HK) Ltd. a subsidiary of Australia-based Resource Management Associates Pty Ltd. This operatorship transfer and the preceding farm-out to RMA (HK) Ltd of Pitkin’s 29.145% interest in the concession would result to the subsequent exploration costs leading to the drilling of one well. This planned drilling, originally targeted by late 2012, had to be rescheduled due to the delay in completion of the reservoir simulation study which is a pre-condition for the JV partners’ approval of the drilling program and budget. To address the risks on the anticipated rig mobilization and drilling posed by the existing 1990 West Linapacan subsea production facilities, the original farmors’ approved a budget to fund a third-party technical study on the best abandonment method. In the meantime, the programmed environmental impact assessment for the drilling activity had been moved to early 2013, after the completion of the reservoir simulation. Drilling of the West Linapacan well, coded WLA-7, has been set on or before the end of June, 2014. PetroEnergy’s participating interests in SC 14-C2 are at 1.03425%, but will be carried free in all subsequent exploration costs up to attainment of first commercial oil in the West Linapacan block. Geothermal Energy Geothermal Renewable Energy Service Contract (GRESC) No. 2010-02-012 On February 1, 2010, the Parent Company signed GRESC No. 2010-02-012 covering the Maibarara Geothermal Field (“the field”) in Laguna and Batangas areas, following a Philippine Energy Contracting Round for Geothermal held by the DOE in November 2009, where the Parent Company emerged as the winning bidder. The field had been previously explored and relevant resource data identified certain portions thereof as having potential stored heat capacity that can produce electricity in commercial quantities. Under this service contract, the Parent Company committed to perform the following during the first contract year of the pre-development stage: (i) Local Government Units (LGU) and stakeholders coordination; (ii) geologic and geophysical studies and resource assessment; (iii) land rights survey and lease; (iv) obtain DENR and other permits; (v) establish logistics station; (vi) land and water supply preparations; and (vii) well work-over and drilling preparations. The expected minimum expenditures for the first contract year amounts to $560,000. For the second contract year, the Parent Company committed to perform (i) work-over of existing wells; (ii) flow-testing and bore output measurements; (iii) engineering and design of steam/brine lines; (iv) grid impact study; and (v) start site preparation and construction of the fluid collection and disposal system and power plant. The expected minimum expenditures is about $17.8 million.
Annual Report 2012
69
On January 5, 2011, the DOE approved the Deed of Assignment and Assumption transferring the GRESC from the Parent Company to MGI. In 2011, the Group reclassified the following costs from deferred geothermal costs to FCRS and production wells - geothermal: LGU and stakeholder coordination Geologic and geophysical studies and resource assessment Land rights survey and lease Obtainment of DENR and other permits Establishment of logistics station Land and water supply preparations Preparation for well work-over and drilling Work-over of existing wells Drilling of new wells Flow-testing and bore output measurements Engineering and design of steam/brine lines Financing, grid impact study and power purchase contract Construction fluid collection
$8,151 166,337 127,662 110,055 19,605 630,067 217,246 2,051,582 1,080,823 394,263 126,946 18,935 272,160 $5,223,832
In 2012, all costs that are directly related to the geothermal power plant project amounting to $23.12 million have been capitalized as construction in progress under property, plant and equipment. The activities during the development phase are as follows: LGU and stakeholder coordination This activity involves coordination with the LGUs in Barangay Puting Lupa in Calamba, Laguna and Barangays San Rafael and San Antonio in Batangas, which have political jurisdiction over the service contract area. It also involves coordinating with the stakeholders such as UP Los Baños in terms of maintaining the Mt. Makiling forest reserve area, among others. This activity is important so as to inform LGUs and the affected stakeholders about the project and enlist their support. During the second quarter of 2011, several CSR activities were undertaken in and around the project area including donation of an ambulance and conduct of medical mission. Payment for crop damages brought about by the discharge activities were given to affected owners in June 2011. MGI also conducted two workshops with the community residents to determine the appropriate livelihood projects that MGI should support. Geologic and geophysical studies and resource assessment This activity involves performing technical studies in the geothermal field such as geologic mapping, reservoir assessment and geochemical sampling. The objective of this activity is to update the resource model as a guide for later drilling and engineering planning.
70 PetroEnergy Resources Corporation
MGI engaged the services of an independent New Zealand firm, Sinclair Knight Mertz (SKM) to conduct a technical due diligence review (third-party review) over the Project, primarily focused on reserves estimates. SKM confirmed a 28 MW resource good for 25 years for the area. On November 11, 2011, based on the report of SKM (among other factors), the DOE confirmed the commerciality of the Maibarara project. Land rights survey and lease This activity involves determining the total land area needed for the entire project and determining which part of the land area are government and private property. For those land area that are still private property, MGI will either buy those parcels of land or secure a lease agreement with the land owners. MGI engaged New R&E Surveying & Engineering Services to do a detailed inventory of the status of public and private lots within the likely development area. This was followed by a new topographic survey that produced an updated topographic map of the area including the location of existing houses and infrastructures (roads, bridges, etc.). Obtainment of DENR and other permits This involves obtaining the Environmental Compliance Certificate (ECC) from the Department of Environment and Natural Resources (DENR) and other necessary permits. The Parent Company engaged SMEC Philippines to conduct the necessary environmental impact study for the project and ensure the release of the ECC. On August 10, 2010, the ECC was released to the Parent Company by the DENR. On December 29, 2010, the DENR approved the change in the proponent’s name for the Parent Company to MGI. As part of the ECC condition, DENR and MGI will forge a memorandum of agreement (MOA) governing a multi-partite monitoring team (MMT). Several discussions were held with the DENR Los Baños office throughout the year regarding this MMT-MOA culminating in the agreements reached last December 2, 2010. In 2011, the team was formed and the MOA was finalized. The MOA includes provision for an environmental guarantee fund in the form of insurance, environmental guarantee cash fund and environmental monitoring fund. The MOA will be executed upon completion of signature of all the members of the team. Establishment of logistics station Producing geothermal steam for power generation requires the delivery, maintenance and safekeeping of many supplies and equipment, not to mention the services of numerous thirdparty contractors and organic personnel. A safe, spacious and secure logistics station to address this operational need for the project was established in Sto. Tomas, Batangas. In March 2010, a lease contract was signed with a lessor for his property to serve as logistics station. This has served as the main site delivery point for many drilling-related consumables such as drill pipes, casings, chemicals, etc.
Annual Report 2012
71
Land and water supply preparations This activity involves preparing the land area and securing enough water supply for the work over and drilling activities. After the ECC was granted, civil works for the construction of deep cellar in Pad A commenced in early September 2010 with the engagement of Media Construction. This new deep cellar will maximize the use of the existing space in Pad A by providing slots for future wells, allow pipelines to be trenched inside the cellar, and minimize disturbance in future drilling and civil works operations. While the cellar was being constructed, repair and relining of the drilling sump was also started; both of these were completed in mid-December 2010 in time for the mobilization of the drilling rig. Simultaneously, the water source for the drilling and future operations of the field was identified and rehabilitated and alvenius pipes were installed to convey water from the well. The necessary pump from the well was secured, a generator set rented, and water lines connected by late December 2010. Preparation for well work-over and drilling The preparation for well work-over and drilling began with the advanced order for long-lead drilling items such as steel casings for relining the wells, drill bits, master valves, and related supplies. It continued with the pull-out and reconditioning of wellhead assemblies in wells Mai-6D, Mai-9D and Mai-11D to ensure their safety and integrity for actual operations. The preparations were completed with the fabrication and installation of necessary cellar supports for the drilling rig. Work-over of existing wells Although the actual work-over of the three (3) existing wells commenced only in January 2011, there were tasks done in 2010 to support this 2011 operations. Among these tasks was the engagement of a drilling consultant beginning in July 2010 to oversee the preparations of the work-over drilling program. Other key contracts signed during this stage were those for the drilling rig, milling tools, cementing services, drilling fluids, mud services, pressure-temperature-spinner logging services, and downhole video and caliper tools. On site, the work-over preparations centered on lowering the wellhead of the three (3) existing wells by cutting down their conductor pipes and casing head flanges. Mobilization to Maibarara of the drilling rig started on December 20, 2010 and was finished by December 31, 2010. In 2011, three (3) existing wells, Mai-6D, Mai-9D, and Mai-11D, were successfully workedover. The first two (2) wells are intended as production wells and the third as a re-injection well. Mai-6D showed very good indications that it will be a good producer because of very good temperature and permeability, as shown in the Heat-up Results. Mai-11D’s completion test showed a very nice kick in temperature, indicating a fast thermal recovery, but with a lower permeability compared to Mai-6D. The important part operationally, however, is its measured capacity to accept fluid, which is about 60 kg/s. When the plant is operated, the required reinjection capacity would be about 58 kg/s. Reinjection is needed in order to contain any potential environmental hazard the brine may carry, and that it will also recharge the reservoir, thereby extending its productive life. As a rule of thumb in geothermal operations, there should be one (1) reinjection well for every two (2) production wells. Mai-9D is less hot than Mai-6D but also showed good permeability.
72 PetroEnergy Resources Corporation
Drilling of new wells In preparation for the planned drilling of two (2) new wells to complete the 20 MW, casing head flanges and expansion spools were already fabricated as early as October 2010. Other long-lead items such as casings, drill bits, valves, etc. were also purchased in advance. In 2011, the negotiation for rig contract with DESCO was done. The rig’s performance as well as capability was evaluated thoroughly and recommendations to DESCO were forwarded in terms of rig rental and additional auxiliary equipment during drilling. MGI paid $0.4 million for the mobilization and demobilization of the rig. In 2012, MB-12D, the third production well, and MB-14D, which wll be used as reinjection for power plant condensates, were drilled. The work-over of well Mai-9D was also carried out for safety reasons. Flow-testing and bore output measurements A well testing supervisor was engaged in early 2010 to identify and, if necessary design all the well testing requirements for the project. Apart from the inventory of the state of the various wellheads and cellars conducted in mid-2010, the preparations for this activity which took place in early 2011 include: (1) the design and fabrication of portable twin-shock silencer; (2) the design and fabrication of webre separator to be used during high-pressure collection of geothermal fluids, and (3) the installation of the discharge set-up, fittings and lines. On March 5, 2011, wells Mai-6D and Mai-9D were successfully discharged. Based on the results of the discharge testing, the potential output of the wells is 15MW. Engineering design of steam/brine lines The technical complement for the Engineering Design Group (EDG) was formed in the latter part of 2010. Two (2) civil works consultant and a Computer-Aided Design and Drafting (CADD) operator were hired to work on the engineering aspects of the steamfield and power plant. EDG completed in December 2010 the conceptual development plan, the initial heat and mass balance, and the piping and instrumentation diagram of the project. Visits to the power plant site and meetings with potential Engineering, Procurement and Construction (EPC) contractor were also conducted during the second half of 2010. Financing, grid impact study and power purchase contract A project-term consultant was engaged to prepare the documents needed for a Grid Impact Study (GIS) application with the National Grid Corporation of the Philippines (NGCP), which was filed on June 20, 2010. In 2011, MGI received the final GIS for the project. In 2010, MGI also went into negotiation with Endesa Carbono, the carbon trading arm of the major Spanish electric utility firm Endesa, for the sale of the carbon credits to be generated by the project. After months of discussion, MGI agreed in December 2010 on the final draft and terms of the carbon credit contracts in which the Company will sell 100% of the carbon credits to be generated by the project to Endesa Carbono, and the latter guarantees to buy these credits beginning in 2013 to at least 2020. The Certified Emission Reductions Purchase Agreement was signed in January 2011.
Annual Report 2012
73
In relation to the agreement with Endesa, MGI engaged the services of AENOR to perform validation of MGPP, in accordance with certain provisions of the Kyoto Protocol. Upon confirmation of commerciality during the latter part of 2011, deferred geothermal costs incurred prior to 2011 amounting to $1.28 million and incurred in 2011 amounting to $3.94 million are reclassified to property, plant and equipment under FCRS and production wells Geothermal. In 2012,MGI mobilized its team and subcontractors with four concrete goals for 2012: 1) complete the steam production and reinjection well capacities, 2) expedite the construction of the steamfield and power plant facilities, 3) secure the right-of-way and initiate the erection of the transmission line, and 4) fortify our relationship with the host community. The completion of the steam requirement for the 20 MW plant was successfully achieved when MGI drilled its first production well, MB-12D, in July -August, 2012 to a total depth of over 2,000 m. After a month of heat-up, MB-12D was successfully flowed for two months yielding chemically benign, low-gas, and high-enthalpy fluid with a power output of as much as 12MW. Along with existing wells Mai-6D and Mai-9D which were worked-over in 2011, MB-12D completed the steam supply requirement for the 20MW plant. Similarly, the drilling of new condensate injection well MB-14RD to a depth of 1,900 m in October, 2012 with resulting good permeability satisfied the well requirement for condensate fluid reinjection. Along with the 2011 work-over of well Mai-11D to be used for hot brine injection, MGI has the necessary wells for the 20 MW facility’s reinjection load. The construction of the steamfield’s piping system, went full blast and neared 53% completion by end 2012. While the engineering design and procurement of the steamfield piping materials were directly handled by MGI, several reputable firms were tapped to undertake different engineering components of the steamfield facility. The steamfield construction works for electrical and insulation will be started in 2013. Parallel power plant EPC activities by EEI Corporation reached over 50% completion by end 2012. Foundation works and some vertical structures were already done for many elements of the power plant facility such as the turbine-generator building, workshop building, raw water tanks, condenser, hotwell pump pit, and cooling tower. At the same time, Fuji Electric Co., Ltd. of Japan, the project’s supplier of major power plant equipment, reported 72% completion of its task in November, 2012. Fuji Electric assured MGI that it will be able to ship the plant equipment to site within the first quarter of 2013. Major challenges, however, delayed start-up of the transmission line (T/L) installation. To address the hurdles, MGI opted for a shorter, 6 km-long, 115 kV line to connect to Meralco’s existing 115 kV substation at the First Philippine Industrial Plant (FPIP) complex in Calamba. This necessitated signing a new interconnection agreement with Meralco and amending the separate transmission agreement between MGI and NGCP. These new contractual relationships effectively mean that MGI’s power output will have to pass through Meralco’s distribution line if it is to be sold by aggregator Trans-Asia to parties other than Meralco. MGI finally signed the tri-partite agreement with Meralco and Trans-Asia, the interconnection agreement with Meralco, and the T/L EPC contract with Miescor all on December, 2012. Construction activities for the 115 kV T/L will start in early 2013. If all the major construction activities are achieved on schedule, the project should be ready for initial commissioning tests by the 3rd quarter of 2013 and for commercial operations by 4th quarter of 2013.
74 PetroEnergy Resources Corporation
Borrowing Cost In 2012 and 2011, MGI capitalized borrowing costs relating to finance charges incurred in the construction of the power plant. The construction is expected to be completed in 2013. Capitalized borrowing costs amounted to $1.68 million and $0.02 million in 2012 and 2011, respectively. The rate used to determine the amount of borrowing costs eligible for capitalization is 7.97%, which is the effective interest rate of loans. Land In 2011, MGI acquired parcels of land from Science Park of the Philippines, Inc. and Philtown Properties, Inc. amounting to $0.6 million and $0.2 million, respectively, to be used as power plant site in the Maibarara Project Area in Sto. Tomas, Batangas.
11. Deferred Oil Exploration Costs
Balance at beginning of year Internal development Reclassification to wells, platforms and other facilities (Note 10) Balance at end of year
2012 $5,831,668 811,535
2011 $6,012,163 996,291
– $6,643,203
(1,176,786) $5,831,668
Under the SCs entered into with the DOE covering certain petroleum contract areas in various locations in the Philippines, the participating oil companies (collectively known as Contractors) are obliged to provide, at their sole risk, the services, technology and financing necessary in the performance of their obligations under these contracts. The Contractors are also obliged to spend specified amounts indicated in the contract in direct proportion to their work obligations. However, if the Contractors fail to comply with their work obligations, they shall pay to the government the amount they should have spent but did not in direct proportion to their work obligations. The participating companies have Operating Agreements among themselves which govern their rights and obligations under these contracts. The full recovery of these deferred costs is dependent upon the discovery of oil in commercial quantities from any of the petroleum concessions and the success of future development thereof. SC 51 - East Visayas On August 5, 2005, a Farm-in Agreement (FIA) was signed by the SC 51 members, including the Parent Company, as Assignors, with Australasian Energy Limited, a corporation existing under the laws of the Isle of Man, and Ottoman Energy Limited, a company organized under the laws of Western Australia as Assignees. The Assignors assigned 80% of their participating interest to the Assignees in SC 51 in consideration for the work obligation including funding, at the Assignees’ sole cost of a seismic survey program. The farminee submitted to the DOE a work program composed of drilling one well and acquisition of seismic data.
Annual Report 2012
75
In 2010, the Operator NorAsian Energy Ltd. (NorAsian) presented its drilling program for an onshore well in San Isidro, Northern Leyte, in lieu of an exploration well that would be drilled in the Offshore Cebu. As part of its fund raising activity, it proposed to amend the FIA to accommodate a new Australian Investor, Swan Oil and Gas Ltd. (Swan). The amendment defines the onshore Leyte area or the North Block, where the two farminees intend to drill an exploration well at their sole cost and consequently be assigned a 40% interest each on the block. Their interests are retained when a second onshore well is drilled. On both cases, the farmors (including the Parent Company) are carried free. The South or the Offshore Area that covers the Argao prospect is also defined. Either of NorAsian or Swan or both can opt to drill the Argao Prospect and earn 80% interest in the whole SC 51 contract area. The farmor partners, Alcorn Gold Resources Corporation (Alcorn), Trans-Asia Oil and Energy Development Corporation (Trans-Asia) and the Parent Company, approved the proposed amendment. A final draft of the Amended FIA is being prepared by NorAsian for signature of all the parties. As a DOE commitment for the Consortium’s Sub-Phase 3 (SP3) work program, the on-shore vertical exploratory well Duhat-1 was spudded in San Isidro, Northwest Leyte on April 20, 2011 to test the hydrocarbon potential of service contract’s northern block. After it was sidetracked, the well (Duhat-1A) reached a total depth of 321m but had to be abandoned on May 25, 2011 after persistent mechanical drilling problems. Although the well failed short of reaching its 1,000m programmed total depth, the Operator/Farminee NorAsian obtained DOE approval to consider Duhat-1A as satisfying the Consortium’s SP3 work commitment. However, this well will not be considered as an “earning” well by the farmors - Alcorn, Trans-Asia, and the Parent Company. NorAsian’s application on February 3, 2011 with the DOE for the approval of Swan’s farm-in for 40% participating interest in SC 51 was approved by the DOE on July 1, 2011. On August 31, 2011, the DOE also approved the consortium’s entry into Sub-Phase 4 (August 1, 2011 to July 31, 2012) with a revised work commitment of acquiring and interpreting 100 line-km of 2D seismic data in northwest Leyte at a budget of $3.0 million. In November 2011, NorAsian completed the scouting survey for this planned 2D seismic study. It subsequently engaged BGP SE Asia to conduct the 2D seismic survey at a slightly expanded budget of $4.3 million. In December 2011, the SC 51 partners reached an internal agreement to revise the farm-in terms to: 1) divide the SC 51 contract area into a northern (northwest Leyte) and southern (offshore Cebu) blocks; 2) the assignment of NorAsian’s putative 40% interest in the south block to Swan thus relinquishing all of NorAsian’s interest in offshore Cebu; 3) the drilling of a second on-shore well in northwest Leyte to complete NorAsian’s farm-in; and 4) a deadline of April 30, 2012 for Swan to commit to the drilling of the offshore Argao prospect in Cebu, or forfeit all its interests and rights in SC 51. Meanwhile in the South Block, the SC 51 Filipino consortium issued a reminder to SWAN Oil & Gas to exercise its financial capability to drill the Argao-1 deepwater well in Cebu by the end of March 2012, with the consequence of being in default with the Consortium. SWAN disputed its default status, but later announced entering into an amicable agreement with the Filipino partners upon exiting SC 51 on September 20, 2012. On January 25, 2012, the DOE approved the Subphase 4 Work Program & Budget (WP&B) of SC 51. The WP&B for SP 4 includes the acquisition, processing and interpretation of 100km of 2D seismic over the Duhat prospect in the North Block, at a total budget of $4.35 million.
76 PetroEnergy Resources Corporation
The operator of the block, Otto Energy, contracted Beijing-based BGP Asia to conduct the 2D seismic survey. Mobilization of the seismic crew started in February 2012. Actual data shooting and acquisition for the 102 line-km 2D seismic survey over the Duhat prospect was conducted from August to October 2012, at a cost of US$ 3.38MM. Following the completion of the 2D seismic program, the Consortium elected on December 12, 2012 to enter SP 5 with a one well drilling commitment. This made way for commencement of Otto’s well design planning and activities to secure a suitable rig to drill the Duhat-2 well in mid-2013. Meanwhile in the “South Block” (offshore Cebu), Swan Oil & Gas relinquished its participating interest to the Filipino partners Trans-Asia Oil and Energy Development Corporation, Alcorn Gold and PetroEnergy. On October 23, 2012, the South Block consortium entered into a Farm-in Option Agreement with Frontier Oil Corporation, regarding the latter’s interest to drill Argao in exchange for 80% participating interest and Operatorship of the South Block. As of end-2012, Frontier is continuing its evaluation of Argao and will decide on its forward plans in early 2013 SC 6-A - Octon-Malajon Block In March 2007, Vitol GPC Investments S.A. (VGI) negotiated a farm-in to the SC 6-A in offshore Palawan. Under the agreement, Vitol will conduct a study on the prospectivity of the block over a one-year period until March 2008, after which it will decide whether to continue or complete the farm-in process. GPC Investments SA (formerly Vitol GPC Investments SA) gave notice in November 2010 of its decision not to exercise its option on the farm in interest in SC 6-A. This followed the failure of the Galoc Consortium to commit to the second development phase of the Galoc Field. Thereafter, Philodrill re-assumed the Operatorship of the Octon Block. In December 2011, to maintain the validity of the SC, the Octon Joint Venture submitted to the DOE a $546,000 work program. It consisted of the reprocessing of 400 sq. km. of the 1997 3D seismic data. Reprocessing would enhance the quality of the seismic information, which would enable the mapping of potential structural drilling targets in the northern portion of the contract area. Following the departure of Vitol GPC from the SC 6A Consortium in late 2010, Pitkin Petroleum Plc, a UK-registered company, signed in July 2011 a farm-in agreement with the consortium members for a 70% participating interest in the block. As farminee, Pitkin will spend, at its own cost, about $5.0 million to acquire, process, and interpret 500 sq. km. of 3D seismic data in Octon. Should it elect to exercise its options, Pitkin may drill up to two production wells at no cost to the farming-out consortium members. On December 6, 2011, the DOE approved the Deed of Assignment transferring the Operatorship and 70% of the service contract interest to Pitkin. Consequently, the Parent Company’s interest in the block was reduced from 16.67% to 5.001% but the Parent Company will be carried free in all subsequent exploration costs up to the drilling of two Octon wells. After the DOE approval of UK-based firm Pitkin Petroleum Plc’s farm-in and Operatorship of SC6A on December 6, 2011, Pitkin commenced preparation for Phase 1 activities, consisting of the acquisition, processing and interpretation of ~500km of 3D seismic data. This new 3D seismic program will help further refine the drilling potential of the prospects and leads in the area. In mid-March 2012, Pitkin sent out tenders to ten (10) seismic firms to carry out the 3D seismic survey with the intention of commencing the survey by mid-February, 2013.
Annual Report 2012
77
However, actual start will depend on securing the approval of local Palawan regulatory agencies. In parallel, environmental permitting as well as information, education, and communication (IEC) activities with the Palawan local government units were also conducted. PetroEnergy’s participating interest in the Octon block was reduced from 16.667% to 5.001% after Pitkin’s farm-in, but the Company will be carried free in all subsequent exploration costs up to the drilling of two Octon wells. SC 47 - Offshore Mindoro and Panay The DOE approved on January 12, 2011 a one-year extension of the Consortium’s Sub-Phase 2 (SP2) work program deadline to July 10, 2011. This would enable the Operator, PNOC Exploration Corporation (PNOC-EC), to finish the evaluation of 2D seismic data acquired by the Partners in 2010. PNOC-EC’s evaluation identified at least six potential leads, most of which were in deep water. To further de-risk these leads and enable the Partners to attract potential farminees, PNOC-EC requested the DOE on June 21, 2011 for a further one-year extension of SP2 to carry out a 500-km 2D seismic survey and a source-to-reservoir migration study. PNOC-EC repeated the extension request in August 2011 but no official DOE response had been received till the end of 2011. In the meantime, PNOC-EC is completing the reservoir study, preparing the program for the additional 500 km 2D seismic survey, and discussing farm-in opportunities with potential investors. PNOC-EC, the service contract Operator, requested for a one-year extension of the contract’s Subphase 2 to July 10, 2012 to conduct detailed source rock-to-reservoir rock migration studies and acquisition of 500km 2D seismic data. These proposed studies were intended to further de-risk the area and attract potential farminees who have been stymied by the discouraging results of the last deep oil well drilled in 2007 by Malaysia’s Petronas. As of end-2012, the application for Subphase 2 extension was still pending approval by the DOE. While awaiting DOE approval, the SC 47 Consortium has been actively seeking potential farminees to carry out the drilling of one (1) exploratory well, as programmed for the subsequent Subphase 3. PetroEnergy’s participating interest in SC 47 remains at 2.00%, PNOC-EC at 97%, and Basic Energy at 1%. PetroEnergy’s participating interests in SC 47 remain at 2.00%. As of December 31, 2012, 2011 and 2010, the corresponding percentages of the Group’s participation in the various SC areas are as follows: NW Palawan - SC 6-A East Visayas - SC 51 Gabonese Oil Concessions Offshore Mindoro - SC 47
2012 5.001% 4.012% 2.525% 2.000%
2011 5.001% 4.012% 2.525% 2.000%
2010 16.670% 4.012% 2.525% 2.000%
78 PetroEnergy Resources Corporation
12. Investment Properties As of December 31, 2012 and 2011, this account consists of land with total carrying value of $31,417. The fair value of the investment properties of the Group amounted to $47,683 and $36,734 as of December 31, 2012 and 2011, respectively. The fair values of the Group’s investment properties have been determined on the basis of recent sales of similar properties in the same areas as the investment properties and taking into account the economic conditions prevailing at the time the valuations were made. Except for insignificant amounts of real property taxes on the investment properties, no other expenses were incurred, and no income was earned in relation to the investment properties in 2012, 2011 and 2010.
13. Investment in Navy Road Development Corporation (NRDC) As of December 31, 2012 and 2011, this account consists of: Acquisition cost Advances
$260,388 54,032 314,420 314,420 $–
Less accumulated impairment loss
Investment in NRDC represents investment in subsidiary due to the Group’s 100% holdings in NRDC’s capital stock. Below is NRDC’s financial position as of December 31, 2012 and 2011: Financial Position Current assets Noncurrent assets Allowance for impairment Total Assets Current liabilities Noncurrent liabilities Total Liabilities Net assets
$− 366,193 (366,193) – − − – $–
As of December 31, 2012 and 2011, NRDC has not commenced commercial operations and has not incurred any expenses in 2012, 2011 and 2010. Management intends to liquidate NRDC and has provided for full impairment losses on this investment.
Annual Report 2012
79
14. Advances and Other Noncurrent Assets
Advance rent - noncurrent portion Restricted cash Advances to contractors Deferred financing costs - noncurrent Others
2012 $2,457,440 63,125 – – 2,377 $2,522,942
2011 $– 63,125 871,720 349,493 – $1,284,338
On April 23, 2012, the Company entered into a Land Lease Agreement (LLA or the Agreement) with the National Power Corporation (NPC) and the Power Sector Assets and Liabilities Management Corporation (PSALM) over the MGPP’s steamfield lot in Sto. Tomas, Batangas. Under the LLA, the Company will lease the steamfield lot for a period of 25 years, extendable for another 25 years upon mutual agreement of the parties. Advance rent-noncurrent portion pertains to the advance rental payment paid for the lease agreement. The current portion due in one year is shown as part of “Advances, prepaid expenses and other current assets” in the consolidated statement of financial position. Restricted cash pertains to the Parent Company’s share in the escrow fund to secure payment and discharge of the Parent Company’s obligations and liabilities under the Floating Production Storage and Offloading (FPSO) contract. The amount was deducted from the Parent Company’s share on lifting proceeds during the first lifting made by Etame in November 2002 and will be paid back to the Parent Company at the end of the contract which is in 2020. Other noncurrent assets pertain mainly to deferred input VAT.
15. Accounts Payable and Accrued Expenses
Accounts payable Accrued interest payable Accrued expenses Dividends payable Withholding taxes payable Others
2012 $3,226,210 683,762 471,287 260,098 125,261 235,747 $5,002,365
2011 $2,516,582 234,830 357,397 224,911 67,590 54,197 $3,455,507
Accounts payable consist of payable to suppliers and contractors. Accrued expenses are as follows:
Profit share Professional fees Sick/Vacation leaves Insurance Trust fees
2012 $224,884 81,465 67,739 61,429 35,770 $471,287
2011 $263,587 51,220 42,590 – – $357,397
80 PetroEnergy Resources Corporation
Accrued interest payable pertain to accrual for interest on loans (see Note 16). Dividends payable pertain to unclaimed checks as of December 31, 2012 and 2011. Other payables mainly pertain to accrued security services, utilities and condominium dues. The Group’s accounts payable and accrued expenses are due within one year. Carrying values approximate their fair values as of December 31, 2012 and 2011.
16. Loans Payable
Loans payable Less unamortized deferred financing cost Loans payable
2012 $39,951,279 1,007,835 $38,943,444
2011 $13,688,931 393,792 $13,295,139
On September 26, 2011, MGI together with PNOC Renewables Corporation and Trans-Asia entered into a $54.7 million Omnibus Loan and Security Agreement with RCBC and BPI specifically to partially finance the design, development, procurement, construction, operation and maintenance of its geothermal power plant project. As of December 31, 2012 and 2011, MGI has outstanding drawdowns of $39.95 million and $13.69 million, respectively. The remaining balance will be subsequently drawn based on a certain drawdown schedule. The loan is payable semi-annually within ten (10) years from and after the date of initial drawdown immediately following the signing date, payments to be made in fourteen (14) semiannual principal installment commencing on the end of 6th semester from the date of the initial drawdown, inclusive of a grace period of thirty-six (36) months. The amount of loans payable is presented as part of noncurrent liabilities. The rate of interest applicable to the loan is fixed for the first five (5) years from the initial drawdown date based on the sum of the prevailing fixed benchmark rate on the pricing date and the margin of 2.5% per annum (the “Initial Interest Rate”). After five years from the date of the first initial drawdown, the interest for the remaining 5 years tenor shall be repriced based on the higher of: (i) the sum of the then prevailing fixed benchmark rate plus the margin of 2.25% per annum, or (ii) the Initial Interest Rate. Deferred financing costs are incidental costs incurred in obtaining the loan which include documentary stamp tax, transfer tax, chattel mortgage, real estate mortgage, professional fees, arrangers fee and other out-of-pocket expenses. Total deferred financing costs amounted to $1.6 million. As of December 31, 2012 and 2011, the portion pertaining to the drawn amount of the loan amounting to $1.01 million and $0.39 million is presented as deduction from the loans payable account and is amortized over the life of the loan using the effective interest rate method. Amortization of deferred financing cost will be capitalized until all necessary activities to prepare the power plant for its intended use are substantially complete.
Annual Report 2012
81
Details of unamortized deferred financing costs are as follows:
Balances at beginning of year Deferred financing costs on loan drawn during the year Less amortization during the year Balances at end of year
2012 $393,792
2011 $−
766,141 $1,159,933 152,098 $1,007,835
401,032 401,032 7,240 $393,792
The portion pertaining to the undrawn amount of the loan is presented as an asset in the consolidated statements of financial position. As of December 31, 2012 and 2011, $0.54 million and $0.86 million, respectively are presented as current asset under “Advances, prepaid expenses and other current assets” account (see Note 9). MGI has pledged a portion of its land and property plant and equipment amounting to $0.85 million as collateral in connection with the loan. Pledged assets are as follows: Real estate (land to be used as power plant site, under “Property, plant and equipment”) $0.77 million; and Chattel (under “Property, plant and equipment”) - $0.69 million. Below are the accumulated capitalized borrowing costs as of December 31, 2012 and 2011:
Interest on loans payable Balances at the beginning of year Interest incurred during the year Balances at end of year Deferred financing cost Balances at the beginning of year Amortization during the year Balances at end of year
2012
2011
$10,039 2,157,885 2,167,924
$− 10,039 10,039
7,240 152,098 159,338 $2,327,262
− 7,240 7,240 $17,279
The loan covenants covering the outstanding debt of MGI include, among others, maintenance of certain level of debt-to-equity and debt-service ratios. As of December 31, 2012 and 2011, the Group is in compliance with the said loan covenats.
82 PetroEnergy Resources Corporation
17. Asset Retirement Obligation The Group has recognized its share in the abandonment costs associated with the Etame, Avouma and Ebouri oilfields located in Gabon, West Africa. Movements in this account follow: Balances at beginning of year Change in estimate (Note 10) Accretion expense Balances at end of year
2012 $474,293 (268,520) 31,895 $237,668
2011 $402,793 9,067 62,433 $474,293
The provision for the oilfields in Etame maintained the original discount rate at 15% for both years. Reduction during the year resulted from the change in estimated abandonment costs from $1.54 million in 2011 to $0.87 million in 2012 (the Group’s share to the total accrued retirement obligation of the consortium). The estimate was provided by a third party expert, as engaged by the consortium operator of the oilfields in Gabon, West Africa. This also resulted to a decrease in the book value of “Wells, platforms and other facilities” account under “Property, plant and equipment” in the consolidated statements of financial position (see Note 10). The provisions for the abandonment costs for Etame, are expected to be settled in 2020, while for Avouma and Ebouri in 2022.
18. Equity Under the existing laws of the Republic of the Philippines, at least 60% of the Parent Company’s issued capital stock should be owned by citizens of the Philippines for the Group to own and hold any mining, petroleum or renewable energy contract area. As of December 31, 2012, the total issued and subscribed capital stock of the Parent Company is 99.75% Filipino and 0.25% nonFilipino, as compared to 99.87% Filipino and 0.13% non-Filipino as of December 31, 2011 and 99.72% Filipino and 0.28% non-Filipino as of December 31, 2010. On February 23, 2010, the BOD approved a 1:1 Stock Rights Offering (SRO). Under the SRO, the shares were offered at current market prices. The SRO was undertaken during the period June 28 to July 5, 2010. Total proceeds from the SRO amounted to $14.8 million. As of December 31, 2012 and 2011, capital stock consists of 330,000,000 authorized and 273,824,220 issued and outstanding common shares with par value of P =1 ($0.0244) per share. Total capital stock and additional paid-in capital amounted to $6.32 million and $25.24 million, respectively, as of December 31, 2012, 2011 and 2010.
Annual Report 2012
83
Capital Stock The Parent Company’s track record of capital stock are as follows:
Listing by way of introduction – August 11, 2004 Add (deduct): 25% stock dividend 30% stock dividend 1:1 stock rights offering December 31, 2010 Deduct: Movement December 31, 2011 Deduct: Movement December 31, 2012
Number of shares registered
Issue/offer price
Date of SEC approval
84,253,606
P =3/share
August 4, 2004
21,063,402 31,595,102 136,912,110 273,824,220
Number of holders as of year - end
= P1/share September 6, 2005 = P1/share September 8, 2006 = P5/share May 26, 2010 2,149 (26) 2,123 (10) 2,113
273,824,220 − 273,824,220
Additional Paid-in Capital
Balance at beginning of year Stock issuances Balance at end of year
2012 $25,244,737 − $25,244,737
2011 $25,244,737 − $25,244,737
2010 $13,390,875 11,853,862 $25,244,737
Dividends The BOD approved the declaration of cash dividends as follows:
April 26, 2012, 10% or $0.002 per share cash dividends to all stockholders of record as of September 21, 2012 amounting to $643,838. The dividends were paid on October 17, 2012. April 26, 2012, 10% or $0.002 per share cash dividends to all stockholders of record as of May 18, 2012 amounting to $643,838. The dividends were paid on June 14, 2012. May 17, 2011, 10% or $0.002 per share cash dividends to all stockholders of record as of September 20, 2011 amounting to $631,951. The dividends were paid on October 14, 2011.
2012
2011
2010
$643,838
$–
$–
643,838
–
–
–
631,951
–
(Forward)
84 PetroEnergy Resources Corporation
May 17, 2011, 10% or $0.002 per share cash dividends to all stockholders of record as of June 16, 2011 amounting to $629,120. The dividends were paid on July 13, 2011. October 21, 2010,10% or $0.002 per share cash dividends to all stockholders of record as of November 8, 2010 amounting to $631,295. The dividends were paid on December 2, 2010. February 23, 2010, 20% or $0.004 per share cash dividends to all stockholders of record as of March 15, 2010 amounting to $606,208. The dividends were paid on April 5, 2010.
2012
2011
$–
$629,120
–
−
631,295
– $1,287,676
− $1,261,071
606,208 $1,237,503
2010
$–
Appropriated Retained Earnings On January 15, 2008, the BOD approved the appropriation of $0.49 million for the development of the Ebouri oil field in Gabon, in addition to the $0.56 million originally appropriated amount. Participation in the development of the Ebouri field by the Parent Company has been approved by the BOD on the same date. On July 24, 2008, the BOD approved additional appropriation of retained earnings amounting to $1.0 million for the development of the Ebouri oil field in Gabon, West Africa. Total appropriations for the development of Ebouri oilfield as of December 31, 2012 and 2011 amounted to $2.06 million. Further expansion of the said oilfield is on-going and is set to be completed in 2015. There are no appropriations of retained earnings made in 2012 and 2011. On February 19, 2013, the BOD approved additional appropriated retained earnings amounting to $1.09 million to cover for the Parent Company’s share in the cost of the committed wells in Gabon amounting to $3.15 million. Capital Management The primary objective of the Group’s capital management is to ensure that it maintains a strong credit rating and healthy capital ratios in order to support its business and maximize shareholders’ value. The Group manages its capital structure and makes adjustments to it, in light of changes in economic conditions. To maintain or adjust the capital structure, the Group may increase its debt from creditors, adjust the dividend payment to shareholders or issue new shares. As of December 31, 2012, the Group monitors capital using a debt-to-equity ratio, which is total liabilities divided by total equity.
Annual Report 2012
85
As of December 31, 2012 and 2011, the Group’s sources of capital are as follows:
Loans payable Additional paid-in capital Retained Earnings Capital stock
2011 $13,295,139 25,244,737 7,693,436 6,321,533 $52,554,845
2012 $38,943,444 25,244,737 8,963,497 6,321,533 $79,473,211
The table below demonstrates the debt-to-equity ratio of the Group as of December 31, 2012 and 2011:
Total debt Loans payable Accounts payable and accrued expenses Asset retirement obligation Income tax payable Accrued retirement liability Total equity Capital stock Additional paid-in capital Retained earnings Appropriated Unappropriated Cumulative translation adjustment Noncontrolling interest Debt-to-equity ratio
2012
2011
2010
$38,943,444
$13,295,139
$– 736,141
5,002,365 237,668 75,015 78,755 $44,337,247
3,455,507 474,293 243,474 41,862 $17,510,275
402,793 421,301 43,217 $1,603,452
$6,321,533 25,244,737
$6,321,533 25,244,737
$6,321,533 25,244,737
2,055,555 6,907,942
2,055,555 5,637,881
2,055,555 3,972,684 59,163
778,372 5,807,379 $47,115,518 0.94:1
(56,228) 3,851,627 $43,055,105 0.41:1
1,230,598 $38,884,270 0.04:1
Based on the Group’s assessment, the capital management objectives were met in 2012, 2011 and 2010.
86 PetroEnergy Resources Corporation
19. Retirement Plan The Group has a defined benefit retirement plan (the Plan) for all of its employees. The Plan provides for normal and early retirement, as well as, death and disability benefits. The retirement expense included in salaries and wages under general and administrative expense account for the years ended December 31, 2012, 2011 and 2010 are as follows (see Note 22):
Current service cost Interest cost Expected return on plan assets Recognized actuarial gains
2012 $32,247 7,492 (6,650) – $33,089
2011 $21,090 5,635 (4,659) (1,167) $20,899
2010 $14,039 4,749 (3,004) (2,240) $13,544
The Group’s fund is in the form of a trust being maintained by a trustee bank, Rizal Commercial Banking Corporation (RCBC). In 2012, 2011 and 2010, there were no transactions that took place between the fund and the Group. The fund has no investments in the Parent Company’s equity as of December 31, 2012 and 2011. The accrued retirement liability recognized in the consolidated statements of financial position as of December 31, 2012 and 2011 are as follows:
Present value of accrued retirement liability Fair value of plan assets Net unrecognized actuarial gains Foreign currency translation adjustments
2012 $164,092 (106,280) 57,812 27,343 (6,400) $78,755
2011 $125,108 (91,536) 33,572 15,592 (7,302) $41,862
The movements in the accrued retirement liability recognized in the consolidated statements of financial position are as follows:
Balances at beginning of year Retirement expense (Notes 22 and 23) Contributions to retirement plan Foreign currency translation adjustments Balances at end of year
2012 $41,862 33,089 – 3,804 $78,755
2011 $43,217 20,899 (22,272) 18 $41,862
Changes in the present value of accrued retirement liability follow:
Balances at beginning of year Current service cost Interest cost Actuarial loss (gain) on obligation Foreign currency translation adjustments Balances at end of year
2012 $125,108 32,247 7,492 (10,117) 9,362 $164,092
2011 $81,266 21,090 5,635 17,653 (536) $125,108
Annual Report 2012
87
Changes in the fair value of the plan assets follow:
Balance at beginning of year Actual contributions Expected return on plan assets Actuarial gain (loss) on plan assets Foreign currency translation adjustments Balance at end of year Actual return on plan assets
2012 $91,536 – 6,650 1,634 6,460 $106,280 $8,284
2011 $65,758 22,272 4,659 (838) (315) $91,536 $3,821
2012 $40,975 65,051 789 (535) $106,280
2011 $55,092 36,301 285 (142) $91,536
The components of net plan assets are as follows:
Cash and cash equivalents Investments in government securities Interest receivable Trust fee payable
The principal actuarial assumptions used in determining pension benefit obligation for the Group’s plan are as follows:
Rate of increase in salaries Beginning Ending Discount rate Beginning Ending Expected rate of return Beginning Ending
2012
2011
4.20% 4.00%
3.00% 4.20%
5.77% 5.27%
6.85% 5.77%
7.00% 4.00%
7.00% 7.00%
The overall expected rate of return on assets is determined based on the market expectations prevailing on that date, applicable to the period over which the obligation is to be settled. Amounts for the current and previous periods are as follows: 2011 2012 Present value of accrued retirement liability $164,092 $125,108 Fair value of plan assets 91,536 106,280 Deficit (surplus) $33,572 $57,812
2010 $81,266 65,758 $15,508
2009 $47,571 41,918 $5,653
2008 $64,604 73,704 ($9,100)
88 PetroEnergy Resources Corporation
Experience adjustments for the current and previous periods are as follows: 2012 ($14,266) (1,633)
Plan obligations Plan assets
2011 ($3,031) (834)
2010 ($2,608) (84)
2009 $2,513 (1,510)
2008 ($11,209) 515
The Group expects to contribute to the fund the amount of $20,225 in 2013.
20. Income Tax The provision for income tax consists of: 2012 Current - Regular Corporate Income Tax Deferred - On temporary differences
$963,372 (64,603) $898,769
2011 $1,191,787 146,199 $1,337,986
2010 $998,907 (141,037) $857,870
The components of the Group’s deferred tax assets are as follows:
Deferred tax assets on: Asset retirement obligation Accrued profit share Accrued retirement liability Provision for probable losses Deferred tax liabilities on: Production revenue Unrealized foreign exchange gain
2012
2011
$166,357 60,743 19,911 17,092 264,103
$132,016 77,249 10,778 17,092 237,135
$113,344 3,953 117,297 $146,806
$131,754 23,178 154,932 $82,203
As of December 31, 2012 and 2011 the Group did not recognize deferred tax assets amounting to $323,473 and $193,137, respectively, on the NOLCO of its subsidiaries because the Group believes that it may not be probable that sufficient taxable income will be available in the near foreseeable future against which the tax benefits can be realized. Details of the NOLCO are as follows: PGEC Year Incurred 2012 2011 2010
Expiration 2015 2014 2013
NOLCO In USD In PHP =1,809,971 P $44,092 1,499,970 34,215 2,241,423 51,127 = P 5,551,364 $129,434
Annual Report 2012
89
MGI
Year Incurred 2012 2011 2010
Expiration 2015 2014 2013
NOLCO In USD $86,244 73,846 33,949 $194,039
In PHP =3,540,303 P 3,237,396 1,488,317 =8,266,016 P
As indicated on the Implementing Rules and Regulations of the Renewable Energy (RE) Act of 2008, the NOLCO of the RE Developer during the first three (3) years from the start of commercial operation shall be carried over as a deduction from gross income for the next seven (7) consecutive taxable years immediately following the year of such loss, subject to the following conditions: a) The NOLCO had not been previously offset as a deduction from gross income; and b) The loss should be a result from the operations and not from the availment of incentives provided for in the RE Act. The Parent Company is subject to the regular corporate income tax rate of 30%, while PetroGreen and MGI are subject to a corporate tax of 10%. The reconciliation of the statutory tax rate to the effective income tax rate shown in the consolidated statements of income follows:
Statutory tax rate Add (deduct) reconciling items: Loss from entities subjected to lower rate Movement in unrecognized deferred tax assets Unrealized loss (gain) on FVPL Interest income subjected to final tax Donations Unrealized foreign exchange gain Others Effective income tax rate
2012 30.00%
2011 30.00%
2010 30.00%
3.47
5.68
6.86
1.98 0.25
2.84 0.26
3.43 (0.04)
(2.14) – (5.38) (0.38) 27.80%
(4.09) (0.12) – (1.49) 33.08%
(4.78) (0.06) – (11.10) 24.31%
21. Oil Production
Production, transportation and related expenses Storage and loading expenses Supplies and facilities Others
2012
2011
2010
$4,130,614 830,725 5,028 59,842 $5,026,209
$4,788,555 563,622 2,805 77,167 $5,432,149
$3,677,438 581,332 3,672 58,816 $4,321,258
90 PetroEnergy Resources Corporation
22. General and Administrative Expenses Salaries, wages and benefits (Notes 19 and 23) Professional and other fees Depreciation Taxes and licenses Research costs (Note 31) Transportation and travel Security and janitorial services Insurance Gasoline, oil and lubricants Entertainment, amusement and recreation (EAR) Rent expense Donation and contribution Training and seminar Utilities Communication Business meetings Office supplies Repairs and maintenance Condominium dues Advertisement Stock transfer fees Dues and subscriptions Environmental and social expenses Listing fees Others
2012
2011
2010
$1,112,994 302,534 251,593 189,628 181,487 156,872 140,546 72,198 57,579
$999,210 243,084 146,107 119,993 147,813 142,680 157,576 55,912 47,101
$716,166 505,781 151,842 178,569 114,476 133,594 51,890 44,213 29,114
53,290 52,108 48,484 47,388 46,482 41,252 38,678 35,552 22,768 27,349 16,160 14,164 9,911 6,545 – 86,351 $3,011,913
57,545 43,467 143,272 58,627 46,491 34,465 32,226 32,323 24,139 24,386 7,653 11,884 4,388 41,079 12,909 57,761 $2,692,091
48,329 8,922 72,323 97,534 33,125 23,999 18,669 23,064 24,816 17,079 8,049 10,722 5,861 – 78,835 98,404 $2,495,376
Listing fees in 2011 and 2010 pertain to the restructuring expenses incurred in relation to the SRO. Others pertain to miscellaneous expenses such as development assistance, notarization and reproduction expenses. Revenue Regulations 10-2002 defines expenses to be classified as EAR expenses and sets a limit for the amount that is deductible for tax purposes. EAR expenses are limited to 0.5% of net sales for sellers of goods or properties or 1% of net revenue for sellers of services. For sellers of both goods or properties and services, an apportionment formula is used in determining the ceiling on such expenses. 23. Related Party Transactions Parties are considered to be related if one party has the ability, directly or indirectly, to control the other party or exercise significant influence over the other party in making financial and operating decisions. Parties are considered to be related if one party has the ability, directly or indirectly, to control the other party in making financial and operating decisions or the parties are subject to common control or common significant influence (referred to as ‘Affiliates’). Related parties may be individuals or corporate entities.
Annual Report 2012
91
Transactions and outstanding balances with subsidiaries have been eliminated during consolidation. Compensation of Key Management Personnel of the Group The Group has a profit sharing plan for directors, officers, managers and employees as indicated in its by-laws. The amount, the manner and occasion of distribution is at the discretion of the BOD, provided that profit share shall not exceed 5% of the audited income before income tax and profit share. The remuneration of the Group’s directors and other members of key management are as follows: Salaries and wages and other short-term benefits (Note 22) Directors’ fees (Note 22) Retirement expense (Note 19)
2012
2011
2010
$405,670 188,015 15,709 $609,394
$345,865 142,697 8,447 $497,009
$343,602 141,880 1,975 $487,457
24. Financial Instruments The Group’s principal financial instruments include cash and cash equivalents, trading and investment securities (financial assets at FVPL), receivables, restricted cash, loans payable, accounts payable, accrued expenses and dividends payable. The main purpose of these financial instruments is to fund the Group’s working capital requirements. Categories and Fair Values of Financial Instruments As of December 31, 2012 and 2011, the carrying amounts of the Group’s financial assets and financial liabilities approximate their fair values except for loans payable. The fair value of the loans payable as of December 31, 2012 and 2011 amounted to $41.15 million and $14.02 million compared to its carrying value of $38.94 million and $13.30 million, respectively. The methods and assumptions used by the Group in estimating the fair value of financial instruments are: Cash and cash equivalents and Receivables
Due to the short-term nature of the instruments, carrying amounts approximate fair values as of the reporting date.
Equity securities
Fair values are based on published quoted prices. Unquoted equity securities are carried at cost less any impairment.
Debt securities and Golf club shares
Fair values are based on quoted market prices as at reporting date.
Accounts payable and accrued expenses
Due to the short-term nature of the instruments, carrying amounts approximate fair values as at reporting date.
92 PetroEnergy Resources Corporation
Loans Payable
Fair value are based on the discounted value of expected future cash flows using the applicable interest rate for similar type of instruments. The fair value for 2012 and 2011 is derived using the projected T-Bond coupon rate of 5 year tenor at 4.125% and 4.674%, respectively, plus 2.5% credit spread for the first five years and 2.25% for the second five years.
The following tables show financial instruments recognized at fair value as of December 31, 2012 and 2011. The fair value is based on the source of valuation as outlined below: quoted prices in active markets for identical assets or liabilities (Level 1); those involving inputs other than quoted prices included in Level 1 that are observable for the asset or liability, either directly or indirectly (Level 2); and those with inputs for the asset or liability that are not based on observable market data (unobservable inputs) (Level 3).
Financial assets at FVPL Marketable equity securities Investment in golf club shares
Financial assets at FVPL Marketable equity securities Investment in golf club shares
Level 1
Level 2
2012 Level 3
Fair Value
$125,531 17,296 $142,827
$− − $−
$− − $−
$125,531 17,296 $142,827
Level 1
Level 2
2011 Level 3
Fair Value
$98,069 10,949 $109,018
$−
$−
$−
$−
$98,069 10,949 $109,018
In 2012 and 2011, there were no transfers of financial instruments among all levels. Financial Risk Management Objectives and Policies The Group manages and maintains its own portfolio of financial instruments in order to fund its own operations and capital expenditures. Inherent in using these financial instruments are the following risks on liquidity, market and credit. Financial Risks The main financial risks arising from the Group’s financial instruments are liquidity risk, market risk and credit risk. a.
Liquidity Risk Liquidity risk is the risk that the Group is unable to meet its financial obligations when due. The Group monitors its cash flow position and overall liquidity position in assessing its exposure to liquidity risk. The Group maintains a level of cash and cash equivalents deemed sufficient to finance its operations and to mitigate the effects of fluctuation in cash flows. To cover its short-term and long-term funding requirements, the Group intends to use internally generated funds as well as to obtain loan from financial institutions.
Annual Report 2012
93
The tables below summarize the maturity profile of the Group’s financial assets and financial liabilities as of December 31, 2012 and 2011 based on contractual undiscounted payments:
Financial Assets Financial assets at FVPL Loans and receivables: Cash on hand and in banks Short-term investments Accounts receivable: Consortium operator Others Interest receivable Restricted cash Financial Liabilities Loans payable Accounts payable
On demand
Less than 6 months
2012 6 months but less than 12 months
$142,827
$–
$–
$–
$142,827
1,020,234 –
– 20,601,988
– 814,741
– –
1,020,234 21,416,729
1,956,341 1,969 23,717 – $3,145,088
– – – – $20,601,988
– – – – $814,741
– – – 63,125 $63,125
1,956,341 1,969 23,717 63,125 $24,624,942
$– 3,193,111
$– –
$– –
$38,943,444 –
$38,943,444 3,193,111
–
– –
471,287 683,762
More than 12 months
Total
Accrued expenses Accrued interest payable
471,287
Dividends payable Others:
260,098
– –
– –
–
260,098
55,292 180,455
– –
– –
– –
55,292 180,455
$4,160,243
683,762
$–
$38,943,444
$43,787,449
$19,918,226
$814,741
($38,880,319)
($19,162,507)
On demand
Less than 6 months
2011 3 months but less than 12 months
More than 12 months
Total
$109,018
$–
$–
$–
$109,018
942,852 –
– 20,961,432
– –
– –
942,852 20,961,432
2,035,530 4,476 36,010 – $3,127,886
– – – – $20,961,432
– – – – $–
– – – 63,125 $63,125
2,035,530 4,476 36,010 63,125 $24,152,443
Due to NRDC Others Net financial assets (liabilities)
Financial Assets Financial assets at FVPL Loans and receivables: Cash on hand and in banks Short-term investments Accounts receivable: Consortium operator Others Interest receivable Restricted cash
683,762
($1,015,155)
(Forward)
94 PetroEnergy Resources Corporation
Financial Liabilities Loans payable Accounts payable Accrued expenses Accrued interest payable Dividend payable Others: Due to NRDC Others Net financial assets (liabilities)
2011 6 months but less than 12 More than 12 months months
On demand
Less than 6 months
$– 2,516,582 357,397 – 224,911
$– – – 234,830 –
$– – – – –
$13,295,139 – – – –
$13,295,139 2,516,582 357,397 234,830 224,911
51,773 21,046 $3,171,709
– – $234,830
– – $–
– – $13,295,139
51,773 21,046 $16,701,678
$20,726,602
$–
($13,232,014)
$7,450,765
($43,823)
Total
As stated on Note 1, the 20 MW MGPP is expected to start commercial operations by late 2013. Proceeds from sale of electricity will then be used to settle the Group’s loans payable. b. Market Risk Market risk is the risk of loss on future earnings, on fair values or on future cash flows that may result from changes in market prices. The value of a financial instrument may change as a result of changes in equity prices, foreign currency exchanges rates, interest rates and other market changes. Equity Price Risk The Group closely monitors the prices of its securities on a daily basis, as well as macroeconomic and entity-specific factors which could directly or indirectly affect the prices of these instruments. In case of an expected decline in its portfolio of equity securities, the Group readily disposes or trades the securities for replacement with more viable and less risky investments. Such investment securities are subject to price risk due to changes in market values of instruments arising either from factors specific to individual instruments or their issuers, or factors affecting all instruments traded in the market. The analysis below is performed for reasonably possible movements in the PSE index (PSEi) with all other variables held constant, showing the impact on income before tax (due to changes in fair value of equity securities and golf shares whose fair values are recorded in the consolidated statements of income). The Group used the daily average of movements in PSEi price indices, plus adjusted betas for equity securities.
Equity securities Golf club shares
2012 Impact on income before tax % Increase 17% $20,161 19% 3,464 $23,625
Decrease ($20,161) (3,464) ($23,625)
Annual Report 2012
95
2011 Impact on income before tax % Increase 10% $7,671 3% 2,986 $10,657
Equity securities Golf club shares
Decrease ($7,671) (2,986) ($10,657)
There is no other impact on the Group’s equity other than those already affecting net income. Foreign Exchange Risk Exposure to currency risk arises from general and administrative expenses, assets and liabilities in currencies other than the Group’s functional currency which is very minimal since the Group’s oil revenues and costs and expenses are denominated in US Dollar. Currency risk is monitored and analyzed systematically and is managed by the Group. The analysis below demonstrates the sensitivity to a reasonably possible change in the Philippine Peso exchange rate which is the only source of the Group’s foreign exchange risk, with all other variables held constant, showing the impact on income before tax (due to changes in fair value of currency sensitive to financial assets and liabilities). The Group used the year-average forecast from the Business Monitor International in the analysis. 2012 Impact on income before tax $81,617 (81,617)
Increase/decrease in Php rate +2.56% -2.56% 2011 Increase/decrease in Php rate +4.20% -4.20%
Impact on income before tax $371,013 (371,013)
There is no other impact on the Group’s equity other than those already affecting net income. Interest Rate Risk The Group’s exposure to market risk for changes in interest rates relates primarily to the Group’s short-term investments amounting to $21.42 million and $20.96 million for December 31, 2012 and 2011, respectively (see Notes 6 and 9). Interest rate of loans payable is fixed for the first five (5) years and will be repriced thereafter.
96 PetroEnergy Resources Corporation
The table below demonstrates the sensitivity to a reasonably possible change in interest rates, with all other variables held constant, of the Group’s net income. The Group used the forecasted one-year Treasury Bill rate in performing the analysis below. 2012 Increase/decrease in interest rate (in basis points) +51 -51
Impact on income before tax $109,606 (109,606)
2011 Increase/decrease in interest rate (in basis points) +49 -49
Impact on income before tax $457,366 (457,366)
There is no other impact on the Group’s equity other than those already affecting net income. c.
Credit Risk There are significant concentrations of credit risk within the Group since most of its financial assets are with consortium operator, although credit risk is immaterial. The table below shows the summary of maximum credit risk exposure on financial instruments as of December 31, 2012 and 2011: Financial assets at FVPL: Marketable equity securities Golf club shares Loans and receivables: Short-term investments Cash in bank Accounts receivable: Consortium operator - net Others Interest receivable Restricted cash
2012
2011
$125,531 17,296
$98,069 10,949
21,416,729 1,016,093
20,961,432 940,798
1,956,341 1,969 23,717 63,125 $24,620,801
2,035,530 4,476 36,010 63,125 $24,150,389
The Group has a well-defined credit policy and established credit procedures. In addition, receivable balances are being monitored on a regular basis to ensure timely execution of necessary intervention efforts.
Annual Report 2012
97
The Group determines the credit quality by class for loan-related consolidated statements of financial position lines based on the following: Cash in banks and short-term investments - based on the nature of the counterparties and the reputation of the financial institution. Receivables - based on the payment behavior of the counterparty. High grade pertains to receivables from consortium operator and interest receivable from short-term investments and standard grade pertains to other receivables. Both are neither past due nor impaired. The tables below shows the credit quality by class of asset for loan-related consolidated statements of financial position lines, based on the Group’s credit rating system as of December 31, 2012 and 2011:
Cash in banks Short-term investments Accounts receivable: Consortium operator Others Interest receivable Restricted cash
Cash in banks Short-term investments Accounts receivable: Consortium operator Others Interest receivable Restricted cash
2012 Neither past due nor impaired Past due High grade Standard grade and impaired $1,016,093 $– $– 21,416,729 – – 1,956,341 1,969 23,717 63,125 $24,477,974
– – – – $–
65,346 – – – $65,346
2011 Neither past due nor impaired Past due High grade Standard grade and impaired $940,798 $– $– 20,961,432 – – 2,035,530 4,476 36,010 63,125 $24,041,371
– – – – $–
61,187 – – – $61,187
Total $1,016,093 21,416,729 2,021,687 1,969 23,717 63,125 $24,543,320
Total $940,798 20,961,432 2,096,717 4,476 36,010 63,125 $24,102,558
The tables below show the aging analysis of the Group’s receivables as of December 31, 2012 and 2011.
Accounts receivable Consortium operator Others Interest receivable
1 to 90 days
2012 Over 90 days
Total
$1,956,341 – 23,717 $1,980,058
$65,346 1,969 – $67,315
$2,021,687 1,969 23,717 $2,047,373
98 PetroEnergy Resources Corporation
Accounts receivable Consortium operator Others Interest receivable
1 to 90 days
2011 Over 90 days
Total
$2,035,530 – 36,010 $2,071,540
$61,187 4,476 – $65,663
$2,096,717 4,476 36,010 $2,137,203
As of December 31, 2012 and 2011, the Group has no past due receivables that are not impaired. Past due and impaired receivable pertains to a long-outstanding receivable from a consortium member which is fully provided with allowance.
25. Segment Information For management purposes, the Group is organized into business units based on their products and has three reportable segments as follows: The oil segment is engaged in the oil and mineral exploration, development and production. The wind energy segment carries out the general business of generating, transmitting, and/or distributing power derived from wind energy sources. The geothermal energy segment will develop and operate geothermal steamfields and power plants. No operating segments have been aggregated to form the above reportable operating segments. Management monitors the operating results of its business units separately for the purpose of making decisions about resource allocation and performance assessment. Segment performance is evaluated based on operating profit or loss and is measured consistently with operating profit or loss in the consolidated financial statements.
Segment revenue Net income (loss) Other comprehensive income Other Information: Segment assets except deferred tax assets Deferred tax assets - net Segment liabilities
Oil Production $11,990,120 3,374,035 –
$43,725,937 $146,806 $1,070,458
Geothermal Energy $– (589,948) –
$60,509,231 $– $43,166,651
2012 Wind Energy $– (449,228) –
Elimination Consolidated $– $11,990,120 (259) 2,334,600 – 834,600
$12,957,722 ($25,886,931) $– $– $100,138 $–
$91,305,959 $146,806 $44,337,247
(Forward)
Annual Report 2012
99
Geothermal Energy
Oil Production Cash flows arising from: Operating activities Investing activities Financing activities Provision for income tax Capital expenditures Deferred oil exploration costs Depletion, depreciation and amortization
Segment revenue Net income (loss) Other comprehensive loss Other Information: Segment assets except deferred tax assets Deferred tax assets - net Segment liabilities Cash flows arising from: Operating activities Investing activities Financing activities Provision for income tax Capital expenditures Deferred oil exploration costs Depletion, depreciation and amortization
Segment revenue Net income (loss) Other comprehensive income (loss) Other Information Segment assets except deferred tax assets Deferred tax assets Segment liabilities Cash flows arising from: Operating activities Investing activities Financing activities Provision for income tax Capital expenditures Deferred oil exploration costs Deferred geothermal costs Depreciation, depletion and amortization
$3,443,132 (5,866,247) (1,027,578) $898,769 $713,250 $6,643,203 $1,803,172
$1,337,954 (28,525,023) 29,370,893 $– $30,694,556 $– $35,236
2012 Wind Energy ($371,833) (4,125,793) 4,470,614 $– $655,658 $–
$1,870,775 4,173,014 (6,239,223) $– $– $–
$6,279,628 (34,347,049) 26,574,706 $898,769 $32,063,464 $6,643,203
$25,284
$–
$1,863,692
2011 Wind Energy $– (335,564) –
Oil Production $13,544,412 3,670,173 –
Geothermal Energy $– (628,428) –
$42,082,175 $82,203 $1,448,453
$26,965,599 $– $16,047,184
$8,390,174 $– $19,281
$1,606,518 (15,072,853) 20,016,948 $– $9,531,841 $–
($503,680) (5,174,163) 6,052,318 $– $161,763 $–
$6,232,222 (6,045,824) (1,243,767) $1,337,986 $1,501,183 $5,831,668 $1,959,994
Oil Production $10,784,257 3,500,037 –
$39,645,704 $228,402 $1,567,283 $3,500,054 (6,136,417) 13,608,247 $857,870 $1,329,717 $6,012,163 $– $1,656,563
$21,366
Wind Energy $– (496,437) –
Elimination Consolidated
Elimination $– – –
($16,954,771) $– ($4,643) $29,060 11,021,679 (11,116,330) $– $– $–
$22,029 2010 Geothermal Energy $– (332,118) –
$–
$7,364,120 (15,271,161) 13,709,169 1,337,986 $11,194,787 $5,831,668 $2,003,389
Consolidated $10,784,257 2,671,482 59,163
$40,259,320 $228,402 $1,603,452
$3,568,811 $– $29,491
($5,814,354) $– ($192,149)
($477,534) (2,635,284) 3,303,495 $– $2,597,015 $– $–
($327,414) (1,303,591) 3,857,697 $– $1,298,891 $– $1,283,953
$148,471 5,809,942 (5,814,353) $– ($311,509) $– $–
$3,388
$60,483,177 $82,203 $17,510,275
Elimination $– – –
$2,859,159 $– $198,828
$13,079
Consolidated $13,544,412 2,706,181 (115,391)
$–
$2,843,577 (4,265,350) 14,955,086 $857,870 $4,914,114 $6,012,163 $1,283,953 $1,673,030
100 PetroEnergy Resources Corporation
Intercompany investments, revenues and expenses are eliminated during consolidation.
26. Basic/Diluted Earnings Per Share The computation of the Group’s earnings per share follows: Net income attributable to equity holders of the Parent Company Weighted average number of shares Basic/diluted earnings per share
2012
2011
2010
$2,557,737 273,824,220 $0.009
$2,926,268 273,824,220 $0.011
$2,787,723 205,368,165 $0.014
27. Noncontrolling Interests Noncontrolling interest represents the 35% shareholdings of Trans-Asia and PNOC in MGI.
28. Notes to the Consolidated Statements of Cash Flows
In 2012, the noncash investing activity of the Group pertains to the reduction in Property, plant and equipment, which is due to the decrease in ARO estimate amounting to $0.27 million. In 2011, noncash investing activities pertain to the following items: Transfer from Deferred oil exploration costs to Wells, platforms and other facilities amounting to $1.18 million. Transfer from Deferred geothermal costs to FCRS and production wells - Geothermal amounting to $1.28 million. Increase in Wells, platforms and other facilities due to change in ARO estimate amounting to $9,067.
29. Events After the Reporting Period Additional Appropriation of Retained Earnings On February 19, 2013, the BOD approved additional appropriated retained earnings amounting to $1.09 million to cover for the Group’s share in the cost of the committed wells in Gabon amounting to $3.15 million. Area 4-Northwest Palawan On February 14, 2013, PetroEnergy, Philex Petroleum Corporation, PNOC Exploration Corporation (collectively referred to as the Bid Group) won the bid for Area 4-Northwest Palawan, bid out by DOE in 2012. The Bid Group is currently awaiting the signing of the Petroleum Service Contract and has committed to conduct a 2200 km seismic survey and G&G studies during Sub-phase 1 (covering two contract years). PetroEnergy’s estimated share in the costs of these activities amounts to $0.5 million.
Annual Report 2012 101
30. Renewable Energy Act of 2008 On January 30, 2009, Republic Act No. 9513, An Act Promoting the Development, Utilization and Commercialization of Renewable Energy Resources and for Other Purposes, otherwise known as the “Renewable Energy Act of 2008” (the “Act”), became effective. The Act aims to (a) accelerate the exploration and development of renewable energy resources such as, but not limited to, biomass, solar, wind, hydro, geothermal and ocean energy sources, including hybrid systems, to achieve energy self-reliance, through the adoption of sustainable energy development strategies to reduce the country’s dependence on fossil fuels and thereby minimize the country’s exposure to price fluctuations in the international markets, the effects of which spiral down to almost all sectors of the economy; (b) increase the utilization of renewable energy by institutionalizing the development of national and local capabilities in the use of renewable energy systems, and promoting its efficient and cost-effective commercial application by providing fiscal and non-fiscal incentives; (c) encourage the development and utilization of renewable energy resources as tools to effectively prevent or reduce harmful emissions and thereby balance the goals of economic growth and development with the protection of health and environment; and (d) establish the necessary infrastructure and mechanism to carry out mandates specified in the Act and other laws. As provided for in the Act, Renewable Energy (RE) developers of RE facilities, including hybrid systems, in proportion to and to the extent of the RE component, for both power and non-power applications, as duly certified by the DOE, in consultation with the Board of Investments (BOI), shall be entitled to the following incentives, among others: i.
ii.
iii.
iv.
v.
vi.
Income Tax Holiday (ITH) - For the first seven (7) years of its commercial operations, the duly registered RE developer shall be exempt from income taxes levied by the National Government; Duty-free Importation of RE Machinery, Equipment and Materials - Within the first ten (10) years upon issuance of a certification of an RE developer, the importation of machinery and equipment, and materials and parts thereof, including control and communication equipment, shall not be subject to tariff duties; Special Realty Tax Rates on Equipment and Machinery - Any law to the contrary notwithstanding, realty and other taxes on civil works, equipment, machinery, and other improvements of a registered RE developer actually and exclusively used for RE facilities shall not exceed one and a half percent (1.5%) of their original cost less accumulated normal depreciation or net book value; NOLCO - the NOLCO of the RE developer during the first three (3) years from the start of commercial operation which had not been previously offset as deduction from gross income shall be carried over as deduction from gross income for the next seven (7) consecutive taxable years immediately following the year of such loss; Corporate Tax Rate - After seven (7) years of ITH, all RE developers shall pay a corporate tax of ten percent (10%) on its net taxable income as defined in the National Internal Revenue Code of 1997, as amended by Republic Act No. 9337; Accelerated Depreciation - If, and only if, an RE project fails to receive an ITH before full operation, it may apply for accelerated depreciation in its tax books and be taxed based on such;
102 PetroEnergy Resources Corporation
vii.
Zero Percent VAT Rate - The sale of fuel or power generated from renewable sources of energy, the purchase of local goods, properties and services needed for the development, construction and installation of the plant facilities, as well as the whole process of exploration and development of RE sources up to its conversion into power shall be subject to zero percent (0%) VAT; viii. Cash Incentive of RE Developers for Missionary Electrification - An RE developer, established after the effectivity of the Act, shall be entitled to a cash generation-based incentive per kilowatt-hour rate generated, equivalent to fifty percent (50%) of the universal charge for power needed to service missionary areas where it operates the same; ix. Tax Exemption of Carbon Credits - All proceeds from the sale of carbon emission credits shall be exempt from any and all taxes; and x. Tax Credit on Domestic Capital Equipment and Services - A tax credit equivalent to one hundred percent (100%) of the value of the VAT and custom duties that would have been paid on the RE machinery, equipment, materials and parts had these items been imported shall be given to an RE operating contract holder who purchases machinery, equipment, materials, and parts from a domestic manufacturer for purposes set forth in the Act. RE developers and local manufacturers, fabricators and suppliers of locally-produced RE equipment shall register with the DOE, through the Renewable Energy Management Bureau (REMB). Upon registration, a certification shall be issued to each RE developer and local manufacturer, fabricator and supplier of locally-produced renewable energy equipment to serve as the basis of their entitlement to the incentives provided for in the Act. All certifications required to qualify RE developers to avail of the incentives provided for under the Act shall be issued by the DOE through the REMB.
31. Electric Power Industry Reform Act (EPIRA) After emerging from the crippling power crisis that occurred in the early 1990s, the Philippine Government embarked on an industry privatization and restructuring program envisioned to ensure the adequate supply of electricity to energize its developing economy. This restructuring scheme is embodied in RA No. 9136, the EPIRA. Approved on June 8, 2001, the EPIRA seeks to ensure quality, reliable, secure and affordable electric power supply; encourage free and fair competition; enhance the inflow of private capital; and broaden the ownership base of power generation, transmission and distribution. The Government viewed restructuring and reform as a long-term solution to the problems of the power sector. The huge investment requirement for new generation capacity and expansion of the necessary transmission and distribution network was estimated at an annual average of $1.0 billion. Given its own fiscal constraints, the Government recognized the need for greater private sector involvement in the power sector. Even though some private sector participation was successfully introduced earlier between the NPC and private investors, this time, the Government is envisioning addressing the power sector inefficiencies and the monopoly in the generation business. EPIRA mandated the overall restructuring of the Philippine electric power industry and called for the privatization of NPC. The restructuring of the electricity industry calls for the separation of the different components of the power sector, namely: generation, transmission, distribution, and supply. On the other hand, the privatization of the NPC involves the sale of the state-owned power firm’s generation and transmission assets (e.g. power plants and transmission facilities) to private investors. These two reforms are aimed at encouraging greater competition and attracting more private-sector investments in the power industry.
Annual Report 2012 103
A more competitive power industry will in turn result in lower power rates and a more efficient delivery of electricity supply to end-users. Specifically, the EPIRA has the following objectives: Achieve transparency with the unbundling of the main components of electricity services, which will be reflected in the consumers’ electricity rates; Opening up of the electricity market to competition at the wholesale (generation) level to improve efficiency in the operation of power plants and redound to lower electricity prices; Enhance further inflow of private capital and broaden ownership base in generation, transmission distribution, and supply of electric power; Establish a strong and independent regulatory body that will balance the interest of both the investors by promoting competition through creation of a level playing field and protect the electricity end-users from any market power abuses and anti-competitive behaviors; and Accelerate and ensure the total electrification of the country.
32. Commitments a. Certified Emission Reductions Purchase Agreement On January 31, 2011, MGI entered into a Certified Emission Reductions Purchase Agreement (“ERPA”) with Endesa Carbono S.L. (“Endesa”) of Madrid, Spain. Under the ERPA, MGI shall sell 100% of the Certified Emission Reductions (“CERs”) generated by the Maibarara Geothermal Power Project (the “Project”) in favor of Endesa from the start of its commercial operations in October 2013 until 2020. This will provide MGI with a secondary revenue stream apart from electricity sales. It should be noted that, under the RE Act of 2008, all proceeds from the sale of carbon emission credits shall be exempt from any and all taxes. The Project is now undergoing registration process required under the UN Clean Development Mechanism (CDM). This includes the preparation of the Project Design Document (PDD), validation conducted by a Designated Operational Entity (“DOE” or “Validator”), application with the Designated National Authority (Department of Environment and Natural Resources for the Philippines), and registration or acceptance of the Project as a CDM Project Activity by the CDM Executive Board (“EB”). The PDD presents information on the essential technical and organizational aspects of the project activity and is a key input in the validation, registration and verification of the Project. MGI contracted the Spanish Association for Standardization and Certification (“AENOR”) as the Validator to perform an independent evaluation of the project activity against the requirements of the CDM on the basis of the PDD. Upon commercial operations, MGI shall collect and archive all relevant data necessary for calculating green house gas (GHG) emission reductions, which will then be subjected to periodic independent verification. The EB will issue the CERs equal to the verified GHG emission reductions
104 PetroEnergy Resources Corporation
b. Electricity Supply Agreement In 2011, MGI entered into an Electricity Supply Agreement with Trans-Asia Oil and Energy Development Corporation (Trans-Asia) in which the latter offered to purchase all of the facility’s net output. The commercial operation date is expected in 2013, in which the Company shall make available and Trans-Asia shall receive all of the Company’s net capacity at delivery point in accordance with the electricity delivery procedures. Trans-Asia shall pay the Company electricity fees at the price agreed upon and subject to an adjustment starting on the second contract year, for changes in foreign exchange and inflation.
33. Wind Energy Service Contract (WESC) On September 14, 2009, the Parent Company was awarded by the DOE with two (2) WESCs (the Wind Energy Projects) covering the areas of Sual, Pangasinan and Nabas, Aklan. These service contracts were awarded pursuant to Republic Act (RA) No. 9513, otherwise known as the “Renewable Energy Act of 2008”. During the two-year pre-development stage of the contracts, the Parent Company should conduct technical feasibility studies in the contract areas in order to confirm the wind power potential in the two (2) areas. The expected total expenditures for each contract amount to about $420,000. As part of the technical study, the Parent Company committed to install a 60m wind mast to measure the wind data characteristics and other relevant parameters. The data from the technical feasibility study will determine whether the wind resource is viable for commercial development and operations. As stated in Note 1, the Parent Company created PGEC to carry out the renewable energy projects of the Parent Company, which includes the wind energy projects. On November 30, 2009, the Parent Company purchased a 60m wind mast from US-based manufacturer and distributor, NRG Systems. The wind mast arrived at the port of Manila on January 23, 2010 and was released from customs by a contractor, Supply Oilfield Services, Inc. (SOS) on January 25, 2010. Power Dimension, Inc. (PDI) was hired to erect the mast at the site. Tower lifting began on February 17, 2010, with the mast fully raised on February 18, 2010. During the visit to Nabas, Aklan on September 9-10, 2010, the Senior Wind Specialist of COWI A/S, a contracted Danish engineering consultant, recommended the installation of a second mast in Nabas, Aklan to increase confidence in the wind data. The shipment arrived on December 15, 2010 and was turned over to PDI for the installation. Installation of PGEC’s second mast was completed on the first week of January 2011. Following one year of wind data recording in Nabas (Aklan) and Sual (Pangasinan) wind service contract areas in February 2011, initial micrositing and annual energy production analyses were prepared. COWI reported in May 2011 that the Sual site has only a fair to modest wind resource potential and unlikely to be commercially viable. This result prompted the Parent Company to relinquish the Sual wind service contract. The DOE formally approved the relinquishment on October 28, 2011.
Annual Report 2012 105
In contrast to Sual, COWI reported in July 2011 that the Nabas project site can sustain a 50 MW wind farm. This encouraging result led the Parent Company to start obtaining the first set of development permits and conducting initial engineering studies. SMEC Philippines (SMEC) was engaged in September 2011 to undertake the environmental baseline survey of Nabas needed to obtain the project’s Environmental Compliance Certificate (ECC). The initial environmental examination report was submitted on December 6, 2011 by SMEC to the DENR - Region 6 Office for data screening. In November 2011, the Parent Company applied with the National Commission on Indigenous Peoples (NCIP) for a Certificate of Non-Overlap (CNO) attesting that the project site does not overlap with any existing indigenous peoples’ ancestral domain claims. The Parent Company also filed with the National Grid Corporation of the Philippines (NGCP) for the conduct of the grid impact study (GIS) which will determine the feasibility of interconnecting the Nabas wind project to the Visayas Grid. A detailed topographic survey of the likely development areas of the project, including an inventory of existing private and public lots was likewise undertaken. On November 8, 2011, the DOE approved the Deed of Assignment and Assumption transferring the WESC from the Parent Company to PGEC. The DOE also granted the one-year extension of the pre-development phase from September 13, 2011 to September 13, 2012. As of December 31, 2012 and 2011, wind data gathering activities are still ongoing. Research costs relating to the Wind Energy Projects amounted to $165,079, $147,813, and $114,476 in 2012, 2011, and in 2010, respectively, and are included as “research costs” under “General and administrative expenses” in the consolidated statements of income. In 2012, PGEC moved to further advance the project towards eventual commerciality. The key activities centered on securing critical government permits, completing technical feasibility studies, and initiating request for engineering, procurement, and construction bids for the wind farm. PGEC obtained the CNO from the NCIP which certified that the project area is free of any ancestral domain claims from indigenous communities. The ECC for the 50 MW Nabas wind power project was released by the DENR Region 6 office in June 2012. This gave the Parent Company clearance to proceed to site development, from road rehabilitation, access road construction, wind turbine installation, transmission line erection, and operation and maintenance of the facility subject to compliance to standard environmental regulations. Another government approval sought was DOE’s Declaration of Commerciality for the project which was applied for on September 10, 2012. As part of this application process, the DOE’s Renewable Energy Management Bureau (REMB) conducted a site visit on November 27-29, 2012 to meet with local municipal and barangay officials and DENR staff who assured the DOE team of the strong support for the project. With more than two years of wind data, COWI completed its technical feasibility study in August 2012 concluding the viability of the site to generate 50MW of wind power with a high capacity factor. At the same time, NGCP completed its own system impact study that stressed that the four wind turbine models from different suppliers are all compliant with NGCP standards; further, NGCP recommended the location and type of transmission connection for Nabas. Using these two major technical studies, PGEC completed in August its own conceptual engineering design of the project, recommending a phased development with an initial phase of about 36 MW capacity and a second 14 MW phase.
106 PetroEnergy Resources Corporation
Given the positive results of various technical studies, PGEC moved to obtain costing and commitment from several likely construction partners for various project components. It started by signing a Heads of Agreement (HOA) with EEI Corporation for the balance of plant construction contract. All the foregoing activities were prompted not only by the positive results of the various technical feasibility studies but also the Energy Regulatory Commission’s (ERC) decision to grant a feedin-tariff (FIT) rate of P8.53/kWh to qualified wind farm developers.
34. MGI Contracts and Agreements a. Remote Monitoring System and Technical Advisory Services Agreement On August 19, 2011, MGI entered into an agreement with Fuji Electric to conduct the operation and maintenance of the Maibarara power plant. This will include the monitoring of the power plant operations remotely from Tokyo, Japan through a remote monitoring system to be established by the Fuji Electric. Further, Fuji Electric shall provide site technical services to the power plant in instances wherein the power plant encounters technical problems during emergency situation. For the remote monitoring services, the fee amounts to ¥3 million. For the technical advisory services, the fee is based on a certain rate per hour and per day. This agreement shall be for a period of one (1) year commencing on the expiry of the warranty period of the EPC contract for the construction of power plant, renewable every year thereafter upon agreement of both parties. b. Interconnection Agreement MGI signed an Interconnection Agreement (ICA) with MERALCO for the physical interconnection of the generation and connection facilities of MGI’s 20 MW power plant to MERALCO’s distribution system. The power facility being constructed in Brgy. San Rafael, Sto. Tomas, Batangas will be connected to MERALCO’s existing 115 kV line in Calamba, Laguna. MGI and MERALCO, along with Trans-Asia Oil and Energy Development Corporation (TRANS-ASIA), also signed on December 6, 2012 a Memorandum of Agreement (MOA). The MOA defined the respective rights and obligations among the Parties: MGI as a Generation Facility to be interconnected with MERALCO’s distribution system under the ICA, and TRANSASIA as the sole off-taker of MGI’s electricity output under the Electricity Sales Agreement (ESA), which shall sell said output through MERALCO’s distribution system. c. Transmission Line, Operation, Service and Maintenance Agreement On March 26, 2013, MGI entered into an agreement with Nikkon Builders International, Inc. wherein the latter will conduct the operation, service and maintenance of MGI’s switchyard and 4.8 kilometers transmission line within the period of five (5) years. The agreement includes an annual inspection services fee amounting to $4,214 on the first year for both switchyard and transmission line and “on call” services based on pre-agreed rates for manpower and equipment utilization.
Annual Report 2012 107
Board of Directors
Helen Y. Dee Chairman
Milagros V. Reyes Director
Cesar A. Buenaventura Director
Raul M. Leopando Director
Yvonne S. Yuchengco Director
Carlo S. Pablo Director
Basil L. Ong Director
108 PetroEnergy Resources Corporation
Officers and Managers
Milagros V. Reyes President
Francisco G. Delfin Jr. Vice President
Yvonne S. Yuchengco Treasurer
Atty. Samuel V. Torres Corporate Secretary
Atty. Arlan P. Profeta Asst. Corporate Secretary
Carlota R. Viray Chief Finance Officer
Annual Report 2012 109
CORPORATE DIRECTORY
OFFICERS President: Milagros V. Reyes Vice President: Francisco G. Delfin, Jr., Ph.D. Treasurer: Yvonne S. Yuchengco Corporate Secretary: Atty. Samuel V. Torres
CORPORATE DIRECTORY AUDITOR SGV & Co. 6760 Ayala Ave., Makati City
BANKER Rizal Commercial Banking Corporation Ortigas Malayan Plaza Ground Floor, corner Opal Road ADB Avenue, Ortigas Business Center, Pasig City
TRANSFER AGENT Rizal Commercial Banking Corporation Ground floor, Grepalife Building Gil J. Puyat Avenue, Makati City Telephone Nos.: (632) 892-4156 892-1461
EXECUTIVE OFFICE PetroEnergy Resources Corporation 7th Floor, JMT Corporate Building, ADB Ave., Ortigas Business Center, Pasig City Telephone Nos.: (632) 637-2917 637-5799 637-4032 637-4362 Fax: (632) 634-6066 633-8584 Email: petro_energy@petroenergy.com.ph Website:http://www.petroenergy.com.ph
110 PetroEnergy Resources Corporation
PetroEnergy Resources Corporation 7th Floor, JMT Corporate Building, ADB Ave., Ortigas Business Center, Pasig City Tel: (632) 637-2917 637-5799 637-4032 637-4362 Fax: (632) 634-6066 633-8584 Email: petro_energy@petroenergy.com.ph
http://www.petroenergy.com.ph
Layout and Design by: Sakura Donna Suzuki Printed by: Color Plus Publication