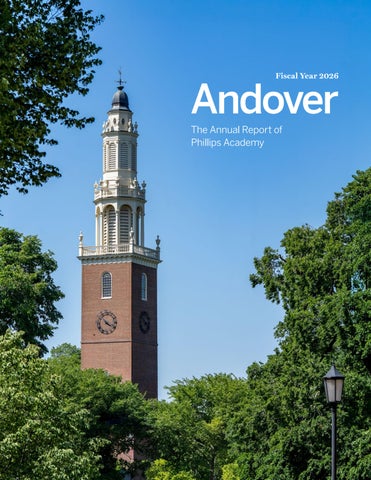
Fiscal Year 2026
Andover The Annual Report of Phillips Academy
From the President of the Board of Trustees and the Head of School We are pleased to share Andover’s annual report for the fiscal year ending June 30, 2026. This report includes program highlights and an overview of the operating budget and endowment performance—which together depict a complex institution that is both well run and expensive to operate. We believe that transparency builds confidence in an organization. Understanding Andover’s fiscal health is especially important to those who invest in our extraordinary people and programs. As global economic pressures impact organizational costs and family finances, transparency also builds trust. In this climate, Andover is fortunate to be able to navigate uncertain times from a position of strength.
The endowment is strong, and philanthropy signals deep pride among alumni and families. As the school approaches its 250th anniversary in 2028, Andover will continue to evolve and raise its own bar of excellence. Fulfilling our mission to educate youth from every quarter means opening our doors to talented and promising students from across the United States and around the world. It means continuing to recruit and develop world-class faculty who model knowledge and goodness as teachers, mentors, coaches, and much more. Sincerely,
Amy C. Falls ’82, P’19, ’21 President, Board of Trustees 2020–2026
Phillips Academy Annual Report FY26
Raynard S. Kington, MD, PhD, P’24, ’27 Head of School
Introduction
1
State of the Academy Since its founding in 1778, Phillips Academy has prepared students for the possibilities and challenges of an ever-changing world. This commitment is our lived tradition, expressed each year in the growth, innovation, and enthusiasm of our learning community. The summary that follows showcases the Academy’s progress in fiscal year 2026.
Phillips Academy Annual Report FY26
State of the Academy
2
Academics Faculty representing nearly every academic department and more than 180 students traveled with Learning in the World programs across the United States and abroad. Numerous instructors also engaged in professional development on campus, including 10 Tang Institute fellows who explored everything from ethical AI to capstone projects in the performing arts. In the spring, Andover announced prestigious new honors for faculty excellence. Among them were donorfunded Distinguished Academy Foundations, to be awarded in 2026, and the Tang Institute’s year-long AI Scholar appointment.
Long-Range Planning
“ Preparing students for the possibilities and challenges of an ever-changing world.” This guiding principle informed the third year of road mapping. The Learning Steering Committee (LSC) submitted its final report, which put forth recommendations to strengthen the academic, cocurricular, and residential program. Among its priorities, including a review of grading and assessment practices, the LSC focused on how new students transition to Andover. Recommendations for improvement include creating a ninth-grade neighborhood, shifting from residential deans to class deans, and rethinking the advising system. The LSC also underscored the importance of a comprehensive athletics review, currently underway, and continued academic department reviews.
Phillips Academy Annual Report FY26
State of the Academy
3
Major Leadership Appointments The Board of Trustees has elected James F. Ventre ’79 as Andover’s 17th head of school; his tenure will begin following the conclusion of Dr. Raynard Kington’s service on June 30, 2027. Jim Ventre is currently assistant head of school for admission and financial aid. The Academy’s longestserving senior leader, he is known for his collaborative approach and is especially proud of his efforts stewarding need-blind admission. Working with the Office of Academy Resources and trustees, Ventre helped secure nearly $200 million in support for financial aid over two fundraising campaigns. Eric Zinterhofer ’89, P’18, ’19, chair of the Head of School Search Committee, was subsequently elected president of the Board of Trustees, effective July 1, 2026. He succeeds Amy Falls ’82, P’19, ’21, who served 14 years as a trustee, the last six as board president. The board also established a new position, electing Christopher Auguste ’76, P’09, ’12, as its inaugural vice president.
Phillips Academy Annual Report FY26
Campus Renewal The opening of Falls Music Center in 2025 set off a series of other facility improvements. Graves Hall, the Academy’s former music building, no longer houses grand pianos; it is now home to several administrative offices previously located in George Washington Hall. Meanwhile, ongoing renovations to George Washington Hall spaces will create a studentfocused center encompassing academic, residential life, and student activity offices as well as study areas. Additional renewal projects included interior renovations to the Robert S. Peabody Institute of Archaeology, which reopened in fall 2026 in time to celebrate its 125th anniversary.
State of the Academy
4
Academy Advancement Philanthropy remains vital to Phillips Academy’s success both in the short term and when planning its long-range future. In fiscal year 2026, more than 7,600 alumni, families, and friends prioritized the Academy in their giving. Donations ranged from unrestricted annual gifts to the Andover Fund to endowment support that strengthens the fiscal foundation upon which coming generations will rely. Overall, benefactors continued to gravitate toward the school’s mission-based fundraising goals of financial aid, faculty support, academic innovation, and campus enhancements, among others. In FY26, cash gifts and pledge payments totaled $35 million. While this figure represents a 4% decrease from the prior fiscal year due to several factors, including earlier completion of pledges received in the last campaign, Academy fundraising achieved several notable successes.
Performance for the Andover Fund was the strongest in eight years. Over 7,000 donors contributed more than $12.8 million to the Andover Fund, bolstering the school’s important priorities and immediate needs. In particular, leadership annual gifts (those of $10,000 or more) grew 33%. Family Giving also surpassed its ambitious fiscal year goals, inspiring a participation rate of 62% and raising over $4.6 million. Additionally, the number of planned and estate gifts increased, with new membership to the Samuel Phillips & Sarah Abbot Society more than doubling from FY25 and total membership rising to 826. In May, the Academy celebrated the 760-plus members of the Thomas Cochran Society with an event at The Morgan Library & Museum in New York featuring keynote speaker Nicholas Thompson ’93, CEO of The Atlantic. The society recognizes donors who have made lifetime contributions of $250,000 or greater to the Academy, epitomizing the school’s ideals and the vision of esteemed philanthropist Thomas Cochran, Class of 1890, whose investments elevated every corner of campus.
Phillips Academy Annual Report FY26
Donors to the Addison Gallery of American Art were equally prominent this fiscal year, which featured the dedication of the Addison rotunda for the late Jason Sloan Tyler ’01 in June. More than 80 family members and friends united to make this tribute possible. An accomplished attorney, Tyler was a leading member of the Addison Artist Council Steering Committee. Gifts made in his name supported the Addison Gallery’s endowment, which helps secure the museum’s long-term growth and success. The Andover Women’s Endeavor (AWE) also gathered in New York in May for its second annual Founders’ Forum. The daylong conference was highlighted by sessions on AI in the classroom, sustainable investing, and modern mentoring. Over the past year, AWE grew to 81 members, each donating $100,000 or more to the Academy, demonstrating a commitment to philanthropy and the promotion of female leadership at the school and beyond.
State of the Academy
5
The arts continued to be a focal point this year with the establishment of the William Thomas Visiting Artist Fund, which brings inspiring performers and composers to campus to engage with students and faculty. The fund honors William Thomas, the late music department chair and director of performance who, from his arrival in 1975, transformed Andover’s music curriculum into the acclaimed program it is today. During his 33-year tenure, Thomas founded the Academy’s gospel choir and chamber music program and embraced a personal mission to highlight the presence and importance of diverse artists and show students what they might aspire to in their own musical futures.
Philanthropy at a Glance
7,602
Donors in FY26
$35M
Invested in Academy priorities
$4.6M
Committed by PA families
$12.8M Raised for the Andover Fund
The effort to create the fund was led by Faculty Emerita Susan Stott, Trustee Emerita Barbara Timken ’66, and Trustee Emerita Elizabeth Parker Powell ’56, P’84, ’90, GP’19. World-renowned musician Kevin Olusola ’06 was named the fund’s inaugural artist. A member of the Grammy Award–winning a cappella group Pentatonix, Olusola returned to campus to perform and collaborate with current students in May. Critically, support for financial aid continued to grow, enabling Andover’s landmark need-blind admission policy to flourish. Hundreds of donors sustained this Academy pillar with $8.4 million invested in both endowed and current-use funding.
In FY26, 47% of students depended on scholarship assistance. Phillips Academy Annual Report FY26
State of the Academy
6
Admission and Financial Aid The incoming class in fall 2025 was the 18th to be admitted under Andover’s need-blind policy, which removes financial need as an obstacle to admission. The Academy continues to rely on the generosity of alumni and families to sustain its commitment to our need-blind admission process. In addition to tuition and room and board, the school’s financial aid program also includes support for other essential items, depending on a student’s level of need. These items may include laptops, books, athletic equipment, warm winter clothing, and travel expenses. Participation in our signature Learning in the World programs on a fully need-blind basis is ensured as well.
Financial Aid Students receiving financial aid
Admission and Matriculation Admit rate
14% Matriculation rate for underrepresented students of color
75% Overall matriculation rate
78% Percentage of newly enrolled underrepresented students of color
22%
47% Average grant for returning students
$49,300 Students receiving full scholarships
13%
Andover Welcomed 10 New Global Scholars in FY26 Five Davis International Scholars (Brazil, Jamaica, Kenya, Lithuania, and Ukraine), for a total of 12 scholars in the academic year Two Kemper Scholars (Austria and the Czech Republic)
For entrance in September 2025, Andover received 3,017 applications from 49 U.S. states and 103 countries. The 334 new students enrolled at Andover in the 2025–2026 academic year represented 27 states and 25 foreign countries.
Phillips Academy Annual Report FY26
One iSmart Scholar (Brazil) One Ukraine Global Scholar (UGS-Ukraine) One ASSIST Scholar (Bosnia and Herzogovina) One Caroline D. Bradley Scholar for a total of nine domestic CDB Scholars in the academic year Each of these scholars helps enrich the geographic diversity of Andover’s student population.
State of the Academy
7
Academy Financials Careful oversight of Andover’s annual operating revenue and expenses, coupled with the endowment’s strong performance, continue to play a crucial role in the school’s mission to educate youth from every quarter. The following section details those key markers for fiscal year 2026.
Phillips Academy Annual Report FY26
Academy Financials
8
Income Statement Phillips Academy concluded FY26 in a sound financial position, generating a modest operating surplus despite continued cost pressures. On the revenue side, philanthropy continues to represent a significant portion of the Academy’s income (52%) with the endowment draw contributing $67.2M for operations, representing a 4.87% effective draw rate for FY26. Annual giving boosted income with an additional $13.4M, and the Academy also received over $15M in new gifts to the endowment, which adds to the endowment’s level of support in future years. The remainder of the Academy’s revenue came from net tuition, Summer Session programs, and other smaller sources, such as Learning in the World (LITW) programs and interest from cash on hand.
Inflation and tariffs have continued to have an outsized impact on the costs of contracts, utilities, and other goods and services.
FY26 Revenue in millions Net Boarding Tuition Other Income Summer, Outreach, LITW & Other
$8
$6
Other Income
$13
Annual Fund
16% 28%
Net Tuition
56% $12
Philanthropy Endowment Draw
$67
Net Day Tuition
FY26 Expenses in millions Salaries & Wages Debt Service
On the expense side, overall employee compensation increased by 5%—in large part due to the rising cost of health insurance, which grew by over 10%, as well as the increase in cost of other employee benefits. Inflation and tariffs have continued to impact the costs of contracts, utilities, and other goods and services. The Academy continues to work on reducing these costs while minimizing any impact on the program.
$45
Facilities & Tech Renewal Utilities
$3 $20 Infrastructure
$5
16% $60 56%
28% Goods & Services
$36
People
Operations
$23 Benefits
Phillips Academy Annual Report FY26
Academy Financials
9
Balance Sheet The Academy finished FY26 in a strong financial position. The return on the endowment was 18.9%, which increased its value to about $1.7B. (Additional information can be found in the endowment section of this report, beginning on page 12.)
outstanding debt, down from $133M at the start of the fiscal year. The entire debt is scheduled to be paid off by 2052. Behind the endowment, the Academy’s physical plant is its second largest asset—and continues to remain a focus of the Board of Trustees.
The Academy continued to pay down principal on its outstanding bonds, finishing FY26 with $130M in
Endowment Budget Impact Fiscal Year Ending June 30
2022
2023
2024
2025
2026
Endowment Value (millions)1
$1,302.8
$1,322.5
$1,407.4
$1,472.0
$1,677.8
Endowment Return
–5.1%
4.7%
10.6%
9.1%
18.9%
Endowment Draw for Operations (millions)
$47.1
$50.4
$58.7
$65.8
$67.2
Total Operating Expense (millions)
$114.8
$125.2
$136.0
$145.1
$147.3
Operating Draw as a Percentage of Total Operation Expense
41.1%
40.3%
43.2%
45.3%
45.6%
FY23
FY24
FY25
FY26
Endowment Growth in millions $1,750
$1,500
$1,250
$1,000
$750
$500
$250
$0
-$250 FY17
FY18
Endowment size start of fiscal year
Phillips Academy Annual Report FY26
FY19
FY20 Endowment performance
FY21
FY222
Endowment gifts
Endowment spending
Endowment size end of fiscal year
Academy Financials
10
Endowment by Donor Designation in millions Financial Aid Outreach Addison & Peabody Annual Fund Campus Maintenance Other Restrictions
$91 $46 3% $24 5% $64 1% 4%
$543
$175
32%
10%
$206
12%
Foundations & Instructorships Salary & Development
$161
10%
$369
22%
General Purposes/Unrestricted
Phillips Academy Annual Report FY26
Academy Financials
11
Endowment Performance Overview Andover Endowment at a Glance at Fiscal Year End, June 30, 2026
$1.7 Billion
18.9%
Market Value of the Andover Endowment
FY26 Portfolio Return on Endowment Fund
Performance Review The Andover Endowment returned +18.9% for fiscal year 2026, ranking first quartile in the Cambridge Endowment peer universe. Strong performance reflects the benefit of the endowment’s long-term investment approach and was most recently driven by the portfolio’s exposure to AI infrastructure equities and a significant rebound in biotech. Over both the most recent fiscal year and longer-term periods, the endowment has outperformed traditional liquid benchmarks (MSCI ACWI/Barclays Aggregate) while maintaining lower volatility, supporting the Academy’s dual objectives of growth and stability.
Long-Term Endowment Performance vs. Benchmarks as of June 30, 2026 Institution/Benchmark Type
1-Year
3-Year
5-Year
10-Year
10-Year Vol
Andover
18.9%
12.8%
7.3%
9.8%
8.0%
Cambridge Associate $1B+ Endowment & Foundations3
16.0%
12.2%
7.1%
10.1%
N/A
Cambridge Associate Endowment Composite
15.9%
13.0%
7.3%
9.5%
N/A
65/35 MSCI ACWI/Barclays Aggregate
16.5%
14.2%
7.2%
8.9%
10.5%
MSCI All-Country World Index
23.7%
19.7%
11.0%
12.8%
14.7%
S&P 500 TR
22.3%
20.6%
13.4%
15.5%
15.4%
Barclays Aggregate Bond Index
3.8%
4.2%
0.1%
1.5%
5.1%
3
4
Source: Phillips Academy Investment Office, Bloomberg, and Cambridge Associates
Recent three-year results for both the Andover Endowment and Cambridge Endowment indices reflect an unusual market environment in which public equities significantly outperformed private investments. Since the beginning of FY23, Private Equity and Venture Capital benchmarks have trailed MSCI ACWI by a wide margin, creating a headwind for many endowments with meaningful private investment allocations. Despite this temporary dynamic, Private
Phillips Academy Annual Report FY26
Equity and Venture Capital have historically been among the most important drivers of long-term endowment growth and remain central to our strategy for preserving and expanding the Academy’s financial resources over the long term. Encouragingly, Venture Capital returned to outperformance in FY26, providing early evidence that the asset class may be entering a more favorable phase of the cycle.
Endowment Performance Overview
12
Endowment Performance by Strategy vs. Benchmarks 10-year performance as of June 30, 2026 16% 14%
14.6%
12% 10%
13.1%
11.7%
8%
9.8% 7.1% 5.6%
6% 4%
2.4%
2% 0%
5.5%
Marketable Equity PA
Private Equity
Total Equity
Market Benchmark5
Absolute Return
Real Assets
Fixed Income Total & Cash Diversifying
Total Endowment
Policy Benchmark (current)6
Source: Phillips Academy Investment Office, Bloomberg, and Cambridge Associates
Over the past decade, the Andover Endowment has delivered strong risk-adjusted returns, outperforming both the blended policy benchmark and the traditional liquid 65/35 benchmark. This success reflects the benefits of maintaining a diversified portfolio across public and private markets. Private Equity has been the strongest contributor to long-term returns and performed in line with its benchmark, while Absolute Return and Real Assets have outperformed their respective benchmarks and provided important diversification benefits. The Marketable Equity portfolio underperformed the recently adopted MSCI ACWI policy benchmark but outperformed our historical lower-risk benchmark. The benchmark change adopted this year reflects the higher return objective we are targeting going forward for this portfolio segment. After performance challenges in FY22, repositioning the Public Equity portfolio to create a broader and more balanced set of return drivers has contributed to strong relative performance since FY23. More recent refinements to our long/short equity portfolio seek to preserve the benefits of diversification and downside protection while increasing overall return potential of our Marketable Equity exposure.
Phillips Academy Annual Report FY26
Endowment Performance Overview
13
Long-Term Performance Objectives The Andover Endowment’s long-term goal is to preserve and grow the Academy’s real purchasing power while providing reliable annual support for operations.
Growth of $100: Andover Endowment vs. Benchmarks and Key Hurdles 20 years through June 30, 2026
500
Sustainable Draw Growth of Value from $100 Base
400
Nominal Return
≥
Draw + Inflation
2011
2012 2013 2014 2015 2016
300
200
100
0 2006 2007 2008 2009 2010
Endowment
65/35 MSCI / Barclays Agg
MSCI ACWI
2017
2018 2019 2020 2021 2022 2023 2024 2025 2026
HEPI + 5%
HEPI + 4%
5% Draw
4% Draw
Source: Phillips Academy Investment Office, Bloomberg, and Commonfund for HEPI (Higher Education Price Index)
The chart above compares the growth of $100 invested in the endowment (dark blue line) over the past 20 years with the compounded return required to fund annual distributions (gray lines) and offset inflation (combined with operating draw in green lines). Despite the challenge of meeting both objectives simultaneously and constraining volatility, the endowment has successfully done so over the long term, reflecting the benefits and importance of disciplined portfolio construction and risk management, particularly for endowments that distribute a draw each year.
Phillips Academy Annual Report FY26
Endowment Performance Overview
14
Asset Allocation Andover’s portfolio strives to effectively balance the need for growth with the importance of mitigating losses, enabling the endowment to sustainably provide the annual budget funds on which the Academy so heavily relies. Allocation to various forms of equity exposure, including liquid Marketable Equity as well as illiquid Private Equity and Venture Capital, helps the Andover Endowment achieve strong long-term returns. Additionally, diversifying strategies, including Cash and Fixed Income, Real Assets, Absolute Return, and Tail Hedge, all help to mitigate the impact of equity market downdrafts and provide balance throughout different market environments.
Given the Academy’s high budgetary reliance on the endowment, our asset allocation is somewhat more defensive with less overall equity exposure than that of our peers. While the endowment has more illiquid PE/VC exposure than many comparably sized peers, it has less illiquid exposure than many of our larger peers. We are gradually increasing our allocation to Private Equity and Venture Capital toward the 35% long-term target set in 2024, concentrating our efforts in areas where the Investment Office sees durable opportunities to outperform over the long term.
Asset Allocation History 20 years through June 30, 2026 100%
Fixed Income & Cash
90%
Tail Hedge
80%
Real Assets
70%
Absolute Return Funds
60%
Secondary Sale 7
50%
Equity Target 4
40%
Equity Exposure Private Equity
30%
Marketable Equity
20% 10% 0% 2006
2008
2010
2012
2014
2016
2018
2020
2022
2024
2026
Source: Phillips Academy Investment Office
Phillips Academy Annual Report FY26
Endowment Performance Overview
15
Endnotes 1. The Endowment Value represents the audited fiscal year-end value as of June 30, 2026. Investment valuations used in determining this amount were subject to a valuation cutoff date of August 31, 2026; therefore, the reported value reflects investment information available as of that date. 2. Includes additional draws from the endowment beyond the operating draw, in accordance with endowment fund terms. The 2022 value includes a board-approved extraordinary draw of $42M. 3. As of October 13, 2026, median of the Cambridge Associates $1B+ Endowment & Foundations peer group (sample set 135–140 reported, depending on the time period) and Endowment Composite peer group (sample set 378–402 reported). 4. Andover switched at the end of FY21 from a 60/40 to 65/35 benchmark comparison, along with the target asset allocation shift to 65% equity. 5. Market benchmarks: MSCI ACWI for Total Equity, Barclays Aggregate for Diversifying, and 65/35 ACWI/Aggregate for Total Endowment. 6. Policy benchmarks have evolved for marketable equity over the years. Current policy benchmarks shown are as follows: • Marketable Equity: MSCI ACWI • PE/VC: Cambridge Associates Buyout, Growth Equity (GE) and Venture Capital (VC) benchmarks blended at PA actual historical weights, as exposure is gradually increased toward long-term targets. • Absolute Return: HFRI RV: Multi-Strategy Index • Real Assets: 50/50 NCREIF Property Index (for Real Estate) and Bloomberg Commodities Index (for Natural Resources) through June 2024; effective July 2024 forward, the Commodities Index has been replaced with a 50/50 blend of Cambridge Associates Infrastructure/Natural Resources benchmarks (as the endowment started to diversify the Other Real Assets category. • Fixed Income & Cash: 50/50 Bloomberg U.S. Treasury Index and 3-Month Treasury Bills, respectively Subtotal and total blended benchmarks are aggregated based on PA actual historical target weights of subcategories. Though not included in either the Equity or Diversifying subcategories, PA’s Total Endowment returns include the cost of Tail Hedge since the program began in April 2021, and the Total Endowment benchmark includes a comparably sized 3-, 6-, 9-, and 12-month 20% out-of-the-money ACWI put ladder. 7. A secondary sale of legacy private equity fund positions, with a reference date as of September 30, 2021, was closed March 31, 2022.
Phillips Academy Annual Report FY26
Endowment Performance Overview
16
Phillips Academy Board of Trustees 2025–2026 Amy Falls ’82, P’19, ’21 Charter Trustee, Board President
Tristin Batchelder Mannion ’82, P’19 Charter Trustee
Chris Auguste ’76, P’09, ’12 Charter Trustee
Aisha Jorge Massengill ’88 Alumni Trustee
Robert Barber ’68, P’03 Alumni Trustee
Carlos Montemayor ’92, P’23, ’27 Charter Trustee
Terry-Ann Burrell ’95 Alumni Trustee
Uche Osuji ’91 Alumni Trustee
Gil Caffray ’71, P’20 Charter Trustee, Treasurer
Loyce LaShawndra Pace ’95 Alumni Trustee
Amy Christodoulo ’98 Charter Trustee
Allison Picott ’88 Charter Trustee
David Corkins ’84, P’25 Charter Trustee
Tamara Elliott Rogers ’70 Charter Trustee
Anna Durham ’78 Charter Trustee
Stacy Schiff ’78 Charter Trustee
Keith Flaherty, MD, ’89, P’23 Charter Trustee
Michael Schmertzler ’70, P’05, ’07 Charter Trustee
Drew Guff ’79 Charter Trustee
Henry Smyth ’88 Charter Trustee
Harold Kim ’82, P’16, ’19, ’21, ’23, ’26, ’27 Charter Trustee
Kent Strong ’89, P’27 Alumni Trustee
Stephen King ’83 Charter Trustee
Yichen Zhang ’82, P’18, ’20, ’25 Charter Trustee
Raynard Kington, MD, PhD, P’24, ’27 Head of School, Clerk of the Board
Eric Zinterhofer ’89, P’18, ’19 Charter Trustee
Phillips Academy Annual Report FY26
Phillips Academy Board of Trustees
17
andover.edu/annualreport