
23 minute read
HVDC Enables Subsea Active Production Technology


HVDC Power Buoy Concept
The HVDC Power Buoy, shown in Figure 1, affords a oneatmosphere stable environment located just below the waveline and local to the subsea completion it will be servicing. This enables local placement of energy conversion equipment (VFDs, etc.) without the use of massive subsea one-atmosphere enclosures.
Advertisement
HVDC Conceptual Power Path
The HVDC Power Buoy bridges the gap between subsea power transmission distances accommodated via high voltage AC (HVAC) and those presently addressed via HVDC transmission networks. The HVDC Conceptual Power Path (Reference Figure 2) for providing Medium Voltage AC (MVAC) power to the subsea field test case comprises four (4) main components: 1.Host Rectifier 2.HVDC Power Transmission Cable System with Cable
Guillotine 3.HVDC Power Buoy 4.Local Power Distribution Cables with Re-usable
Weaklinks
Host Rectifier
Four-quadrant rectifier operation is not required as there will only be consumer loads associated with this system. This affords a simple passive diode front-end easily configured to achieve a harmonic friendly multi-pulse IEEE-519 compliant input. However application of Silicon Controlled Rectifier Thyristers (SCRs) in lieu of diodes will afford an active front-end which will accommodate the following (Reference Figure 3): Ó Current Limit Function (limit of fault currents) Ó Power Limit Function (interface with vessel PMS) Ó DC Pre-Charge Function (soft-start capacitor precharging) Feeding the multi-pulse rectifier is a multi-winding rectifier duty transformer. To mitigate the need for inter-phase transformers on the rectifier side, series connection of the rectifier is envisioned. Output DC contactors isolate the transmission line from the rectifier during service.
DC Transmission Cable
For the conceptual power level (10.5 MW = 15MVA @ 0.7PF), the DC Transmission Cable is envisioned to be a 185 mm2 armored coaxial cable rated 75 kVDC. Preliminary calculations determine the 150 km, 185 mm2, 75kVDC coaxial power cable to be transmitting, 10.5 MW at 150 Adc, dropping 5.76% (Vin = 75000 Vdc, Vout = 70678 Vdc) voltage from input to output with approximately 4.5 W/m full load transmission line losses (Reference Figure 4).
DC Cable Guillotine
A mandate for Arctic and sub-Arctic environments requires iceberg mitigation strategies for both topside and subsea equipment. A Cable Guillotine is envisioned to serve as the point of HVDC disconnection during an ice management event. This will enable disconnecting the 75 kVDC Cable from the Power Buoy without the use of HVDC Wet-mateable Connectors as the connectors would need substantial development and qualification programs. One such shearing method is described by Williams [2] in US Patent 6,397,948 B1 with the primary mechanism detailed in Figure 5 below.
HVDC Power Buoy
The HVDC Power Buoy will enclose a High Voltage Inverter System feeding a medium voltage distribution network to service the local SAPT equipment. The HVDC Power Buoy is envisioned to comprise, but is not limited to, the following: Ó Power Buoy Hull with Mooring System Ó HVDC Inverter Ó L-C-L Sinusoidal Filter / Step-down Transformer Network Ó Medium Voltage Distribution Switchgear Ó Medium Voltage DC Rectifiers with Load Share Reactors Ó Medium Voltage Inverters with Sinusoidal Output Filters Ó General Services Switchboard Ó Emergency Switchboard Ó UPS System
Power Buoy Hull and Mooring System
The HVDC Power Buoy is a taut moored facility, consisting of a floating buoyant structure moored by multiple tethers to a gravity base on the seabed. The floating buoyant structure is a series of stiffened carbon steel shell tubular sections of varying diameters. These sections form a column or spar, narrow at the surface, with a wide Buoyant Equipment Chamber (BEC) below the surface. The BEC is the main equipment space and provides a climate controlled oneatmosphere environment for the contingency of power conversion equipment and switchgear. It also supports physical connections to the tether and umbilical systems (Reference Figure 1 above).
HVDC Inverter
The HVDC Inverter (Reference Figure 6) is the “weakest
link” as the High Voltage DC Inverter will require substantial packaging development and qualification. Voltage Source Converter HVDC technology is envisioned to enable the Power Buoy Concept with further qualification. The VSC HVDC manufacturer,s will have to “buy-in” to and quantify market value for the concept as the technology to manufacture the miniaturized HVDC Inverter is still 3 - 5 years down the road, says one HVDC industry expert. Migration from air to liquid dielectric for high voltage components will be required to afford the reductions in creepage and clearance distances required to address the necessary packaging challenges.
L-C-L Sinusoidal Filter / Step-down Transformer Network
Downstream of the HVDC Inverter shall be an L-C-L Sinusoidal Filter / Step-Down Transformer where the transformer inductance will serve as part of the L-C-L Filter Network (Reference Figure 7). The purpose of the Filter Network is to mitigate harmonic content on the common DC bus. The purpose of the Step-Down Transformer, in addition to acting as part of the L-C-L filter network, is to transform the inverted high voltage AC to MVAC (7200 Vac). This allows convenient rectification back to a common 9500 Vdc bus (Reference Figure 8). This is a standard practice as it accommodates multiple Medium Voltage Inverters fed from a single common DC bus (Reference Figure 9).
Common DC Bus
Dual DC Rectifiers fed from dual MV circuit breakers each driving a load sharing reactor will convert the filtered 7200 Vac / 60 Hz Voltage to 9500 Vdc. Four-quadrant operation is not required, so there is no need to actively commutate the rectifier switches. However, application of SCRs in lieu of diodes will easily afford a DC link precharge function with little additional effort (Reference Figure 8).
Medium Voltage Inverters
The 9500 V Common DC Bus supports a compliment of Medium Voltage Inverters for regulation of SAPT equipment and buoy general services functions. Each inverter comprises a suitably rated MV Inverter feeding a Sinusoidal Output Filter to mitigate output harmonic issues to the loads. MV Inverters have a proven track record offshore and are available for offshore service from multiple suppliers. One of the MV inverters will be dedicated to support the buoy General Services Switchboard (Reference Figure 9):
General Services Switchboard
The General Services Switchboard is envisioned to provide service to, but is not limited to, the following consumers: Ó Lighting Systems Ó HVAC Systems Ó VFD Heat Exchangers Ó Boosting Control Systems Ó UPS Network
Emergency Switchboard
The Emergency Switchboard is envisioned to be back-fed from the General Services Switchboard. The Emergency Switchboard will be supplied by a small, self-contained, diesel-electric generator set, which is sized to supply 100% of connected electric loads that are deemed essential for safe operations. The emergency generator will also be used for black-start conditions prior to energizing the HVDC power transmission line during commissioning and de commissioning. The emergency generator will be capable of auto-starting, stabilizing and capable of carrying the required load within 45 seconds after loss of normal power.
UPS System
A UPS System will be provided to support communication and control systems and will serve as a buffer between sensitive electronic equipment and the emergency generating / HVDC system supplies. Electrical control systems will be powered to insure stepless operation during temporary power system losses.
Communication System
The HVDC Power Buoy System can be controlled and monitored from a remote host platform or a land-based station through UHF, VHF and satellite communications. Local Power Distribution Cables with Re-usable Weak Links Local MVAC distribution cables will connect the HVDC Power Buoy to the respective SAPT loads via re-usable weak links with integral wet mate connectors installed in the stab plates. The weak links can be physically attached to the bottom of the Buoy or in line with the MVAC cables. If directly attached to the Buoy, a universal joint is envisioned to reduce strain at the point of connection and on the shear pins. If connected inline, the universal joint can be eliminated (Reference Figure 10).
Drivers
There are multiple drivers for considering the HVDC Power Buoy. Some of these include, but are not limited to: Ó Reactive AC Power Ó SVC Space Requirements
Ó SVC Harmonics Ó Fault / Power Limiting Ó Power Cable Ó Environmental Ó Portability
Reactive AC Power
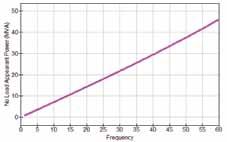
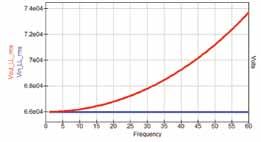
For most applications, electrical energy is generated, transmitted, distributed, and utilized as AC current. However, alternating current has several disadvantages. One of these is the reactive power that needs to be supplied along with the active power. Reactive power can be leading or lagging depending on the direction of power flow: Source to Load (lagging) or Load to Source (leading). One can quickly wade into deep technical water when discussing the definition reactive power and power factor, leading or lagging, so it is left to the reader to investigate this topic further. Simulated results to follow will be used to emphasize voltage stability issues associated with long AC transmission lines storing large amounts of leading (capacitive) reactive power. It is important to briefly quantify the relationship between leading (capacitive) reactive power, voltage and capacitance. This basic relationship is defined in Eqn. 1 (A.R.Bergen [1]), where: Q is defined as the transmission line leading reactive power; V is defined as the transmission line voltage and Cx is defined as the transmission line equivalent capacitive reactance. Furthermore, Eqn. 2 gives the definition of capacitive reactance, where: pie is defined as 3.14159….; frq is defined as the transmission line frequency and C is defined as the transmission line equivalent capacitance. Ó Q = V2/Cx .................................................................... (1) Ó Cx = 1/ (2*pie*frq*C) .................................................. (2) Equation 2 is significant because as C (capacitance increases), Cx (capacitive reactance) decreases. Inspection of Eqn. 1 demonstrates that as V increases linearly, Q increases as the square of V. Additionally as C increases linearly, Cx decreases exponentially thus Q increases linearly with C. The important point to remember is that as transmission lines get longer, transmission voltage is elevated to offset line losses and at the same time the effective transmission line capacitance increases. Both of these serve to quickly increase transmission line leading reactive power demand. Installation of a 150 km HVAC transmission line (described in the Introduction) realizes the reactive transmission challenges referenced above. Assuming the subsea tieback conditions below, a distributed AC transmission line model (Reference Figure 11) is constructed and analyzed to determine no load transmission line stability.1 The distributed transmission line model gains its name from „distributing, the parameters of the line equally through the line. The parameters are quantified per unit length and are additive in nature as the length of the line increases. In the case of Figure 11, the per-unit length is 10 km, so there are a total of fifteen (15) per-unit RLC sub-circuits connected in series to form the 150 km distributed AC transmission line model. Referencing Figure 12, the No load frequency response of this transmission line with an applied voltage of 66 kV rms over the frequency range: DC – 60 Hz, emphasizes the reactive energy requirements associated with long distance high voltage AC transmission. In short, a 150 km, 185 mm2 , 66kV, 60Hz Transmission Line (with no consumer loading) will generate approximately 45 MVA of leading reactive power. The significance to the host utility is substantial and must be addressed with a large Static Var Compensation (SVC) network at the host to dissipate this leading reactive power to enable stable voltage regulation. Figure 13 illustrates no-load input versus output voltage frequency response between DC to 60 Hz. The no-load voltage rises from Vout_LL_rms = 66,000 Vac at the line output to Vout_LL_rms = 73,400 Vac (with no load connected). This is an 11.1% increase in output voltage due purely to the reactive power generated within the transmission line and, in addition to the SVC network at the Host, will require active or passive voltage regulation at the load to stabilize voltage swings from no-load to full load. NOTE: The 185mm2 copper cross-section was arbitrarily chosen for analysis and is, in point of fact, not suitable for the given application parameters. At 60 Hz and no-load2, the transmission line draws approximately 403 Aac rms of reactive current, which generates approximately 16.1 W/m of Joule heating in each conductor which will most likely dive the conductor-insulation junction temperature beyond the rated thermal limit for the insulation system. Thus, a larger conductor cross-section is required just too thermally manage the reactive current demand. Rigorous power system design analysis, larger copper crosssection and a substantial SVC network at the Host combined with Active/Passive voltage regulation at the load will afford nominal transmission line performance, but future changes to system-wide loads, at the Host and at the Load, will need to be carefully analyzed on a case-bycase basis to ensure power system stability before changes are implemented. However, if an HVDC transmission network were employed, the gymnastics to mitigate excessive reactive power swings and system sensitivity to change is all but null and void as the HVDC transmission network can be seamlessly connected to the Host Utility and will afford system-wide tolerance to downstream load swings.
Host Deck Space Limitations
Due to the excessive reactive power requirements associated with long distance, medium to high voltage AC power transmission, Static Var Compensation equipment is a requirement to ensure voltage stability. Static Var Compensation equipment can exhibit a substantial footprint. The system comprises a compliment of thyristor controlled inductive reactances to dissipate the transmission line leading reactive power as well as multiple harmonic filter traps to mitigate the self-generated harmonics due to SVC thyristor switching (reference Figure 14).
SVC Harmonics
Since the impedance of an SVC is regulated by switching thyristors the input current is distorted and harmonics are generated. Typical current harmonics for a theoretical SVC as a percentage of the fundamental are shown in Figure 15. The addition of multiple harmonic filter traps is typically observed to handle harmonic mitigation. With regard to the HVDC Power Buoy, a multi-pulse rectifier presents a harmonic friendly load the Host Utility without any additional filtering.
Fault / Power Limiting
The active front end comprising the HVDC Power Buoy Rectifier can provide both current and power limiting functions. Current limiting will limit fault current to a set level which will minimize excessive thermal rise at the point of a fault. Upon hitting the current limit set-point, the rectifier controls can initiate a fault clearing protocol to avoid further damage at the point of fault as well as upstream disturbances to the Host Utility. Power limiting can also be supported via integration with the Host Power Management System, whereby the rectifier can be “phased back” to reduce output power until additional spinning reserve power can be brought on-line to avoid unnecessary trips and/or “black-outs.”
Power Cable
The main advantage of HVDC cables over their HVAC counterparts can be found in their reduced weight and dimensions. This results in a higher power density. The HVDC cables have lower losses and can therefore be designed smaller, both in weight and diameter. A HVAC cable system needs three cables, whereas a HVDC cable system only needs two. The HVDC transmission system improves transmission capability and the transmission lengths are nearly unlimited due to the elimination of the reactive power demands.
Environmental
The target SAPT installations discussed are on the order of 1520- MVA. Onboard gas turbines or diesel generators that usually supply this power manage no more than about 25% efficiency - way off the dazzling 75 - 80 % efficiencies of land-based combined cycle power plants. This inefficiency isn,t just costly in terms of excessive fuel consumption. High emissions can rack up the cost still further, where CO2 taxation applies. The HVDC Power Buoy is a zero-emission energy conversion source during normal operations with limited emissions during emergency / cold-start operations. This is an extremely important point when considering Arctic and Sub-Arctic applications that are considered to be extremely environmentally sensitive. Moreover, as suggested, the HVDC Power Buoy can be serviced by land-based combined cycle power plants possessing higher efficiencies and thus providing much more environmentally friendly power.
Portability
Ice gouging or scour (Reference Figure 16) is the most significant and most unpredictable environmental loading condition influencing arctic offshore design. The accepted solution to protect subsea equipment from this threat is to place the equipment in an excavated center that is deeper than the maximum gouge depth expected over the design life. Excavated centers are costly to construct and can,t guarantee equipment survivability. The HVDC Power Buoy is designed to be portable. The incoming HVDC transmission line can be severed via the aforementioned Cable Guillotine. The outgoing subsea equipment power and control cables shall be installed with re-connectable weak links. The HVDC Power Buoy can be disconnected and relocated to avoid ice or moved to an alternate location for decommissioning or re-deployment to another field requiring SAPT power supply. Retrieval of the HVDC cable is also envisioned for re-use should redeployment of the buoy be considered as an option.
Qualification Challenges
The “Achilles Heel” for this concept is the miniaturization of the HVDC Inverter Assembly. Sihler [2] has submitted a patent application that specifically addresses HVDC Inverter miniaturization requirements. In short, the patent application provides for an insulating oil filled dielectric modular stacked power converter vessel. The modular stacked power converter vessel may include an inner container at a first potential (HVDC), a modular stacked power converter positioned within the inner container, and an outer container. The outer container surrounds the inner container and may be at a second potential (Ground). Incidentally, the driver for this patent application is also long
distance power transmission to offshore consumers. The primary effect of choosing oil filled dielectric environments over air is driven by dielectric breakdown strength. Mineral Oil has approximately five-times (5X) the dielectric breakdown strength of air and, conceivably, energized components can be placed at least five-times (5X) closer together while maintaining robust electrical isolation. The liquid dielectric environment also promotes conductiveconvective cooling where the air dielectric environment is solely limited convective cooling. Cooling is also a significant driver for HVDC component miniaturization. As demonstrated within the body of this work, HVDC Drivers are real and are significant and power industry players are taking note of the need for HVDC power transmission to offshore consumers. The path forward must include a Joint Industry Project which quantifies the market demand and will drive Power Industry leaders to move their miniaturization development schedules to the “left.” The market is out there, what remains are to push this fact to the forefront of power industry business development.
Target Applications
In addition to supplying power to remotely located subsea completions, the HVDC Power Buoy is only one of many applications ideally suited for HVDC power transmission. The average FPSO includes a typical power generation utility as high as 5070- MVA. Other offshore production host facilities also require utility service of this magnitude due to all the pre-export processing required. These facilities are ripe to exploit HVDC transmission. They represent relatively large, remotely located consumers that typically remain onsite for 1020- years. Simplifying onboard power systems, not to mention gains in generating efficiency and zero local carbon emissions are real and present drivers for HVDC technology application.
REFERENCES
1. A. R. Bergen and V. Vittal, Power System Analysis, 2nd ed:
Prentice-Hall, 2000. 2. M.R. Williams, et al, Patent Title: Shearing Arrangement for Subsea Umbilicals, Patent Number: US 6,397,948 B1,
Publication Date: June 2002. 3. Christof Martin Sihler, Patent Application Title: Modular
Stacked Power Converter Vessel, Patent Application Number: 20120057308, Publication Date: 2012 - 03 - 08.

Figure 1: HVDC Power Buoy Hull & Mooring
Since 2003, flow measurement Systems Company has been established according to the investment authority laws and executive regulations to serve the oil &gas sectors as well as industrial & commercial sector in Egypt & the region to provide hydro test and calibration services. We are accredited by the ILAC, based on the international mutual recognition arrangements (MRA), under the guidelines of ISO/IEC 17025 for general requirements for competence of calibration and testing laboratories. We are certified ISO 9001, OHSAS 18001 and ISO 14001. The ILAC is the peak international authority on laboratory accreditation. Laboratory accreditation provides our clients with formal recognition of the competence of our laboratory. We are re-evaluated regularly by the accreditation body to ensure our continued compliance with requirements. Thus, being accredited is highly regarded both nationally and internationally as reliable indication of our technical competence. Accordingly our data is readily accepted overseas.
PRESSURE TEST
Ó Fully computerized and plc controlled test unit, capable of building pressure up to 30,000 psi by using two air-driven pumps, one for quickfilling and the other to build up pressure to the test value. Ó The pressure test Monitored digitally on system wide screen and recorded on paper charts to issue full test report. Ó Camera system is installed for monitoring the test and observing any leakage. Ó The test unit operated with remote control systems
PRESSURE SAFETY VALVE CALIBRATION AND TESTING
We undertakes Inspection, Overhaul, Calibration and Certification of all types of Pressure Relief Valves AS (A SAFETY RELIEF VALVES , PRESSURE SWITCH And PILOT VALVES ) with high accuracy equipments( Ventill test unit , Haskel gas boosters , pressure sensors ) FMS carries out these jobs according to procedures developed ‘In House’ conforming to the requirements of BS EN ISO 41261:2013, API-598 and API 576 standards.
AIR BLOWING
Objective :
Air blowing services as an efficient way to remove construction debris, loose rust, liquids, and other contaminants from process piping.
Application processes :
Ó Air Flushing for piping diameters less than 6”. Ó Air Blowing (Buffing) for piping diameters bigger than 6”.
FMS INTEGRATED CONTROL
Everything you need for your Automation and Control Systems Ó Control Panel Design & Fabrication. Ó Programmable Logic Controllers (PLC). Ó OIT‘s (Operator Interface Panels) or HMI’s (Human
Machine Interface). Ó Pondhop automation and control systems. Ó Process Plant Troubleshooting & Engineering Problem
Solving.
Q2-0101
FLOWMEASUREMENTSYSTEMS(FMS) 177Fifth&SixthDistrict,IndustrialZone,ZahraaAlMaadi Cairo Egypt
CalibrationofPressureWorkingDevices;InspectionofSafety-RelievingDevices; ProvisionofLiquidandGasPressureTestServices
NoExclusionsIdentifiedasApplicable Contact Persons:
Khaled abdeltawab
General Manager Mob. 0 12 2364 0198 Email. K.tawab@fms.com.eg
Mahmoud Rashwan
Service Quality Mob. 01211122491
CALIBRATION SERVICES
Ó Calibration for pressure gauges up to 30 KPSI (Analog & Digital). Ó Calibration for pressure recorder (Renting and repair). Ó Calibration for tong torque and tong line pull systems. Ó Calibration for silo tanks weight indicator systems. Ó Length measurement tools (verniercalliper- micrometers) Ó Calibration for with different kind and ranges of torque wrenches. Ó Calibration for all kind of pressure transmitters and transducers.
PIPELINE SERVICES
Equally applicable to new build modules as well as existing plant , good flange management can provide a single point source of all information relating to the history, make up or any other relevant details relating to all flanges within a system.
Applications:
Ó Used during engineering construction, commissioning and shutdowns Ó Flange break register during shutdown and maintenance
Nadine Afifi
Senior Acc. & purchasing Mob. 01273773385 Email. F1@fmseg.com admin@fms.com.eg
Amr Shawky
Admin. & Security manager Mob. 01282783499
Sayed Ahmed
Financial Accountant Mob. 201211122494 Email. fm@fmseg.com admin@fms.com.eg
Hassan Shaalan
Marketing Specilist Mob. 01211122493 Email. it@fmseg.com
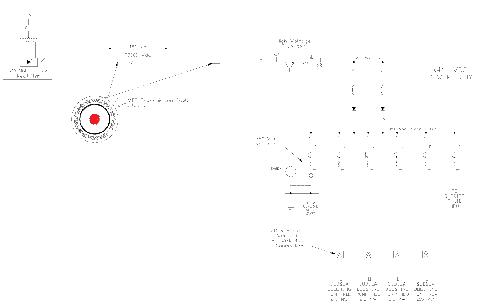
Figure 2: HVDC Power Buoy Oneline Schematic
Figure 3: Multi-Pulse Active Input Rectifier Figure 4: HVDC Coaxial Transmission Cable, 185 mm^2, 75kVdc
Figure 5: US Patent 6,397,948 B1 Guillotine Concept

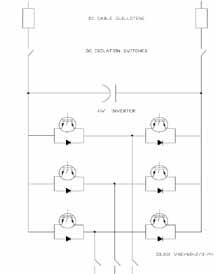
Figure 6: HVDC VSC Inverter Figure 7: L-C-L Sinusoidal Filter / Step-down Transformer Network
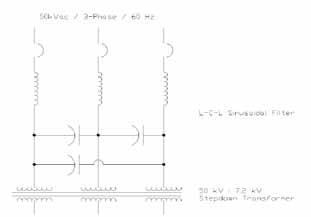
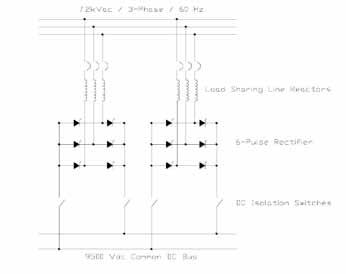
Figure 8: Dual Rectifier Common DC Bus Network
Figure 9: Medium Voltage Inverters
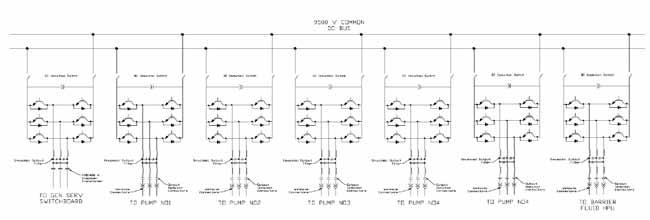
Figure 10: Weak Link Sketch
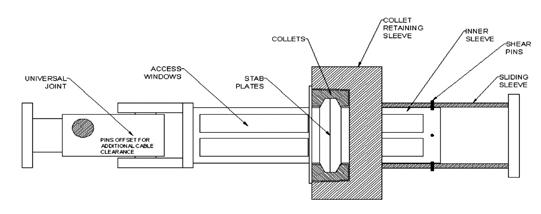

Figure 11: Distributed Parameter Transmission Line per Unit Circuit
Figure 12: 185 mm2 Transmission Line Reactive Power Requirement, No Load Frequency Response: DC to 60 Hz
Figure 13: 185 mm2 Transmission Line Reactive Power Requirement, No Load Frequency Response: DC to 60 Hz
Figure 14: 3-Phase Thyristor Controlled Static Var Compensation Network
Figure 15: Typical Harmonics contributed by a Static Var Compensation Network Figure 16: Arctic Ice Issues


IPG
YOUR PARTNER OF CHOICE

Cairo Office: 5 B/1 Atef Khattab St., Takseem El-Laselky, New Maadi , Cairo , Egypt. Tel: (+202) 2516 18 25 /6 /8 /9 Fax: (+202) 2517 1670 Services Locations: Main base in Zahraa El Maadi Industrial Zone Area. Ras Garib base. Red Sea Area. Suez, Attaqa Free Zone. www.ipg-eg.com info@ipg-eg.com
Accelerating Completions Concept Select in Unconventional Plays Using Diagnostics and Frac Modeling
By
Ali Azad, Kiran Somanchi, Jim R. Brewer, and Daniel Yang, Shell Canada
Abstract
Data pads in unconventional plays have shown significant value when they are carefully designed to tackle specific problems or concerns. This includes the use of diagnostics to cross-validate development concepts such as stimulation design, well architecture, frac and well spacing, and numerous other variables. In this paper, it is demonstrated how various diagnostics technologies together with subsurface data can be used to calibrate a frac model. The model can then be coupled with a reservoir simulator to accelerate completions concept select decisions in unconventional plays. This process (a) eliminates multiple field trial costs, (b) tests different completions and stimulation designs, and (c) assists in derisking various field development planning scenarios. This paper focuses on a real-life case-study where integrated diagnostics and modeling were applied to de-risk multiple completions scenarios. An intermediate planar frac model was calibrated and used to lower the uncertainty of key frac parameters including frac geometry and conductivity. In addition, subsurface parameters such as in-situ stresses and rock properties were tuned. The results from the integrated modeling effort were used to propose future development options for the play.
Introduction
Pad design in unconventional reservoirs is an extensive multivariate problem. The difficulty starts with subsurface characterization which is highly uncertain. Other than the conventional reservoir quality, rock mechanical properties play a role in hydraulic fracturing operation. Completion design variables such as well spacing, architecture and stimulation are interlinked with subsurface variability. The system response cannot directly be measured. Moreover, the system is not necessarily responsive to every single or combined change in input variables. In such cases, data analysis has to go ahead of the physics to break down the complicated problem into segments for incremental learnings. For this reason, data pads (aka field trials) are proposed to characterize the subsurface, test design scenarios and monitor reservoir response. In data pads, subsurface properties are characterized through well logs, core and seismic measurements. Initial flow back data and surface pressure data are also acquired to evaluate the reservoir response to the completion design. In addition, diagnostic technologies such as micro-seismic (Cipolla et al., 2012; Warpinski and Wolhart, 2016 and Warpinski et al., 2014), geochemical fingerprinting, (Noyau et al., 1997) and fiber-optics (e.g., Huckabee, 2009; Molenaar et al., 2012; Cox and Molenaar, 2013; Webster et al., 2013 and Ugueto et al., 2014, 2016, 2017) enhance the understanding of the subsurface dynamics by revealing hidden aspects of hydraulic fracturing operations. These technologies are complementary; micro-seismic and geochemical fingerprinting are more useful for reservoir-level insights whereas fiber optics are better suited for well-level insights (Somanchi et al., 2016). Diagnostics are typically employed for monitoring hydraulic fracturing operations, and in some cases, the information is used to make real-time changes to frac design. Post-completion data integration can be used to characterize reservoir behavior, validate various hypotheses, and assess the impact of well and completions design on well productivity. Diagnostics by nature are not predictive, i.e., they only shed light on what is happening in the reservoir and cannot predict the impact of changing key variables such as landing depth, well spacing and tonnage on fracture geometry and production. For that, modeling exercises are needed to evaluate theories and rank them against production results.
