Unlocking Adaptive Transformation: The Role
of Early Assessment

Unlocking Adaptive Transformation:
The Role of Early Assessment
Acknowledgements
Authors:
Helena Jingyi Christensen, Sustainability Manager, SHL
Enlai Hooi, Head of Innovation, SHL
Martina Guasco, PhD Candidate, University of Genoa
Design:
Jacob WIlliams, Graphic Design
Project Leadership:
Leigh Christy, Project Director
Kimberly Seigel, Project Advisor
Internal Reviewers:
Claire Glanois, AI/ML Researcher, SHL
About Perkins&Will
Innovation starts with inquiry. In our never-ending quest for knowledge, we push limits, take risks, investigate, and discover.
Perkins&Will, an interdisciplinary, research-based architecture and design firm, was founded in 1935 on the belief that design has the power to transform lives. Our research is inspired by our practice, and our practice is informed by our research.
We believe that research holds the key to greater project performance. Our researchers and designers work in partnership from project start to completion. We constantly ask ourselves, “What if?” “What’s next?” This makes our ideas clearer, our designs smarter, our teams happier, and allows us to innovate to achieve our clients' goals and further best practices in design.
www.perkinswill.com
About Schmidt Hammer Lassen
The revitalisation of historic places and spaces is not just an effort to save meaningful buildings, but also an endeavor critical to eliminating waste for the future of the planet.
Schmidt Hammer Lassen is a Danish architecture studio with offices in Copenhagen, Aarhus, and Shanghai. Our approach is anchored in Nordic architectural traditions based on democracy, sustainability and aesthetics - and we believe design should be an act of generosity.
Our Sustainability practice researches on adaptive transformations and provides opportunities to build on the past by creating adaptable places for the future. Schmidt Hammer Lassen is a proud member of the Perkins&Will family.
www.shl.dk
Funded through Ministerial Decree No. 630/2024 under the European Union’s NextGenerationEU programme and the Italian National Recovery and Resilience Plan (PNRR), Ministry of University and Research (MUR), with Schmidt Hammer Lassen, Copenhagen, Denmark.
Current decision-making models cannot secure a viable future for a growing share of the built environment.
Across Europe and North America, buildings are becoming economically obsolete. Converging financial, regulatory, and social pressures are producing a growing pool of stranded commercial buildings. An unprecedented confluence of pressures, including overproduction, shifts in demand accelerated by the COVID pandemic, and regulatory change, is collectively shortening building lifespans and concentrating investment in a narrowing band of premium assets.
The result is a widening class of properties that yield no returns for owners and impose urban and social burdens for cities. Demolition and mothballing, the conventional responses, carry significant financial, environmental, and social risks of their own. Adaptive transformation offers a viable alternative, but it is currently excluded from the earliest stages of investment decision-making.
The next five to seven years constitute a critical window for change, and one that signals a growing urgency for our expertise to come into play. We have conducted research that defines the conditions under which adaptive transformation can be systematically and credibly considered alongside demolition and mothballing at the point when end-of-market-life decisions are first made.



Adaptive transformation is currently excluded from early-stage decision-making.
Introduction
Context and Problem Statement
Buildings are designed and constructed with an intended service life, typically spanning at least 50 years (European Committee for Standardization, 2002, p. 28, Table 2.1). This service life is by no means a practical limitation to the operating life of a building and should not be equated to the end of a building’s natural lifespan. In practice, however, a building can lose its economic relevance long before its lifespan is exhausted. Market shifts, regulatory shifts, and changing patterns of use can erode the viability of a building’s intended use, its ability to generate financial returns, attract tenants, or retain value, while the structure itself remains physically sound (Devaney, 2022, p. 529). When this occurs, the building enters a condition of financial obsolescence: its programmed use is no longer competitive in the market, but it has not deteriorated to the point of requiring replacement on physical grounds alone (Devaney, 2022, p. 529).
In the case of financial obsolescence, private and public portfolio owners, including institutions, developers, municipalities, and other entities that hold buildings as assets, typically rely on real-estate advisory services to define what viable options remain. The options assessed at this stage are typically limited to repositioning (understood here as an upgrade of existing use without a change in program), sale, or demolition with a view to new construction. The transformation of a building from one use to another, or a deep retrofit to restore market competitiveness, is rarely among them (PwC, 2024, p. 30).
Buildings not suitable for a straightforward repositioning exercise, where an upgrade is made to the existing use, risk becoming financially stranded. They are unable to meet financial return expectations, difficult to sell or convert, and often remain vacant or at risk of becoming so. In current real estate practice, repositioning is primarily assessed
on premium buildings in competitive locations (commonly referred to as prime assets), where secure returns can justify the time, cost, and uncertainty of complex feasibility appraisals (PwC, 2024, p. 30). Adaptive transformation is often considered only when regulatory or logistical obstacles hinder demolition (Baker et al., 2021, p. 1). Secondary and underperforming properties, understood here as Class B and C assets in locations that lack demand, are systematically excluded from adaptive transformation evaluations (Remøy, 2010, p. 115).
For these secondary and underperforming buildings, exit strategies such as demolition, which clears the site for potential redevelopment, or “mothballing,”which suspends operating overheads while awaiting better conditions for future reactivation, are frequently prioritized (Wilkinson et al., 2021). Adaptive transformation is systematically excluded at this stage because its assessment requires the complex integration of regulatory, technical, market, financial, and environmental considerations, which are difficult to accommodate within investor time horizons (Endeavor Interviews, personal communication, 2025).
This study addresses the gap through three research questions:
RQ 1 RQ 2
Why are an increasing number of commercial buildings becoming financially stranded, and why do current market responses fail to resolve the condition?
How large is the pool of stranded commercial assets across Europe and North America, and where does realistic demand for adaptive transformation concentrate?
RQ 3
What would a structured early-stage assessment approach need to deliver to make adaptive transformation consistently evaluable alongside demolition and mothballing?
Research Objectives and Methodology
Objectives:
This research investigates the conditions under which adaptive transformation can be systematically and credibly considered alongside demolition and mothballing when end-of-market-life decisions are first formulated. The focus is on properties in high-activity urban markets across Europe and North America, with particular attention to how complexity, cost, and temporal uncertainty currently limit the applicability of reuse beyond prime buildings.
The research is structured in three parts:
01. The Stranded Asset Phenomenon
How buildings become financially obsolete and why current market responses fail to resolve it
Methodology:
Where stranded assets concentrate and how to identify the segments with realistic reuse potential
Why reuse is excluded from early-stage decisions and what is required to evaluate it systematically
The study draws on 28 semi-structured interviews with key stakeholders across real estate investment, architecture, engineering, and public authorities, validated against a literature review and empirical data from industry reports, including PwC, CBRE, JLL, and Colliers, covering Europe and North America for the period 2022 to 2026.
The Stranded Asset Phenomenon
From Cyclical Vacancy to Structural Obsolescence
Real estate markets have historically operated on a cyclical logic (Mueller, 2001, p.1): Periods of oversupply and vacancy are followed by absorption, recovery, and renewed investment. Buildings that lost occupiers in a downturn could reasonably expect to regain them as conditions improved. That assumption is no longer sufficient to describe what is happening across commercial real estate markets in Europe and North America today.
The post-2020 period has produced a set of structural shifts that do not behave like cyclical corrections (European Central Bank, 2023). For buildings that fall outside the narrowing band of assets perceived as resilient, the consequence is not a temporary period of vacancy pending recovery. It is a structural condition of obsolescence from which cyclical improvement alone offers no exit (European Central Bank, 2023). Understanding how and why buildings reach that condition, and at what scale, is the subject of this chapter.
In today’s major urban markets across Europe and North America, multi-story commercial and institutional stranded assets are the most immediate candidates for adaptive transformation interventions.
What You’ll Find in Chapter 1
This chapter proceeds in four parts:
1.1: What are Stranded Assets?
Defining the stranded asset condition and the asset quality classifications that structure market behaviour
1.2: Why Do Buildings Become Stranded?
Examining the causes of obsolescence across macroeconomic, market, regulatory, and behavioral dimensions
1.3 Market Obsolescence: Risks and Consequences of Stranded Assets
Assessing the risks and consequences for private and public stakeholders
1.4 The Role of Early Assessment
Determining the scale of the phenomenon and the latent demand for reuse that current practice leaves unaddressed.
What are Stranded Assets?
From Vacancy to Stranding:
Why Physical Condition Is Not the Deciding Factor
A stranded asset is a building that has become obsolete, so that it can no longer attract tenants or investment, leaving it in a condition of persistent vacancy. This is distinct from the ordinary vacancy that characterizes healthy real estate markets, where empty space simply signals availability and allows tenants and investors to move between buildings (Muldoon-Smith & Greenhalgh, 2017, p. 2).
What makes stranded assets particularly significant is that physical deterioration is not a precondition. A building can be structurally sound, wellmaintained, and fully intact yet still unable to compete. Stranding is therefore a market condition as much as a physical one, driven by a building’s failure to remain relevant to current patterns of use, investment, and regulation rather than by any material deficiency alone (Devaney, 2022, p. 529).



Asset Quality Classification:
How the Market Ranks Competitive Position
Commercial real estate assets are broadly classified into three quality tiers that reflect a building’s relative competitiveness within its market (JLL, n.d.).

Class A Buildings:
Represent the highest-quality stock: well-located, modern, or substantially renovated, and meeting current tenant expectations in terms of specification, amenity, and environmental performance.

Class B Buildings:
Functionally adequate but lacking the locational advantages or technical specification of Class A stock, placing them in an intermediate and often uncertain market position.

Class C Buildings:
Older, poorly located, or technically obsolete assets that struggle to attract tenants under current market conditions.
Note:
These classifications are not fixed. A building can migrate between classes as market conditions shift, competing supply improves, or regulatory requirements tighten.
Why Do Buildings Become Stranded?
Several converging conditions can drive a building from one asset class to another and ultimately toward financial stranding. Obsolescence rarely has a single cause; it stems from multiple converging factors: a building’s inability to attract tenants; its location bypassed by investment; valuation misalignment that creates market illiquidity; regulatory noncompliance with evolving environmental standards; and functional misalignment with changing patterns of use and occupation (CRREM, 2022; p. 1-2). These factors do not operate in isolation. They compound one another, and a building exposed to several simultaneously can move from competitive to stranded within a relatively short period.
The five subsections that follow examine the external conditions driving this trend across macroeconomic, market, geographic, regulatory, and behavioral dimensions.
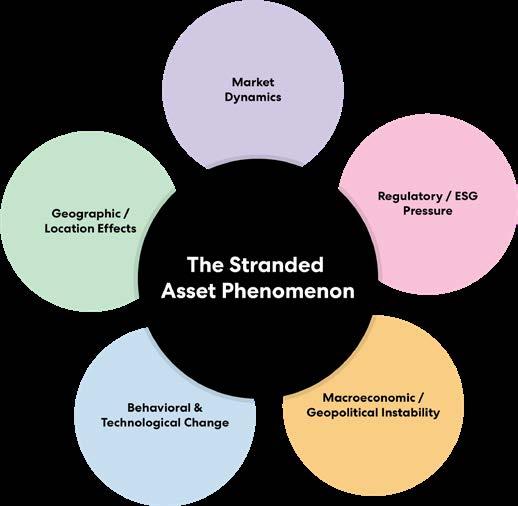
Figure 1: The five compounding conditions that drive a building toward financial stranding: Market dynamics, regulatory and ESG pressure, macroeconomic and geopolitical instability, geographic and location effects, and behavioral and technological change.
1.2.1 Behavioral and Technology Change
When the Demand for a Building Disappears
Shifts in how people work, shop, and occupy space carry direct consequences for the viability of buildings. When fundamental behaviors about the way spaces are used shift, the building itself can become stranded, not because it has deteriorated, but because it no longer aligns with how its potential users live and work.

Office Sector
The workplace and office segment is a well-known example. Hybrid and flexible working patterns were already reshaping tenant behavior before 2020, but the COVID pandemic functioned as an accelerant: Within a short period, a critical mass of employers became comfortable with remote work, normalizing arrangements that had previously been considered exceptional. Remote working increased sharply and endured long after the emergency had passed, becoming a standard expectation for many workers rather than an exception. This shift is compounded by a broader transformation in the employment landscape (Gardner et al., 2025).
Contract-based and freelance work is growing rapidly across Europe and North America: By 2027, the number of freelancers in the U.S. labor force is projected to exceed the number of salaried employees. This has direct consequences for both working and living patterns, reshaping the types of spaces people need, where they need them, and how frequently they occupy them. Buildings designed around the assumption of full-time, fixed-location employment are increasingly misaligned with the reality of how a growing share of the workforce organizes its activities.

Retail
The retail sector has experienced similar disruptions. Mall vacancy rates across the United States are increasingly bifurcated, with older sprawl malls seeing greater vacancy than district corridors with specialised retail (CBRE, 2026). This is not a cyclical fluctuation but reflects a broader structural shift in retail demand. The continued growth of e-commerce and changing consumer behavior have altered the role and performance of traditional mall formats (Knight Frank, 2025). AI-assisted shopping is expected to accelerate this trend further, reducing the need for physical browsing and eroding the experiential rationale that has sustained mid-tier retail destinations in the face of e-commerce competition.
A further and distinct driver of demand shifts is the rapid expansion of artificial intelligence infrastructure. The growing requirement for data centers has emerged as one of the most significant new sources of real estate demand across Europe and the United States. Global data center investment transactions surpassed $61 billion in 2025 (Roach, 2025), and JLL projects total capital requirements of up to $3 trillion through 2030 (JLL, 2026). Investment at this scale does not distribute evenly across the existing building stock. It concentrates in locations that can meet the power, connectivity, and cooling requirements data centers demand, accelerating the obsolescence of assets in locations that cannot. For a significant share of the existing commercial building inventory, this represents both an opportunity and a further source of competitive pressure: a new and rapidly growing category of demand for which they are structurally unsuited.
Note:
In this context, the challenge for existing buildings is not only to accommodate different uses but to remain capable of evolving in line with accelerating change. The timescales within which buildings must adapt are compressing. A building that was fit for purpose a decade ago may already be misaligned with current occupier expectations, and the pace of technological and behavioral change makes it increasingly difficult to anticipate what will be required a decade from now. Buildings that lack the spatial flexibility and technical adaptability to respond to these shifts face a growing risk of obsolescence, regardless of their physical condition or location. What distinguishes buildings that retain relevance over time is not the quality of their original design for a specific use, but their capacity to adapt as the needs of occupiers, investors, and cities evolve around them.
1.2.2 Macroeconomic and Geopolitical Instability
How Market Uncertainty Accelerates Asset Separation
The Post-Pandemic Period: The period between 2020 and 2025 was particularly consequential in this regard, producing a sequence of disruptions whose combined effect on building stocks has not yet fully resolved (PwC & ULI, 2025; Jones Lang LaSalle, 2025). The COVID-19 pandemic forced rapid and lasting shifts in how people work, shop, and occupy space. Many of these changes have proven more permanent than initially expected (PwC & ULI, 2025, p. 17), leaving behind a significant number of buildings whose original purpose no longer matches how space is being used.
The post-pandemic period brought further instability. Russia’s invasion of Ukraine in February 2022 triggered a surge in energy prices that heightened recession risks (PwC & ULI, 2022, pp. 4, 13) in Europe and North America, slowing development activity, raising construction costs, and leading to the postponement or cancellation of new projects (JLL, 2025). Ongoing instability in the Middle East and significant shifts in U.S. political leadership have since added further layers of uncertainty to an already volatile investment environment (JLL, 2025).
The cumulative effect has been a fundamental shift in how investors approach real estate. Rather than pursuing opportunistic, short-term strategies, investors across both Europe and North America have shifted toward predictable, safe-return segments, prioritizing assets that can demonstrate long-term resilience (CBRE, 2026).
European Markets
In Europe, this shift is reflected in a growing preference for capitalstable markets characterized by stable governance, strong economic fundamentals, and high liquidity (Cushman & Wakefield, 2026, pp. 10–14, 35). The EU industry’s outlook increasingly prioritizes long-term strategies anchored in sustainability, urban development, and a reimagined relationship between real estate and the public sector. However, this reorientation has not extended uniformly across all building types and locations, making the gap between competitive and underperforming assets increasingly pronounced (Cushman & Wakefield, 2026).
North American Markets
In North America, the same dynamic is playing out at the asset level. CBRE’s 2026 report notes that “financial markets will remain volatile due to government and economic policy, particularly with regard to trade,” (CBRE, 2026, p. 7), while JLL records a decline in all sectors of U.S. commercial real estate (CRE) new supply, pointing to an investment environment that is consolidating around existing assets rather than expanding (JLL, 2026). Investment is consequently concentrating in buildings already perceived as stable in terms of leasing and selling profitability, while assets that cannot demonstrate that resilience face growing difficulty in attracting the capital needed to remain competitive (CBRE Research, 2026a).
Figure 2: Conceptual model illustrating how post-pandemic macroeconomic and geopolitical instability reshapes investor behavior, leading to capital concentration and, in combination with functional obsolescence, accelerating the divergence between competitive and noncompetitive assets.
Note:
Taken together, these macroeconomic and geopolitical pressures have accelerated the separation between competitive and non-competitive assets across both continents, directly expanding the pool of buildings at risk of becoming stranded.
1.2.3 The Flight to Quality
How Investor Behavior Drives Market Bifurcation
When markets become unstable, investors respond by concentrating capital in the safest, most reliable assets available. This behavior, commonly referred to as “flight to quality,” has direct consequences for buildings: It reorganizes demand around a shrinking pool of high-performing assets and withdraws it from the rest.
A demand-side response to market turbulence that exacerbates the effects of bifurcation is an oversupply condition. When confidence falls and risk appetite contracts, investors become increasingly selective, directing occupancy and capital toward buildings perceived as safe, stable, and capable of sustaining long-term returns.
The result is a growing divide between assets that attract investment and those that do not.
Class A buildings (prime assets which are well-located, well-specified, and ESGcompliant) exhibit low vacancy rates and sustained investor interest. By contrast, class B and C buildings (secondary assets) face relative oversupply, not because more space has been built, but because the demand that once supported them has concentrated elsewhere. The buildings retaining occupiers are not necessarily the newest, but rather those combining the best locations with updated amenities and strong ESG credentials (PwC & ULI, 2024). CBRE confirms this dynamic across both Europe and North America, noting that vacancy differences between prime and lowerquality buildings are expected to widen as demand continues to concentrate in high-quality space (CBRE, 2025a, CBRE, 2025b). This separation between assets that attract sustained investment and those that do not is commonly referred to as market bifurcation.
For Class B and C commercial buildings, this dynamic is particularly consequential. As investment concentrates in prime assets, secondary buildings face a growing deficit of both occupiers and capital. Without investment, they cannot improve. Without improvement, they cannot compete. The trajectory, if uninterrupted, leads toward obsolescence.
A further pressure compounds this dynamic. Real estate construction responds to demand with a significant time lag, frequently delivering new buildings into a market that has already changed. When the demand that justified a building’s construction shifts or disappears, that building loses its revenue-generating purpose while remaining physically present. The combination of concentrated demand and market oversupply leaves a growing number of buildings without a viable market future.
Class B/C (Secondary)
Class A (Primary)
The bifurcation gap widens
Figure 3: Vacancy rates for Class A (primary) assets have remained low and stable while Class B/C (secondary) assets show a widening gap, illustrating market bifurcation between 2020 and 2026.
1.2.4 The Geography of Obsolescence
Why Location Compounds Building Risk
The bifurcation dynamic is active at the scale of cities and regions. When more space exists in a given sector than the market can absorb, not all locations experience contraction equally. Capital investment typically pulls back from smaller cities and peripheral urban areas, concentrating in the largest, most connected, and economically active centers (PwC & ULI, 2024; JLL, 2026; CBRE, 2025). This matters because it makes a building’s location as consequential as its physical condition. A well-maintained, recently renovated office building in a smaller city can experience persistent vacancy as demand moves elsewhere. The vitality of its surrounding area, the depth of local demand, and the city’s overall position within the broader investment landscape are as relevant to its long-term viability as its structural condition or technical quality.
Building quality and the location-based demand form two independent but reciprocal sources of vacancy. A building that is both secondary in quality and peripheral in location faces the greatest risk of becoming stranded.
Strong Location
Location Strength
Building Quality
Strong Location + Strong Building = Prime Asset
Prime assets retain occupiers and investment. Flight-to-quality dynamic works in their favor.
Weak Location
Weak Location + Strong Building = Location Constrained
Physical quality cannot compensate for the absence of local demand, increasing risk of persistent vacancy.
Strong Location + Weak Building = Upgrade
Candidate
Location might be able to sustain demand, however physical deficiencies remain a barrier.
Weak Location + Weak Building = High Risk Asset
No locational demand advantage. No physical quality advantage. These are the most likely to face stranding.
Figure 4: Conceptual matrix illustrating how location strength and building quality act as independent but compounding determinants of asset performance. Capital concentration in high-demand markets amplifies these effects, increasing the risk of obsolescence for assets that are both physically and geographically disadvantaged.
1.2.5 Environmental and Regulatory Shifts
How Compliance Obligations Create and Resolve Stranding
Compliance-driven obsolescence occurs when regulations and codes change postconstruction and affect real estate assets’ potential for future use. These typically include energy performance, but extend to fire safety, structural resilience, and environmental compliance, and can apply retroactively to buildings already in place, particularly in applications for upgrading or changing the building’s use.
Buildings are designed and constructed to meet the standards of their time, but those standards evolve. Following the Grenfell Tower fire in 2017, the United Kingdom introduced fire safety legislation imposing significant new obligations on existing buildings (UK Parliament, 2022), particularly those with cladding systems that had previously met standards but were subsequently found to be hazardous. On the west coast of North America, seismic safety requirements place comparable pressure on older building stocks that predate current structural standards (U.S. Geological Survey). Across Europe and North America, successive regulatory shifts in energy performance are creating similarly binding compliance horizons for buildings that were never designed to meet today’s environmental expectations.
These shifts create obligations that were not part of a building’s original design. For buildings in weaker market positions, the cost of meeting current standards can itself become a cause of stranding: The investment required to comply cannot be justified by the returns the asset is capable of generating.
Guys and St Thomas’ External Retrofit: London, UK
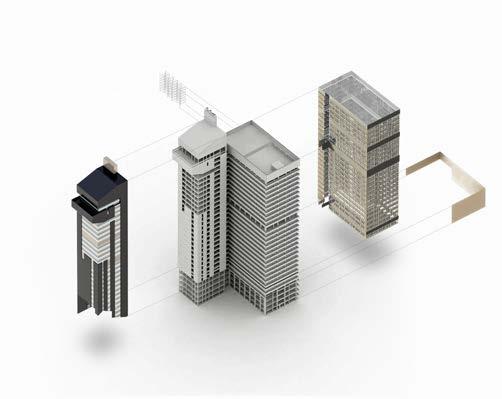
At 143 metres, one of the tallest hospital towers in the world has been re-clad to solve constructional problems typical in commercial as well as civic buildings of the late sixties and early seventies. As well as optimising energy efficiency and lowering running costs, our solution has given this iconic building a distinct new profile befitting the national significance of the NHS and symbolises a resurgent London neighbourhood. Image Credit: Dennis Gilbert
European Regulatory Framework
In the European Union, the Energy Performance of Buildings Directive (EPBD, 2024/1275) sets out a binding roadmap toward climate neutrality by 2050, requiring Member States to progressively improve the energy performance of their national building stocks. For nonresidential buildings, at least 16% of the worst-performing stock must be improved by 2030, rising to 26% by 2033. For residential buildings, Member States must reduce average primary energy use by at least 16% by 2030 and 20–22% by 2035 relative to 2020 levels (Directive (EU) 2024/1275, 2024, Art. 9(1)–(2)).
These targets are legally binding for Member States. They are tied to the Energy Performance Certificate (EPC)
system, which is triggered at key transaction points including construction, major renovations, sales, and new tenancy agreements. In practice, this means compliance obligations become unavoidable precisely at the points when buildings change hands or are brought back to market.
For investors and lenders, this creates a direct financial pressure. Buildings that cannot demonstrate a credible path to compliance face growing difficulty attracting financing, tenants, and buyers. Assets that fall short of required standards are increasingly treated as illiquid, accelerating their trajectory toward obsolescence (PwC & ULI, 2024).
1.2.5 Environmental and Regulatory Shifts
North American Regulatory Framework
United States
The regulatory landscape in North America is more fragmented, operating primarily at the state and city level following the revocation of federal netzero ambitions in January 2025. The most consequential requirements are emerging in major metropolitan markets, where some of the largest and oldest commercial building stocks in the country are located:
nj In Boston, the Building Emissions Reduction and Disclosure Ordinance (BERDO) requires covered buildings to begin complying with emissions limits from 2025 or 2030, depending on the building size, covering multifamily and non-residential buildings of 20,000 sq ft or more, or with 15 or more units.
nj In New York City, Local Law 97, part of the Climate Mobilization Act, places annual greenhouse gas (GHG) emissions caps on most buildings over 25,000 sq ft, with the first compliance period running 2024–2029 and stricter limits applying from 2030–2034.
nj In Washington DC, the Building Energy Performance Standards (BEPS) require covered existing buildings, initially those of 50,000 sq ft or more, with later expansion to smaller thresholds, to meet a minimum energy performance threshold set by building type, with compliance cycles defined through the Department of Energy and Environment (DOEE).
Canada
In Canada, comparable pressure is emerging at the municipal level, with some of the most advanced building decarbonization frameworks in North America concentrated in British Columbia and Ontario.
nj In Vancouver, the Zero Emissions Building Plan requires existing large buildings to phase out fossil fuel heating and cooling systems, with near-term requirements already in effect for new equipment installations and milestones aligned to the city’s 2050 net-zero target (City of Vancouver, 2022).
nj In British Columbia more broadly, the BC Energy Step Code sets a tiered provincial performance pathway that creates an escalating compliance horizon for buildings undergoing significant renovation or change of use (Government of British Columbia, 2023).
nj In Toronto, mandatory energy benchmarking and reporting obligations under the Better Buildings Partnership cover large commercial and residential buildings, and a Building Emissions Performance Standard modeled on approaches in New York and Boston was under active development as of mid2025 (City of Toronto, 2024, 2025).
Together, these frameworks mean that Canadian building owners in major urban markets face a compliance horizon that, while differently structured from their U.S. counterparts, is no less consequential for the investment case on underperforming assets.
British Columbia BC Energy Step Code
Vancouver Zero Emissions Building Plan
Toronto Better Buildings Partnership & BEPS
Boston BERDO
New York City Local Law 97
Washington D.C. BEPS
5: Binding and emerging building-emissions regulations across major U.S. and Canadian markets, including Boston (BERDO), New York City (Local Law 97), Washington D.C. (BEPS), Toronto (Better Buildings Partnership and BEPS), British Columbia (BC Energy Step Code), and Vancouver (Zero Emissions Building Plan).
Note:
Across both countries, the regulatory pressure compounds in buildings that are already financially marginal. A building that cannot generate returns sufficient to fund compliance investment faces an accelerating trajectory toward vacancy, mothballing, or demolition, not because it has deteriorated, but because the gap between its current condition and the required standard has become too costly to close.
Figure
1.2.5 Environmental and Regulatory Shifts
Current frameworks measure operational energy performance only: how much energy a building consumes once occupied. The carbon already embedded in an existing structure, the embodied carbon required to construct a replacement, and the waste generated by demolition fall outside their scope. When a building is demolished to make way for a more energy-efficient replacement, the wholelife carbon balance, encompassing embodied carbon, operational carbon, and end-of-life waste, is frequently worse than retaining and retrofitting the existing structure would have been. Regulatory shifts intended to improve environmental outcomes can, therefore, inadvertently accelerate demolition activity, producing the opposite result at the scale of the building’s full lifecycle. While the EPBD and other regulatory systems are beginning to account for whole-life carbon impacts, the regulatory lag is placing increased stress on underperforming built assets.
An unintended consequence of energy performance regulation is that it can lead to vacancy and demolition, preferring new-build activity to satisfy demand, which is typically more environmentally destructive from both a whole-life carbon and material waste perspective.
Unlike new construction, which can be designed to meet current standards from the outset, existing buildings must be retrofitted, often at high cost, to remain compliant. Buildings in strong market positions can absorb these costs. Those in weaker positions frequently cannot.
Regulatory shifts are therefore not felt equally across the building stock. They widen the gap between buildings with the financial headroom to adapt and those without, reinforcing the bifurcation already driven by the market and locational factors. Buildings that lack a credible adaptation pathway accelerate drift towards market stranding, demolition, or withdrawal from the market.
This same regulatory pressure, however, also creates a significant opportunity. A building that is retrofitted to meet current energy performance standards while being adapted to a new use addresses both conditions simultaneously: It satisfies compliance requirements, extends the useful life of the existing structure, and avoids the embodied carbon and waste costs of demolition and new construction. Where adaptive transformation and energy retrofit are combined, the wholelife carbon outcome is consistently more favorable than demolition and new construction, particularly in the first decades before a new building’s operational savings offset its embodied carbon burden (Royal Institution of Chartered Surveyors [RICS], 2023).
Regulatory shifts that appear to threaten the viability of existing buildings can, under the right conditions, become the primary financial and environmental justification for their transformation.
Projects that reuse a significant amount of primary structure and will achieve the greatest GWP reduction. Reused Materials New Materials
Figure 6: Projects that retain a greater share of a building’s primary structure and floor area achieve proportionally greater reductions in global warming potential (GWP); full core-and-shell retention yields the highest carbon savings.
ExistingBuilding(Donothing)
Figure 7:
Summary
The causes of obsolescence examined in this section do not operate independently of one another. They compound, and their combined effect is a real estate landscape that is reorganizing itself around a shrinking pool of viable assets. Each of the forces examined—macroeconomic, market, geographic, regulatory, and behavioral—compounds the others.
The result is a growing population of buildings that are financially stranded: physically present, often structurally sound, but no longer able to attract the tenants, investment, or returns needed to remain viable. As construction activity slows and the premium segment of the market approaches capacity in many cities, the question of what happens to the remainder becomes increasingly urgent.
These buildings do not disappear.
They accumulate, generating costs and risks for their owners, for lenders, and for the cities in which they sit.
How those risks manifest and what options exist to address them are the discussed in the following sections.
This page intentionally left blank.
Market Obsolescence: Risks and Consequences of Stranded Assets
Market obsolescence occurs when a building can no longer serve the purpose it was designed for in a way that generates sufficient returns to justify continued investment
―(Carbon Risk Real Estate Monitor (CRREM), n.d.).
This is not the end of the building’s life, but rather the end of its current programmatic use. It is a transition point, and the decisions made at this moment determine whether the building finds a new use or becomes a liability for its owners, its lenders, and the city around it (Mueller, 2001).
At this stage, standard market practice involves a structured asset review: an evaluation of the building’s current financial performance, its outstanding liabilities, and its residual market value (how much it can be sold for). This review typically omits transformation, not because it has been evaluated and rejected, but because the tools to assess it credibly within compressed investor timelines do not yet exist as standard practice. The sections that follow examine the consequences of that omission for each affected stakeholder category.
Stakeholder Impacts of Stranded Assets
OWNERS LENDERS
Immediate impact Vacancy → income loss
Financial consequence Falling asset value
Ongoing burden Ongoing carrying costs
End-state pressure
Table
Exit pressure (demo / mothball)
Demolition implies mounting environmental compliance costs, asbestos and contamination liabilities, and a significant waste of embodied carbon.
Mothballing is not an ideal holding strategy either: deferred maintenance compounds physical decay, insurance and security costs accumulate, and the asset continues to deteriorate structurally, while taxes and operating costs remain, and market conditions that would otherwise justify redevelopment may shift.
Loan default risk
Exposure to nonperforming laons
Forced asset takeover
Balance sheet stress
CITIES
Urban decline
Public cost
Social & spatial impact
Long-term decline
When a building reaches this condition, the risks it entails do not remain confined to its owner’s balance sheet. They escalate across interconnected financial, urban, environmental, and social domains, and accountability for managing those risks falls directly on building owners, lenders, and public authorities. A vacant building draws down the value of neighboring properties and discourages further investment in the surrounding area. What begins as a financial problem at the scale of a single asset can, over time, become a social and urban problem at the scale of a neighborhood.
Note:
The sections that follow examine these risks for portfolio owners, lenders, and public authorities. The conditions under which adaptive transformation, introduced at the point of asset review, can serve as a resolution rather than a deferral.
1: Stranded assets shift risk across owners, lenders, and cities, with impacts escalating from immediate financial losses to long-term urban decline.
1.3.1 Risks for Owners & Lenders
When a building becomes stranded, the financial consequences are immediate and self-reinforcing.
As vacancies persist, properties become increasingly difficult to reintegrate into the market (Interviewee 24, Real Estate Advisor, Endeavor Interviews, 2025), resulting in income and liquidity erosion (Interviewee 2, Real Estate Developer, Endeavor Interviews, 2025). Falling asset values reduce the building’s value relative to the debt secured against it, increasing the risk in refinancing (Interviewee 24, Real Estate Advisor, Endeavor Interviews, 2025) and triggering write-downs (a significant drop in the recorded value of a property). Meanwhile, vacant or underperforming buildings continue to “bleed money” (Interviewee 2, Real Estate Developer, Endeavor Interviews, 2025): Owners must service debt, taxes, insurance, and basic security with little or no rental income and no viable market position to offset these costs. Stranded assets are those that remain in limbo, neither actively managed nor successfully offloaded.
This burden falls on investors and lenders. For large institutional owners, typically configured to acquire, invest, and divest rather than redevelop, distressed assets represent a stopping point in the market cycle. Avoiding irreversible value loss becomes a pressing concern, yet these organizations rarely have the internal capacity to address these issues directly, instead delegating the management and resolution of distressed assets to external advisors. As one industry observer notes, they “may own hundreds of properties, but they’re not in the position themselves to hire contractors, develop the properties. They use other agencies to manage and rent properties” (Interviewee 24, Real Estate Advisor, Endeavor Interviews, 2025). Rather than exploring alternative uses (Interviewee 28, Real Estate Consultant, Endeavor Interviews, 2025), owners tend to treat these properties as a financial burden, earmarking them for demolition or mothballing. Where a sale is possible, it depends on a niche market of external developers with sufficient risk appetite, who demand a discount that frequently renders divestment economically unviable for owners.
Risks and Impacts: Owners & Lenders
RISK/DIMENSION
Value Loss
Cash-flow drain
Illiquidity
Capability Gap
Credit risk
Costly exits
Double exposure
IMPACTS
Write-downs, weaker loan-to-value (LTV), refinancing risk
Ongoing costs with little / no income
Hard to sell, deep discounts needed
Dependence on external developers
Non-performing loans, bank workouts
Mothballing failures, expensive demo / redevelopment
Capital loss, high resolution / transaction costs
The risk is equally acute for lenders. When income no longer covers debt service and a loan goes into default, lenders face the prospect of inheriting the stranded property themselves (Interviewee 2, Real Estate Developer, Interviewee 28, Real Estate Consultant, Endeavor Interviews, 2025). Workout specialists (experts in dealing with defaults) describe this as a scenario banks actively seek to avoid: Rather than taking ownership of a non-performing asset they are illequipped to manage or reposition, they may restructure debt, partner with new developers or lenders (Interviewee 28, Real Estate Consultant, Interviewee 23, Real Estate Advisor, Endeavor Interviews, 2025), or sell at a discount (Interviewee 23, Real Estate Advisor, Endeavor Interviews, 2025).
For both investors and lenders, a stranded asset therefore represents a compounding problem: direct capital losses on one side, and mounting pressure to reach a resolution before the asset deteriorates further on the other. The longer the asset remains unresolved, the fewer viable options remain.
Table 2: Risks and Impacts of stranded assets - Portfolio Owners & Lenders
1.3.2 Risks for Cities
From the city’s perspective, financially distressed buildings directly affect multiple spheres of finance, tax, urban responsibility, and wider public interest.
A single vacant building can trigger a cascade of further vacancies in the surrounding neighborhood, creating gaps in the urban fabric that are difficult to reverse (Interviewee 17, Public Authority, Endeavor Interviews, 2025). These gaps can lead to informal occupations, illegal activities, and increased social marginality (Interviewee 17, Public Authority, Endeavor Interviews, 2025). The social impacts of vacancy are further exacerbated by depreciation in surrounding property values, which discourages new investment. Once an area acquires a reputation for vacancy and neglect, attracting investors back requires sustained and costly public effort, as one interviewee observed: “Investors run away from these procedures” (Interviewee 17, Public Authority, Endeavor Interviews, 2025).
At the same time, the cost of maintaining a vacant building in a safe condition is not borne solely by the owner. (Interviewee 24, Real Estate Advisor, Endeavor Interviews, Interviewee 2, Public Authority, Endeavor Interviews, 2025). Local authorities are frequently forced to cover maintenance and security costs in and around such buildings (Interviewee 17, Public Authority, Interviewee 24, Real Estate Advisor, Endeavor Interviews, 2025), absorbing expenditures that the private owner can no longer or will no longer meet. Localized value loss can also shift economic pressure onto other districts, reinforcing the polarization of investment in areas perceived as more attractive and safe. This dynamic deepens spatial inequality across the city: As capital gravitates toward stronger areas, weaker ones are progressively starved of the investment needed to recover.
Risks and Impacts: Public Authorities
RISK/DIMENSION
Social risk
Fiscal strain
Governance burden
Spatial inequality
Last-resort role
Table 3: Risks and Impacts of
IMPACTS
Informal occupation, crime, marginality
Lower tax base, higher public spending
Complex regeneration and coordination
Polarization, gentrification, and displacement
Large demolitions, emergency interventions
Indirectly, this polarization and the associated dynamics of gentrification accelerate residential turnover and push out lower-income residents who struggle to afford rising urban prices.
In more dramatic cases, widespread vacancy can force municipalities to undertake large-scale demolition programs, as happened in Detroit (Detroit Blight Removal Task Force, 2014), where decades of population loss and industrial decline left the city managing thousands of vacant and deteriorating structures at public expense. In Italian cities such as Rome, social marginality often concentrates in vacant buildings that lack basic services, requiring municipalities to both address the social condition and the physical fabric before any form of regeneration can begin (Interviewee 17, Public Authority, Endeavor Interviews, 2025).
Where private owners fail to maintain distressed buildings, some municipalities have introduced powers to intervene. In Italy, for example, the municipality can require owners to carry out maintenance and safety updates on abandoned or degraded buildings and, after formal notice, may step in and perform the work itself, recovering the costs from the owner afterward (Italian Republic, 2001, Comune di Milano). These interventions are a last resort, but their existence signals how far the consequences of stranded assets can extend into the public domain.
Stranded assets are therefore not a private financial problem with incidental urban consequences. They are a public problem that originates in private financial decisions, and the costs of resolving them, in time, money, and political effort, fall disproportionately on cities and the communities within them.
stranded assets - Public Authority
Demolition and Mothballing
When buildings approach the end of their market life, two options are commonly considered during the current asset review:

What it is
Demolition is the planned removal of an existing building or structural component, including site clearance and the management of resulting construction and demolition materials (RICS, 2023). Its financial logic is straightforward: By removing the building, the owner converts a liability into a development site, transferring the asset back into the market not as a building but as land with the right to build.
Why it fails
Demolition as risk transfer
Among investors, lenders, and developers, demolition is treated as a clean exit from a distressed situation. By clearing the site, the current owner converts an unviable building into developable land, pricing the expectation of future construction into the land value and passing the burden of that expectation onto whoever buys it next. Beyond the financial transfer, demolition drives land value appreciation, displaces existing communities, and squanders the embodied carbon already invested in the existing structure, as established in Chapter 1.2.4. The scale of the resulting waste is substantial: Around 450-500 million tonnes of construction and demolition waste are generated annually in the EU (Nordic Council of Ministers, 2023), and around 600 million U.S. short tons in the United States in 2018, of which more than 90% is attributed to demolition (United States Environmental Protection Agency).
What it is
Why it fails

Mothballing is an intentional vacancy in which a building is temporarily deactivated and maintained to preserve its value for future use or sale (International Valuation Standards Council, 2022). Buildings remain unoccupied, operating costs are reduced to a bare minimum, and maintenance is planned to prevent deterioration.
Mothballing as risk deferral
Mothballing is more difficult to document than demolition, as it is hard to distinguish from ordinary vacancy in empirical data. In interviews, investors describe it as an option considered during the asset review, but only viable if maintained for a short period. In practice, it rarely functions as intended. Buildings held in suspension deteriorate faster than expected: “Mothballing typically runs into 10-15 year timelines [...] at that point you have water intrusion, mold, pipes burst [...] what I’ve seen is not successful in actually mothballing a building.” (Interviewee 24, Real Estate Advisor, Endeavor Interviews, 2025).
The result is higher remedial costs and, in most cases, an eventual path to demolition: “Oftentimes we are talking with developers about taking that building down, because the buildings were not maintained for 30 or 40 years.” (Interviewee 24, Real Estate Advisor, Endeavor Interviews, 2025) In some cases, the discount runs so deep that the building has effectively no value as a structure: “literally [buildings] are worth less than the ground they sit on” (Interviewee 2, Public Authority, Endeavor Interviews, 2025).
Beyond its physical consequences, mothballing carries a reputational cost that compounds the financial one. A building held in suspension becomes associated with failure and neglect, making it progressively harder to relocate or sell at a price that reflects the structure’s value.
New opportunities arise if adaptive transformation is introduced at the point of asset review rather than after mothballing has run its course. The following chapters describe the scale of these opportunities and the structured approach needed to act on it.
The Role of Early Assessment
When buildings approach the end of their service life in their original use, the risks they generate do not remain contained. They escalate across financial, urban, and environmental domains, falling on portfolio owners, lenders, and public authorities, compounding over time. The two responses that standard asset review practice reaches for, demolition and mothballing, do not resolve these risks. Both strategies share a common failure: the building’s transformation potential has not been evaluated before either strategy is reached, and the costs of that omission fall across financial, urban, and environmental domains.
Conclusion
The result is a building stock in which structural obsolescence is outpacing the market’s capacity to respond. The conditions driving that gap, and the scale of the opportunity it leaves unaddressed, are the subjects of Chapter 2.
→ Chapter 2
Market Opportunity
Market Opportunity
Adaptive transformation demand does not distribute evenly across the building stock. It concentrates in specific segments defined by property type, building age, ownership structure, and geography, and identifying where it concentrates requires a framework capable of moving from the broadest possible population of eligible buildings down to the realistic near-term pipeline where a structured assessment service is most applicable.
Not every stranded building represents an equal opportunity for adaptive transformation. To move from the broad phenomenon described in Chapter 1 to a realistic picture of where intervention is most viable, three sequential filters are applied:
Property Type and Building Age (treated together)
Different building types carry different levels of stranding risk, and a building’s age determines what that risk looks like in practice.
Geography
Not all cities offer the market conditions, regulatory environment, and depth of demand needed to make the transformation financially viable.
Ownership Structure
Certain types of owners are under more pressure to act than others, and identifying them is as important as identifying the buildings.
Applied in sequence, these three filters narrow a large and unevenly distributed pool of at-risk buildings down to the segment where structured early-stage assessment is most applicable and most likely to change the outcome.
What You’ll Find in Chapter 2
This chapter proceeds in five parts:
2.1: The Scale of Exposure
Maps where stranding risk concentrates geographically, using regulatory pressure, vacancy, and market demand as the three selection criteria
2.2: Age as a Diagnostic Tool
Shows how building age functions as a diagnostic tool, linking construction era to standardised risk profiles that can inform early-stage screening before any site investigation
2.3 Geographical Focus
Maps where stranding risk concentrates geographically, using regulatory pressure, vacancy, and market demand as the three selection criteria
2.4 Regulatory Pressures
Shows how energy performance obligations convert from compliance burden into financial trigger, producing a pipeline of motivated sellers
2.5 Who is Motivated to Act
Identifies which ownership structures carry the incentive and organisational capacity to commission a structured assessment at scale
The Scale of Exposure
Three property types carry the highest concentration of stranding risk relative to their size: office, retail, and industrial and logistics.
―(Endeavor Interviews, 2025).
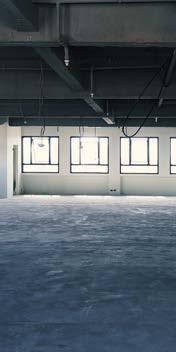
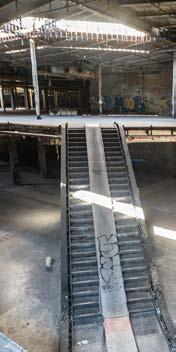
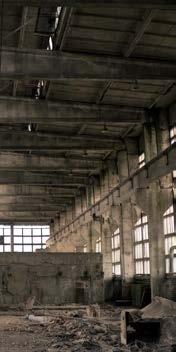
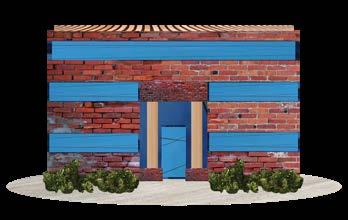
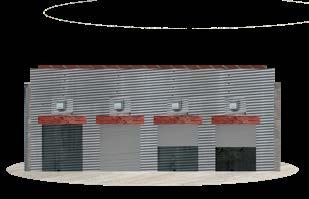
Images Left to Right: Abandoned office, retail, and warehouse interiors. Source: Adobe Stock
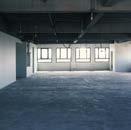
Office:

The oldest unrenovated stock dominates the exposure, concentrated in major urban markets where regulatory and functional obsolescence compound simultaneously.
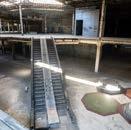
Retail:

Permanent structural decline in consumer demand, not cyclical vacancy, defines the stranding condition here.
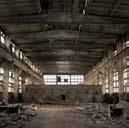
Industrial & Logistics:
Physical suitability for transformation is high, but location is the determining variable.
Across all three, the critical variable is not simply age, but the combination of age, unrenovated condition, and compounding regulatory pressure (Endeavor Interviews, 2025). A building constructed in 1975 that has never been renovated carries a fundamentally different risk profile from one of the same age that has been progressively upgraded (Endeavor Interviews, 2025). The unrenovated building faces simultaneous pressure from energy noncompliance, deferred maintenance, and functional obsolescence. The upgraded one may already have resolved the most consequential of those pressures.
2.1.1 Offices
Adaptive transformation demand in the office sector is concentrated in major urban markets across Europe and North America, where aging office stock faces compounding regulatory and functional obsolescence. This segment carries the highest concentration of stranding risk relative to its size, driven by the interaction of market obsolescence, ESG non-compliance, and the structural shift in occupier demand established in Chapter 1.
In the European Union...
offices account for approximately 23% (BPIE, 2015) of the roughly 12 million non-residential buildings (RICS, 2020), producing an indicative stock of around 2.76 million office buildings. Of these unrenovated offices past their service life accounts for approximately 2.5 million buildings (RICS, 2020), equal to the 91% of the entire office sector.
In North America...
the office stock totals approximately 970,000 buildings, of which around 605,000 (62%) were built between 1970 and 2009 (EIA, 2022), representing the peak of office development. Around (7%) were constructed after 2010, indicating a predominantly middle-aged stock (EIA, 2022). The estimated renovation exposure is substantial: More than half of the stock may require modernization to meet current standards and performance expectations (EIA, 2022).
The speculative office buildings built between the 1960s and 1980s (Endeavour Interviews, 2025) make up the largest unrenovated share of both North American and European geographies. These building types tend to share a set of characteristics that shape transformation potential. Deep floor plates with central service cores create challenges for natural light and emergency egress that are expensive to resolve (Interviewee 3, Real Estate Advisor, Interviewee 22, Engineering Firm Founder, Endeavor Interviews, 2025). Facades from this period typically lack thermal insulation and fail current airtightness standards (Interviewee 22, Engineering Company Founder, Endeavor Interviews, 2025). Mechanical systems, generally designed for open-plan office use, are broadly incompatible with residential conversion and some must be replaced entirely (Interviewee 3, Real Estate Advisor, Endeavor Interviews, 2025). Certain hazardous materials, including asbestos in insulation, floor tiles, and ceiling systems are prevalent in buildings constructed
before 1985 (Interviewee 22, Engineering Firm Founder, Endeavor Interviews, 2025). Not all characteristic features work against transformation. High-specification steel-frame buildings from the 1980s and 1990s frequently offer generous ceiling heights and enough structural capacity to support additional floors or significant internal reorganization (Interviewee 3, Real Estate Advisor, Endeavor Interviews, 2025). Identifying which profile a given building belongs to is one of the primary things an early-stage assessment can establish (Interviewee 22, Engineering Firm Founder, Endeavor Interviews, 2025). While it is valuable to segment buildings according to typology and era of construction, The difference in transformation cost between a favourble and an unfavorable building of the same era can be substantial, and it is not always discernable from aggregate data alone. Research into what key indicators are accurately predictive is the subject of research currently being undertaken by our studios.
2.1.1 Offices
Typical Characteristics of Office Buildings by Era
(PRE-WW2)
Spatial Layout
Structure
Narrower floor plates and wings. Configuration is often conducive to residential layouts.
Heavy masonry construction. Likely Unreinforced Masonry (URM). Some low-rise wood frames.
Deep floor plates with central service cores. Large undivided floor plates. High car dependency. Very large floor ft.). Generous ceiling cores.
Non-ductile concrete frames (1950–1975). Material-poor structures optimized for cost (FEMA, 2015). Steel moment frames (pre-1994).
Services
Materials
Operable windows providing natural ventilation. Varied, non-standardized systems.
Traditional, well-understood materials like stone and brick (EIA, 2022). Low regulatory standardization.
Key Analytical Insights
These are often considered the best candidates for residential conversion because their narrower footprints and operable windows easily meet modern daylight and ventilation requirements.
High-specification
Post-tensioned capacity for floor
Forced-air office Heating, Ventilation, and Air Conditioning (HVAC) (usually incompatible with residential) (European Environment Agency, 2013). Standardized mechanical systems. Aging systems (MEP) full replacement. compared to residential
High likelihood of hazardous materials: asbestos, Polychlorinated Biphenyls (PCBs) lead paint, and heavy metals. Standardized industrial mass.
Failing building modern thermal Transition away
This era carries the highest risk for hazardous materials such as asbestos and PCB. Structures from this period, particularly non-ductile concrete frames, are high-risk in seismic zones and can carry structural retrofit costs of 40–70% of the building’s replacement value. These buildings high specifications, frames and generous heights that allow reconfiguration
Table 4: Primary structural, material, and regulatory risk signals associated with each building age band, synthesized from construction-era characteristics.
floor plates (often 20,000+ sq. ceiling heights. Side or central
POST-2000
Optimized for efficiency; often includes slender tower styles (e.g., Vancouver style). Optimized for specific uses like tech or life sciences.
High-specification steel-frame buildings. concrete slabs. Redundant floor additions.
(MEP) often requiring replacement. Often “over-elevated” residential needs.
building skins/facades that lack thermal insulation (RICS, 2018). away from hazardous materials.
Code-compliant structures with lower seismic risk. Use of mass timber in some recent additions.
Modern, energy-efficient systems. Integrated smart-building data and digital controls.
Modern, low-risk materials. Focus on highperformance envelopes, though some early 2000s stock still relies on gas boilers.
buildings are often “over-built” with specifications, offering robust steel generous floor-to-ceiling allow for significant internal reconfiguration or adding extra floors.
While technically superior in terms of energy code and seismic compliance, these buildings are often highly optimized, leaving less “redundant” material for heavy-load transformations compared to 1980s stock. characteristics.
2.1.2 Retail
Retail adaptive transformation demand is concentrated in markets where aging retail assets face permanent market decline driven by the shift of consumer spending toward e-commerce and the bifurcation between prime and secondary retail formats described in Chapter 1.

In the European Union...
retail and wholesale use accounts for approximately 28% of the non-residential stock, producing an estimated stock of around 3.36 million retail units (BPIE, 2015), with a large share delivered between 1945 and 2000 (European Commission, BSO). An estimated 3.06 million retail properties have not undergone renovation (RICS, 2020).
In North America...
the total commercial building stock recorded by CBECS stands at approximately 517,000 buildings, of which 372,000 (72%) were built after 1960 and before 2009, and 52,000 (10%) after 2010 (EIA, 2022). The percentage of unrenovated buildings in the retail sector is estimated at around 55%, totaling 286,745 buildings (EIA, 2022).
Between 1965 and 1995, large-format retail, including regional malls and big-box anchored centers, became a dominant retail typology (Linneman, 2003). They were designed around assumptions that no longer hold today: high car dependency, large undivided floor plates, minimal natural light, and a single commercial use. These physical qualities, which made large-format retail efficient in its original use, create the same conversion challenges as deep-plan office stock, but typically without the central locations that make office conversion financially competitive.
2.1.3 Industrial & Logistics
The industrial and logistics sector is more asset-specific than the office or retail sectors. The most exposed buildings are pre-2000 warehouses in secondary logistics corridors or suburban distribution clusters outside prime infill logistics hubs, where obsolete specifications make them uncompetitive against modern facilities without significant investment (CBRE, 2023).
In the European Union...
warehouses account for 11% of the commercial share of the non-residential stock, yielding an estimated stock of approximately 1.32 million buildings (BPIE, 2015), with a potential unrenovated stock of around 1.20 million buildings (RICS, 2020).
In North America...
the latest 2022 CBECS report shows a total of 1 million warehouses and storage facilities, with intense construction activity recorded between 1970 and 2018, equal to 785,000 buildings (EIA, 2022). Approximately 70% of the total warehouse inventory, meaning 554,614 buildings, have undergone no renovation (EIA, 2022).
Industrial stock occupies a distinctive position in this analysis. The physical characteristics that make warehouses uncompetitive in their original use, including large column-free spans, generous ceiling heights, and robust slab construction, are often exactly the qualities that make transformation most viable. The determining factor in this segment is therefore location rather than physical condition. Warehouses in secondary logistics corridors frequently sit outside the pedestrian catchments and transit connections that residential, hospitality, or mixed-use programs require. Where location is adequate, industrial buildings can present some of the most favorable physical conditions for the transformation of any property type. Where it is not, physical quality alone cannot compensate.
2.1.4 Age Profile
Across all three property types, building age can function as a diagnostic tool.
By identifying standardized patterns of construction and material use relative to a building’s era, it is possible to make reliable inferences about the structural system, facade technology, mechanical systems, and the likelihood of hazardous materials before any site investigation has been conducted.
This matters because it changes what early-stage assessment can deliver. Rather than treating each building as an unknown quantity requiring expensive investigation before any go/no-go decision can be reached, age-based pattern recognition allows a structured screening process to front-load the most consequential red flags, distinguishing buildings suited to straightforward transformation from those whose deferred maintenance or structural profile makes demolition the more realistic outcome. The information needed to make that distinction is largely available at the desk-study stage, and it is one of the primary inputs a structured early-stage assessment can systematically apply across a portfolio of assets rather than a single pre-selected candidate.
Age Bands as Risk Signals
Primary Risk Synthesis
Seismic & Systems:
High vulnerability of Unreinforced Masonry (URM) in seismic zones and total obsolescence of varied mechanical systems, though narrow floor plates reduce layout risk.
Toxins & Structure: Peak remediation risk for asbestos and PCB; “grotesquely expensive” seismic retrofits for non-ductile concrete (40–70% of replacement value); slabs often fail modern fire ratings.
Envelope & Flexibility: Failing 80s building skins requiring costly replacement; posttensioned slabs making utility drilling high-risk; moderate structural risk in pre1994 steel frames.
Regulatory & Capacity: Low physical hazard, but high regulatory risk from carbon caps (reliance on gas boilers); highly optimized designs often lack the redundant structural capacity for heavyload additions.
Table 5: Building age acts as a diagnostic indicator, linking development eras to characteristic materials, systems, and risk profiles that can inform early-stage screening.
By identifying standardized patterns of construction and material use relative to a building’s era, owners and developers can front-load due diligence to address hazmat remediation, structural reinforcement, and energy compliance before they become prohibitive costs. Ultimately, leveraging this historical and physical data allows for rapid feasibility assessments that can distinguish between buildings suited for gentle transformation and those whose deferred maintenance has rendered them candidates for demolition.
Building materiality correlates strongly with building regulations and construction trends. Buildings in Europe built between 1955 and 1980, for example, are candidates for hazardous materials such as PCB, asbestos, and heavy metals, but exhibit increasing correlation in material and structural methods (European Environment Agency, 2013). Buildings constructed before 1955 generally exhibit more varied risk profiles, reflecting less standardized construction methods, materials, and regulatory oversight across regions and building types. Regional engineering trends also play a role, especially regarding zoning, seismic, or fire regulations that have historically influenced construction methods.
Deferred maintenance represents a physical risk that escalates both costs and safety concerns the longer a building remains underutilized (Interviewee 15, Real Estate Advisor - Public Institution, Endeavor Interviews, 2025). Buildings that have been neglected for 30 to 40 years undergo physical deterioration (Interviewee 15, Real Estate Advisor - Public Institution, Endeavor Interviews, 2025), often reaching a point where the structure itself detracts from the value of the underlying land. Common attempts to mothball a property frequently fail over long timelines as water intrusion, mold, and burst pipes further compromise the building’s integrity (Interviewee 15, Real Estate AdvisorPublic Institution, Endeavor Interviews, 2025).
That capacity for systematic, portfolio-scale application is what the following sections establish the conditions for: the geographic markets where transformation demand is sufficient to act on that screening, the ownership structures most motivated to commission it, and the regulatory pressures that are sharpening the urgency to do so.
Figure 8: Estimated years to major redevelopment or demolition pressure by decade of construction, for post-war office buildings and shopping malls
Geographical Concentration of Stranding Risk
Adaptive transformation demand concentrates in cities characterized by high population turnover, strong capital attraction, active regulatory environments, and sufficient depth of occupier demand to absorb transformed space. These conditions are most reliably present in tier-one and tier-two cities across Europe and North America (Interviewee 11, Real Estate Researcher, Endeavor Interviews, 2025).
Commercial obsolescence in European cities follows more varied patterns than in North America, differing across both building typologies and demand profiles. In cities shaped by extensive postwar reconstruction, such as Frankfurt, Brussels, and Rotterdam, a substantial proportion of the building stock is now at risk of being stranded. Priority markets are identified on the basis of three converging criteria: elevated stranded asset risk, the presence of regulatory incentives for intervention, and access to reliable urban and building-level data.
Figure 9: Priority markets for adaptive transformation across Europe evaluated against four converging criteria
U.S. Market
Within the United States, the cities operating binding operational carbon caps, New York under Local Law 97, Boston under BERDO, and Washington DC under BEPS, carry an additional layer of financial pressure on building owners that compounds the motivation to act. These markets represent the most immediate nearterm targets, because the combination of stranding risk and regulatory cost pressure creates the conditions under which a structured assessment is most likely to change the outcome.
Canadian Market
Within Canada, Toronto, Calgary, and Edmonton represent the most immediate near-term opportunities, each combining aging commercial stock with active municipal decarbonization agendas and sustained occupier demand. In Calgary and Edmonton, structural contraction in the energy sector has produced concentrated downtown vacancy where conventional repositioning is no longer viable, prompting municipal governments to actively support conversion as an urban recovery strategy.
New York Boston
Chicago
Toronto
Calgar y
Edmonton
Figure 10: Priority markets for adaptive transformation across the U.S. evaluated against four converging criteria
Figure 11: Priority markets for adaptive transformation across Canada evaluated against four converging criteria
Who is Motivated to Act
Demand generation should be directed toward large portfolio holders and clustered property owners, as these parties offer the scale, the decision-making structures, and the financial resources most conducive to systematic adaptive transformation assessment. A building owner managing a single distressed asset faces the same analytical problem as one managing a portfolio of 50, but only the latter has both the incentive and the organizational capacity to engage with a structured assessment service at scale.
Four ownership profiles define the realistic client base.
CLIENT TYPE PROFILE
Institutional Investors Pension funds, insurance companies, REITs, and large private equity funds
Lenders and Banks
Public Authorities
Confronted with non-performing loans and refinancing distress
ADAPTIVE TRANSFORMATION DRIVER
Stranded assets create measurable reporting exposure; ESG obligations are increasingly difficult to reconcile with prolonged vacancy or deferred maintenance
An early-stage assessment identifies a credible transformation pathway before default, offering a structured alternative to a discounted sale
Opportunistic Developers
Table 6:
ownership
Cities experiencing vacancy concentration and cascading impacts of stranded assets
Developers specialized in transformation who seek to acquire stranded assets at significant discounts
Where public co-financing or regulatory support can be assembled, targeted intervention can activate private capital that would otherwise default to demolition or vacancy.
Deal-specific engagement sensitive to acquisition price; most active in markets where institutional owners have already decided to exit
motivated to commission adaptive transformation assessment, and the primary driver behind each.
Four
profiles
This page intentionally left blank.
2.3 Who is Motivated to Act?
Who owns the property? Type of pressure
Lenders and Banks
Institutional Investors
Opportunisitic Developers
Public Authorities
Non-performing loan
Time pressure
ESG reporting gap
Vacancy compounds exposure
Reinforcing closing Discounted acquisition
Owner decided to exit Vacancy concentration
Cascading urban impact
Deal-driven Urban pressure
Figure 12: How ownership type and pressure source determine which party manages a distressed asset,
Who deals with distressed assets?
How often adaptive transformation can be assessed by owners?
Direct ownership: who is the cycle of “buy and sell”
Indirect ownership: who will receive or acquired the distressed assets if business fails
to assess adaptive transformation.
Note:
The most actionable opportunities address non-performing loan exposure in tier-one and tier-two markets identified in section 3.2 and the property type and age profiles identified in section 3.1. This combination defines the realistic pipeline that a structured early-stage assessment is most positioned to serve.
Regulatory Pressures
The regulatory frameworks shaping building performance obligations across Europe and North America are examined in detail in Chapter 1 (section 1.2.5). Buildings that cannot demonstrate a credible path to meeting current energy performance standards face growing difficulty attracting financing, tenants, and buyers.
The same pressure that threatens the viability of existing buildings can, under the right conditions, become the primary financial justification for their transformation. The scale of non-compliance at the city level is examined in this chapter, and what this means for the near-term pipeline of motivated sellers.
European Union
Across the European Union, the Energy Performance of Buildings Directive sets binding national targets for improving the worst-performing building stock, with key compliance thresholds falling in 2030 and 2033 (EPBD, 2024/1275). These obligations are triggered at the points when buildings change hands or are brought back to market, making them directly relevant to the end-of-marketlife decisions this research addresses.
Across the EU, an estimated 75% of the existing building stock is considered energy inefficient (European Commission, 2020), and the renovation rate remains well below what is needed to meet the EPBD targets. In practical terms, this means that a large share of the secondary office and retail stock identified in section 3.1 is likely to face compliance obligations precisely at the moment owners are attempting to sell, refinance, or reactivate a stranded asset.
For institutional owners in Northern European markets, where ESG reporting obligations are most embedded in investment mandates, this pressure is already being felt (ECB, 2024; OECD, 2025). In Southern European markets, where enforcement has historically been less consistent, the trajectory is toward tightening, and the gap between current stock performance and required standards is wider (Birlan et al., 2025; UBE, 2026).
North America
Buildings facing carbon compliance gaps in key North American cities are simultaneously vacant and financially distressed—creating a narrowing, time-window for viable solutions.
In the three U.S. cities operating binding operational carbon caps, the share of covered buildings currently in non-compliance is substantial. For institutional owners already managing underperforming assets or non-performing loan exposure, the addition of regulatory cost pressure compounds the motivation to act, whether through disposal, recapitalization, or transformation (EPBD, 2024/1275). These figures are not simply a measure of regulatory risk. They are a measure of how many buildings, in identifiable markets, are simultaneously stranded and under escalating financial pressure to resolve that condition. That combination defines some of the most immediately actionable opportunities within the pipeline identified in this chapter.
In Canada, the same dynamic is taking shape across Vancouver (City of Vancouver, n.d) and Toronto (City of Toronto, 2026), where municipal decarbonization frameworks are creating compliance obligations for large existing buildings that existing owners are not uniformly positioned to meet. The share of covered commercial stock currently failing to meet applicable benchmarking thresholds or facing near-term equipment replacement requirements is significant in both cities. For owners of underperforming office assets in downtown Toronto, and for institutional holders of the concentrated vacancy in Calgary (City of Calgary, 2026) and Edmonton (Chai, 2023), regulatory pressure adds a further and time-bound incentive to act.
Canadian markets differ from their U.S. counterparts in that the compliance pressure is newer and the penalty structures are still maturing, but the trend is the same: Buildings that cannot demonstrate a credible adaptation pathway face a narrowing window before regulatory cost compounds an already deteriorating financial position.
Summary
The market opportunity for adaptive transformation is large in aggregate but concentrated in practice. The figures in this chapter describe buildings at risk, not confirmed stranded assets; the realistic near-term pipeline is considerably narrower.
Primary targets are secondary office assets, aging retail centers, and industrial complexes in tier-one and tier-two cities across Europe and North America in locations where conventional repositioning is no longer viable. This segment is characterized by mid-aged, unrenovated buildings encumbered by non-performing loans. These assets combine the highest stranding risk with the most financially motivated ownership base.
Where binding carbon compliance is already in force, regulatory pressure compounds urgency. Buildings that are simultaneously stranded and facing escalating non-compliance penalties represent the most immediately actionable portion of the pipeline.
Across all three segments, the core problem is methodological: Transformation is excluded before it is evaluated, not after. The scale of this opportunity is therefore not simply a count of buildings at risk; it is a measure of how much value current practice leaves unrealized. What a structured early-stage assessment must deliver to close that gap is the subject of Chapter 3.
→ Chapter 3
Adaptive Transformation Assessment
Adaptive Transformation Assessment
Chapters 1 and 2 established that a growing population of commercially stranded buildings remains excluded from adaptive transformation evaluation, and that the market for their transformation is large and concentrated in identifiable segments. The question that follows is not whether demand for reuse exists, but why the buildings most exposed to stranding risk remain the least likely to receive a structured assessment of their transformation potential.
This chapter examines why that exclusion persists, assesses the barriers and drivers shaping reuse evaluability across financial, regulatory, and technical dimensions, and defines what a structured early-stage assessment must deliver to make reuse consistently evaluable alongside demolition and mothballing. The chapter draws on 28 semi-structured interviews with key stakeholders across real estate investment, architecture, engineering, and public authorities in Europe and North America, validated against industry reports and existing assessment literature.
What You’ll Find in Chapter 3
This chapter proceeds in five parts:
3.1: Interview Findings
3.2 The Evaluation Gap: Barriers and Drivers
3.3: What a Structured Early Stage Assessment Must Deliver
Interview Findings
Research Methodology and Interview Cohort
The primary research draws on 28 semi-structured interviews conducted with key stakeholders across Europe and North America between March and June 2025. Interviewees were drawn from three professional groups: architecture and engineering, government and public sector, and real estate development and property management. The full interviewee list is provided in the appendix.
The interviews proceeded in three stages.
3 2 1
Stage 1: Decision Priorities and Feasibility Orientation
Designed to reveal how different stakeholders prioritize financial, environmental, and social objectives when facing an end-of-marketlife decision, and how those priorities shape their approach to feasibility assessment.
Stage 2: Drivers and Impediments across Professional Dimensions
Focused on the drivers and impediments of adaptive transformation across financial, regulatory, technical, urban, and social dimensions, surfacing the diverse systems of prioritization across professional fields.
Stage 3: Assessment Limitations and Conditions for Scalability
Addressed the most significant limitations practitioners encounter in conducting feasibility assessments for adaptive transformation, and explored the methodological, technical, and regulatory changes they identify as necessary to make reuse a more consistently assessable and economically competitive option within standard appraisal frameworks.
Note:
Interview responses were analyzed using semantic clustering, yielding eight distinct driver and eight distinct impediment categories across the full cohort. The full distribution of driver and impediment categories with frequency counts is provided in the appendix. The sections that follow report the primary findings from that analysis.
This page intentionally left blank.
3.1.1 Drivers and Impediments: Structure and Asymmetry
The interview findings reveal an asymmetric picture. Drivers of adaptive transformation are multiple, variable, and highly context-dependent. Impediments are more consistent: Regardless of professional background or geography, respondents identify the same cluster of financial concerns as the primary reason reuse fails to compete with demolition at the decision moment. This asymmetry matters because it indicates where a systematic solution is most achievable. Consistent impediments can, in principle, be systematically addressed.
Drivers operate on two levels. The first concerns the broader context: Whether market conditions, location, and the regulatory environment create conditions under which reuse is plausibly viable before any building-specific investigation begins. The second concerns the building itself: its spatial configuration, structural condition, material integrity, and architectural character. Both levels must be present for reuse to be actionable. A supportive regulatory environment cannot compensate for a building whose floor plate or structure makes conversion technically or financially unviable. Equally, a building with strong spatial qualities cannot overcome a location where demand for any viable program is too thin to support the investment required. Where demand for an existing program is insufficient, assessment at the urban scale can reveal higher demand for an alternative use, as locational needs vary significantly across program types: Housing for large families, student accommodation, and life sciences, for instance, each draws on different urban infrastructures and catchments.
Financial uncertainty is the dominant impediment across all respondent groups. Unforeseen costs, unpredictable revenues, complex capital structures, and the absence of reliable early-stage cost data are consistently identified as the primary reasons reuse loses out to demolition before a structured evaluation is ever completed. Regulatory friction, slow permitting, jurisdictional inconsistency, and the absence of conversion-specific approval pathways are the second-most-cited impediment category, but most respondents treat it as a financial problem rather than a regulatory one: It extends timelines and compounds cost uncertainty rather than prohibiting transformation outright.
The value of location is characteristically correlated to the spatial use case. When demand for an existing program is insufficient, an urban-scale assessment may reveal higher demand for an alternative program. This might be exemplified in the case of housing demand, where large families and student accommodation may have characteristic differences in locational needs and urban infrastructure.
Adaptive Transformation Drivers Adaptive Transformation Barriers
agreement
agreement
agreement
Figure 13: Semantic clustering of interview responses into driver and barrier categories for adaptive transformation, by relative level of respondent agreement.
3.1.2 Private and Public Actors: Divergent Priority Structures
The most consistent divergence in the interview cohort is between private and public respondents. The two groups are not simply weighing the same factors differently; they are optimizing for fundamentally different outcomes.
Private actors
Typically, institutional investors, lenders, and developers prioritize financial risk and return predictability. At the point of an end-of-market-life decision, the dominant question is whether the numbers work within a timeline and capital structure that can be defended to stakeholders.
Public actors
Municipalities, planning authorities, and public development bodies operate with a different set of priorities. Urban continuity, social consequence, and the cascading effects of vacancy on surrounding neighborhoods carry real weight in their assessment, even when the private financial case is marginal. For public respondents, adaptive transformation is as much a planning and governance instrument as a development strategy, and their openness to reuse persists where a viable structure for public co-financing or regulatory support can be assembled. The practical implication is that public actors function more consistently as enablers of reuse than as clients in the conventional sense.
This distinction directly shapes how an early-stage assessment must be positioned: toward private actors as a tool for converting cost uncertainty into a quantifiable input to the investment decision, and toward public actors as a tool for identifying where targeted support can activate private capital that would otherwise default to demolition or vacancy.
Geographic Variation
Geographic variation in the findings runs along two axes: the regulatory environment and the baseline conditions under which reuse is treated as a realistic option.
European Union
Within Europe, ESG obligations and the embodied carbon case for retaining existing structures over demolition feature more prominently as drivers than in North America, consistent with the binding character of EU regulatory frameworks and their integration into institutional investment mandates. The most significant divergence within Europe is between Northern European respondents and those from Italy and Southern Europe. Northern European practitioners, Danish, Dutch, and German, approach reuse pragmatically, identifying specific barriers and discussing how they might be resolved. Southern European and Italian respondents are more structurally skeptical, not because they reject reuse as a concept, but because the enabling conditions that Northern European practitioners treat as a given functioning approval processes, accessible data, and consistent regulatory pathways are frequently absent or unreliable in their operating environments.
North America
In North America, financial incentives tax abatements, impact fee waivers, and tax increment financing function as more consistent conversion drivers than in Europe, reflecting the relative maturity of U.S. incentive frameworks. In Canada, municipal decarbonization obligations and concentrated office vacancy in Calgary and Edmonton are the primary motivators, with publicsector appetite for conversion exceeding most U.S. markets outside those with binding operational carbon caps. Regulatory fragmentation remains a more acute impediment in the U.S., where approval conditions vary significantly between adjacent jurisdictions.
The evaluation gap is therefore not uniform. It is shaped as much by the regulatory and institutional environment in which a building sits as by its physical or financial characteristics. Any assessment framework must be calibrated to account for this variation rather than assuming a consistent baseline across geographies.
3.1.3 Dominant Interviewee Sentiments
Across the interviews, practitioners broadly regard adaptive transformation as a necessary and often desirable response to functional obsolescence, social need, and environmental urgency.
The dominant sentiment is one of pragmatic optimism: technical challenges are generally seen as solvable, and many interviewees describe transformation as shifting from a niche consideration into a serious business model in transitrich urban locations where existing fabric and embedded infrastructure create value that standard feasibility appraisals tend to undercount.
The consistent qualification is that viability depends on a narrow set of conditions aligning, and that financial uncertainty, fragmented regulation, and slow approval processes remain the primary reasons reuse loses out to demolition in practice.
“Investors
run away from these procedures.”
― Interviewee 17, Public Authority, Endeavor Interviews, 2025
Central Finding
The
central finding from the interviews concerns not the nature of the barriers but the point in the process at which they operate.
Early decisions on whether to explore transformation are made quickly, based on a small number of available indicators, and precede any involvement from architects, engineers, or technical advisors.
Buildings that would require a more structured investigation to reveal their transformation potential are eliminated before that investigation is ever initiated. The consequence is that adaptive transformation is not rejected after evaluation. It is excluded before evaluation begins. Only buildings already expected to succeed on a handful of visible criteria receive structured assessment, perpetuating the default exclusion of the secondary stock.
“Institutional investors, typically have no design or development sense and don’t have the skill set nor the ability to reimagine what that building could be.”
― Interviewee 28, Real Estate Consultant, Endeavor Interviews, 2025
The Evaluation Gap: Barriers and Drivers
The exclusion of adaptive transformation from early-stage asset review is not the result of a single barrier. It is produced by the interaction of three compounding conditions:
Stage 1 Stage 2
The financial unpredictability of transformation costs
A regulatory environment designed for new construction rather than conversion
Stage 3
The absence of assessment tools capable of handling reuse complexity within investment decision timelines
Note:
Each condition reinforces the others. Together, they produce a decision environment in which demolition wins by default, not because it has been shown to be superior, but because adaptive transformation has not been given the conditions under which it could be credibly evaluated. The sections that follow examine each condition in turn before closing with an analysis of the drivers that determine when reuse becomes viable once those conditions are sufficiently resolved.
Figure 14: Transformation options are often disregarded due to under-analyzed risk factors rather than as a bottom-up calculation of hard costs.
3.2.1 Financial Barriers: The Unpredictability of Transformation Costs
Transformation costs are the most consistently cited impediment across all respondent groups, and the least systematically documented at the early due diligence stage. Unlike ground-up construction, where cost benchmarks are well established and variances are manageable within standard contingency allowances, conversion projects carry a layered cost structure in which compliance-triggered upgrades interact with building-specific conditions in ways that resist standardization. A building’s construction era, structural system, geographic location, and regulatory jurisdiction each introduce cost variables that cannot be resolved without investigation, and that investigation itself carries a cost that most asset reviews are unwilling to absorb before an initial go/no-go decision has been reached. For greater detail, see the appendices regarding cost and finance (Appendix 1).
The result is a methodological dilemma: The information needed to price a conversion accurately requires a level of due diligence that the investment timeline does not allow before the decision is made. In the absence of that information, cost uncertainty is treated as cost risk, and cost risk tips the balance toward the option with the most predictable outcome.
There are five primary cost analysis categories for the early assessment stage.
01. Energy Code Compliance
02. Hazardous Material Management
03. Accessibility Compliance
04. Egress Reconfiguration
05. Seismic Upgrade
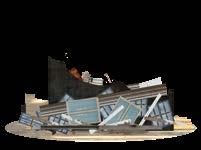

01. Energy Code Compliance
Costs are driven by two variables: the stringency of the applicable regulatory standard and the existing building’s baseline energy performance. Where facade and mechanical replacement are already within scope, meeting energy standards adds little marginal cost (International Energy Agency, 2021). Where they are not, costs range from approximately $25–$35 per square foot for a shallow retrofit (JLL, 2023; Urban Land Institute, 2023) to $40–$200 per square foot for a deep energy retrofit (Rocky Mountain Institute, 2019; Urban Land Institute, 2023) encompassing full envelope upgrade, HVAC replacement, and electrification. In cities with binding operational carbon caps, near-term compliance represents a materially higher burden than in markets without mandatory performance standards (New York City Mayor’s Office, 2019; CRREM, 2022).
02. Hazardous Material Management
Costs are primarily a function of the construction era and the scope of physical intervention required. Buildings constructed before approximately 1985 are more likely to contain asbestos-containing materials in insulation, floor tiles, ceiling systems, and fireproofing (EPA,1985); lead paint in interior finishes; and, in some typologies, polychlorinated biphenyls (PCBs) in electrical equipment and caulking compounds (European Environment Agency, 2013; U.S. Environmental Protection Agency, 2023; World Health Organization, 2010). Where these materials are identified, costs are divided into two categories: abatement prior to or concurrent with construction, and ongoing encapsulation where full removal is not required by the conversion scope (RICS, 2018). Abatement costs are highly variable and difficult to estimate without an intrusive survey, ranging from modest sums for localized deposits to figures capable of materially affecting project viability where hazardous materials are present throughout the building fabric (RICS, 2018). The interaction with project scope is critical: A light-touch conversion that avoids disturbing existing fabric will trigger significantly lower remediation obligations than a full structural strip-out (RICS, 2018). At the early assessment stage, construction era and building type together provide the most reliable proxies for likely exposure, and a qualitative risk flag—low, medium, or high—is a more appropriate output than a point estimate until intrusive investigation has been completed (RICS, 2018).
3.2.1
03. Accessibility Compliance
Costs in the U.S. are triggered at the point of alteration and are often capped at 20% of total alteration cost (U.S. Department of Justice, 2010). The most consequential driver in multi-story conversions is elevator provision, ranging from approximately $100,000 to $300,000 per unit, and substantially higher where structural modification is required (RSMeans, 2023). Buildings constructed before 1992 with no prior accessibility upgrades face the highest exposure (U.S. Department of Justice, 2010). European frameworks set generally less costly requirements (European Commission, 2019).
04. Egress Reconfiguration
Costs arise when a change of use imposes requirements that the existing configuration cannot satisfy. The most consequential trigger in the U.S. is the two-stairwell requirement for residential buildings over three stories, currently the subject of active legislative reform in several states (International Code Council, 2021). Where a second stairwell must be inserted, costs range from approximately $150,000 to $500,000 per stairwell, depending on height and structural complexity (RSMeans, 2023), and fall most heavily on the side-core and central-core deep-plate buildings prevalent in the 1960s-1980s speculative office stock.
05. Seismic Upgrade
Costs are the most geographically variable and potentially most consequential. In primary European markets, seismic hazard is negligible (European Commission, 2021). In high-seismicity U.S. markets (San Francisco, Seattle, Los Angeles, and Portland), structural upgrade requirements are the compliance trigger most likely to render a project unviable at the outset (FEMA, 2020). Costs range from relatively contained sums for well-understood typologies to retrofit scopes estimated at 40–70% of building replacement value for non-ductile concrete frame buildings constructed between approximately 1950 and 1975 (FEMA, 2020; ATC, 2018).
Cost Uncertainty Ratio
Cost Impact Ratio
Seismic upgrade
Egress reconfiguration
Hazardous materials
Energy code compliance
Accessibility compliance
Key Drivers of Uncertainty
Seismic (rank 1): Hidden structural deficiencies only revealed post-demolition; jurisdiction-by-jurisdiction triggers (ASCE 7, NBCC); retrofit typology (base isolation vs. shear wall) varies wildly by building age. Cost range: $30-$200+ /sf (RSMeans; FEMA P-58).
Hazardous materials (rank 2): Asbestos, lead, and PCB extent unknown until sampling; remediation unit costs spike 3-10x if materials are in HVAC or structural fireproofing (EPA NESHAP; OSHA 1926.1101).
Egress (rank 3): Stair/corridor geometry conflicts with residential unit layouts; code path (IBC 2021 §1006-1029) varies with occupancy load calculation method and local amendments.
Accessibility (rank 4): ADA/AODA scope is established, but number of non-compliant elements depends on building vintage and prior upgrades (ADA Standards §206; Ontario Reg. 191/11).
Energy code (rank 5): ASHRAE 90.1/NECB benchmarks well-understood; EUI gap calculable from existing utility data before purchase. Scope uncertainty is lowest.
Impact Score (0-10)
Key Drivers of Cost Impact
Seismic (rank 1): Structural interventions can consume 1540% of total hard costs in high-seismicity zones; can trigger abandonment (FEMA P-58; ULI Adaptive Reuse Report 2023).
Egress (rank 2): Adding or relocating stairs typically costs $150-$400k per stairwell plus lost net rentable area often the single biggest yield-reduction factor in deep-floor-plate offices (IBC 2021; WBDG Adaptive Reuse)
Hazardous materials (rank 3): Full ACM abatement in a pre-1980 building can reach $5-$25/sf; PCBcontaminated caulk can double that in curtain-wall buildings (EPA; RSMeans Facilities Cost Data).
Energy code (rank 4): Envelope upgrades, mechanical/ electrical replacement, and glazing retrofits are costly but well-amortized and generate operating savings; NYC LL97 penalty avoidance adds a hard financial floor to scope (ASHRAE 90.1-2022; NRC NECB 2020).
Accessibility (rank 5): Scope is typically discrete and predictable elevator upgrades, ramp installation, signage, washroom retrofits. Lowest aggregate cost impact when building has functional vertical transport (ADA Standards 2010; Ontario Reg. 191/11).
Note:
Taken together, these five compliance cost categories explain why financial uncertainty operates as the dominant impediment across the interview cohort. They are not inherently unmanageable, but they are currently unquantified at the stage where they most need to be, leaving investors with no reliable basis for comparing transformation against demolition on financial terms.
Figure 15: Relative cost uncertainty and cost impact of the five primary compliance categories.
3.2.2 Regulatory Barriers: Frameworks Designed
for New Construction
Building codes, zoning frameworks, and energy performance standards are designed primarily for new construction.
―(International Code Council, 2021; European Commission, 2024).
When applied to conversion scenarios, they generate high cost and schedule uncertainty that compounds the financial barriers identified in the previous section (Bullen & Love, 2011; Heath, 2001).
Jurisdictional variability intensifies this: Approval conditions that are routine in one municipality may trigger costly dispensation processes in an adjacent one, and the absence of conversionspecific regulatory pathways remains a consistent gap across both European and U.S. markets (Pivo & Fisher, 2010; OECD, 2021). Slow, politicized approval processes extend timelines and compress returns, frequently tipping the balance toward demolition, not because transformation is prohibited, but because the time and cost of navigating approvals make it financially uncompetitive (Gyourko & Molloy, 2015; Cheshire & Hilber, 2008).
The same regulatory environment that creates friction can also function as a direct financial enabler, where jurisdictions move in the opposite direction. Policy incentives specific to adaptive transformation have expanded significantly across major U.S. cities in recent years (Urban Land Institute, 2023; CBRE, 2023). New York’s 35-year tax abatements, Washington,
D.C.’s Office-to-Anything program, San Francisco’s impact fee waivers, and Chicago’s Tax Increment Financing allocations are among the most consequential examples (New York City Department of Housing Preservation and Development, 2023; District of Columbia Office of the Deputy Mayor for Planning and Economic Development, 2023; City of San Francisco, 2023; City of Chicago, 2023). Equivalent instruments are emerging across Europe, including Permitted Development Rights in England, France’s 2025 conversion legislation, state-led transformation programs in the Netherlands, and municipal conversion support frameworks in Toronto and Vancouver (UK Government, 2021; Gouvernement Français, 2025; OECD, 2021; City of Toronto, 2023; City of Vancouver, 2023). For historic buildings, landmark status can restrict the scope of intervention but often unlocks fee relief and dedicated funding instruments that strengthen the overall financial case (Historic England, 2022; National Park Service, 2020). Early identification of applicable incentive structures can materially alter the feasibility picture, making regulatory mapping as much an opportunity-finding exercise as a risk assessment (Urban Land Institute, 2023).
3.2.3 Technical Barriers: Why Existing Methods Fall Short
Even where financial and regulatory conditions are sufficiently resolved to make transformation plausible, a third barrier operates independently: the absence of assessment tools capable of evaluating reuse across its full complexity within the timelines required for investment decisions.
Current adaptive transformation assessment draws on four established method categories. Each of these methods is mature and well-documented within its own discipline.
METHOD CATEGORY PRIMARY APPROACH
Structured Judgement Multi-criteria decision analysis (MCDA)
Environmental Comparison Whole-life carbon assessment (WLCA)
Weighing complex and competing assessment criteria
Embodied and operational carbon across building lifecycles
Financial Appraisal
Externality Monetization
Life-cycle costing and discounted cash flow (LCC/ DCF)
Carbon pricing, social return on investment (SROI), material residual value
The problem is not the quality of any individual method. These methods are rarely applied in combination, and are almost never applied before a candidate building has already been identified. Assessment is treated as a project-specific exercise directed at a pre-selected asset, rather than a portfolio-scale screening process capable of surfacing transformation potential across a broader building inventory. The effort and cost required to assemble a multi-dimensional feasibility picture
Long-term investment viability
Quantifying social, environmental, and material value beyond financial returns
across market, regulatory, technical, and financial dimensions currently exceeds what early-stage investment timelines can accommodate. Closing this gap is therefore not primarily a methodological challenge. It is a delivery challenge: making the existing body of assessment knowledge available faster, at lower cost, and across a wider population of assets than current practice allows.
3.2.4 Drivers: What Makes Reuse Viable When it Occurs
Understanding what makes adaptive transformation financially competitive when the three barriers above are sufficiently resolved is as important as understanding the barriers themselves, because it defines what a structured assessment must be able to demonstrate.
Acquisition Price
Stranded assets are frequently acquired at significant discounts relative to their replacement cost, thereby expanding the transformation budget available. Practitioners consistently identify acquisition price as one of the most decisive variables in determining whether a project is viable at all: A welllocated building acquired at a deep discount can absorb transformation costs that would render the same project unviable at a higher entry price.
Regulatory Headroom
As established in Chapter 1, local plan constraints and heritage designations can make transformation financially superior to demolition by preserving buildable area or use rights that a cleared site would not retain. Where regulatory constraints attach value to the existing structure rather than simply imposing costs on it, the building’s transformation potential becomes a measurable financial asset instead of a liability. This is the condition under which architectural expertise enters the financial model directly: By identifying and quantifying the value embedded in the regulatory position of the existing structure, early-stage assessment can reframe the investment case in terms that are legible to investors and lenders.
Design Quality as a RentPositioning Variable
Transformed buildings with distinctive spatial qualities, including generous ceiling heights, strong daylight access, and architectural character, consistently command measurable rent premiums over generic new construction in equivalent locations. Assessing those qualities early enables a more precise determination of the rental bracket and strengthens the overall valuation case, connecting design judgment directly to financial performance rather than treating it as a downstream consideration.
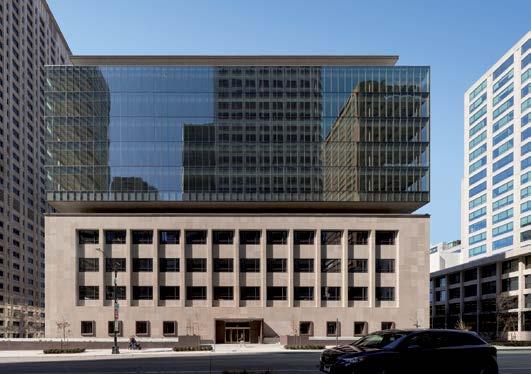
When these three conditions align, the financial case for transformation is compelling. It is competitive with demolition on the terms that investors and lenders use to make decisions. The task of a structured earlystage assessment is to determine, systematically and before significant due diligence cost has been incurred, whether a given asset presents the combination of conditions under which that case can be made.
Federal Reserve Bank: Seattle, Washington
A Framework for Early-Stage Assessment
Researchers at Perkins&Will and Schmidt Hammer Lassen developed a proprietary set of tools and methods for early-stage feasibility assessment, highlighting five capability areas (hereto referred to as “the Tool-set”).
The three barriers identified in Section 3.2 share a common consequence: Adaptive transformation is excluded from investment decision-making because the conditions for credibly evaluating it are not present at the time decisions are made. A structured early-stage assessment tool-set addresses this directly. Its purpose is not to replace the detailed technical studies and on-site investigations that precede a final investment decision, but to make transformation consistently evaluable alongside demolition and mothballing at the point where assetlevel decisions are first formulated.
The central methodological shift such a tool-set represents is from selective feasibility to systematic evaluability. Current practice assigns a program to a building and tests its viability, directing resources only at buildings already expected to succeed. A structured early-stage tool-set inverts this logic: It first establishes what the asset is worth as a transformation opportunity and identifies the most viable programs from that first evaluation. This reframing enables portfolio-scale application and breaks the self-reinforcing exclusionary dynamic identified in Section 3.1.
Scalability depends on delivery as much as methodology. The effort and cost required to assemble a multi-dimensional feasibility picture currently exceeds what early-stage investment timelines can accommodate, as established in 3.2.4. Data integration and automation address this directly: By systematically fetching and processing the market, regulatory, urban, and building data that currently requires manual assembly, the tool-set compresses the time and cost of earlystage assessment to a level compatible with portfolio-scale application. The datapoints themselves do not change; what changes is how quickly and consistently they can be made available. This creates space for expert judgment to operate where it matters most: in the interpretation of findings, the weighting of assessment criteria relative to the specific asset and client context, and the translation of analytical outputs into investment decisions. Rather than replacing professional expertise, the tool-set structures and accelerates the analytical work that precedes it.
Capability Areas
To deliver this shift, the tool-set must integrate five interdependent capability areas.

01. Context Assessment
The first capability responds to the finding that early decisions are currently made on too few visible indicators. Before any building-specific investigation is conducted, the tool-set establishes a structured view of the market, urban, and building conditions that define transformation potential and program viability for a given asset. This contextual layer does two things simultaneously: It identifies which use typologies are most viable for a given location, and it provides the foundation for all subsequent assessment steps. Without it, program selection remains assumption-driven rather than evidence-based.

02. Program Compliance
The second capability addresses the regulatory barriers identified in 3.2.2 directly. By assessing the regulatory standing of the existing building and the compliance implications of a proposed transformation, the tool-set converts regulatory uncertainty from a reason to defer evaluation into a quantifiable input to the decision. The assessment establishes the regulatory headroom of the asset, identifies make-or-break constraints and their associated cost and schedule implications early enough to be reflected in the financial model. Where applicable, incentive structures are identified at this stage, given their documented potential to materially alter the feasibility picture.
03. Risk Profiling
The third capability addresses the information deficit that leads to demolition as the default option for cost uncertainty. Early identification of material risks across structural, environmental, and regulatory dimensions reduces uncertainty as quickly as possible, supporting more accurate asset pricing and minimizing the likelihood of costly discoveries after an acquisition decision has been made. Where definitive assessment requires on-site investigation, a likelihood score is assigned to each risk factor, indicating which warrant priority follow-up and at what indicative cost.
Capability Areas

04. Design Option Modeling
The fourth capability is the integrating step of the tool-set: the point at which all prior analysis converges into a set of concrete, comparable, and financially grounded transformation propositions. Rather than testing a single pre-assigned program against building conditions, the tool-set generates and evaluates multiple scenarios, including less obvious program combinations and mixed-use strategies that more precisely reflect the building’s physical characteristics, regulatory position, and urban context. Each scenario is evaluated across the full feasibility spectrum, covering regulatory compliance, identified risks, and market drivers, culminating in a financial assessment with revenue projections. This positions design option modeling not as a creative exercise conducted after the investment decision has been made, but as the analytical instrument through which transformation value is surfaced and made legible to investors and lenders at the earliest possible stage.

05. Valuation
The final capability responds to the finding from 3.2.1 that cost uncertainty at the early stage is the primary reason reuse fails to compete with demolition. Rather than relying on early-stage cost estimates that practitioners consistently identify as unreliable at the decision moment, financial projections are expressed primarily as an available transformation budget: Given achievable market rents, target net operating income, and prevailing yield expectations, the model determines what cost envelope the asset can support. Architectural quality, spatial character, and ESG credentials are treated as measurable variables that shift the asset’s position within the market pricing spectrum, rather than as qualitative considerations that fall outside the financial model. Viability thus rests on evidenced alternative-use demand, not on the residual value of a program the market has already left behind. Policy incentives are integrated where applicable, and sensitivity analysis is provided across key assumptions, enabling stakeholders to identify the conditions under which viability is most exposed to change.
The process culminates in a go/no-go recommendation on adaptive transformation, supported by ranked transformation pathways, comparative scenario evaluation, and financial viability benchmarks. Add: as part of a due-dilligence process to assess whether an alternative pathway to demolition may be feasible. The output is designed to ensure that the transformation is evaluated on comparable terms to demolition and mothballing at the moment when the choice between them is first made.
→ Chapter 4
Conclusions
Conclusions
This research identifies a structural condition in which a growing population of commercially viable buildings has become financially obsolete in their existing use while remaining physically intact. The findings across the three research questions converge on a common finding: The gap between the scale of the adaptive transformation opportunity and the rate at which it is acted upon is not a function of insufficient technical knowledge or absent demand. It is a function of how early-stage investment decisions are structured and what information is available at the moment those decisions are made.
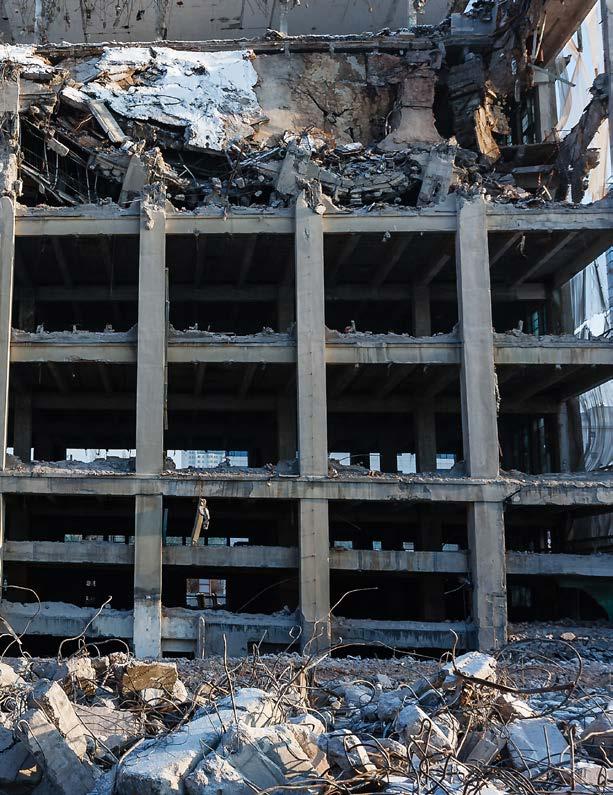
The paper addressed three primary research questions with the following summary of outcomes:
RQ1:
Why are an increasing number of commercial buildings becoming financially stranded, and why do current market responses fail to resolve the condition?
RQ2:
How large is the pool of stranded commercial assets across Europe and North America, and where does realistic demand for adaptive transformation concentrate?
RQ3:
What would a structured early-stage assessment approach need to deliver to make adaptive transformation consistently evaluable alongside demolition and mothballing?
Research Question 1
Why are an increasing number of commercial buildings becoming financially stranded, and why do current market responses fail to resolve the condition?
RQ1 established that financial stranding is structural rather than cyclical. The forces producing it are not independent variables. They operate in compounds and have emerged in response to one another. These forces include: shifts in spaceoccupancy behavior, macroeconomic and geopolitical instability, geographic polarization of investment, and
compliance-driven obsolescence and capital concentration (the flight to quality). The consequence is a building stock that conventional market responses, such as demolition and asset mothballing, do not resolve. Both strategies transfer or defer the condition; neither constitutes an evaluation of alternative use potential.
Figure 2:
Conceptual model illustrating how postpandemic macroeconomic and geopolitical instability reshapes investor behavior.
Research Question 2
How large is the pool of stranded commercial assets across Europe and North America, and where does realistic demand for adaptive transformation concentrate?
RQ2 mapped the scale and distribution of this asset population across European and North American markets. The transformable stock is large in aggregate and geographically concentrated in practice: secondary and unrenovated office, retail, and industrial buildings in tier-one and tier-two cities, frequently encumbered by non-performing loans and, in the most immediately actionable regulatory environments,
subject to binding operational carbon compliance obligations. The ownership structures most motivated to pursue transformation are identifiable. In cities where compliance pressure is most acute, the financial conditions already exist under which transformation can be more competitive than demolition. The opportunity is structurally present and structurally underaddressed.
Class B/C (Secondary)
Class A (Primary)
The bifurcation gap widens
Figure 3: Vacancy rates for Class A (primary) assets have remained low and stable while Class B/C (secondary) assets show a widening gap, illustrating market bifurcation between 2020 and 2026.
Research Question 3
What would a structured early-stage assessment approach need to deliver to make adaptive transformation consistently evaluable alongside demolition and mothballing?
RQ3 identified the mechanism by which this opportunity is systematically bypassed. Adaptive transformation is not routinely rejected following evaluation; it is excluded before evaluation begins. Early-stage asset decisions are made rapidly, based on a limited set of visible indicators, before engaging architects, engineers, or technical advisors. Buildings whose transformation potential would only become legible through structured investigation are eliminated before that investigation is initiated. Three compounding conditions produce this outcome: cost uncertainty specific to conversion projects, a regulatory framework designed for new construction, and the absence of assessment tools capable of handling conversion complexity within standard investment decision timelines. Together, these conditions produce a decision environment in which demolition proceeds by default, not because it has been demonstrated to be superior on financial, environmental, or urban terms, but because no credible alternative is placed alongside it at the decision point.
The structured early-stage assessment framework proposed in Chapter 3 is directed at this specific gap. Its function is not to substitute the detailed technical and financial appraisals that precede a final investment decision, but to make transformation consistently evaluable on comparable terms to demolition and asset retention, and at the point where asset-level decisions are first formulated.
The methodological shift this represents is from selective feasibility testing to systematic evaluability: establishing, across a portfolio of assets, which buildings present the combination of conditions under which a viable transformation case can be constructed. Three conditions are required for this shift to operate at scale: methodological integration of context assessment, regulatory compliance mapping, risk profiling, design option modeling, and financial valuation into a coherent deliverable; commercial viability sufficient to be absorbed into early-stage due diligence without extending investment timelines; and consistent engagement of architectural expertise at the point where transformation value is being established rather than after the financial case has been determined.
What This Means for Design
The findings in the report confirm that certain design qualities (expressed through spatial configuration, floor-to-ceiling heights, daylight access, and material character) function as measurable variables in financial performance. Transformed buildings with strong spatial qualities can be associated with revenue premiums and tested for sensitivity relative to generic new construction. The value embedded in architectural models can be made financially legible at the stage where it has the greatest influence on investment decisions.
The question of whether to retain or replace an existing building is addressed at the earliest stages of asset review. This study provides a structured basis for introducing design models and transformation protocols into that sequence. The scale of the opportunity is measurable, the methods required are available, and the asset conditions under which transformation value is highest are identifiable in advance. The remaining gap is one of professional practice, not of knowledge.
→ Appendix
Appendix
Appendix Items Include:
Appendix 1: Transformation Costs
Appendix 2: Sizing the Market, A Three Layer Framework
A2.1 Total Addressable Market (TOM)
A2.2 Serviceable Addressable Market (SAM)
A2.3 Serviceable Obtainable Market (SOM)
Appendix 3: Interviews and Interviewee Lists
A3.1 Interviewees
A3.2 Impediments and Drivers
A3.3: Notes on Risks
Appendix 1: Transformation Costs
Transformation costs represent the most consistent financial uncertainty across adaptive transformation assessments, yet they remain among the least systematically documented at the early due diligence stage. Unlike ground-up construction, where cost benchmarks are well established and variances are manageable within standard contingency allowances, conversion projects carry a layered cost structure in which compliance-triggered upgrades interact with building-specific conditions in ways that resist standardisation. A building’s construction era, structural system, geographic location, and regulatory jurisdiction each introduce cost variables that cannot be resolved without investigation, and that investigation itself carries a cost that most asset reviews are unwilling to absorb before a decision to proceed has been made.
The result is a structural catch: the information needed to price a conversion accurately is only obtainable through a level of due diligence that the investment timeline does not allow before an initial go/no-go decision is reached. In the absence of that information, cost uncertainty is treated as cost risk, and cost risk tips the balance toward the option with the most predictable outcome: demolition. Four compliance cost categories are the primary drivers of this uncertainty at the early assessment stage. The sections below examine each, drawing upon U.S. examples to illustrate how costs vary as a function of building type, construction era, and jurisdiction.
Transformation Costs Include:
01. Seismic Upgrade
02. Energy Code Compliance
03. ADA and Accessibility Compliance
04. Egress Reconfiguration
Seismic Upgrade
Seismic upgrade is the most geographically variable and potentially most consequential compliance cost in adaptive transformation. In primary EU office markets—Germany, France, the United Kingdom, the Netherlands, and Scandinavia— seismic hazard is negligible and can typically be excluded from early-stage cost modelling (OECD, 2021; European Commission, 2020).
In high-seismicity U.S. markets such as San Francisco, Seattle, Los Angeles, and Portland, compliance with seismic upgrade triggers is often the factor that renders a project unviable before any other assessment dimension has been evaluated (FEMA, 2015; U.S.GS, 2023). In moderate-seismicity U.S. markets—including Boston, Chicago, New York, and Washington DC—and in seismically active secondary European markets such as Italy, Greece, Portugal, and Romania, the trigger exists at lower intensity and cost, but cannot be excluded from early screening (OECD, 2021; Crowley et al., 2020).
Within high-seismicity U.S. markets, structural system type is the dominant cost driver and is strongly associated with construction era (FEMA, 2015). Unreinforced masonry (URM) buildings— predominantly pre-1940 in the U.S. and pre-1950s in Southern Europe—pose a high seismic risk and are the primary targets of mandatory retrofit ordinances in cities such as San Francisco and Portland (City and County of San Francisco, 2013; City of Portland, 2018).
Despite this, intervention costs can be relatively contained when seismic work is integrated into a broader renovation programme: targeted structural scope has been documented at under $7 per square foot, while total project costs exceed $40 per square foot (National Institute of Building Sciences, 2019). Standalone retrofit costs in mandatory programme contexts are substantially higher (FEMA, 2015).
Non-ductile concrete frame buildings constructed between approximately 1950 and 1975 carry the highest and most uncertain costs. Direct structural retrofit scope has been estimated at 40–70% of building replacement value, translating to
approximately $140–$245 per square foot in direct structural cost in primary U.S. metropolitan markets, and potentially exceeding $400 per square foot in total construction cost—thresholds that frequently render conversion unviable (FEMA, 2015; Applied Technology Council, 2018).
Post-tensioned concrete slabs from the 1970s to 1990s carry even less predictable costs and are treated by practitioners as high-risk assets requiring detailed structural investigation prior to financial modelling (SEAOC, 2017).
Steel moment frames from the pre-Northridge era (pre-1994) carry moderate retrofit costs due to connection vulnerabilities identified after the 1994 Northridge earthquake, while post-1994 systems carry significantly lower seismic risk due to updated design standards (FEMA, 2000).
Concrete shear wall buildings generally perform better and require lower retrofit investment than non-ductile concrete frames (FEMA, 2015).
Wood-frame construction, dominant in low-rise West Coast stock, presents seismic vulnerability primarily in soft-storey conditions, particularly at open ground floors; however, these risks are well understood and relatively cost-contained to address (City and County of San Francisco, 2013).
Post-1980 code-compliant buildings are substantially less exposed across all structural systems due to modern seismic design standards (ICC, 2021).
Seismic upgrade requirements for adaptive transformation vary significantly by jurisdiction and are not automatically triggered in all conversion scenarios. In California, for example, office-toresidential conversions do not necessarily trigger mandatory seismic upgrades unless structural alterations are undertaken, whereas in Portland, URM buildings are subject to mandatory retrofit above relatively low alteration thresholds (City of Portland, 2018). Jurisdiction-specific trigger conditions are, therefore a critical input in early-stage cost assessment in seismically active markets.
Energy Code Compliance
Energy code compliance costs are driven by two independent variables: the stringency of the applicable regulatory standard in the jurisdiction and the baseline energy performance of the existing building.
They are primarily determined by envelope condition, mechanical system vintage, and the extent to which the conversion scope already requires façade or MEP replacement (International Energy Agency, 2022; U.S. Department of Energy, 2021). Where façade and MEP replacement are already required, meeting energy standards adds limited marginal cost and should not be treated as a separate cost line in early-stage modelling (Rocky Mountain Institute, 2020).
A shallow retrofit—typically LED lighting upgrades, HVAC optimisation, and controls improvements without envelope intervention—translates to approximately $25–$35 per square foot in 2025 cost terms (U.S. Department of Energy, 2021; National Institute of Building Sciences, 2019). A deep energy retrofit encompassing advanced envelope upgrades, full HVAC replacement, and electrification has been estimated at $40–$200 per square foot in total construction cost, with wide variation depending on baseline building condition, system selection, and design parameters (International Energy Agency, 2022; Rocky Mountain Institute, 2020).
At portfolio scale, retrofit programmes can unlock economies of scale across procurement, mobilisation, and installation, reducing per-building costs below standalone project benchmarks (International Energy Agency, 2022).
In U.S. cities with binding operational carbon caps—such as Local Law 97 in New York City, Building Emissions Reduction and Disclosure Ordinance, and Building Energy Performance Standards—compliance with 2030 targets represents a materially higher cost burden compared to markets without mandatory performance standards (New York City Mayor’s Office of Sustainability, 2019; City of Boston, 2021; District of Columbia, 2021). The compliance timeline directly interacts with investment horizons, influencing project feasibility and capital allocation decisions (IEA, 2022).
In the European context, the Energy Performance of Buildings Directive establishes renovation requirements that create similar pressures. However, obligations are defined at the Member State level and implemented through national frameworks, resulting in variation in stringency, enforcement, and cost implications across countries (European Commission, 2023; Buildings Performance Institute Europe, 2020).
ADA and Accessibility Compliance
ADA compliance obligations in the U.S. are triggered at the point of alteration, which makes their cost profile highly dependent on project scope and building condition.
Under federal law, any alteration to a primary function area triggers path-of-travel upgrade obligations, capped at 20 percent of the total alteration cost of the primary function area (Americans with Disabilities Act of 1990; U.S. Department of Justice, 2010). State codes may impose stricter requirements above this federal baseline: in California, any project exceeding a construction cost threshold must comply with full path-of-travel requirements by default, which will apply to any meaningful conversion project (California Division of the State Architect, 2019).
The cost structure of ADA compliance in multi-storey conversions is dominated by two factors that do not scale linearly with floor area. The first is elevator provision: for buildings without a lift serving all occupied floors, installation costs range approximately $100,000 to $300,000 per unit, substantially more where structural modification is required to create a new shaft (RSMeans, 2023; U.S. General Services Administration, 2022). The second is the extent of pre-existing noncompliance: a building constructed pre1992 with no prior accessibility upgrades faces substantially higher costs than one that has been progressively updated (U.S. Department of Justice, 2010).
Note:
The EU equivalent framework, the European Accessibility Act, sets materially different and generally less costly requirements (European Commission, 2019). For portfolio screening purposes, ADA compliance should be flagged as a high cost only where elevator provision is absent in a multi-storey building, or where the building predates 1992 and has no recorded accessibility upgrades.
Egress Reconfiguration
Egress reconfiguration costs arise when a change of use from office to residential imposes egress requirements that the existing building configuration cannot meet.
The most consequential trigger in the U.S. context is the two-stairwell requirement under International Building Code Section 1006.3.4, which applies to residential buildings over three storeys (International Code Council, 2021). This requirement is unusual outside of North America. Countries across Western and Northern Europe permit single-stair construction well beyond three storeys; Italy allows single-stair buildings up to 80m, and Singapore allows them up to 60m (Smith & Mendoza, 2024). Single-stair codes have not attracted controversy in most countries outside the United States and Canada, though cross-country fire-death data remains too sparse to support fine-grained safety comparisons between single- and multistair buildings of the same size (Smith & Mendoza, 2024). Single-stair reform is currently advancing in several U.S. states, including Washington, New York, and California (Niskanen Center, 2024). Widespread adoption would eliminate the second-stairwell insertion cost for eligible building types. This makes single-stair reform one of the most consequential near-term policy levers for reducing conversion costs in the U.S. context.
Where existing stair cores can be reused with minor upgrades, costs are minor relative to the overall transformation project budget. Where a second stairwell must be inserted, costs escalate to approximately $150,000 to $500,000 per stair, depending on height and structural complexity (RSMeans, 2023; U.S. General Services Administration, 2022). Egress reconfiguration costs fall most heavily on two building configurations prevalent in the 1960s to 1980s speculative office stock: side-core buildings, where the stair and service core is located at one end of the floor plate; and central-core deep-plate buildings, where the perimeter-to-core travel distance exceeds the IBC residential maximum (International Code Council, 2021). Both configurations are common in the secondary office segment identified in Chapter 3 as the primary target for earlystage reuse assessment, making egress a cost category that warrants systematic flagging in portfolio-level screening.
Appendix 2: Sizing the Market, A Three Layer Framework
This appendix applies a three-layer market sizing framework to that task: Total Addressable Market (TAM), Serviceable Addressable Market (SAM), and Serviceable Obtainable Market (SOM).
The TAM defines the broadest universe of buildings theoretically eligible for adaptive transformation, filtered by property types under investment stress, construction age, and portfolio ownership structure. The SAM narrows this universe to the segment where adaptive transformation demand is realistically concentrated, applying geographic, typological, and client-side filters to identify the buildings, locations, and owners where the conditions for reuse are most likely to align. The SOM defines the realistic near-term pipeline: the segment where stranding risk is highest, client accessibility is greatest, and the practical capacity to deliver a rapid assessment service exists.
Three primary filters apply across all three layers. Property type determines where investment stress and functional obsolescence are most advanced. Building age establishes exposure to regulatory non-compliance and deferred maintenance. Ownership structure identifies the client profiles most structurally motivated to act. Together, these filters produce a graded picture of the market, moving from scale to specificity, and from theoretical eligibility to actionable opportunity.
The three layer framework includes:
A2.1 Total Addressable Market
A2.2 Serviceable Addressable Market (SAM)
A2.3 Serviceable Obtainable Market (SOM)
(TOM)
A2.1 Total Addressable Market (TAM)
The TAM represents the broadest universe of buildings theoretically eligible for adaptive transformation across Europe and the United States. It is defined by three primary filters: property types currently under investment stress, building stock approaching the end of its design life and exposed to regulatory updates, and properties generally held within large portfolios.
The age profile of the existing building stock establishes the scale of regulatory and functional exposure within this universe. Building stock data across both geographies establishes a consistent picture: the majority of commercial buildings in Europe and the United States were constructed before 2000 (European Commission, BSO; European Commission, EPBD; EIA, 2022; EIA, 2020), with a median year of construction around 1980 (European Commission, BSO; European Commission, EPBD; EIA, 2022; EIA, 2020) . Buildings in this age bracket may remain structurally sound but face compounding exposure to regulatory non-compliance, deferred maintenance, and functional obsolescence. The TAM is assessed across three property types where investment stress, functional obsolescence, and portfolio concentration are most pronounced: office, retail, and industrial and logistics.
A definitional caution applies to the “unrenovated” counts. As used here, unrenovated denotes stock with no comprehensive renovation on record; it does not distinguish a building that has had partial upgrades — a replaced plant, a re-clad façade — from one untouched since construction. This is deliberately a gross, upper-bound measure of exposure, and it should be read against, not in place of, the diagnostic in Section 2.1.4: a progressively upgraded building of a given era carries a materially different, and often much lower, risk profile than an unrenovated peer. The headline counts therefore size the outer boundary of eligible stock, not the near-term pipeline. The SAM and SOM layers exist precisely to strip this figure down — from all stock lacking a comprehensive-renovation record (TAM), to the subset where the absence of upgrade coincides with regulatory, locational, and ownership exposure (SAM/SOM). The ~91% is the starting estimation, not a count of buildings all requiring the same intervention.

Office
Adaptive transformation demand in the office sector is concentrated in major urban markets across Europe and the United States, where aging office stock faces compounding regulatory and functional obsolescence.
In the European Union, offices account for approximately 23% (BPIE, 2015) of the roughly 12 million non-residential buildings (RICS, 2020), producing an indicative stock of around 2.76 million office buildings (BPIE, 2015), with a large share delivered between 1945 and 2000 (European Commission, BSO, CORDIS, 2023). Applying the sector renovation rate, only ~9% of the office stock (≈250,000 buildings) has been renovated, leaving an estimated ~2.51 million unrenovated office buildings — approximately 91% of the EU office sector (RICS, 2020)
In the United States, the office stock totals approximately 970,000 buildings, of which around 605,00 (62%) were built between 1970 and 2009 (EIA, 2022), representing the peak of office development. Only around 67,000 buildings (7%) were constructed after 2010, indicating a predominantly mid-aged stock (EIA, 2022). The estimated renovation exposure is substantial: 393,250 of the total office inventory (40%) have undergone no renovation after 2000. Around 40% of the stock (≈393,000 buildings) has undergone no renovation since 2000, and a larger share may require some modernization to meet current standards (EIA, 2022).
Risk Drivers
The combined TAM for the office sector is approximately 3.73 million buildings across both geographies, with an estimated size of unrenovated buildings equal to 393, 250 in (U.S.) and 2,51 million in (EU). This segment carries the highest concentration of stranding risk relative to its size, driven by the interaction of functional obsolescence, ESG non-compliance, and the structural shift in occupier demand established in Chapter 2.

Retail
Retail adaptive transformation demand is concentrated in markets where ageing secondary retail assets face structural decline driven by the permanent shift of consumer spending toward e-commerce and the bifurcation between prime and secondary retail formats.
In Europe, retail and wholesale use accounts for approximately 28% of the non-residential stock, producing an indicative universe of around 3.36 million retail units (BPIE, 2015), with a large share delivered between 1945 and 2000 (European Commission, BSO). An estimated amount of 3.06 million have not been through renovation (RICS, 2020).
In the United States, the total commercial building stock recorded by CBECS stands at approximately 517,000 buildings, of which 372,000 buildings, ~ 72%, were built after 1960 and before 2009, and ~ 10% (52,000 buildings) after 2010 (EIA, 2022). The percentage of unrenovated buildings in the retail sector can be estimated at around the 55%, equal to 286,745 buildings (EIA, 2022).
The combined TAM for the retail sector is approximately 3.88 million buildings (≈3.36M EU + 517K US), with an unrenovated stock of ~287,000 (U.S.) and ~3.06 million (EU) [≈3.35M combined]

Industrial and Logistics
Adaptive transformation pressure in the industrial and logistics sector is more asset-specific than in the office or retail sectors. The most exposed buildings are pre-2000 warehouses in secondary logistics corridors or suburban distribution clusters outside prime infill logistics hubs, where obsolete specifications make them uncompetitive against modern facilities without significant investment.
In Europe, warehouses account for 11% of the commercial share of the non-residential stock, yielding an indicative universe of approximately 1,32 million buildings (BPIE, 2015), in an estimated amount of 1,20 million buildings (RICS, 2020).
In the United States, the latest 2022 CBECS report shows a total of one million warehouses and storage facilities, with an intense construction activity recorded between 1970 and 2018, equal to 785,000 buildings (EIA, 2022). Approximately 70% of the total warehouse inventory, meaning 554,614 buildings, have undergone no renovation (EIA, 2022).
Key Risk Drivers Technical obsolescence, ESG gaps Specification mismatch vs modern logistics
The combined TAM for the industrial and logistics sector (primarily warehouses) is approximately 2.32 million buildings (≈1.32M EU + 1.00M US). This is the smallest of the three TAM segments by count, with an unrenovated segment of ~1.75 million (≈554,600 US + 1.20M EU) but the distribution of stranding risk is narrower than the headline figure suggests: obsolescence is primarily triggered by technical equipment updates and specification gaps rather than the broader market and regulatory forces acting on office and retail stock, making this segment more selective in practice than its scale implies.
Commercial Building Stock by Count EU, U.S. & Combined
Office
~2.88M ~970K ~3.85M
Retail ~2.76M ~517K ~3.28M
Industrial & logistics
N/A [c] ~1.00M
EU: 24% of 12M non-res. (BSO) [a] · U.S.: CBECS office [b]
EU: 23% of 12M (BSO) [a] · U.S.: CBECS mercantile [b]
EU not isolable (within “other”, 14% ≈ 1.68M) · U.S.: CBECS warehouse [b]
Sources & Notes
[a] EU Building Stock Observatory / RICS Data Services (2020), “Energy efficiency of the building stock in the EU.” The EU-28 has ~12M nonresidential buildings; the count breakdown is offices 24%, wholesale & retail 23%, educational 18%, “other” 14%, healthcare 11%, hotels & restaurants 10%.
[b] U.S. Energy Information Administration, Commercial Buildings Energy Consumption Survey (CBECS) 2018 — building-count stock (~5.9M commercial buildings total; warehouse & storage and office are the two most numerous types). US retail = mercantile category.
[c] No count-based EU warehouse/logistics stock figure exists on a CBECS-comparable basis: BSO subsumes warehousing within “other” (with transport, garage and agricultural buildings); EU warehouse data is published only as floor area (m²), take-up, or enterprise counts (Eurostat SBS, NACE H52).
A2.2 Serviceable Addressable Market (SAM)
The SAM narrows the TAM to the segment where adaptive transformation demand is realistically concentrated. Where the TAM establishes the theoretical universe of eligible buildings, the SAM applies a second set of filters to identify where the conditions for reuse are most likely to align in practice: the right geography, the right building typology, and the right ownership structure. The result is not a precise count of buildings but a definition of the market segment where a structured assessment service is most applicable and most likely to find structurally motivated clients.
Geographical Focus
The first filter operates at the regional and city levels. Adaptive transformation demand concentrates in cities characterized by high population turnover, strong capital attraction, active regulatory environments, and sufficient depth of occupier demand to absorb transformed space. These conditions are most reliably present in tier-one cities across Europe and the United States, defined here as the primary capital flow centers in each geography.
REGION
PRIORITY MARKET
EU Germany, France, Spain, the United Kingdom, Italy, with particular focus on cities with active public-sector regeneration programs
U.S. New York, Boston, Washington DC, Chicago, San Francisco
These cities share a critical combination of conditions: an aging midcentury building stock, elevated vacancy within secondary segments, and regulatory frameworks that are already creating or are likely to create compliance pressure on existing buildings. They are also the markets where institutional owners, lenders, and public authorities are most accessible and most structurally motivated to act.
Within each city, the primary focus rests on secondary locations rather than central business districts or prime urban cores. Prime locations attract sufficient investment and occupier demand to support conventional repositioning. It is in peripheral business districts, secondary high streets, and suburban office clusters that buildings face the greatest difficulty attracting capital, that vacancy is most persistent, and that the case for adaptive transformation is most likely to be the difference between a building finding a viable future and remaining stranded. Location within the urban environment is therefore not simply a filter on risk: it is a make-or-break condition for adaptive transformation viability, given the direct relationship between location, achievable rents, and the depth of demand for any target program.
Client Type
The second filter operates at the ownership level. Demand generation should be directed toward large portfolio holders and clustered property owners, as these counterparties offer the scale, the decision-making structures, and the financial pressure most conducive to systematic adaptive transformation assessment. A building owner managing a single distressed asset faces the same analytical problem as one managing a portfolio of fifty, but only the latter has both the incentive and the organizational capacity to engage with a structured assessment service at scale.
CLIENT TYPE PROFILE DRIVER
Institutional Investors
Pension funds, insurance companies, REITs, and large private equity funds
Sensitive to write-downs, LTV deterioration, and prolonged vacancy, ESG reporting obligations intensify pressure to act
Lenders and Banks
Public Authorities
Confronted with nonperforming loans and refinancing distress
Cities experiencing vacancy concentration and cascading impacts of stranded assets
Opportunisitic Developers
Transaction-based clients acquiring stranded assets at significant discounts
Adaptive transformation functions as a riskmitigation instrument and structured workout strategy, avoiding the bank taking ownership of an asset it cannot manage
May co-finance reuse initiatives, mandate renovation through regulation, or act as catalytic drivers in markets where private capital has withdrawn
Higher risk tolerance; seek value-add repositioning opportunities where the gap between acquisition price and transformation value is sufficient to justify the complexity
These four categories are not equal in terms of accessibility or urgency. Institutional investors and lenders are the primary client base: they are structurally exposed to the financial consequences of stranded assets, manage assets at a scale where portfolio-level assessment is most applicable, and face growing external pressure from ESG frameworks and regulatory compliance obligations to resolve underperforming holdings. Public authorities are a secondary but increasingly important client type, particularly in retail and mixed-use contexts where private capital alone is insufficient to drive reuse. Opportunistic developers represent a transaction-driven client base that engages at the point of acquisition rather than during portfolio management, requiring a different engagement model but offering a consistent pipeline of assessment opportunities.
A2.3 Serviceable Obtainable Market (SOM)
The SOM defines the realistic near-term pipeline for an adaptive transformation assessment service: the segment where stranding risk is highest, client accessibility is greatest, and the practical capacity to deliver structured assessment exists. It emerges from the convergence of the highest-priority segments identified across the TAM and SAM, filtered by a final consideration: which buildings, in which locations, held by which owners, are both most in need of assessment and most reachable within current market conditions.
The SOM is organized around one primary focus and two selective focuses, reflecting differences in stranding risk concentration, client accessibility, and assessment complexity across property types.

Primary Focus: Secondary Office
Secondary office assets in tier-one cities across Europe and the United States represent the primary SOM target. This segment combines the highest stranding risk with the most accessible and structurally motivated client base, and it is the segment where the gap between current assessment practice and the potential value of adaptive transformation is most consequential.
The defining characteristics of buildings within this focus are:
nj Mid-aged construction, delivered between 1960 and 2009, with no renovation history
nj Non-listed assets outside heritage protection, which avoids the additional complexity of preservation constraints while retaining the spatial and structural qualities that make transformation viable
nj ESG non-compliance and functional obsolescence are creating compounding pressure from both regulatory and market directions
nj Institutional ownership or encumbrance by non-performing loans, ensuring that the client base is both identifiable and structurally motivated to engage
Within tier-one cities, the primary focus rests on secondary locations rather than core business districts, for the reasons established in 3.3.1. These are the buildings where conventional repositioning is least viable, where vacancy is most persistent, and where early-stage adaptive transformation assessment is most likely to reveal transformation value that standard appraisal practice leaves unexamined.
The secondary office segment is also the most amenable to portfolio-scale assessment. Institutional owners and lenders managing large office portfolios face the same analytical challenge across multiple assets simultaneously, creating both the incentive and the organizational appetite for a systematic approach rather than the case-by-case evaluation that currently characterizes adaptive transformation practice.

Selective Focus: Secondary Retail
Secondary retail represents a strong, selective target within the SOM, particularly non-dominant high streets and oversupplied malls in tier-one European and U.S. cities. The structural decline of mid-tier retail formats, driven by the permanent migration of consumer spending online, has produced a growing inventory of large, well-located buildings whose original purpose has contracted faster than the market has found alternative uses for them.
This segment differs from the secondary office in two important respects. First, the scale of individual assets is often larger, and the complexity of transformation correspondingly greater, requiring assessment approaches that can accommodate mixed-use programming and phased delivery. Second, public authorities are more consistently present as co-participants in retail reuse contexts: the cascading vacancy effects of a stranded retail anchor on the surrounding urban environment create a direct public interest in resolving the issue that is less consistently present in office markets. This opens additional pathways for project origination and co-financing that are not available in the same form for office assets.
Engagement in this segment should be pursued selectively, prioritizing assets where public authority involvement is already active or where the ownership structure is sufficiently consolidated to support portfolio-level assessment.

Selective Focus: Industrial and Logistics
Pre-2000 warehouses in secondary locations with obsolete specifications represent the third focus within the SOM, addressed on a case-by-case basis rather than as a systematic portfolio target. Unlike office and retail, where stranding risk operates across broad segments simultaneously, obsolescence in the industrial and logistics sector is primarily triggered by specific technical equipment updates: ceiling heights that cannot accommodate modern logistics operations, mechanical systems that fall short of current energy standards, or locational characteristics that place assets outside the connectivity corridors that contemporary distribution networks require.
The selective, technically specific nature of obsolescence in this segment means assessment demand is less predictable and less amenable to portfolioscale origination. It is best pursued opportunistically, engaging when a specific asset’s technical obsolescence has already been identified by its owner or lender, rather than through proactive portfolio screening. Where assessment opportunities arise, the transformation case is often compelling: industrial buildings offer structural flexibility, large floorplates, and locational characteristics that can support a wide range of alternative programs, from residential and mixed-use to cultural and community uses.
Appendix 3: Interviews and Interviewee Lists
This appendix reports the main challenges and drivers highlighted from the 28 interviews regarding the question of whether to assess adaptive transformation for a building that has approached the end of its market life.
The semi-structured interviews were designed to reveal the priorities of different stakeholders and to examine their methodologies for conducting feasibility studies when deciding what to do with stranded assets. In a second step, the discussions focused on understanding the drivers and challenges of adaptive transformation, highlighting the diverse systems of prioritisation across fields of expertise. In a third stage, the interviews addressed the greatest limitations in assessing feasibility studies for adaptive transformation and what would be wished to be integrated to render adaptive transformation an assessable option for appraisals
This section includes:
A3.1 Interviewees
A3.2 Impediments and Drivers
A3.3: Notes on Risks
Stage 1: Decision Priorities and Feasibility Orientation
Designed to reveal how different stakeholders prioritize financial, environmental, and social objectives when facing an end-of-marketlife decision, and how those priorities shape their approach to feasibility assessment.
Addressed the most significant limitations practitioners encounter in conducting feasibility assessments for adaptive transformation, and explored the methodological, technical, and regulatory changes they identify as necessary to make reuse a more consistently assessable and economically competitive option within standard appraisal frameworks. 3 2 1
Stage 2: Drivers and Impediments across Professional Dimensions
Focused on the drivers and impediments of adaptive transformation across financial, regulatory, technical, urban, and social dimensions, surfacing the diverse systems of prioritization across professional fields.
Stage 3: Assessment Limitations and Conditions for Scalability
A3.1 Interviewees
NUMBER TYPE INDUSTRY SECTOR ROLE
Interviewee 1 Professional Architecture & Engineering
Interviewee 2 Public - Municipality Government & Public Authority
Enemærke & Petersen, Copenhagen, Denmark, EU
District of Columbia Department of Buildings, Washington DC, Washington, U.S.
Interviewee 3 Real Estate Advisor Real Estate Sector CBRE, Washington DC, Washington, U.S.
Interviewee 4 Developer Real Estate
Greycoat, Development and Leasing, London, UK
Interviewee 5 Real Estate Advisor Real Estate Sector Red Oak Street, New York, U.S.
Interviewee 6 Public - Municipality Government & Public Authority
Interviewee 7 Professional Architecture & Engineering
Rome Municipality, Rome, Italy, EU
SEM Structural Engineering, Genoa, Italy, EU
Interviewee 8 Professional Architecture & Engineering Openfabric, Genoa, Italy, EU
Interviewee 9 Professional Architecture & Engineering Aarhus School of Architecture, Aarhus, Denmark, EU
Interviewee 10 Real Estate Advisor Real Estate Sector
SVP Brookfield Properties, San Francisco, California, U.S.
Interviewee 11 Real Estate Agency Real Estate Sector CBRE, U.S.
Interviewee 12 Real Estate Agency Real Estate Sector JLL, North Sydney, New South Wales, Australia
Interviewee 13 Professional Architecture & Engineering Kleihues + Kleihues, Berlin, Germany, EU
Interviewee 14 Developer Real Estate Developer, Berlin, Germany, EU
Interviewee 15 Real Estate Advisor - Public Institution Real Estate Sector
Interviewee 16 Developer Real Estate
JLL Public Institution Department, Washington DC, Washington, U.S.
Four Points LLC, SVP Development and Construction, Washington, DC, U.S.
Interviewee 17 Public - Municipality Government & Public Authority Genoa Municipality, Genoa, Italy
NUMBER TYPE
INDUSTRY SECTOR ROLE
Interviewee 18 Developer Real Estate
Managing Principal of Madison Highland, Washington, DC, U.S.
Interviewee 19 Professional Architecture & Engineering Anders Sørensen Rørbæk Møller, Copenhagen, Denmark, EU
Interviewee 20 Public - Municipality Government & Public Authority SPIM, Genoa, Italy, EU
Interviewee 21 Professional Architecture & Engineering Transsolar, Munich, Germany, E.U.
Interviewee 22 Professional Architecture & Engineering Birk/Nielsen/Skeerup & Jespersen/Sweco, Copenhagen, Denmark, E.U.
Interviewee 23 Professional Architecture & Engineering Chair of the Urban Planning Department at Georgetown University, U.S.
Interviewee 24 Public - Municipality Government & Public Authority
Interviewee 25 Real Estate Consultant Real Estate Sector
Interviewee 26 Real Estate Consultant Real Estate Sector
Interviewee 27 Developer Real Estate
ANCE - National Association of Building Contractors, Rome, Italy
Cavalry Real Estate Advisors, Washington DC, Washington, U.S.
Real Estate Enterprises, Washington DC, Washington, U.S
Unico Properties, Design and Development, Seattle, Washington, U.S.
A3.2 Impediments and Drivers
Overall, the interviews explored a wide range of perspectives, reflecting the specific priorities of each interviewee and the complexity of the issues addressed, which cannot be substantiated by a single cause but rather by a plurality of factors, as defined below:
FACTOR IMPEDIMENTS
nj Market saturation: Prime candidates already converted or studied
nj Rising entry barriers for new projects
nj Investor mindset: lack of expertise in complex repositioning
DRIVERS
nj High vacancy rates in value-add opportunities
nj Balance sheet pressure on underutilised assets
nj Distress & structural shift in office demand
nj Conversion as exit strategy for owners
Real Estate Factors
Financial Factors
nj Valuation conflicts between buyers/sellers
nj Flight to quality: capital concentrates on premium assets
nj Struggles to achieve competitive rents
nj Limited liquidity for secondary assets
nj Unforeseen costs due to poor due diligence
nj Renovation underestimation (hidden structural issues)
nj Volatile interest rates / soft costs
nj Missed comparison with demolition return
nj Capital preference for new builds
nj Low repositioning appetite among portfolio sellers
nj Risk transfer behavior (sell “as-is”)
nj Debt constraints (pricing sensitivity, borrowing costs)
nj Financing rigidity limits innovation
nj Shortage of ESG-compliant prime assets
nj Repositioning B/C assets into higher-value uses
nj Functional obsolescence becomes value driver
nj Improved data access (absorption, returns, financing) reduces uncertainty
nj Public and private funds (especially housing sector)
nj Historic tax credits / abatements
nj Reduced permit and development fees
nj Mission-driven investment (public sector)
nj Embedded asset value supports reuse
nj Avoided demolition costs
nj Long-term value creation through repositioning
nj ESG-linked financing incentives emerging
FACTOR IMPEDIMENTS
nj Opaque zoning systems
nj Inconsistent regulatory frameworks
nj Long approval timelines
Political Factors
Legal Compliance
nj Strict energy compliance burdens
nj Layered regulatory costs
nj Political volatility (policy shifts, elections)
nj Labour disputes / public opposition risks
nj Investor uncertainty due to policy instability
nj Codes designed for new construction
nj Costly compliance upgrades required
nj Rigid energy standards not aligned with reuse realities
nj Restrictive heritage regulations limiting intervention
nj Inconsistent approval processes
nj Administrative delays increase financing risk
nj Market distortion (rules not aligned with tenant demand)
nj Physical constraints: deep floor plates, poor light, mid-block sites
nj Limited public realm integration
nj Peripheral or unattractive locations
Urban Factors
nj Clustered vacancy reduces area appeal
nj Weak retail / amenities ecosystems
nj Higher crime environments
nj Heritage & archaeological constraints
nj Vacancy degradation & illegal activity risks
DRIVERS
nj Strong policy frameworks prioritising reuse
nj Restrictions on demolition shifting incentives
nj Refurbishment as default planning strategy
nj Public–private partnerships (PPP) Faster approvals through aligned governance
nj Political support reduces friction and risk
nj Streamlined approval processes
nj Reduced administrative burden
nj Adaptive zoning frameworks
nj Targeted reuse policies & funding programs
nj Predictable preservation rules unlock funding
nj Collaborative governance with municipalities
nj Regulatory clarity improves investor confidence
nj Improved street-level activation
nj Enhanced public realm & urban connectivity
nj Catalyst for urban regeneration
nj Revitalisation of declining districts
nj Leveraging central / transit-oriented locations
nj Mixed-use transformation opportunities
FACTOR IMPEDIMENTS
nj Complex social environments (marginalised populations)
nj Need for relocation / integration strategies
DRIVERS
nj Community pressure to avoid vacancy & blight
Social Community
Building Features
nj Higher project costs due to social considerations
nj High expectations for comfort (vs new builds)
nj Heritage/community resistance to change
nj Archaeological constraints overlap
nj Insufficient natural light
nj Deep floor plates unsuitable for housing
nj Rigid structural systems (post-tensioned, cast concrete)
nj Low ceiling heights
nj Inflexible layouts
nj Rapid degradation when vacant
nj Hazardous materials
nj Fundamental physical constraints (age, structure, windows)
nj Unknown structural conditions
nj Hidden hazardous materials
nj Cost overruns & project failure risk Stacked constraints (zoning + heritage + structural)
nj ESG alignment
nj Reputational benefits for developers
nj Cultural continuity through preservation
nj Government-backed housing incentives
nj Material reuse & embodied carbon savings
nj Early material assessment reduces uncertainty
nj Typology/era-based predictability
nj Efficient layouts enable conversion
nj Potential to restore original features (light wells)
nj Availability of structural drawings
nj Existing structural integrity supports reuse
nj Embedded economic value favors retention
nj Experienced professionals reduce uncertainty
nj Rapid expert assessment of typologies
nj Early-stage due diligence & feasibility checks
Risk Assessment
nj Regulatory uncertainty in emerging markets
nj Fragmented/unreliable data ecosystems
nj Flawed feasibility due to poor data
nj Municipal data gaps (vacancy mapping, impact tools)
nj Quantification of regulatory risks
nj Use of datasets, checklists, predictive tools
nj Rapid feasibility testing (30–40 min screening)
nj Typology-based risk predictability
A3.3 Notes on Risks
Owners and Lenders
“When those structures are not maintained… they disintegrate, they degrade very quickly… it actually detracts from the land value and it makes it next to impossible to feasibly do anything with the property.”
Interviewee 24, Real Estate Advisor, Endeavor Interviews, 2025
“There are some that literally are worth less than the ground they sit on.”
Interviewee 2, Real Estate Developer, Endeavor Interviews, 2025
“The owner is the one that’s bleeding because they’re paying for the expense of the empty building — property tax, upkeep, keeping the building warm so things don’t break down… They’re bleeding, and the owners probably know … their asset is valueless.”
Interviewee 2, Real Estate Developer, Endeavor Interviews, 2025
“It actually detracts from the land value and makes it next to impossible to feasibly do anything with the property.”
Interviewee 24, Real Estate Advisor, Endeavor Interviews, 2025
“They’re pretty much giving this building away for very little, much less than they paid, just to get it off the books.”
― Interviewee 23, Real Estate Advisor, , Endeavor Interviews, 2025
“They’re going to stretch these empty buildings out [...] the owner is the one that’s bleeding because they’re paying for the expense of the empty building, property tax, upkeep [...] They’re bleeding.”
Interviewee 2, Real Estate Developer, Endeavor Interviews, 2025
“Oftentimes, the owners are gone – the lender is now the owner. That’s what’s generally happening. It’s gone back to the bank or financial institution. They’re now the new owner.”
Interviewee 2, Real Estate Developer, Endeavor Interviews, 2025
“The lender may have to fix the deal through workout strategy. [...] Workouts basically are where [...] your debt service isn’t covered by the income from the property. You’re in default [...] They will foreclose on the asset and do it themselves.”
Interviewee 28, Real Estate Consultant, Endeavor Interviews, 2025
“That business plan could include physical improvements, marketing efforts, financial restructuring of the loan – basically becoming a partner with the lender as opposed to having the traditional lender–borrower relationship.”[...]“Often because of the difficult relationship the borrower and lender have sometimes, that lender is going to go find a different developer and/ or owner to do this on a fee basis. They would hire that group to do that on a fee basis.”
Interviewee 28, Real Estate Consultant, Endeavor Interviews, 2025
“We are actively going out and trying to identify buildings [...] and then going and talking to either the owners or the lenders [...] we’d like to be your partner.”
Interviewee 23, Real Estate Advisor, Endeavor Interviews, 2025
“Their loan is probably at $600 a square foot, the building is probably worth 225. Their option is to sell today for a massive discount.”
Interviewee 23, Real Estate Advisor, , Endeavor Interviews, 2025
“These organisations may own hundreds of properties, but they’re not in the position themselves to hire contractors, develop the properties. They use other agencies to manage and rent properties.”
― Interviewee 24, Real Estate Advisor, Endeavor Interviews, 2025
“Institutional investors, typically have no design or development sense and don’t have the skill set nor the ability to reimagine what that building could be.”
Interviewee 28, Real Estate Consultant, Endeavor Interviews, 2025
Public
Authorities
“There are many vacant buildings, often along consular roads [...] many closer to the center [...] industrial archaeology buildings [...] abandoned, disused buildings or those in a state of degradation.”
Interviewee 17, Public Authority, Endeavor Interviews, 2025
“These are very real costs that civil society pays [...] There’s a concentration of marginality and hardship, situations of micro and macro organised crime develop in these places.” [...]
“These areas we intervene on are almost always occupied [...] a lot of urban marginality that produces a lot of waste [...] security problems.”
Interviewee 17, Public Authority, Endeavor Interviews, 2025
“Investors run away with raised legs from these procedures.”
Interviewee 17, Public Authority, Endeavor Interviews, 2025
“DC probably 20–30 years ago had an outsized set of vacant buildings, mostly single-family residential buildings. The city set up various programs to acquire those structures that had often been neglected for 30–40, fifty years and were in incredibly poor shape.”
Interviewee 24, Real Estate Advisor, Endeavor Interviews, 2025
“Then there’s a quality of life issue where they’ve struggled from a public safety standpoint.”
Interviewee 2, Public Authority, Endeavor Interviews, 2025
“We have to call the waste cleaning company; often there’s asbestos, so those are very real costs that civil society pays. Then there are security costs because this concentration of marginality… creates many security problems.”
Interviewee 17, Public Authority, Endeavor Interviews, 2025
“Starting from that perspective, it was up to the city to maintain a safe structure, limiting access. Oftentimes people went in, there were squatters in the building, and trying to keep the property clean so that people weren’t dumping and there weren’t other negative externalities around a structure like that.”
Interviewee 24, Real Estate Advisor, Endeavor Interviews, 2025
Bibliography
Chapter 0: Introduction
Baker, H., Moncaster, A., Remøy, H., & Wilkinson, S. (2021). Retention Not Demolition: How Heritage Thinking Can Inform Carbon Reduction. Journal of Architectural Conservation, 27(3). https://www.repository.cam.ac.uk/items/ e5d43e44-8087-4f03-a30a-247d26a51550
Devaney, S. (2022). Editorial: Depreciation: Old Concept and New Causes. Journal of Property Investment & Finance, 40(6), 529–531. https://doi.org/10.1108/JPIF-09-2022-198
European Committee for Standardization. (2002). Eurocode—Basis of Structural Design (European Standard EN 1990:2002; Version +A1:2005). CEN. https://eurocodes.jrc.ec.europa.eu/ EN-Eurocodes/eurocode-basis-structural-design
PwC & Urban Land Institute. (2024). Emerging Trends in Real Estate Europe 2025. PwC. https://www.pwc.com/gx/en/industries/ financial-services/real-estate/emergingtrends-real-estate/europe-2025.html
Remøy, H. (2010). Out of Office: A Study on the Cause of Office Vacancy and Transformation as a Means to Cope and Prevent. IOS Press. https://resolver.tudelft.nl/ uuid:9c24b779-1c61-4a88-921a-04d3e12a8e46
Wilkinson, S., Armstrong, G., & Ciliers, J. (2021, December 10). Repurposing Assets to Reduce Vacancy Rates. RICS Property Journal. https:// ww3.rics.org/uk/en/journals/property-journal/ repurposing-assets-to-reduce-vacancy-rates.html
Chapter 1: The Stranded Asset Phenomenon
Building Owners and Managers Association International. (n.d.). Building class definitions.
CBRE. (2026). U.S. real estate market outlook 2026. https://mktgdocs.cbre.com/2299/ af724164-2538-4ef6-9b03-2707c68d2ad2315015658/2026-U.S.-Real-Estate-Market-Out.pdf
CBRE. (2026, January 29). 2026 North American investor intentions survey. https://www. cbre.com/insights/reports/2026-northamerican-investor-intentions-survey
CBRE Research. (2025, July). 2025 U.S. real estate market outlook: Midyear review.
CBRE Research. (2025). European real estate market outlook 2025.
City of Boston. (n.d.). Building emissions reduction and disclosure ordinance (BERDO). https://www. boston.gov/departments/environment/berdo
City of Toronto. (2024). Better buildings partnership & energy benchmarking. https:// www.toronto.ca/services-payments/waterenvironment/environmental-grants-incentives/ energy-benchmarking/
City of Toronto. (2025). Building emissions performance standards (under development). https://www.toronto.ca
City of Vancouver. (2022). Zero emissions building plan. https://vancouver.ca/green-vancouver/ zero-emissions-building-plan.aspx
Comune di Milano. (n.d.). Regolamento edilizio del Comune di Milano. https://www.comune.milano.it
Council on Environmental Quality. (2022, December). The federal building performance standard. https://www.sustainability.gov/pdfs/ federal-building-performance-standard.pdf
CRREM, Carbon Risk Real Estate Monitor. (2022). CRREM initiative’s definition of stranding risk and stranded assets in the built environment.
Cushman & Wakefield. (2026). European outlook 2026.
Deloitte Insights. (2025, September). 2026 commercial real estate outlook.
Detroit Blight Removal Task Force. (2014). Every neighborhood has a future… and it doesn’t include blight. https://detroitmi.gov
District of Columbia. (n.d.). Building energy performance standards (BEPS).
European Central Bank. (2023). Financial stability review (May 2023).
European Parliament and the Council of the European Union. (2024). Directive (EU) 2024/1275 on the energy performance of buildings (recast). http://data.europa.eu/eli/dir/2024/1275/oj
Gardner, N., Gujral, V., Kwok, A., Du, J., & Luby, R. (2025, May). Flexible work’s enduring appeal affects workers, employers, and real estate. McKinsey & Company.
Government of British Columbia. (2023). BC Energy Step Code. https://www2.gov.bc.ca/ gov/content/industry/construction-industry/ building-codes-standards/energy-efficiency
International Valuation Standards Council. (2022). International valuation standards. Italian Republic. (2001). Testo unico delle disposizioni legislative e regolamentari in materia edilizia (D.P.R. 380/2001). https://www.normattiva.it
Jones Lang LaSalle Incorporated. (n.d.). Real estate terms and definitions.
JLL. (2026). 2026 global data center outlook. https://www.jll.com/en-us/insights/ market-outlook/data-center-outlook
JLL. (2024, December). Global real estate outlook 2025. https://www.assoimmobiliare. it/wp-content/uploads/2025/01/jll-2025global-real-estate-outlook.pdf
JLL. (2025, August). Global real estate perspective – Highlights.
Knight Frank. (2025). Retail insights compendium. https://www.knightfrank.co.uk/site-assets/ research/report-pdfs/retail-renaissance/ cmre25-003-retail-insights-compendium.pdf
Muldoon-Smith, K., & Greenhalgh, P. (2017). Situations vacant: A conceptual framework for commercial real estate vacancy. European Real Estate Society (ERES). https://doi.org/10.15396/eres2017_341
Mueller, G. R. (2001). Predicting long-term trends & market cycles in commercial real estate (Working Paper No. 388). Wharton School, University of Pennsylvania.
New York City Department of Buildings. (n.d.). LL97 greenhouse gas emissions reduction. https://www.nyc.gov/site/buildings/codes/ll97greenhouse-gas-emissions-reductions.page
Nordic Council of Ministers. (2023). TemaNord 2023:544 — Looking outside the Nordics.
PwC, & Urban Land Institute. (2022). Emerging trends in real estate Europe 2023.
PwC, & Urban Land Institute. (2023). Emerging trends in real estate® 2024.
PwC, & Urban Land Institute. (2024a). Emerging trends in real estate® 2025.
PwC, & Urban Land Institute. (2024b). Emerging trends in real estate® 2025: United States and Canada.
PwC, & Urban Land Institute. (2025). Emerging trends in real estate® Europe 2026.
Roach, A. (2025, December 19). Data center deals hit record amid AI funding concerns grip investors. CNBC. CNBC article
Royal Institution of Chartered Surveyors (RICS). (2023). Whole life carbon assessment for the built environment (2nd ed.). https://www.rics.org/ content/dam/ricsglobal/documents/standards/ Whole_life_carbon_assessment_PS_Sept23.pdf
S&P Global Market Intelligence. (2025, December). Record-breaking data center investments & M&A in 2025 amid AI demand. https:// www.spglobal.com/market-intelligence/ en/news-insights/articles/2025/12/recordbreaking-data-center-investments-m-ain-2025-amid-ai-demand-96002955
Trump, D. J. (2025, January 20). Initial rescissions of harmful executive orders and actions (Executive Order No. 14148). Federal Register. https://www.federalregister. gov/documents/2025/01/28/2025-01901/ initial-rescissions-of-harmfulexecutive-orders-and-actions
U.S. Department of Energy. (n.d.). Standards and test procedures. https://www.energy.gov/cmei/ buildings/standards-and-test-procedures
U.S. Environmental Protection Agency. (n.d.). Regulatory actions for technology transitions. https://www.epa.gov/climate-hfcs-reduction/ regulatory-actions-technology-transitions
United States Environmental Protection Agency. (n.d.). Sustainable management of construction and demolition materials. https://www.epa.gov
U.S. Geological Survey. (n.d.). Earthquake hazards and building performance. https://www.usgs.gov
UK Parliament. (2022). Building Safety Act 2022. https://www.legislation.gov. uk/ukpga/2022/30/contents
Chapter 2: Market Opportunity
Birlan, M., et al. (2025). Modeling regional ESG performance in the European Union. Mathematics, 13(15), 2337. https://doi.org/10.3390/math13152337
Buildings Performance Institute Europe (BPIE). (2015). Europe’s buildings under the microscope: A countryby-country review of the energy performance of buildings (Executive summary). https:// www.bpie.eu/wp-content/uploads/2015/10/ HR_EU_B_under_microscope_study.pdf
CBRE. (2023). U.S. industrial and logistics market outlook.
Chai, H. (2023, September 6). In Edmonton, an industry eagerly awaits the second coming of office conversions. Storeys. https://storeys.com/ edmonton-office-conversions-incentive-program/
City of Calgary. (2026). Downtown Calgary development incentive program. https:// www.calgary.ca/development/downtowncalgary-incentive-program.html
City of Toronto. (2026). Key city strategies for net zero buildings. https://www. toronto.ca/services-payments/waterenvironment/net-zero-homes-buildings/ key-city-strategies-for-net-zero-buildings/
City of Vancouver. (n.d.). Zero emissions buildings. https://vancouver.ca/greenvancouver/zero-emissions-buildings.aspx
European Central Bank. (2024). Pricing or panicking? Commercial real estate markets and climate change (Working Paper No. 3059). https://www.ecb.europa.eu/pub/pdf/ scpwps/ecb.wp3059~cf6e65ea31.en.pdf
European Commission. (2020). A renovation wave for Europe—Greening our buildings, creating jobs, improving lives.
European Commission. (n.d.). EU building stock observatory: Database. https://building-stockobservatory.energy.ec.europa.eu/database/
European Commission. (n.d.). Europe’s building stock: A comprehensive study. https://cordis. europa.eu/article/id/138853-europesbuilding-stock-a-comprehensive-study
European Environment Agency. (2013). Late lessons from early warnings: Science, precaution, innovation (EEA Report No. 1/2013).
European Parliament and the Council of the European Union. (2024). Directive (EU) 2024/1275 on the energy performance of buildings (recast). Official Journal of the European Union. http:// data.europa.eu/eli/dir/2024/1275/oj
Linneman, P., & Moy, D. C. (2003). The evolution of retailing in the United States. Zell/Lurie Real Estate Center, The Wharton School, University of Pennsylvania. https://realestate.wharton.upenn. edu/wp-content/uploads/2017/03/443.pdf
Organisation for Economic Co-operation and Development. (2025). Future-proofing real estate investment: The state of play of climate-related risks in real estate. OECD Publishing. https:// www.oecd.org/en/publications/future-proofingreal-estate-investment_2dd12063-en .
Royal Institution of Chartered Surveyors (RICS). (2020). Energy efficiency of the building stock in the EU. https://www.rics.org/news-insights/ energy-efficiency-of-the-building-stock-in-the-eu
University of the Built Environment. (2026). ESG and AI driving a growing divide in Europe’s office market. https://www.ube.ac.uk/whatshappening/articles/esg-and-ai-driving-agrowing-divide-in-europes-office-market/
U.S. Energy Information Administration (EIA). (2022). Commercial Buildings Energy Consumption Survey (CBECS): Table B8. Year constructed, number of buildings, 2018. https://www.eia.gov/consumption/ commercial/data/2018/bc/html/b8.php
Chapter 3: Adaptive Transformation Assessment
Applied Technology Council. (2018). Seismic rehabilitation cost study. Applied Technology Council.
Bullen, P. A., & Love, P. E. D. (2011). Adaptive reuse of heritage buildings. Structural Survey, 29(5), 411–421. https://doi.org/10.1108/02630801111182439
CBRE Research. (2023). Adaptive reuse and office conversion trends.
Carbon Risk Real Estate Monitor (CRREM). (2022). CRREM risk assessment tool and decarbonization pathways.
Cheshire, P., & Hilber, C. A. L. (2008). Office space supply restrictions in Britain: The political economy of market revenge. The Economic Journal, 118(529), F185–F221. https:// doi.org/10.1111/j.1468-0297.2008.02149.x
City of Chicago. (2023). Tax increment financing (TIF) program overview.
City of San Francisco. (2023). Development impact fee waiver programs.
City of Toronto. (2023). Office-toresidential conversion initiatives.
City of Vancouver. (2023). Conversion incentive programs and housing policy updates.
District of Columbia Office of the Deputy Mayor for Planning and Economic Development. (2023). Office-to-anything program.
European Commission. (2019). Directive (EU) 2019/882 on the accessibility requirements for products and services (European Accessibility Act). European Union.
European Commission. (2021). Seismic hazard and risk assessment in Europe. European Union.
European Commission. (2024). Directive (EU) 2024/1275 on the energy performance of buildings (recast). European Union.
European Environment Agency. (2013). Late lessons from early warnings: Science, precaution, innovation (EEA Report No. 1/2013). Publications Office of the European Union.
Federal Emergency Management Agency. (2020). Seismic evaluation and retrofit of existing buildings (FEMA P-58 / P-807). U.S. Department of Homeland Security.
Gouvernement Français. (2025). Loi relative à la transformation de bureaux en logements.
Gyourko, J., & Molloy, R. (2015). Regulation and housing supply. In G. Duranton, J. V. Henderson, & W. C. Strange (Eds.), Handbook of regional and urban economics (Vol. 5, pp. 1289–1337). Elsevier.
Heath, T. (2001). Adaptive reuse of offices for residential use: The experiences of London and Toronto. Cities, 18(3), 173–184. https:// doi.org/10.1016/S0264-2751(01)00009-9
Historic England. (2022). Enabling development and heritage assets.
International Code Council. (2021). International building code. ICC.
International Energy Agency. (2021). Achieving zero-carbon buildings. IEA.
JLL. (2023). The cost of decarbonizing real estate. JLL Research.
National Institute of Building Sciences. (2019). Deep energy retrofit case studies. NIBS.
National Park Service. (2020). Federal historic preservation tax incentives program. U.S. Department of the Interior.
New York City Department of Housing Preservation and Development. (2023). 421-g tax incentive program and office conversion policies.
New York City Mayor’s Office of Climate and Environmental Justice. (2019). Local Law 97 of 2019. City of New York.
OECD. (2021). Brick by brick: Building better housing policies. OECD Publishing. https:// doi.org/10.1787/b453b043-en
Pivo, G., & Fisher, J. D. (2010). Income, value, and returns in socially responsible office properties. Journal of Real Estate Research, 32(3), 243–270.
Rocky Mountain Institute. (2019). The economics of deep energy retrofits. RMI.
Royal Institution of Chartered Surveyors (RICS). (2018). Contamination, assessment and remediation (1st ed.).
RSMeans. (2023). Building construction cost data. Gordian.
U.S. Department of Energy. (2021). Better Buildings Initiative: Retrofit cost data.
U.S. Department of Justice. (2010). 2010 ADA standards for accessible design.
U.S. Environmental Protection Agency. (1985). Guidance for controlling asbestos-containing materials in buildings (EPA 560/5-85024). Office of Toxic Substances.
U.S. Environmental Protection Agency. (2023). Asbestos in buildings. https://www.epa.gov/asbestos
UK Government. (2021). Permitted development rights for change of use. Ministry of Housing, Communities & Local Government.
Urban Land Institute. (2023a). Adaptive reuse and office-to-residential conversion trends.
Urban Land Institute. (2023b). Decarbonizing the built environment: Retrofit cost considerations.
World Health Organization. (2010). WHO guidelines for indoor air quality: Selected pollutants.
Appendix
Applied Technology Council. (2018). Seismic evaluation and retrofit of concrete buildings (ATC-78 report).
Bruegel (2024), How to finance the European Union’s building decarbonisation plan (drawing on Bredahl et al. 2024). https:// www.bruegel.org/policy-brief/how-financeeuropean-unions-building-decarbonisationplan — non-residential renovation rate 0.6%/ yr; deep renovation 0.3%/yr non-residential.
Buildings Performance Institute Europe (BPIE). (2020). On the way to a climate-neutral Europe: Contributions from the building sector.
California Division of the State Architect. (2019). California Building Code—Accessibility provisions.
City and County of San Francisco. (2013). Mandatory soft-story retrofit program.
City of Boston. (2021). Building emissions reduction and disclosure ordinance (BERDO) regulations.
City of Portland. (2018). Unreinforced masonry (URM) buildings policy.
Crowley, H., Despotaki, V., Silva, V., et al. (2020). European seismic risk model 2020. European Commission, Joint Research Centre.
District of Columbia. (2021). Building energy performance standards (BEPS).
European Climate Neutrality Observatory (ECNO), Buildings. https://climateobservatory. eu/building-block/buildings — corroborates ~1% rate, ~0.3% deep non-residential, and flags the 2016-vintage data gap.
European Commission. (2019). Directive (EU) 2019/882 on the accessibility requirements for products and services (European Accessibility Act).
European Commission (2020), A Renovation Wave for Europe (COM(2020) 662) — ~95% of current stock still standing in 2050; renovate 35M building units by 2030.
European Commission. (2020). Overview of natural hazard risks in Europe.
European Commission. (2023). Energy Performance of Buildings Directive (EPBD) recast.
European Commission (n.d.). Energy renovation of buildings (DG Energy). https://energy.ec.europa. eu/topics/energy-efficiency/energy-performancebuildings/energy-performance-buildings-directive/ energy-renovation-buildings_en — ~75% of EU buildings energy-inefficient; ~1% annual renovation rate; EPBD 16%/26% worst-performing non-residential trigger (2030/2033).
European Commission. Energy performance of buildings directive. https://energy. ec.europa.eu/topics/energy-efficiency/ energy-performance-buildings/ energy-performance-buildings-directive_en
European Commission. EU Building Stock Observatory. https://energy.ec.europa.eu/topics/energyefficiency/energy-performance-buildings/ eu-building-stock-observatory_en
European Parliament & Council (2024). Directive (EU) 2024/1275 on the energy performance of buildings (recast), Art. 9. http://data. europa.eu/eli/dir/2024/1275/oj — legal basis for the 16%/26% non-residential MEPS.
Federal Emergency Management Agency (FEMA). (2000). Recommended seismic design criteria for new steel moment-frame buildings (FEMA 350).
Federal Emergency Management Agency (FEMA). (2015). Seismic evaluation of existing buildings (ASCE/SEI 41-13).
International Code Council. (2021). 2021 International Building Code, Section 1006.3.4, Single exits. https://codes.iccsafe.org/s/ IBC2021V2.0/chapter-10-means-of-egress/ IBC2021V2.0-Ch10-Sec1006.3.4
International Energy Agency (IEA). (2022). Energy efficiency 2022.
National Institute of Building Sciences. (2019). Natural hazard mitigation saves report.
New York City Mayor’s Office of Sustainability. (2019). Local law 97 of 2019.
Niskanen Center. (2024, August 27). Understanding single-stair reform efforts across the United States. https://www.niskanencenter. org/understanding-single-stair-reformefforts-across-the-united-states/
OECD. (2021). Responding to rising risks: Resilience to natural hazards.
Rocky Mountain Institute. (2020). The economics of electrifying buildings.
RSMeans. (2023). Building construction cost data. Gordian.
Smith, S., & Mendoza, E. (2024). Point access block building design: Options for building more singlestair apartment buildings in North America. Cityscape, 26(1), 431–447. https://www.huduser.gov/ portal/periodicals/cityscape/vol26num1/ch25.pdf
Structural Engineers Association of California (SEAOC). (2017). Seismic evaluation and retrofit practices.
U.S. Department of Energy. (2021). Commercial building retrofit guide.
U.S. Department of Justice. (2010). 2010 ADA standards for accessible design.
U.S. Energy Information Administration (EIA). (2020). 2018 Commercial Buildings Energy Consumption Survey: Preliminary results flipbook.
U.S. Energy Information Administration (EIA). (2022). Commercial Buildings Energy Consumption Survey (CBECS): Table B8. Year constructed, number of buildings, 2018. https://www.eia.gov/consumption/ commercial/data/2018/bc/html/b8.php
U.S. General Services Administration. (2022). Accessibility design guidelines and cost considerations.
United States Geological Survey (U.S.GS). (2023). National seismic hazard model.
This page intentionally left blank.
