Building Economic Health in Communities
Environmental, Social and Governance Report

Environmental, Social and Governance Report
At EQ Office, we design with intention. With a portfolio of properties that spans from coast to coast and sidewalk to skyline, we are dedicated stewards of the local communities where we operate. We are deeply committed to our team members, tenants, partners, vendors and investors. All of them are our neighbors.
Although life over the past two years has been disrupted by COVID-19, the pandemic has only strengthened our purpose:
To build economic health in communities by regenerating urban spaces, preserving local culture and bringing humanity into our workplaces.
We invest in and support local talent. Through our partnership with YouthBuild USA, a global nonprofit that champions opportunity youth — young adults between the ages of 16 and 24 who are neither in school nor employed — we boosted our workforce development and diversity efforts. We expanded internship and mentorship programs to eight cities and launched a redevelopment program, first at Compton YouthBuild. We plan to repeat the renovation and refurbishment program with YouthBuild programs in more cities annually.
Our mentorship program empowers opportunity youth who are interested in trades through job exposure, professional development training and job placement that includes team members, tenants and vendor partners. We offer and encourage tenant participation across the portfolio through our impact as an amenity offering.
We’ve also committed to increasing diversity across our organization and building a more inclusive culture. This pledge pushed our team to examine our hiring practices, broaden our recruitment pipeline and evaluate supplier diversity. We are working to identify and remove barriers for diverse vendors.
Our portfolio-wide risk assessment bolstered our sustainability efforts and reduced energy consumption by 10% across our coast-to-coast properties. We exceeded our goals for sourcing clean energy with over 12 million square feet in our portfolio now using clean power. We have also increased our waste diversion footprint. Currently, 60% of portfolio buildings offer composting. We hosted sustainability education events at every property to further educate tenants, team members and vendors on how they can support these conservation and energy-saving efforts.
EQ’s 184 team members lead us forward in championing our shared values. In the coming year, we intend to tackle more areas of opportunity, particularly sustainability. First, we’ll reduce resource use and the associated costs — particularly for water. Second, we’ll improve data collection and transparency, in part by requiring green lease clauses in all new and renewal commercial leases.
This report outlines the practices that we’ve put into action and measures success on our progress to meet the two-year goals we set in 2021. We share insights into new initiatives and build accountability around our continued implementation across our three pillars:
→ Environmental: Regenerating Urban Spaces
→ Social: Preserving Local Culture
→ Governance: Bringing Humanity into our Workplaces
We have extended the reporting year for this 2021–2022 reporting period to align with the calendar year. This decision matches both financial audits and planning to ensure the highest level of due diligence. The data in this report includes the period of August 1, 2020–July 31, 2021. We will report the outcomes of our two-year goals set forth in our first February 2021 report next year in our 2023 report, measuring our progress from August 1, 2020–December 31, 2022.
We look forward to sharing our progress in the years to come and including you in our shared journey to contribute to our neighbors and communities.
Forward in purpose,
EQ Office Executive Leadership

year-over-year electricity reduction. 1 10%
70% of all properties utilize green power. 2
42 buildings in the portfolio achieved certifications including Energy Star, LEED and BOMA 360. 4
60% of portfolio buildings use composting 7
$1,942,000 in charitable contributions . 8 100% of buildings conducted risk assessments. 5
26,484 individuals benefited from job training and mentorship through community partnerships. 3
144,395 jobs supported in construction, retail, art, property management, tourism and community development.6




At every level of the organization, we focus on supporting the local cultures and communities where we live and work. We align our priorities with stakeholders through meaningful engagement with our tenants, our employees and our other operating partners. Our teams anchor this approach with five core initiatives. These efforts drive meaningful returns to our investors while enriching the places where we operate.
EQ evolved our national impact partnership with YouthBuild USA and expanded impact programs to include weekly skills-based volunteering for our employees and vendor partners. We addressed talent pipeline shortages by connecting hiring managers to hardworking and eager candidates from diverse backgrounds. Our strategy not only shared professional development opportunities, but it offered tenants the option to participate in our programs as part of our wider community.
EQ’s Art of the Neighborhood program, which began in Chicago, expanded into new markets, including
Nashville, Orange County, San Francisco and Seattle. By transforming available spaces into accessible art, we created new jobs for artists and destination experiences that benefit nearby food and beverage businesses.
We’ve enhanced our commitment to wellness as an organization by investing in a partnership with Wellable. Their platform offers virtual and in-person fitness and wellness services across the portfolio. At every property, we continue to host quarterly tenant events and promote social impact benefits that support employee and tenant engagement.
We offer a charitable matching program and eight hours of volunteer time off for all full-time employees. Through our “Dollars for Doers” program, we recognize the “Volunteer of the Quarter” and offer grants to volunteers who donate 10 or more hours of time to a single organization. We also award the “Volunteer of the Year” a $5,000 grant to the nonprofit organization of their choice.
Our charitable giving programs leverage our assets, including monetary donations, in-kind gifts of meeting and office space for nonprofits and physical items (including furniture and essential supplies).
Charitable Contributions
Current Actual: $1,942,000 Goal: $3,100,00013
We increased our charitable donations by 18% this reporting year. Our giving efforts also include →
$1,942,000 total contributions, including: $893,000 in cash donations. $656,000
$181,000 donated space value.
$212,000 in-kind donations.
248 social impact events hosted. volunteer time value with 11,534 total hours donated.
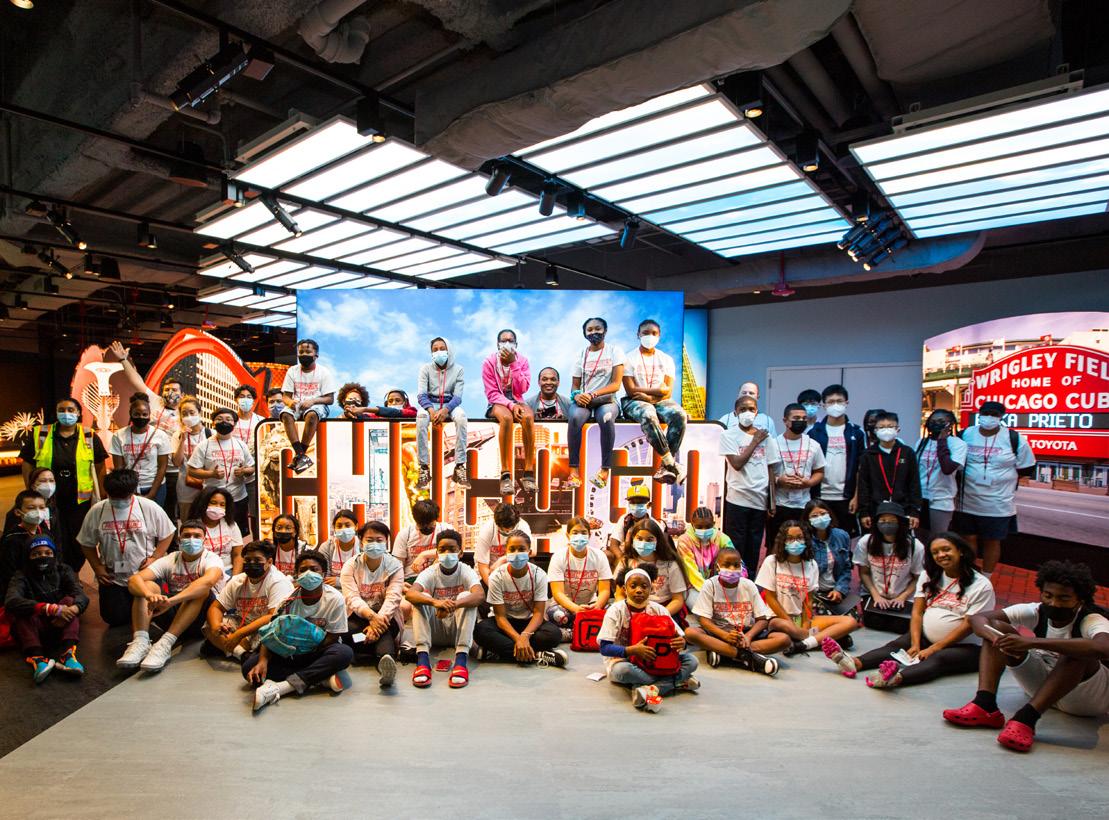
With months of planning and seven weeks of construction, we transformed the Compton YouthBuild training center into a space where generations of opportunity youth can learn and grow. We aspired to empower current and future participants to nurture their best work and discover new talents and opportunities. Plus, the project gave young people real-world, hands-on learning experiences.
We brought attention to detail and expertise into every aspect of the project. As Lisa Foyston, Director of Development at EQ Office, said, “If you really want to make a change, you go all in.” EQ and more than 30 vendor partners echoed the same idea, donating more than $1.2 million of value. “We’re not cutting any corners and we’re not sparing any expense. Everything we’re doing here is the same way we do it in a Class A high-rise,” summarized Mike Holwick at Holwick Constructors.
Our efforts to bring YouthBuild’s mission and values to life included additions and upgrades for the following:
• Acoustical Ceilings
• Data Communications
• Doors, Frames and Hardware
• Electrical
• Entrance Design
• Flooring
• HVAC
• Insulation
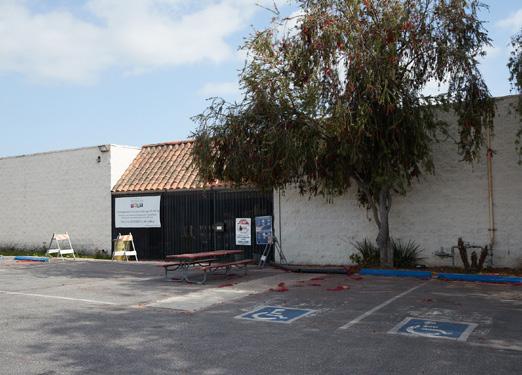
• Landscaping
• Lighting
• Millwork
• Parking
• Plumbing
• Roof Windows and Skylights
• Sustainability
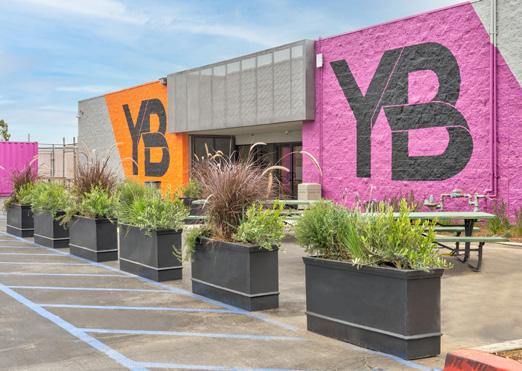
“Many companies come to Compton. They look around. They take pictures with our kids and our neighbors. They make statements about plans to help. And then we never see them again. EQ Office made good on their promise.”
Emma Sharif, Compton Mayor
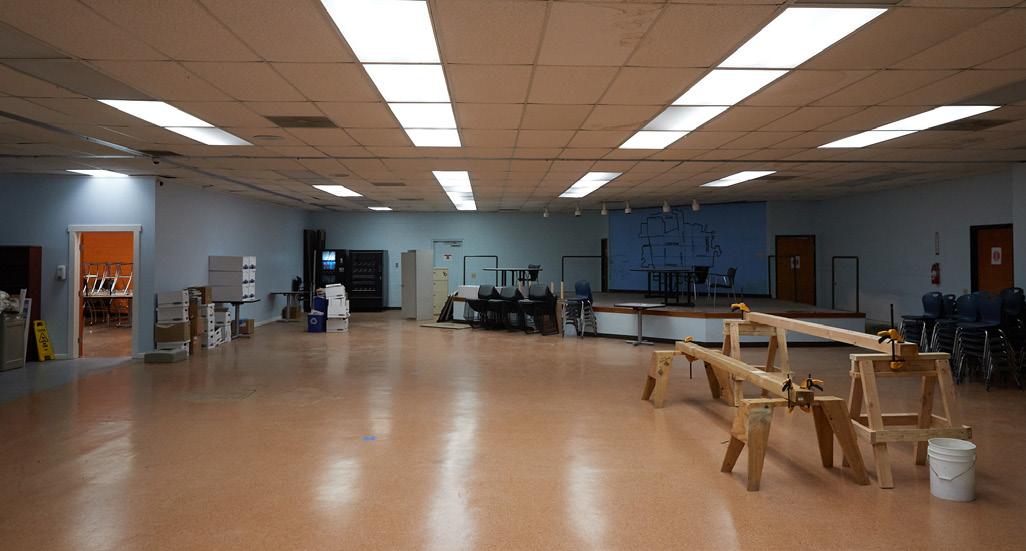
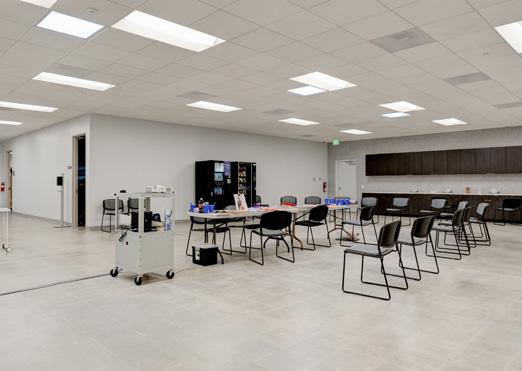
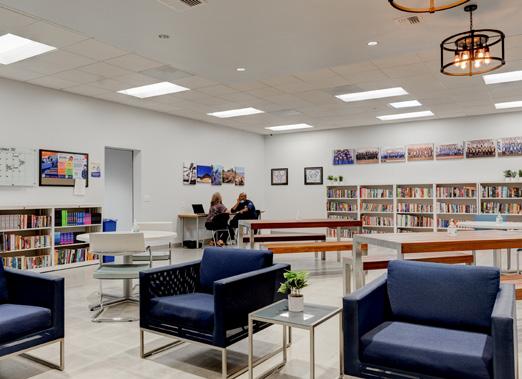
The Compton YouthBuild center can now embody its purpose in every aspect of the space from picnic tables to an updated culinary classroom that will stand the test of time. “We never had a space that reflected the true way we feel, and now I think we actually do,” said Sara Silva, co-founder of Compton YouthBuild. “How the space feels matters. It influences how long our young people are willing to stay.”
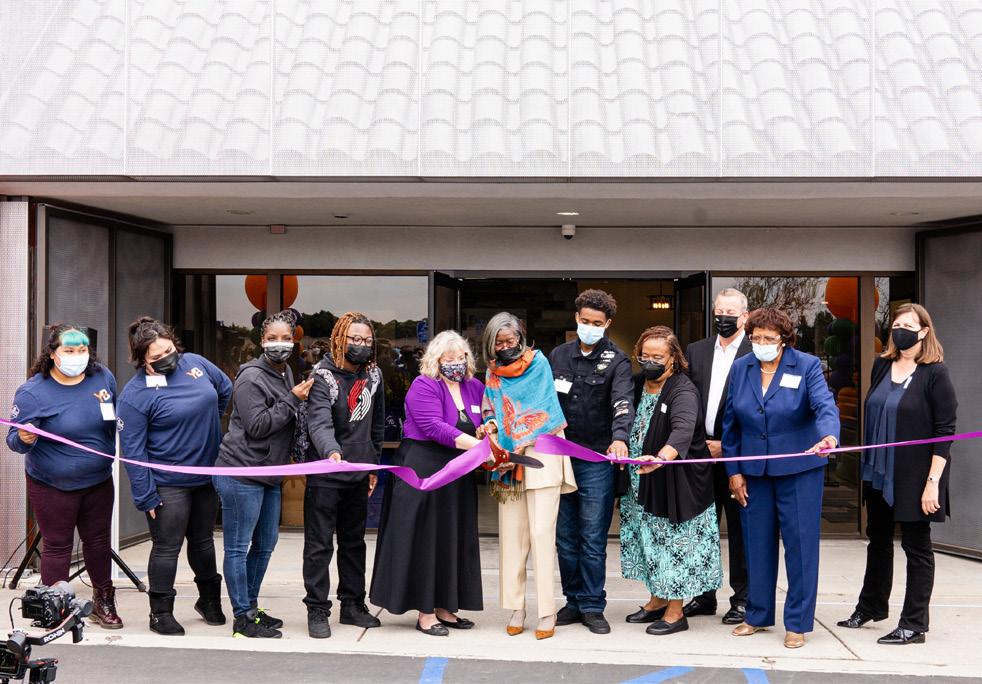
Our 31 vendor partners often commented that Compton reminded them of the neighborhoods they grew up in. They related to YouthBuild students. “Learning about this program sits somewhere close to the heart for me. It reminds me where I come from. This seems like a simple construction plan, but it’s actually going to change generations,” said Zach Valdespino, a Superintendent at Holwick Construction.
In total, EQ and our partners contributed over $1.2 million dollars, including 5,616 hours of donated labor and $196,000 of in-kind donations of furniture and building supplies. More than 125 students per year will benefit from this transformed space for decades to come. We plan to refurbish one new YouthBuild building per year, ensuring more opportunity youth feel inspired to do their best work.
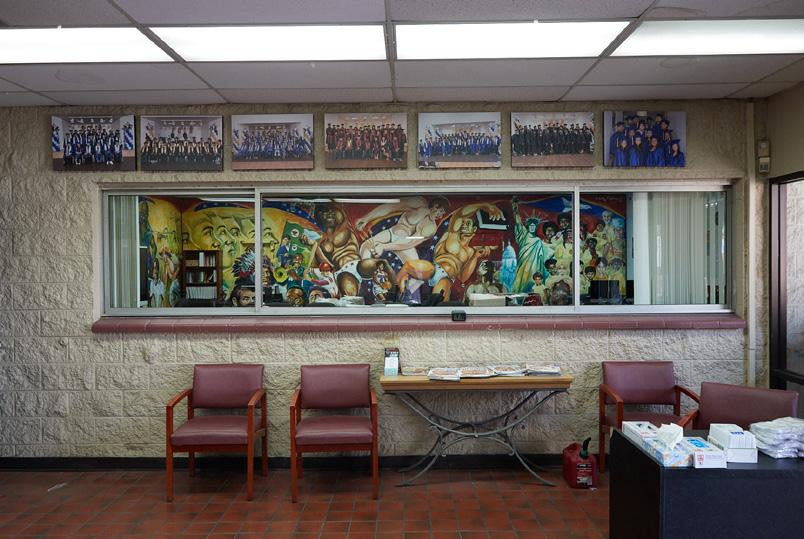
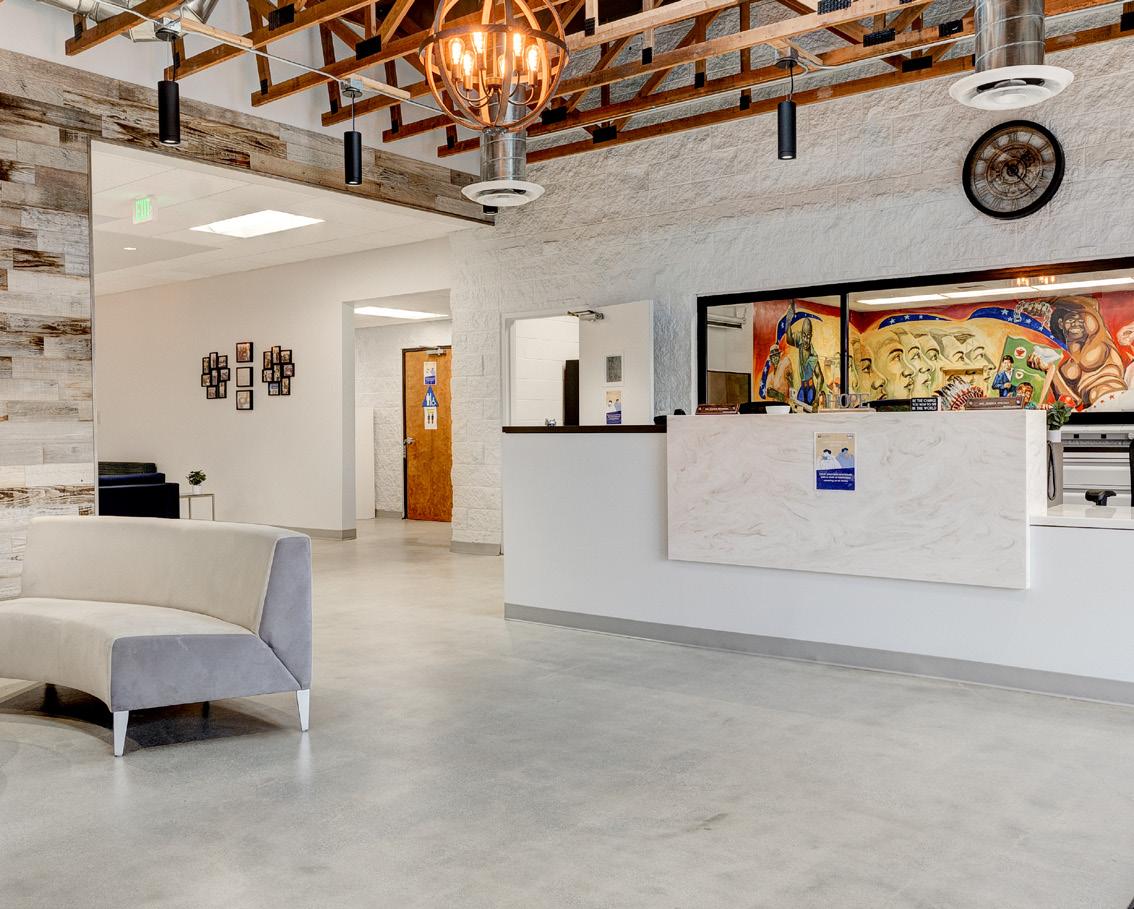
Job creation and skills training are cornerstones of EQ’s social impact initiatives. In partnership with nonprofits operating on the ground — and in collaboration with our tenants and partners — we’ve unlocked record-breaking impact in our communities and offered people access to life-changing opportunities. By providing impact as an amenity, we also support our tenants’ and partners’ aspiration for purpose-driven work.
Professional Development & Job Training for Community
We made significant strides towards this goal, with the below outcomes ↓
Creation & Sustainment
Our shared efforts in this area resulted in ↓
people received job training through key partners, including YouthBuild and CareerVillage.
61 professional development events.
$251,000 spent on professional development events and trainings.
$864,000 spent on job training investments through charitable partners.
144,395
26,484 jobs.14
107,813 construction jobs.
1,440 retail jobs.
33,693 transportation and tourism jobs.
1,130 property operations jobs, including janitorial, engineering and security jobs.
272 additional jobs in property support.
47 art jobs.
Case Study: EQ Mentorship-to-Internship Program
EQ Impact and YouthBuild partnered from coast to coast: Seattle, Los Angeles, Chicago, Harlem and Boston. This program empowered students with job exposure, mentorship, training and job placement at EQ Office and with our vendors and tenants.
The COVID-19 pandemic prompted widespread human capital challenges that required new strategies to fill staff shortages and boost talent retention. We built our mentorship-to-internship program to address these concerns, providing win-win-win opportunities for students, vendors and smaller tenants.
Our weekly training sessions went beyond the hard skills youth needed to thrive on the job and incorporated soft skills taken from EQ’s EQU training program, including personal presentation, selfawareness, communication skills, conflict resolution and self-advocacy. We also supported resume development and conducted hundreds of mock interviews. The program included a total of 37 training sessions in different cities throughout the 2021 reporting year.
Our local properties complemented these soft skills trainings with additional forms of support for the internship and beyond. We offered students work clothing when needed, transportation to job sites in the form of Lyft cards and bus passes and prep sessions for weekly meetings with their internship supervisors.
Our employees, tenants and vendor partners were able to volunteer, honing their mentorship capacity, public speaking skills and sense of meaning on the job. Together, we ensured that students continued to advance their careers throughout the COVID-19 pandemic while providing top-notch talent for open jobs.
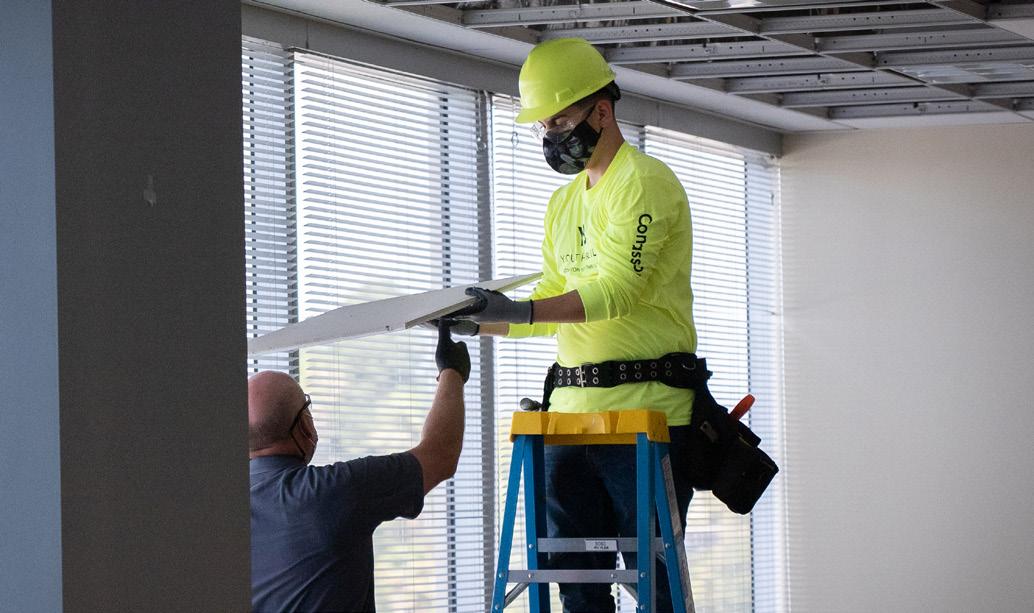
Students in the program gained construction and building management experience through our Compton YouthBuild renovation project. This initiative brought together 140 volunteers to lead 16 YouthBuild students through more than 500 hours of training in all aspects of construction, giving them critical job exposure across a wide range of trades:
• Electrical
• Landscaping
• HVAC
• Engineering
• Painting
• Flooring
• Drywall and Cement Masonry
• Plumbing
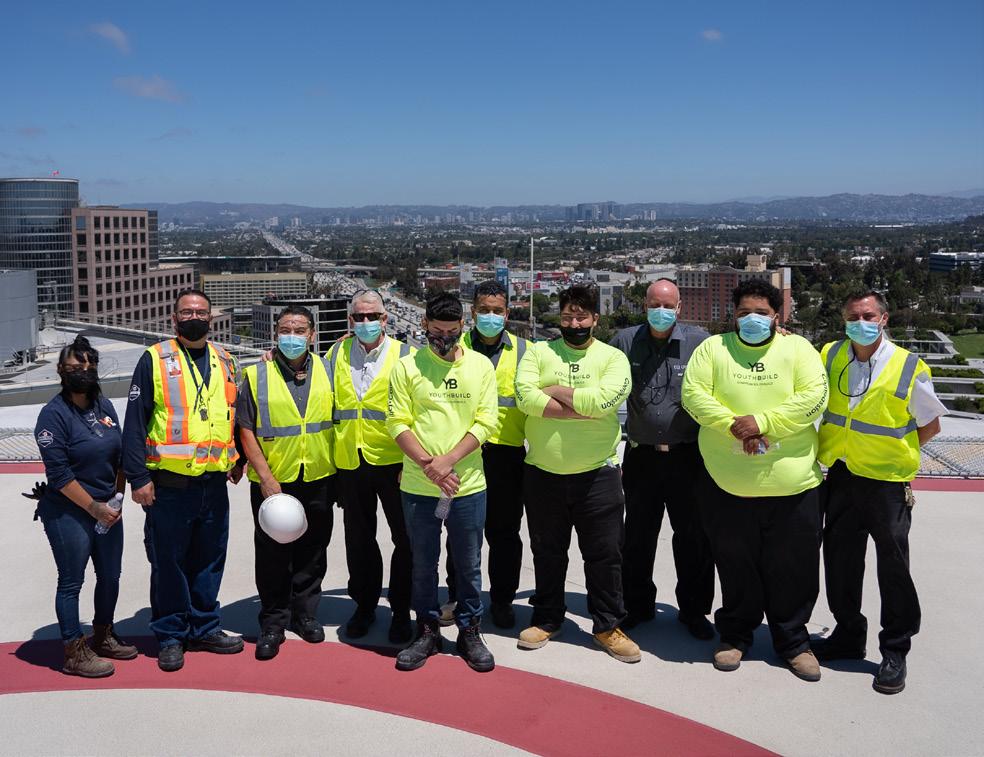
The internships at the Compton YouthBuild renovation project led to multiple job opportunities at EQ Office. For example, YouthBuild alumna Maria Diaz accepted a building position at EQ Office’s Playa District campus after participating in the project as a construction assistant. Diaz’s parole officer initially placed her in YouthBuild when she was 16 years old.
“Joining YouthBuild made me see everything different . . . I have three kids to go home to. I do it for me, and I do it for them.”
Maria Diaz, YouthBuild program graduate
These success stories extend to every internship program across every location. In Seattle, we helped secure full-time positions for five formerly homeless students to work at Anderson Construction and Landcare.
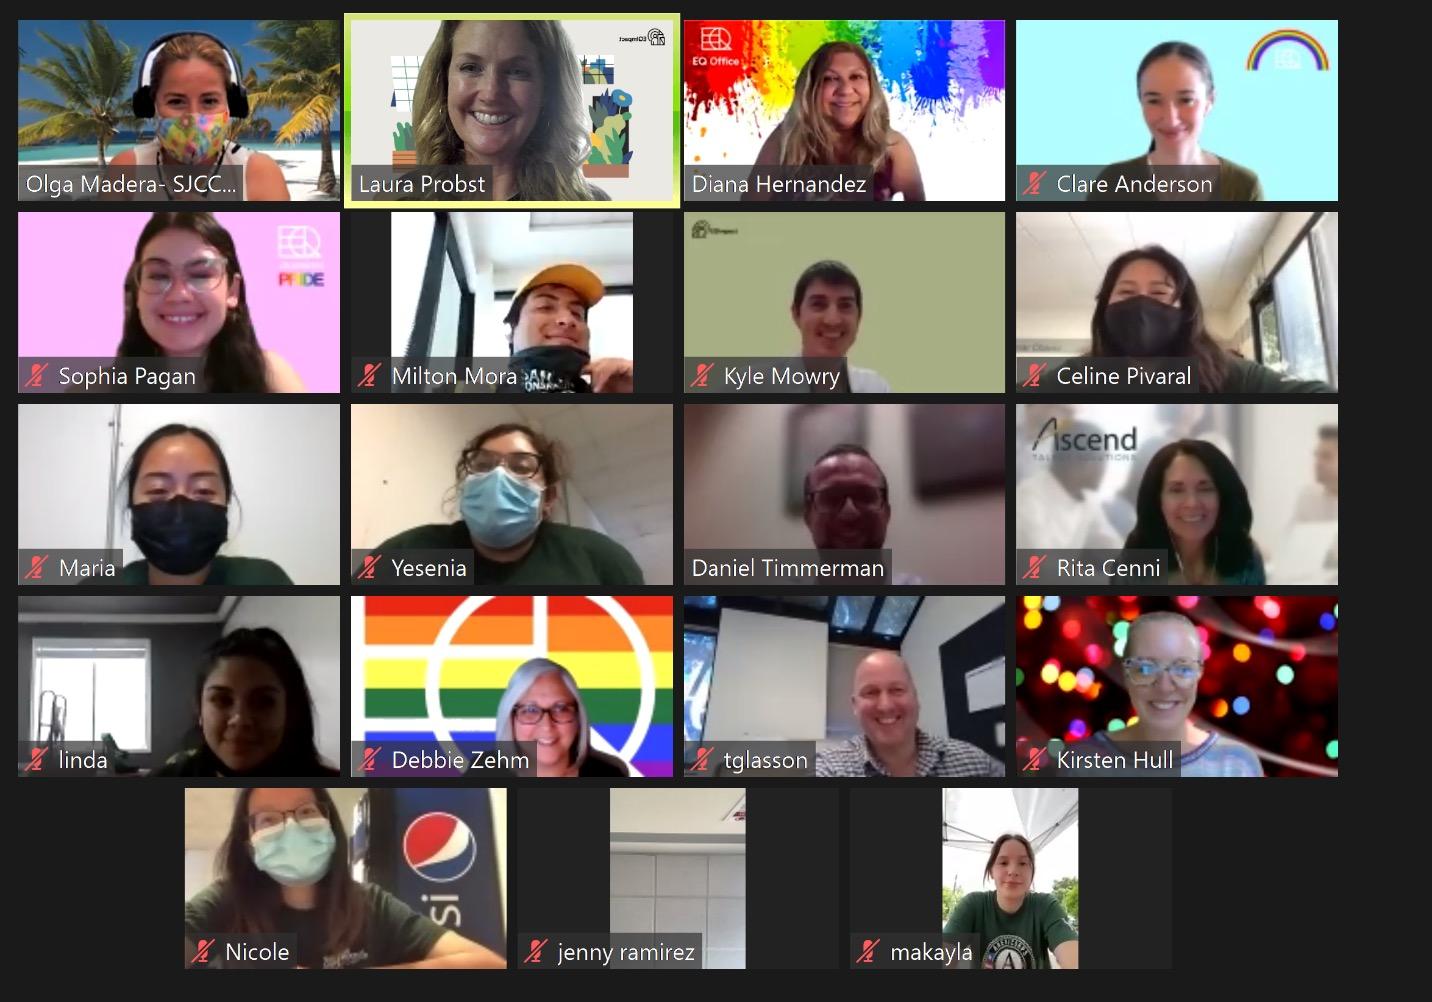
Because of the continued COVID-19 pandemic, we reshaped our approach to boost the number of community members benefitting from subsidized community wellness by 25%. We previously focused on community health events, subsidized gym memberships and fitness classes. We are now concentrated on the health and safety of our buildings, and we've made strong progress:
100% of reported buildings have made changes to support health and wellness, including setting goals, implementing new actions, monitoring performance and seeking verification.
59 buildings are working towards the WELL Health-Safety Rating (“HSR”) Certification.15
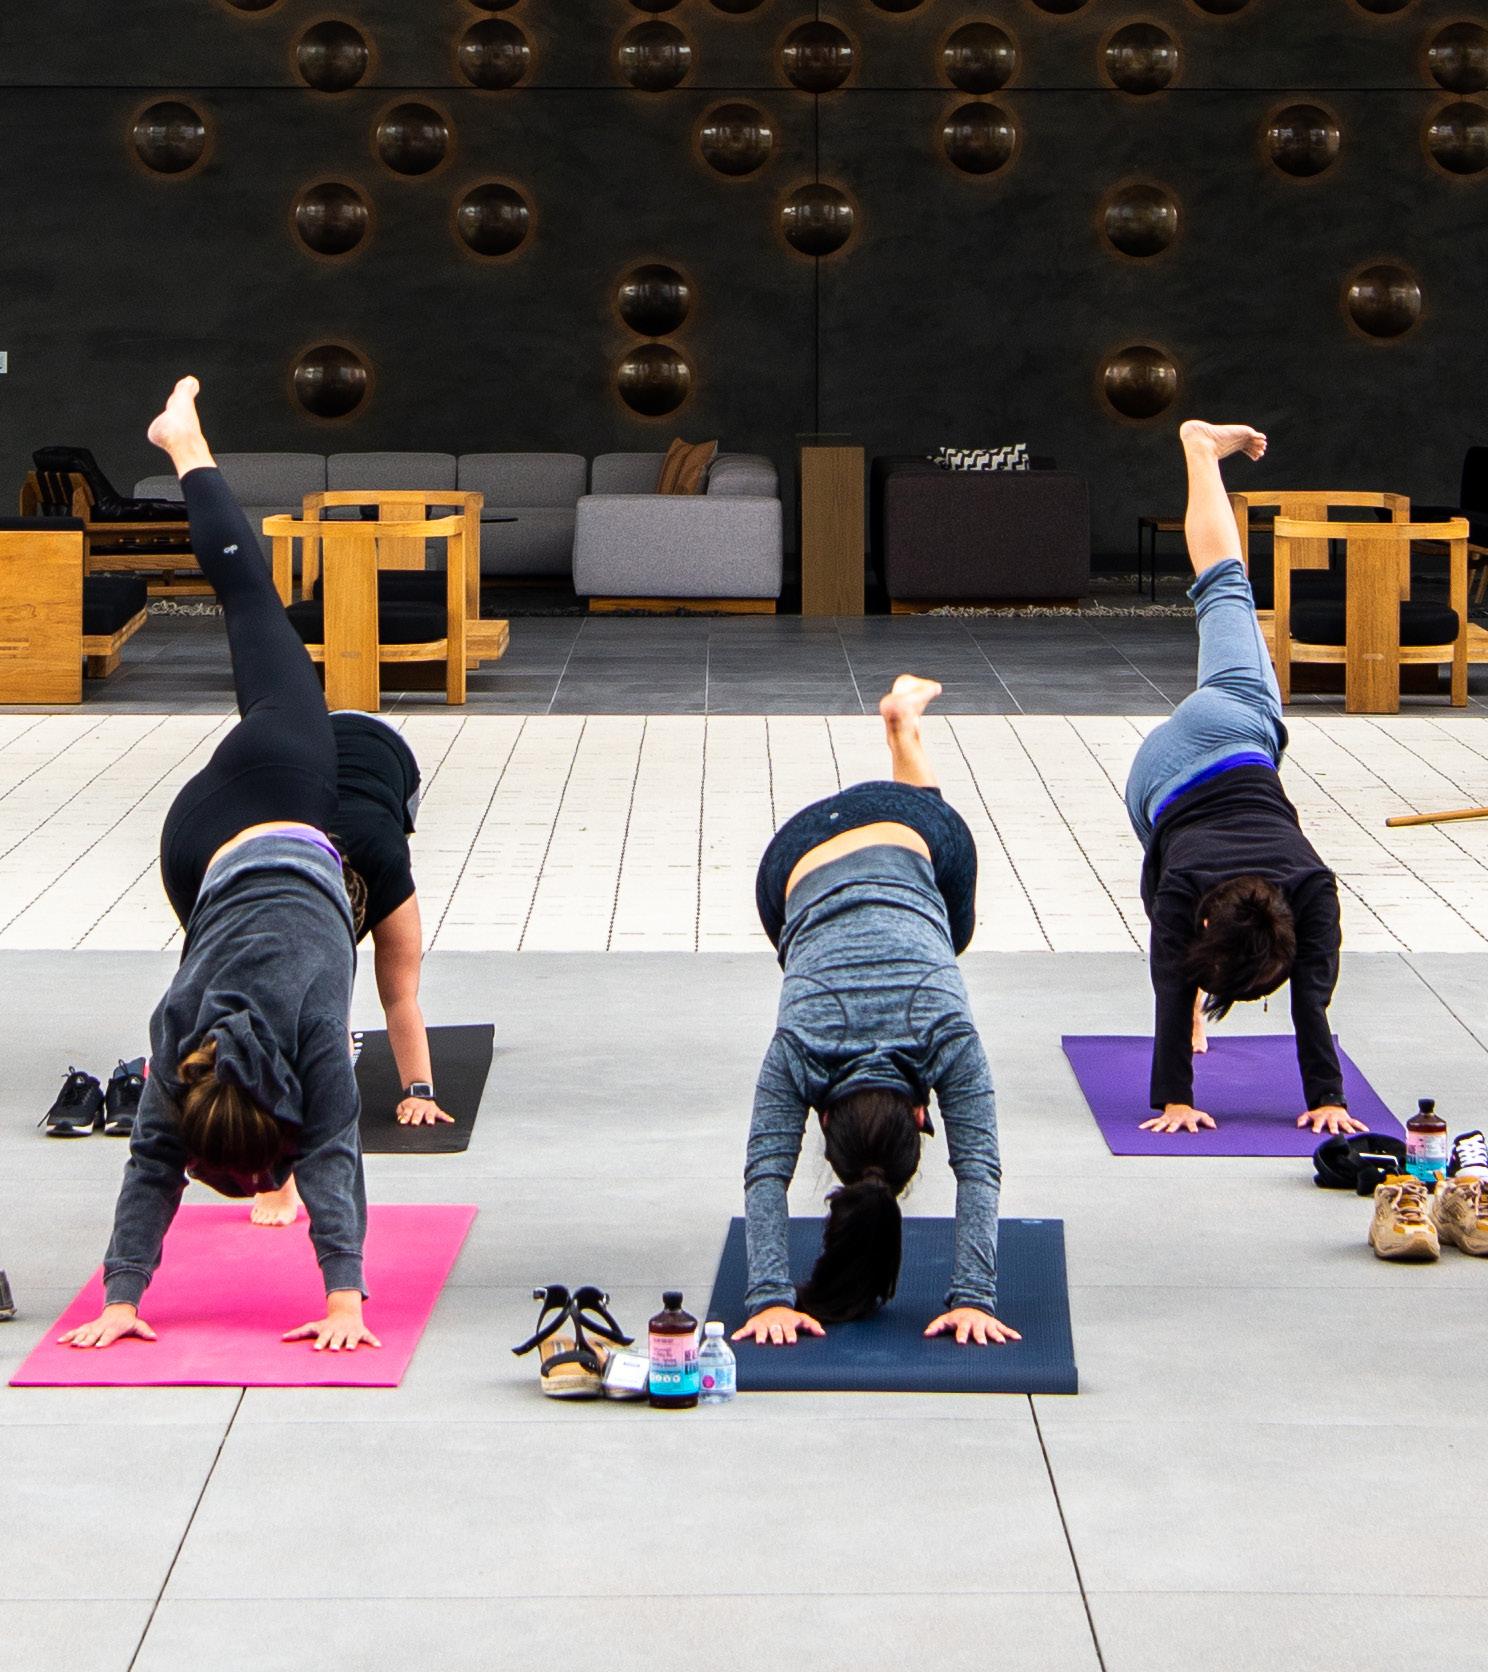
The health and wellness of our team members, our tenants and our community at large are still central to our focus as an organization. We partnered with Wellable to bring classes, including meditation, restorative yoga, philanthropy and more workshops to remote team members and tenants.
We have increased our investments in the health and safety of our buildings and campuses with evidencebased practices and responsiveness to tenants. Our teams also enhanced our indoor air quality testing protocols and adjusted operations of our HVAC equipment in accordance with WELL Health-Safety Rating (“HSR”).
Central to this effort, we are pursuing a WELL HSR certification, a safety rating for facility operations and management. The certification is third partyverified, informed by the WELL Building Standard and more than 600 experts from the task force on COVID-19.
We made additional strides in pursuit of our health and wellness goal, including ↓
939 free fitness classes and 21 free community health events.
$37,000 of investments in health and wellness.
40% of properties provide acoustic comfort, also known as soundproofing.
73% of properties have a fitness center.
57% of properties offer healthy eating options on site.
90% of properties have inclusive design features.
90% of properties have lighting controls and occupancy sensors.
IAQ Certifications
67% of properties incorporate biophilic design through planters and plant walls.
Goal: 6 Properties Current Actual: 30 Properties
Goal
Obtain IAQ certifications for at least 20% of portfolio.
Achieved 100% of buildings seeking WELL HSR certification for common areas, which includes certification of air quality.
90% of properties are fewer than 1,000 meters from public transportation.
87% of properties have common areas that offer social interaction and community.
Our air quality improvements also included ↓
83% of buildings conducted air quality testing each quarter
97% of properties move stagnant water sources weekly.
80% made upgrades to air filtration systems.
$130,000 invested in IAQ testing with 86% of buildings within acceptable limits.
90% of properties increased the run time for HVAC (at least one hour before and/or one hour after regular office hours).
$183,000 invested in IAQ upgrades.
We ensure our buildings bring in economic value to their neighbhorhoods by investing in local art, sharing public green and gathering spaces and supporting tourism.
Below is a snapshot of our accomplishments ↓
$69,200,000 of economic value added through tourism.16
12 properties are beekeeping engagement sites.
73% of properties have public access spaces.
We plan to continue these investments and to identify new ways for our properties to serve as vibrant contributors to local economies.
$1,086,000 invested in new public access places.
37 works of art purchased.
$133,000 invested in art installations.
Case Study: Art of the Neighborhood
Case Study: Art of the Neighborhood
We invest in public art to activate creativity and enhance the day-to-day lives of our neighbors, tenants and team members. By investing in and showcasing the talent of local artists, we are creating more dynamic reflection spaces for the public to enjoy.
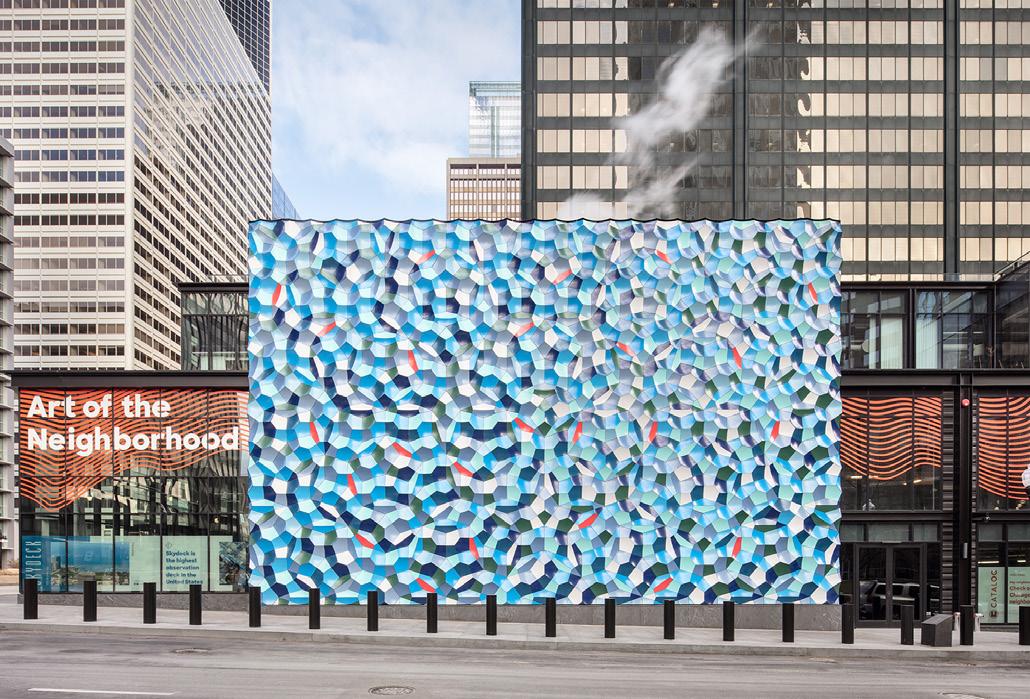
At Willis Tower in Chicago, Illinois, we commissioned and installed six different artist series that transformed our spaces — and the nearby sidewalk — into living art galleries. The “Atmospheric Wave Wall” created by notable artist Olafur Eliasson on Jackson Boulevard matches the scale of Willis Tower and the natural landscape of the city. At 30 by 60 feet, the pattern of curving metal tiles in serene blue, deep green and white mirror the surfaces of Lake Michigan and the Chicago River. As the sun moves across the piece throughout the seasons — and as people walk, drive or bike by — the colors shift as they do in natural bodies of water. At night, rays of light peek out between the metal tiles.
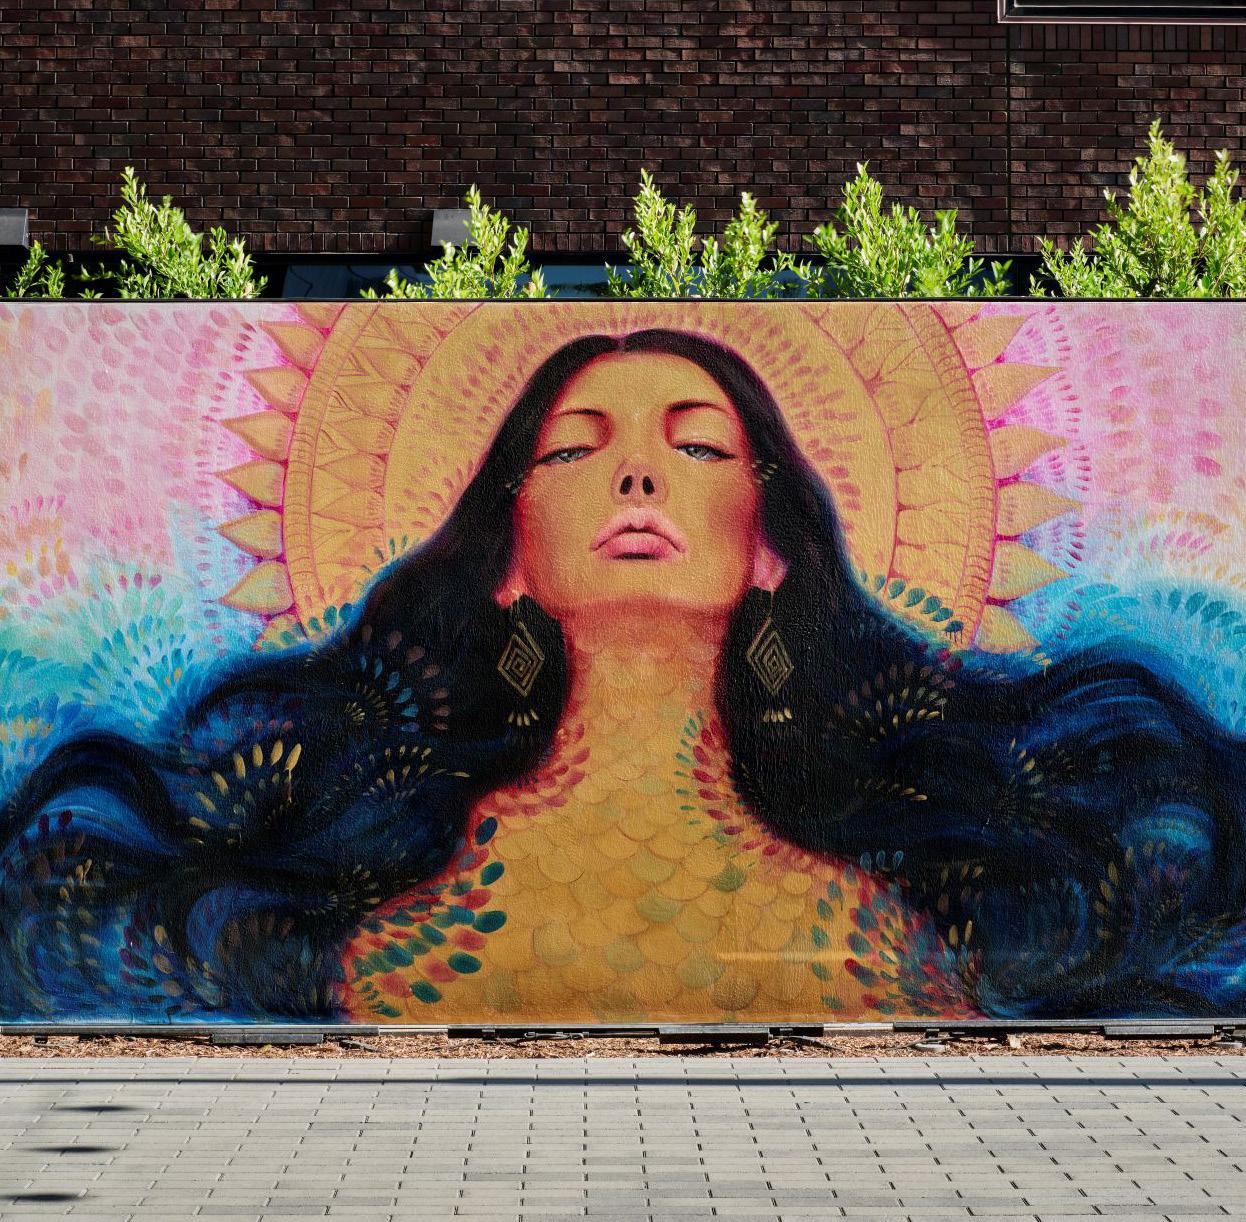
At CANVAS in Costa Mesa, California, the local team participates in the broader South Coast Metro's Public Art initiative. They commissioned works from 18 local artists who reflect the diversity of CANVAS and the Costa Mesa community. Charmaine Olivia’s work, for example, captures the human experience of self-discovery with color and imagery of goddesses.
The COVID-19 pandemic affected occupancy in our spaces. We have made extra efforts to open up unused space for public art projects to offer safe, socially distanced activities for our neighbors, which also supports our retailers and food and beverage partners.
Tenant Engagement
We are well on our way towards our two-year goal, with additional achievements including ↓
249
community engagement events held, an increase of 157% over the prior year.
104 team members engaged in optional programs as part of the ESG task forces and initiatives, representing 57% of the organization.
77% of properties have tenant feedback mechanisms in building apps, as well as surveys,
social media and direct access to building staff.
53% have social media accounts, with 37% of accounts experiencing year-overyear engagement growth.
100% invested in electronic mass tenant communication systems.
$9,162,000 invested in new technology systems.
In addition to property-specific events, EQ hosts portfolio-wide education and engagement experiences, including:
→ Drive for Knowledge connects professionals to opportunity youth nationwide for mentorship. Through CareerVillage, our tenants and team members share career advice with young people from diverse backgrounds. They crowdsource answers to questions from curious students about different vocations.
→ Social Week of Giving gives tenants an opportunity to join in our annual company-wide dedicated week of giving back to our communities. These activities strengthen professional skills and help tenants learn sustainable practices and preserve local communities. Details on our 2020 results are available here.
We strengthened the tenant experience through service-based, sustainability, wellness and professional development programming, as well as quarterly portfolio-wide events. These experiences enriched the lives of tenants while giving back to meaningful causes.
We also continued proactive communications around the COVID-19 pandemic, issuing 38 COVID-19 tenant communications and inquiries. Ninety-four percent of tenants were satisfied with EQ's handling of the pandemic.
→ Be Wise with Waste engages RecycleCoach in an interactive virtual tutorial and quiz program that educates tenants about waste reduction, as well as composting and recycling practices that limit the carbon footprint at home and at work. EQ planted a tree for every participant in this year's live training, totaling 430 trees.
→ Earth Week: Reduce, Repurpose, Refresh gives tenants a series of educational and earth-friendly events from an Earth Day Scavenger Hunt to a trivia event. This year, we made a donation to Conservation International on behalf of every participant.



EQ has researched and implemented innovative energy, water and waste initiatives that range from low and no-cost operating improvements to capital-intensive retrofits across the portfolio.
We systemized our evaluation and reporting procedure on sustainability initiatives to identify opportunities for improvement and set achievable goals. Our new standards require green lease clauses in all new and renewal leases and whenever possible in amendments. At every EQ property, teams leverage circular design by retrofitting and repositioning projects. Both our team members and our partners prioritize sustainable procurement of materials and reusing or repurposing products and spaces whenever possible.
Our Environmental Committee, an employee-led group, continues to guide and enhance our commitments to sustainable business practices and establishes benchmarks that ensure quantifiable progress. Our Green Teams, comprised of representatives at each property, lead sustainability efforts at the property and local community levels. Through the work of these teams, we benefit from significant cost savings that we reinvest into our communities. In this reporting period, we've focused our efforts on the following six core environmental initiatives:
Our team committed to ethical waste management and made dramatic progress to reach our organizational goals. During Earth Month in April, our properties held e-waste collection events, earth day fairs and farmers markets. We also leveraged our social media accounts to promote local businesses that valued waste reduction and other sustainability practices.
We surpassed our two-year composting goals a year early. We now have 43% of properties composting — and 60% of buildings composting — as compared to 22% of properties and 17% of buildings composting in 2020. In 2022, we’re setting our sights on continuing to reach zero-waste targets.
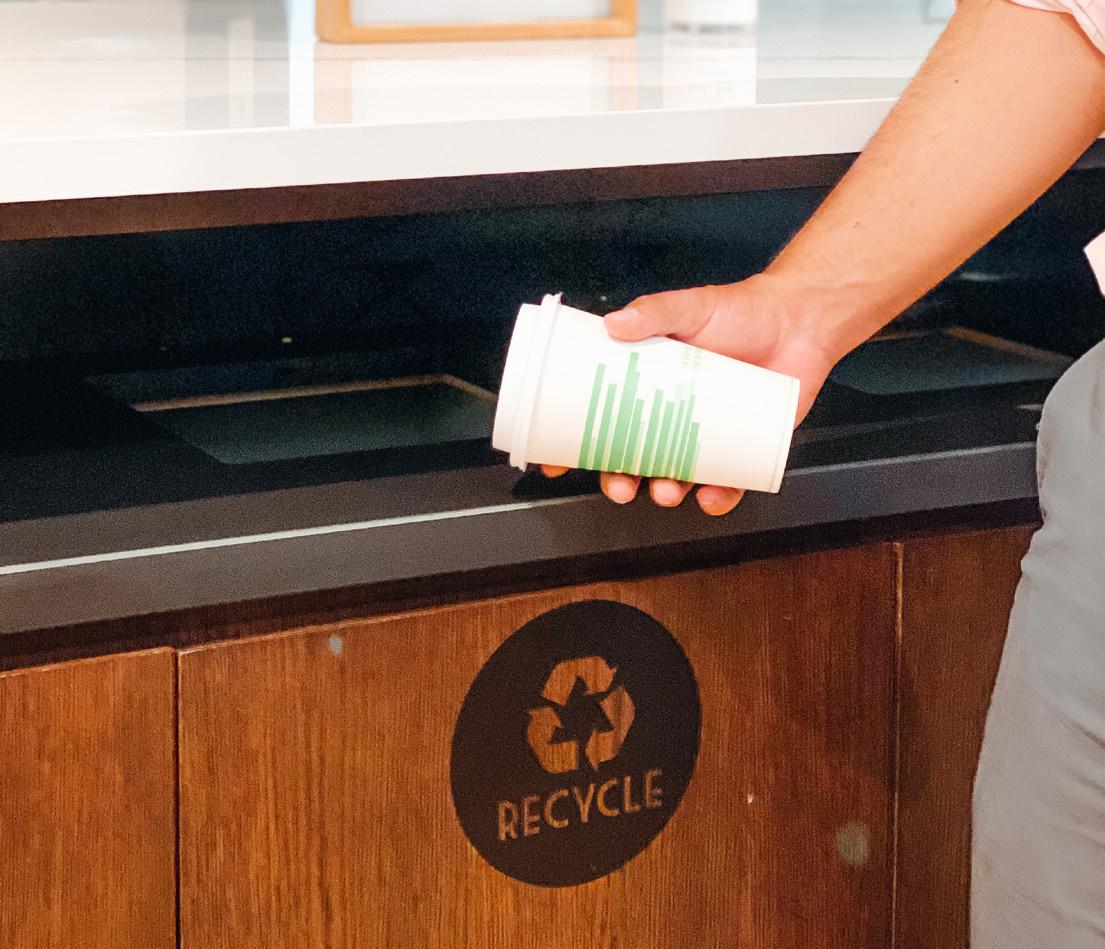
Our efforts towards waste reduction also included ↓
18,142 tons of waste generated.
5,532 tons of waste recycled. $247,000 invested in recycling contracts.
50 tons of electronic recycling.
5,812 tons of waste diverted from landfills.
13% of portfolio properties conducted a waste audit.
41 recycling events were held from coast to coast.
2,348 tons of items collected to donate for repurposing, at
$353,000
We made significant efforts to increase composting, resulting in ↓
Our progress toward this goal included ↓
10,347 tons of construction waste generated.
$1,021,000 investment in recycling of construction materials.
5,157 tons of construction waste recycled.
60% of buildings in our portfolio have composting programs.
43% of properties offer composting programs.
Composting Programs
Goal: 8 Properties
Current Actual: 13 Properties
Goal
Launch composting programs at 10% more portfolio properties.
Achievement 186% more portfolio properties with composting programs to date.
280 tons of waste composted.
Both our organization and local campuses vet vendors and contractors to ensure that they align with our commitment to sustainability. We’re at the forefront of the industry in the rigorous standards we set for green construction and building materials.
Procurement
We made additional efforts in pursuit of our local procurement goal, including ↓
33% of projects used local materials supplied by a vendor or a supplier within 500 miles of the building.
43,450 pieces of local materials were used, including lumber, electrical, HVAC, sprinklers, light fixtures and ceiling tiles.
We invested in local cultural materials18, including
154 pieces of cultural material incorporated into projects.
$375,000 invested in local and cultural goods.
Case Study: Sustainable Construction in Action EQ’s industry-leading business model repositions current spaces rather than creates new spaces from scratch. We repurpose existing materials during redesigns with a holistic perspective, prioritizing sustainability in collaboration with our vendor partners and tenants.
When Compton YouthBuild asked us to redesign their space, we took an inventory of every product and component in local EQ campuses to identify what we could repurpose. Their center needed new furniture to replace the old, mismatched, uninspiring furnishings throughout the center. Because of a leaky roof, their ceiling tiles were stained. All of their shelving was also haphazard, worn and torn.
Rather than use brand new materials, we repurposed the following to transform Compton YouthBuild’s space:
• 36 linear feet of plastic laminate millwork relocated, valued at $40,000.
• $125,000 worth of Knoll furniture.
• 9,000 square feet of ceiling tiles.
• Wood doors, frames and hardware for classrooms.
“We have a tenant who wanted exposed ceilings, and the ceiling tile was in great shape. So, instead of those going into a landfill, the students are going to help stack the ceiling tiles and we’ll reuse it. It’s a win-win.”
Lisa Foyston, EQ Office Director of Development
Our team takes the same creative approach to sustainability that we do in every aspect of redesign and repositioning. In one space, the team was able to repurpose $190,500 of materials that would have ended up in a landfill. We diverted 47.83 tons of waste (91%) and incorporated thousands of recycled products into the new design.
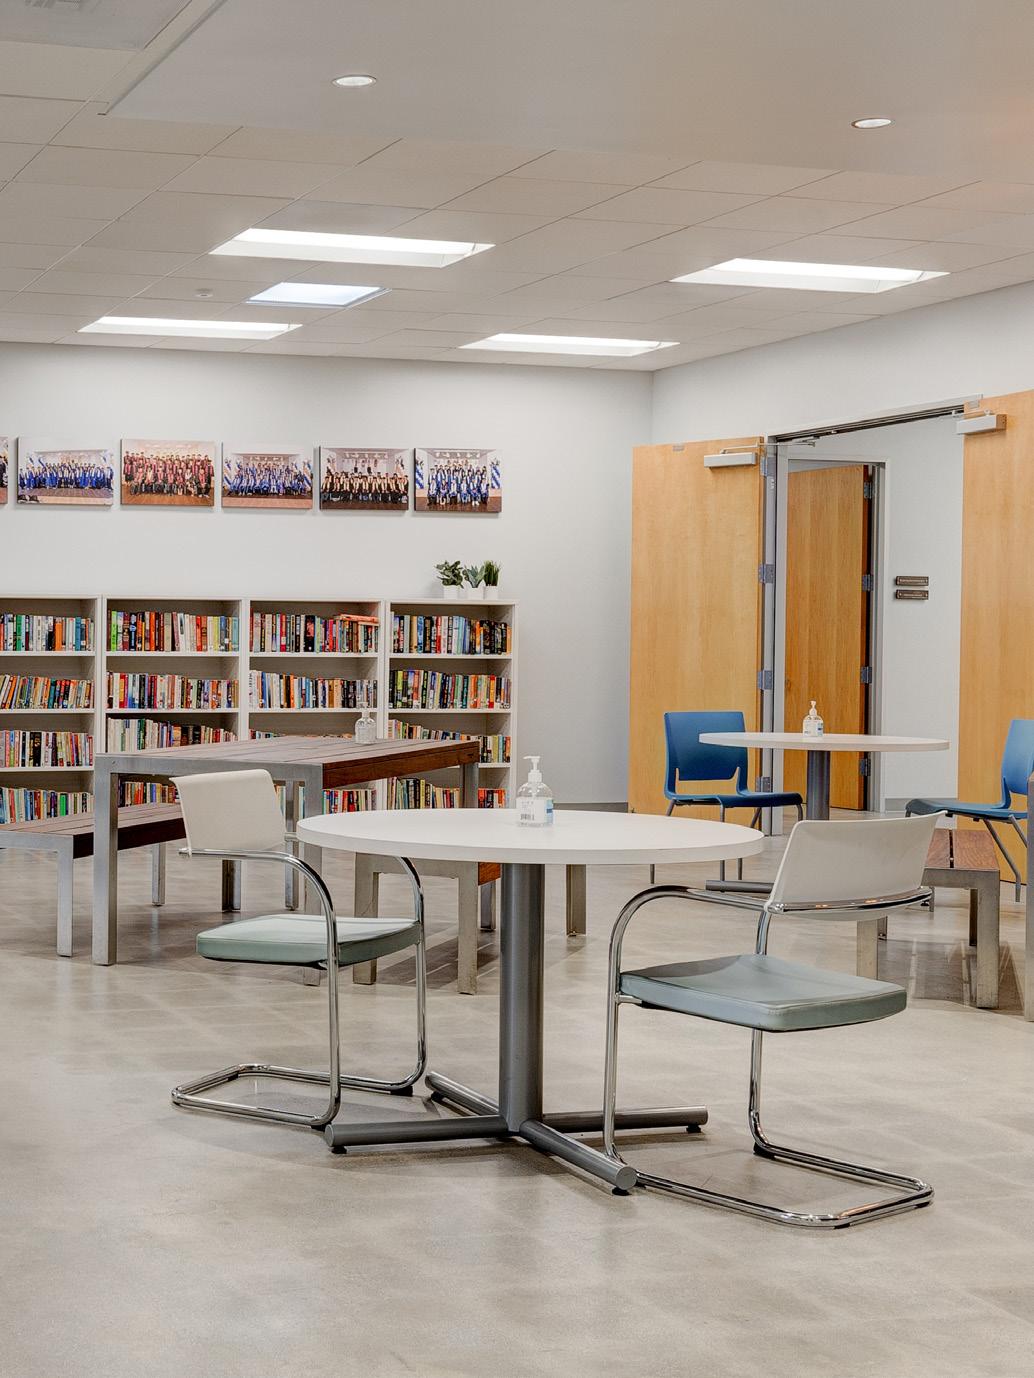
Water conservation has never been more important. We have refined our efforts to save water and encourage conscious water use among our tenants at every property. In 2021, we faced unanticipated operational changes necessitated by COVID-19. Fewer occupants meant that our properties required more frequent flushing, which increased our water consumption in some areas. We’re confident that as occupancy rises, we’ll be able to reduce water use moving forward.
More information on our portfolio’s water consumption includes →
$1,839,000 spent on water with 3% savings.
93% have reporting data for their whole campus versus a portion of the campus.
50% implemented water efficiency projects between August 1, 2020–July 31, 2021.
66% exclusively use low-flow sinks, toilets and urinals.
Environmental resiliency plans are central to preparing for and adapting to changing conditions. We know that withstanding and recovering from attacks, natural threats and disruptive events requires that we build resilience. EQ both assesses risk and resilience across each property while mitigating future challenges with extensive risk management plans. We set new standardized requirements across our portfolio with best-in-class practices from the National Fire Prevention Association (NFPA) 1600. These standards also account for local differences and needs based on geography and location.
We took additional steps to optimize resiliency, including ↓
of properties are monitored by electronic security systems 24/7/365.
100% of buildings have a fire protection system that meets or exceeds code.
of buildings have a mass tenant notification system.
of buildings have team members who are cross-trained in facilities and engineering operations.
94% of buildings educate tenants on emergency response and protective actions for life safety and ensure drills are conducted at all buildings.
95% of buildings had all employees and thirdparty contractors completed an annual corporate cybersecurity training.
46 buildings wrote a physical security plan that describes security procedures.
92% have uniform emergency plans that detail how to prepare for and respond to emergencies. We’ve taken action to create plans for buildings that need them.
95% of buildings have a preventative maintenance program.
Environmental Strategy & Results
Case Study: Mitigating Risks to Biodiversity Loss With Beekeeping
Case Study: Mitigating Risks to Biodiversity Loss With Beekeeping
Biodiversity loss poses alarming risk to our communities. Seeing the growing attention this issue has received, we're supporting biodiversity wherever and whenever possible. Our teams launched an exciting mitigation measure with bees.
Bees are crucial to biodiversity around the globe. Due to a complex mix of parasites, poor nutrition, habitat destruction, pollution, pesticides and climate change, they’ve been dying off at record rates. Our new beekeeping initiative with Alvéole mitigates risk to biodiversity loss in our communities. We adopted 1.1 million bees who live in hives across six cities at twelve of the company’s properties.
At 350 N Orleans in Chicago, we invited beehives onto our 5,000-square-foot rooftop patio and planted pollinator-friendly plants that would serve as the ideal ecosystem for the bees. Local artists painted the beehives in harmony with the Art of the Neighborhood initiative. The bees became a talking point with tenants, not only at 350 North Orleans but across all 12 locations where they live.
1.1 million bees.
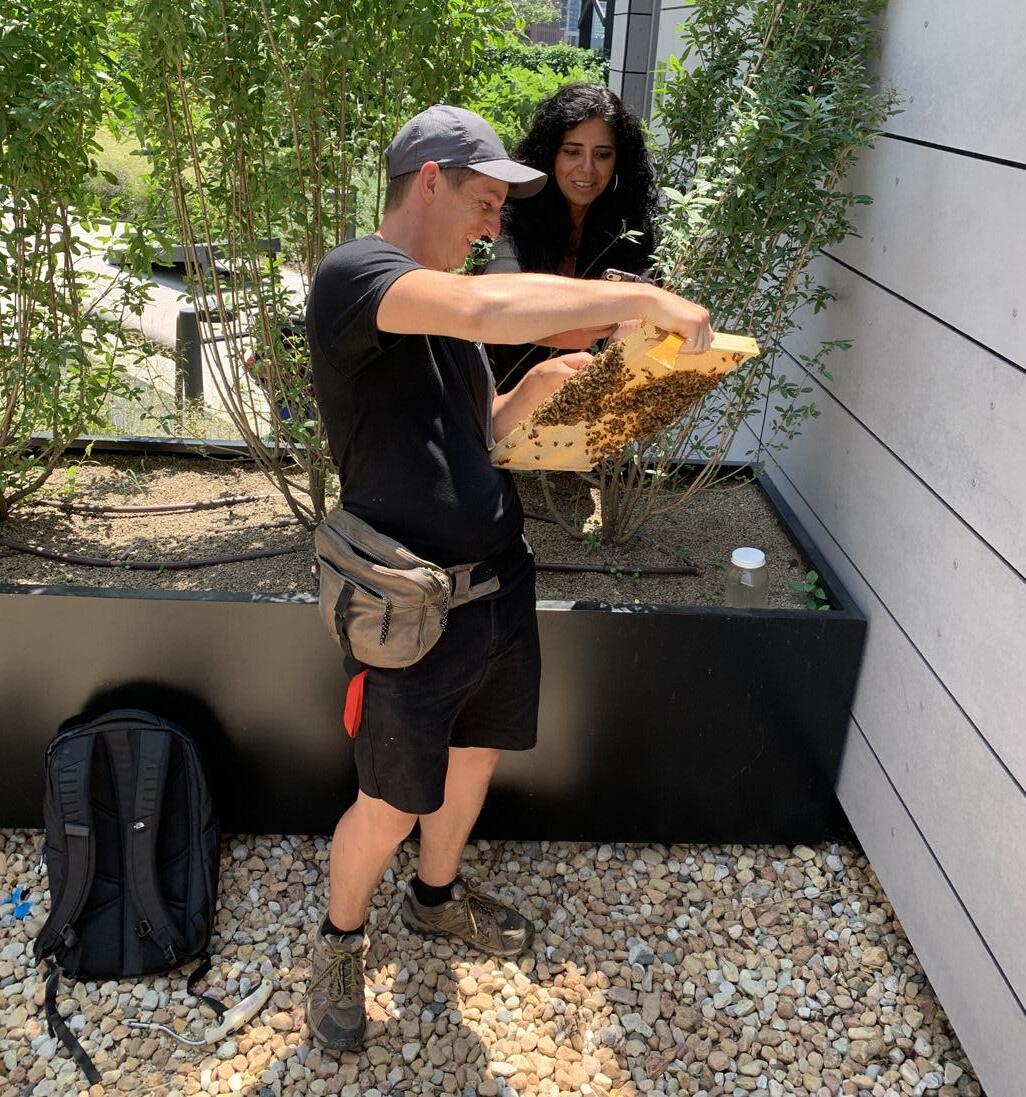
30 in-person or remote bee workshops this year
12 locations across six cities.
300+ people engaged with the bee initiative.
22 bee hives.
153 square miles pollinated.
660 pounds of honey harvested.
2,200 jars of local, raw honey produced and distributed.
Lowering our carbon footprint begins and ends with prioritizing clean energy and strong conservation efforts. For the wellbeing of our local ecosystems and communities, we’re implementing aggressive standards that ensure adherence to our goals.
Our efforts to lower energy use hinge on three strategies:
• Reducing energy consumption as an organization.
• Investing more than $5.7 million in clean energy.
• Driving down emissions in newly acquired properties.
$28,805,000 total energy cost.
260,286,124 kWh
27,657,024 difference in usage in kWH from last year.
60% of campuses collect gas heating data, and 10% collect steam heating data.
$3,286,000 savings from last year (10% year-over-year savings).
63% of properties have electric vehicle charging stations.
92 electric vehicle charging stations across campuses.
93% of properties have a building management system (BMS).23
69% of buildings participate in clean energy programs.
38% of energy purchased is clean power.
$11,030,000 invested in clean energy.24
This year, EQ acquired a new property, Coleman Highline. As we reposition the space, we developed a plan to reduce emissions by 15% over the next three years. First, we will add the property to our portfolio management tracking and planning systems. Our best-in-class technology will evaluate building run times and efficiencies. We’ll then collaborate with the property management teams to foster tenant awareness of our goals. When possible, we’ll use carbon dioxide sensors 26 and VFDs27 on sully and exhaust systems to control fresh air on floors. Our team will complete a full building audit of all lighting in common areas and transition to LED lights with a full relamp.
We will ensure all future tenant improvement projects include Energy Star appliances and motion sensors that trigger LED lighting to minimize energy consumption. Our teams will upgrade controls to DDC28 for more precise control over HVAC and lighting operations. We will also use low-flow faucets in kitchens and break areas. Among our tenants and community, we will always promote best practices to reduce energy use and spend.
7,232,974
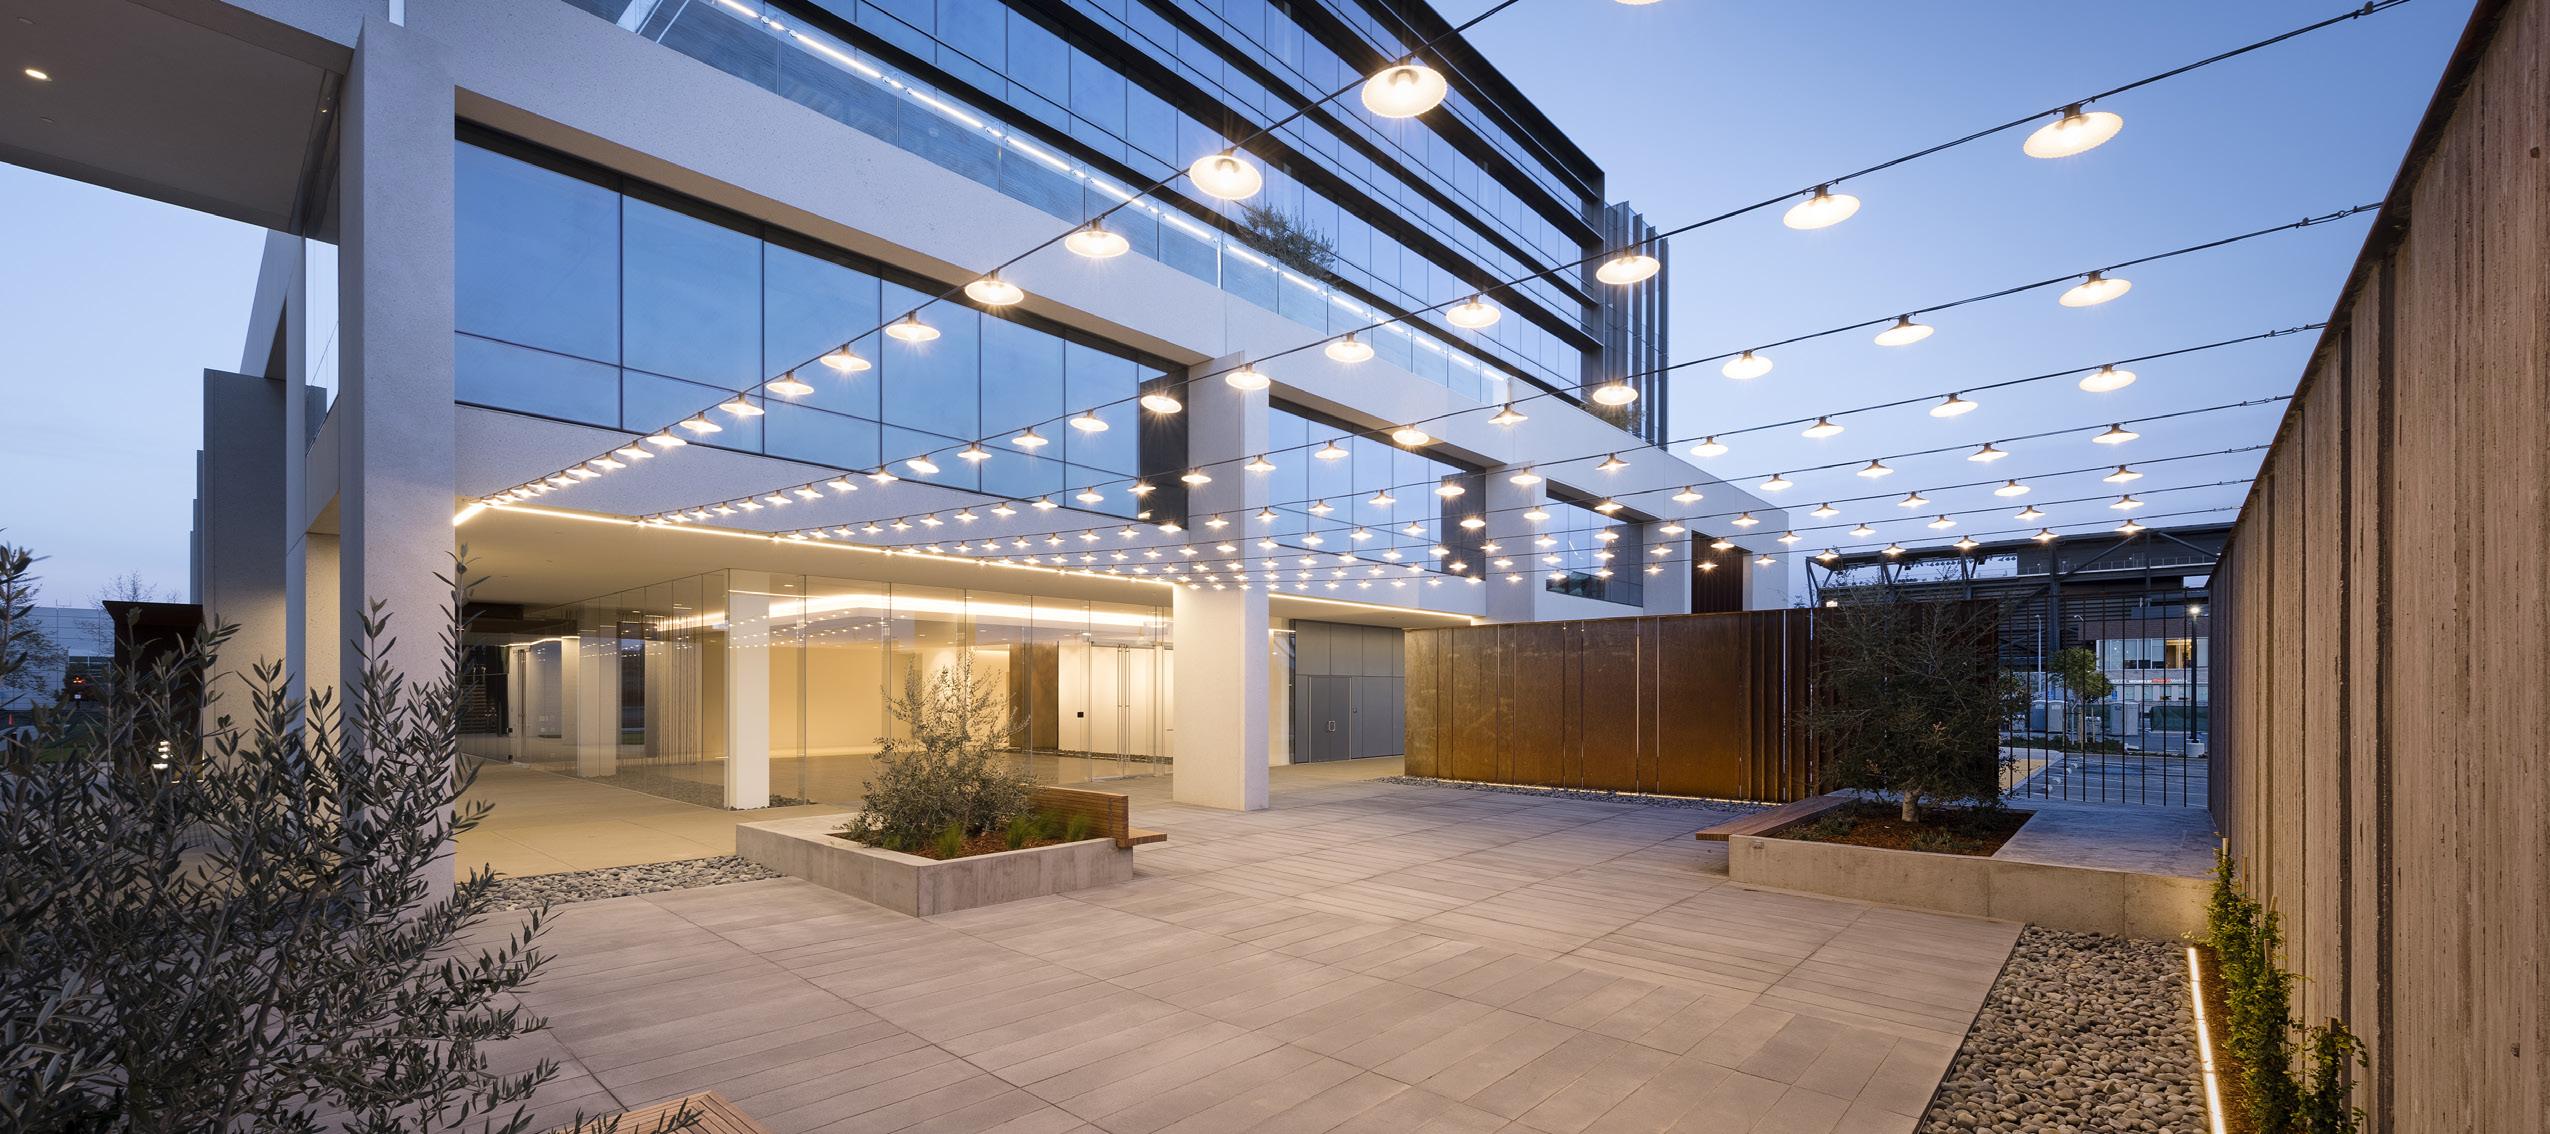
Every year, we invest in extensive capital improvements that transform our properties into eco-friendly campuses where humans and the environment work in harmony. In 2021, we prioritized our outdoor spaces, which have been invaluable to tenants throughout the COVID-19 pandemic. With new outdoor seating, landscaping and the introduction of the beekeeping initiative, we elevated the EQ experience.
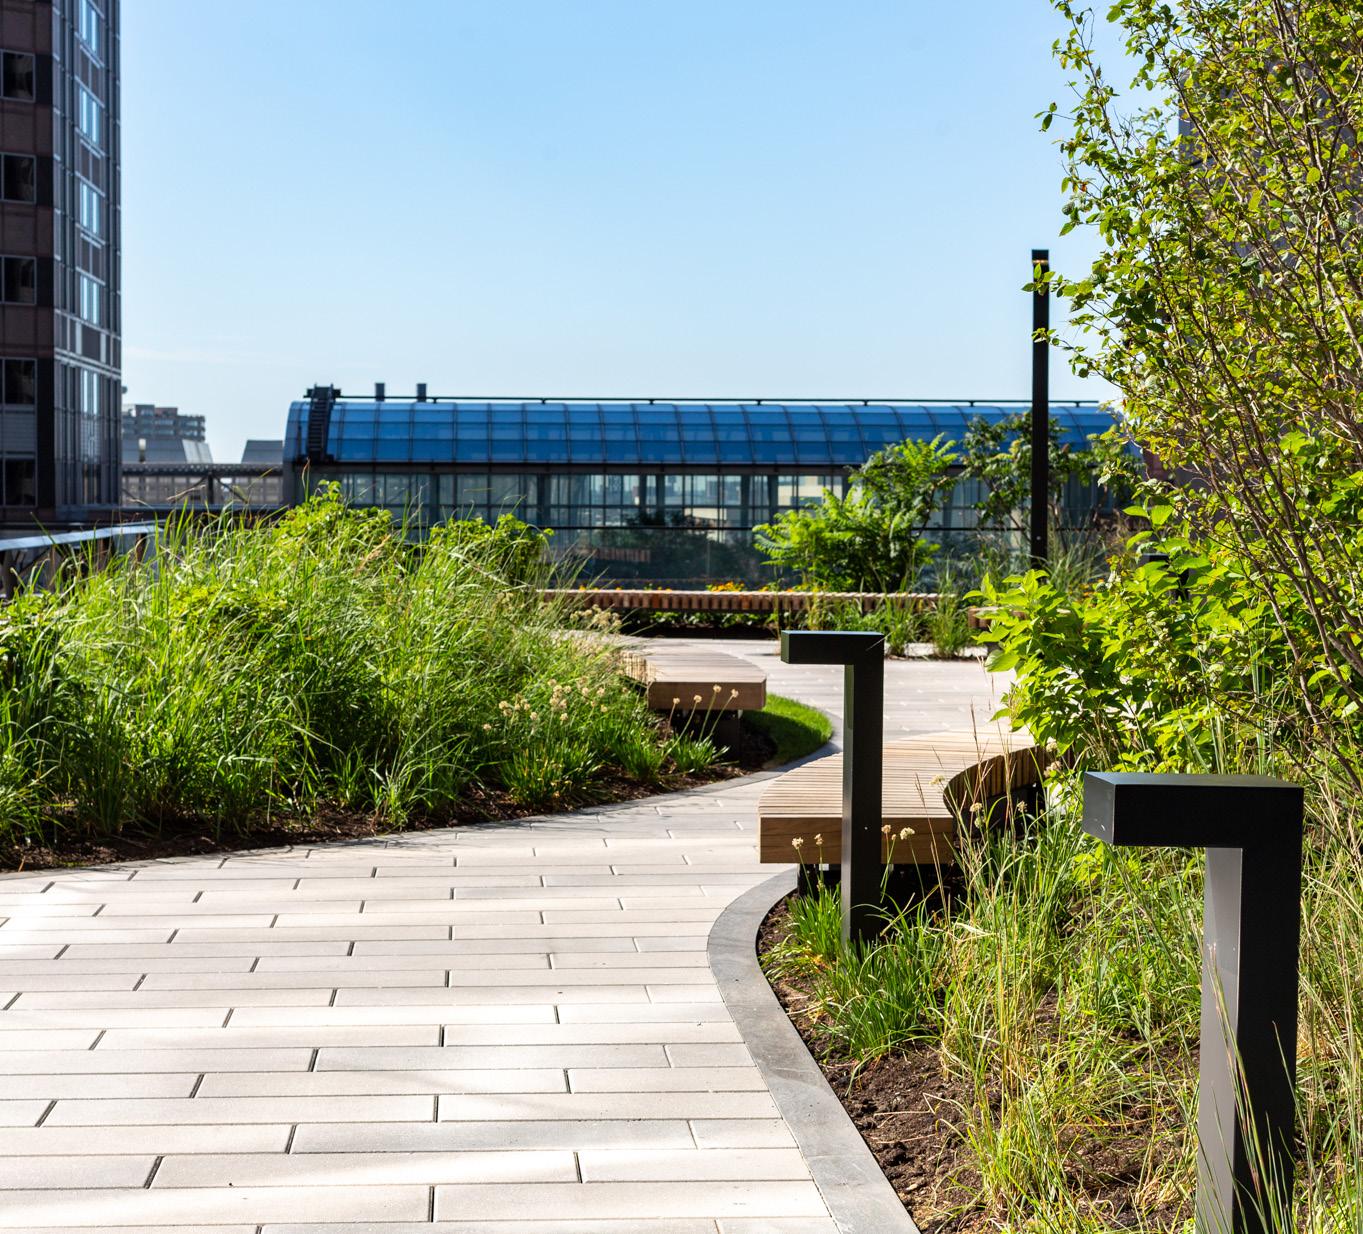
$27,044,000 invested in environmental capital improvements.
17% of properties conducted roof replacements using white roofs or adding roof ventilation.
20% conducted HVAC upgrades.
20%
installed new outdoor seating.
30%
installed new landscaping.
30% made modifications to energy efficient elevator cars.
20% of properties achieved new LEED certifications.
30% performed LED lighting upgrades.
2,817 new LED lights installed.





With our ESG roadmap, EQ centers the workplace around the human experience in every aspect of our business, beginning with potential acquisitions. Our ESG Steering Committee includes both leaders and team members from across the country.
As an organization, we’ve integrated ESG goals into our annual performance targets and set a target for 100% voluntary participation in ESG programs. We conducted a materiality assessment with key stakeholders, including investors, brokers, employees, tenants and vendor partners to develop five key initiatives for our governance focus. We have expanded our portfolio of ESG policies and procedures, adding in quarterly reporting and governance guidelines. We began sharing quarterly updates on ESG initiatives and progress to goals with investors.
Our quarterly reporting audit aligned with both the Global Real Estate Sustainability Benchmark (GRESB) and our materiality factors aligned with the following United Nations Sustainable Development Goals:
Goal 3: Good Health and Wellbeing
Goal 5: Gender Equality
Goal 8: Diversity, Equity and Inclusion
Goal 9: Industry, Innovation and Infrastructure
Goal 12: Responsible Consumption and Production
EQ continues to integrate new diversity, equity and inclusion programming into our practices as an organization. We’re committed to engaging diverse talent and partners from the first conversation in hiring and procurement processes. We examine our performance every quarter and work to address any potential barriers to entry such as lack of resources or lack of experience. We’re also expanding our commitment to job training and workforce development. In parallel, our organization has bolstered diversity, equity and inclusion efforts for current team members, community members and tenants.

81% of vendors hired this reporting year are minority owned.
$8,076,000 invested in minority and/or women-owned vendor partners.29
65% of EQ employees identify as women.
24% of management identifies as a member of a minority group.
24% of EQ employees identify as a member of a minority group.
42% of management identifies as women.
Our DEI task force meets weekly and introduced a full calendar of events to celebrate our diverse heritage. In addition to circulating monthly resources and educational materials, this team introduced new events for Women’s History Month, LGBTQ+ Pride Month, Hispanic Heritage Month and Black History Month. During Black History Month in February, the DEI task force steered the organization through meaningful explorations of black history. In 2021, our theme was "The Black Family: Representation, Identity and Diversity."
We reflected as a community on Dr. Martin Luther King Jr.’s "I Have a Dream" speech and supported black-owned businesses on corporate, propertylevel and personal social media accounts. Many of us also attended an event run and organized by Ibram X. Kendi, who is the Andrew W. Mellon Professor in the Humanities at Boston University and the Founding Director of the BU Center for Antiracist Research. We also shared extensive learning materials with team members, as well as opportunities to celebrate and support black communities and businesses.
In June, we set aside a week to learn about Juneteenth, African American history and allyship from experts alongside our team members and the extended Blackstone organization.
“EQuality is about allowing the voices to surface, elevate and to create change . . . and then for the leaders to propel it.”
Lisa Picard, former EQ Office CEO
We invited Blackstone, as well as team members from other portfolio companies to join us for a fireside chat with Journalist A’Lelia Bundles about the connections between the first Juneteenth and today’s social justice and voting rights movements. Bundles is the entrepreneur Madam C. J. Walker’s great-great granddaughter and biographer. More than 500 employees across the Blackstone portfolio companies joined us.
We came together again during the week to discuss allyship and inclusivity at work. Allyship experts led us in a community circle, which empowered team members with practical insights into antiracist interventions and authentic allyship practices.

We ensure adherence to best practices in real estate measurement and benchmarking by tracking our progress according to Global ESG Benchmark for Real Assets (GRESB). We've invested in 15 new technology systems that support these efforts and ensure the most accurate assessment of security, occupancy density, mass notification systems, environmental risk and emergency response across every property in operation.
of properties report quarterly
Our organization values transparency and due diligence. We integrate performance management processes into our day-to-day, including our Ethics Helpline: an anonymous hotline that allows employees and partners to report possible ethics breaches. These practices prioritize integrity and ensure loss reduction.
suspected ethics breaches requiring zero ethics investigations.
In partnership with Blackstone, EQ continues to rise as a thought leader in creating purposeful work. Our peers and leading publications have recognized our spaces, strategy and people within the industry and beyond it.
EQ, our former CEO and our properties received four awards this year:
Willis Tower
Honoree of Fast Company’s Innovation by Design Awards
Chicago Commercial Real Estate Awards (Redevelopment of the Year: Office)
World Finance’s Sustainability Award in the Real Estate Category
Lisa Picard
Innovator of the Year, Puget Sound Business Journal CRE Leadership Awards
EQ Office
Blackstone recognized our contributions to the firm’s diversity, equity and inclusion efforts. Their team invited EQ to participate on the following committees:
• All In Celebrations Committee (Inclusion Celebration Calendar PC Task Force)
• Blackstone DEI Center of Practice
EQ featured in 16 keynote addresses including:
• Harvard SHINE Summit
• WorkLab Collective (Microsoft Customer Council)
• Rethink Office National
• Sounds True Inner MBA CEO
• Columbia Business School Real Estate Circle
• Harvard Alumni Real Estate Board
• USC Lusk Center for Real Estate Virtual Summit
• Private Equity Summit: Office as an Investment
EQ has been cited in 214 articles, and our business strategy has been featured in 209 media outlets, including:
• Architectural Digest
• Chicago Tribune
• •
KNBC-TV (NBC News)
KTNV-TV (ABC)
• • Time Out Chicago
KVEA-TV (Telemundo)
• Miami Herald
• Las Vegas Sun
• New York Post
• Surface Magazine
We constructed the 2020–2021 ESG Report with data collected from the 30 properties in our portfolio as of July 31, 2021. This report covers data between August 1, 2020 and July 31, 2021.
As with our 2019–20 report, we focused on the following core principles in designing this year’s report:
• Stakeholder Inclusivity
• Materiality
• Transparency & Completeness
• Data Quality & Reliability
Stakeholder Inclusivity:
We included a broad spectrum of stakeholders in our ESG report development process, including team members, customers, vendors, community partners, investors, economists and third-party ESG and data evaluation experts. We engaged these participants in interviews, written evaluations and working group meetings. The ESG Leadership Committee, EQ Executive Leadership Team, Blackstone, YouthBuild USA and Compton YouthBuild all reviewed this report.

Materiality:
Following our initial materiality assessment in 2019, we aligned our quarterly audit survey questions to ensure consistency with Global ESG Benchmark for Real Assets (GRESB). We audited all properties quarterly on the full data set of questions.
Transparency & Completeness:
We shared the results of each quarterly audit with all property teams and provided biweekly updates on progress toward our goals as well as advancement on ESG programs with the ESG Leadership Committee, EQ Executive Leadership Team and Blackstone. We created an ESG Dashboard to track progress to goals. The Dashboard is regularly accessible to these stakeholders, and we also provided highlights from it in our quarterly Board meetings. Our team has included all of these collected findings in the report.
Data Quality & Reliability:
Our Governance Task Force created a matrix for all data in the report, externally verifying:
• Electricity (Schneider Electric & Energy Star)
• Water (Schneider)
• Waste (Building Waste Partners, Construction Waste Manifests)
• IAQ (Well HSR Data Collection)
• In-Kind Donations (Partner Receipts)
• Risk Assessment Review (Guidepost Partners)
• Clean Power (Property Contracts)
• D&I Vendors (Dun & Bradstreet Diversity Database, Spot Check Requests for Certifications)
• Thought Leadership (Publishers of Awards and Media Articles, Websites Listing Speaking Engagements)
• Job Creation (Revantage Payroll Reports, Nonprofit Partner Reports, Choose Chicago, Construction Vendors)
• Donated Space (License Agreements)
• Tenant Satisfaction (Third-Party Surveys)
• Subsidized Wellness (Gym Memberships, Fitness Classes Listings, Wellable)
Where external verification was not possible, our team conducted internal verifications using EQ’s audited corporate financial records as well as data collection systems such as Blackbaud. These verifications were executed for:
• Recycling Events
• Community Engagement Events
• Professional Development Events
• Community Health Events
• Construction Projects
• Local Materials
• Risk Mitigation Measures
• Environmental Capital Improvements
• Technology Systems
• Charitable Contributions
• Art Investments
Where assumptions were required to arrive at a data point, these assumptions have been footnoted in the appropriate places throughout the report. We also offered details on the following reference pages.
1 Electricity reduction is calculated with electricity bills for each property that are tracked in Schneider Electric. Between August 1, 2020–July 31, 2021, the kWh usage total was 260,286,124 kWh, which is 10% less than the 287,943,148 kWh used between August 1, 2019–July 31, 2020.
2 Forty-three of the 62 buildings included in this report for August 1, 2020–July 31, 2021 use green power. At five of the 43 buildings, green power is by Renewable Energy Certificates (RECS); the other 38 buildings are located in California and use at least 30% green power for utilities. This information was verified by review of utility contracts.
3 EQ reached 26,484 individuals in the broader community through our social impact partnerships with YouthBuild USA and CareerVillage, as well as through the training and professional development provided to our team members. This figure was verified by our external partners and EQ’s audited financials.
4 These buildings represent 15,455,155 square footage, which accounts for 81% of the square footage of the 62 buildings represented in this report for August 1, 2020–July 31, 2021.
5 EQ contracted Guidepost Solutions to develop and analyze a portfolio-wide risk assessment in June 2021, covering preventative maintenance, physical security, regulation and ordinance compliance, disaster preparedness, emergency response plans, cybersecurity and business continuity planning.
6 Through our property and community investments from August 1, 2020–July 31, 2021, EQ created and sustained jobs in
• Construction (through 2,042 construction projects).
• Retail (across 144 retail spaces).
• Art (through the purchase of 37 works of art and 1 major installation).
• Property management (providing placements for a total of 1,402 janitors, security staff, maintenance team members, landscaping professionals, engineers and other property support).
• Tourism and transportation (bringing more than $43 million in direct business sales to Chicago through the Skydeck Chicago, which then supported 33,693 jobs in transportation, entertainment, recreation, retail, food and beverage and accommodations between August 1, 2020–July 31, 2021 per the Economic Impact Overview study performed by Choose Chicago. Skydeck Chicago is the fifth most popular tourist destination in Chicago according to TripAdvisor: (https://www.tripadvisor.com/Attractions-g35805Activities-Chicago_Illinois.html.)
This included placements for six YouthBuild students. This information was verified by external partners and EQ’s audited financial statements.
7 Data for this reporting year (August 1, 2020–July 31, 2021) includes 62 buildings. Thirty-seven of the 62 buildings offer composting, as verified by the waste partner agreements.
8
Our charitable contributions for August 1, 2020–July 31, 2021 include $892,841 in cash donations, $180,648 in donated space, $212,389 of in-kind donations and 11,334 of total volunteer hours given, with a value of $655,940. We had 6,202 EQ volunteer hours, which we valued at an average of $55 per hour. We also included 5,332 additional vendor and tenant partner hours, which these third parties provided values for totaling $314,830. These figures were verified by EQ’s audited financial statements, by eternal partners and through third-party partner Blackbaud.
9 The properties included in this report include the 62 buildings at:
1740 Broadway 179 Lincoln
211 Main - Schwab Building
299 North Euclid
350 North Orleans
399 Boylston
600 Townsend St
621/633 17th Street
800 Fifth
999 Third CANVAS - North CANVAS - South Coleman Highline EmeryTech
The Exchange Fifth Third Center
Griffin Towers
Highlands Corporate Center Hughes Center
Junction at Del Mar
NorthPark
Oakbrook Terrace Tower
Park Avenue Tower
Playa District
Pointe O’Hare
South Bay Centre
U.S. Bank Center
VKCC (Von Karman Creative Campus)
Westlake Village (5601 Lindero) Willis Tower
EQ sold Pacific Gateway during this reporting period, and so has excluded information from Pacific Gateway from this report; it does not present ESG data that is representative of the entire reporting period.
10 Our goal is to have all properties in our portfolio provide complete ESG reporting on our quarterly audits. For August 1, 2020–July 31, 2021, all 62 properties included in this report provided this data.
11 EQ’s Diversity & Inclusion Standards for Vendor Procurement policy is to ask for three bids per job and to ask each vendor to indicate whether their company is a certified minority-owned business or a certified small business, as part of their bid. Our goal is to apply this standard in 75% of these searches based on the number of vendors considered for each job.
12 EQ conducts annual satisfaction surveys. Our goal is for at least 85% of employees to recommend EQ to a colleague or an industry peer.
13 Our goal is to increase charitable contributions by 25% more than 2020 levels by December 31, 2022, measured in cash donations, in kind donations, donated space and volunteer time contributed.
14 EQ created, supported and sustained 144,395 jobs, including those in construction, retail, art, transportation and tourism, property operations and support. We verified exact numbers where available, including for:
• Property management support (through payroll).
• Construction projects (where available).
• Opportunity youth (through YouthBuild program confirmations).
Where exact figures were not available, we worked with experts in each respective field to develop conservative assumptions around how many jobs we supported with our investments:
• Construction work
– For tenant improvements, major modifications and all smaller projects, our major construction GC partners provided a formula for how they budgeted workers they will need based on square footage:
• 1–2,500 sq ft = 100 jobs supported
• 2,501–5,000 sq ft = 150 jobs supported
• 5,001–10,000 sq ft = 200 jobs supported
• 10,001–20,000 sq ft = 250 jobs supported
• 20,001–30,000 sq ft = 300 jobs supported
• 30,001–40,000+ sq ft = 350 jobs supported
– For major capital repositioning projects, we calculated this figure by taking the total cost of all major repositioning projects and assigning 70% of that spend to labor. EQ calculated one job supported for every $100,000 invested.
• Art jobs
– For each of the 37 works of art we purchased, we estimated support for one artist’s job.
– For our major art installation, we estimated support for 10 jobs.
• Retail jobs
– For each of the 144 retail spaces under lease between August 1, 2020–July 31, 2021, we estimated 10 jobs.
• Transportation and tourism
– Per the Economic Impact Profile performed by Choose Chicago, we brought more than $43 million in direct business sales to Chicago through Skydeck Chicago, which then supported 33,693 jobs in transportation, entertainment, recreation, retail, food and beverage and accommodations between August 1, 2020–July 31, 2021. The Chicago Skydeck is the fifth most popular tourist destination in Chicago according to TripAdvisor: (https://www.tripadvisor.com/Attractionsg35805-Activities-Chicago_Illinois.html).
15 Assets included in the pursuit of a WELL Health-Safety Rating: All properties listed on the Table of Contents page, excluding the following: 211 Main - Schwab Building, 600 Townsend St, Coleman Highline, EmeryTech, South Bay Centre and Westlake Village. Additional properties include 999 3rd and Miami Central.
16 Per the Economic Impact Profile performed by Choose Chicago, EQ brought $69,208,638 in total business sales to Chicago between August 1, 2020–July 31, 2021.
17 In redesign and construction projects, we prioritize vendors with green practices, as detailed on EQ’s “Green Resource Guide for Construction and Capital Projects.” These practices include selecting local materials and recycled materials, recycling waste, selecting carpet tile over broadloom, using lowVOC paints and choosing low-flow fixtures and auto-sensors. We also have ESG standards in place for operations.
18 Local cultural materials include native plants, art, décor and unique building accents such as flooring or fixtures from local landmarks.
19 The data in this figure has been third-party verified for all properties except for 211 Main - Schwab Building, 399 Boylston, 600 Townsend St and South Bay Centre, which were triple net lease. For 399 Boylston, 600 Townsend St and South Bay Centre, all data was supplied by the building. For 211 Main - Schwab Building, data for February 1–July 31, 2021 was supplied by the building; cost data for August 1, 2020–January 31, 2021 was provided by the building, and reasonable assumptions were made for the usage data by averaging water unit costs for area properties for the same time period. These assumptions were reviewed by our Environmental and Governance Task Forces.
20 Over the past year, we have moved water consumption tracking for all buildings where EQ controls energy and water to Schneider Electric. It enabled us to verify water consumption reporting for all buildings. This verification uncovered a difference between the 2020 water consumption figures reported in our 2019–2020 ESG Report and the figures reported in Schneider. EQ is using figures reported in Schneider Electric as our external data verification source for water consumption and will thus report using these figures going forward.
21 The data in this figure has been third-party verified for all properties except for 211 Main - Schwab Building, 399 Boylston, 600 Townsend St and South Bay Centre which were triple net lease. For 399 Boylston, 600 Townsend St, and South Bay Centre, all data was supplied by the building. For 211 Main - Schwab Building, data for February 1 – July 31, 2021 was supplied by the building; cost data for August 1, 2020 – January 31, 2021 was provided by the building, and reasonable assumptions were made for the usage data by averaging electricity unit costs for area properties for the same time period. These assumptions were reviewed by our Environmental and Governance Task Forces.
22 Over the past year, we have moved energy tracking and reporting for all buildings where EQ controls energy and water to Schneider Electric and in doing so were able to verify energy reporting for all buildings. This verification uncovered a difference between the 2020 electricity usage figures reported in our 2019–2020 ESG Report and the figures reported in Schneider. EQ is using figures reported in Schneider Electric as our external data verification source for electricity and will thus report using these figures going forward.
23 A building Management System (BMS) monitors and manages the mechanical, electrical and electromechanical services in a facility, including power, heating, ventilation, air conditioning, physical access control, pumping stations, elevators and lighting.
24 This figure is calculated using green energy spend information from Energy Star Resource Advisor for all but four buildings, as this information is not yet available in Schneider Electric. Figures for Coleman Highline 1 and Coleman Highline 2 were taken from Schneider Electric. Figures for 600 Townsend St were supplied by the building. As noted earlier, for 211 MainSchwab Building, data for February 1–July 31, 2021 was supplied by the building; cost data for August 1, 2020–January 31, 2021 was provided by the building, and reasonable assumptions were made for the usage data by averaging electricity unit costs for area properties for the same time period. These assumptions were reviewed by our Environmental and Governance Task Forces.
25 For clarity, we calculate green power by the square footage under EQ’s control, for which we are purchasing clean energy. In some buildings, EQ controls 100% of the space, including the common areas but also all tenant space, and so investments in clean energy equate to the full square footage of the building (Willis Tower). In other buildings, EQ only controls the common areas, and so square footage is calculated accordingly. In some buildings, we are purchasing 100% clean energy and so that figure is applied to the square footage under EQ’s control. Inother buildings, the percentage of clean energy is 33%, and thus the appropriate percentage is applied.
26 Carbon dioxide sensors monitor and detect for the presence of carbon dioxide based on the absorption of infrared light at a specific wavelength.
27 A Variable Frequency Drive (VFD) is a type of motor controller that drives an electric motor by varying the frequency and voltage supplied to the electric motor. Frequency (or hertz) is directly related to the motor’s speed (RPMs). The faster the frequency, the faster the RPMs go, using more energy. If an application does not require an electric motor to run at full speed, the VFD can be used to ramp down the frequency and voltage to meet the requirements of the electric motor’s load and can reduce energy outputs.
28 Direct Digital Control (DDC) systems provide more precise control over HVAC and lighting operations, allowing building operators to set different temperature zones, schedule and automate system operation and monitor performance over time.
29 This figure is significantly less than the $152,101,828 EQ invested in minority and small business vendors in our 2019–2020 reporting period. EQ’s overall spend during 2020–2021 was reduced because of the COVID-19 pandemic. There were fewer construction and architectural reposition projects across the portfolio.
* All figures in this report have been rounded to the nearest whole number. Where a figure was greater than or equal to .5, we rounded up, and where a figure was less than .5, we rounded down.
A special thank you to all of the teams that contribute to our ESG Report and ESG program throughout the year.
2020-21 ESG Leadership Committee:
Jim Anderson
Joanie Edgerly
Brenda Haraldstad
Diana Hernandez
Charlie Hobey
Kirsten Ekdahl Hull
Todd Mott
Dan Murphy
Andrea Pelka
Nadine Shehaiber
Rodel Salvio
Amy Smith
Lauren Sozio
Mikki Ward

Executive Sponsors
Frank Campbell
Charlie Hobey
Lisa Picard
Lauren Sozio
ESG Strategy & Implementation
Laura Probst
Director of ESG & Social Impact
Alyse Mauro Mason
Environmental
Todd Mott
Dan Murphy
Rodel Salvio
Social Impact
Diana Hernandez
Joanie Edgerly
Governance
Brenda Haraldstad
Amy Smith
Technology
Mikki Ward
In recognition of our ESG Task Force members and support teams:
Environmental
Kevin Akers
Amy Baker
Colleen Ballinger
Natalie Barba
Katherine Bartels
Mike Becker
Miranda Benson
Jennifer Bowman
Tom Bryant
Angela Burnett
Monica Campa
Robert Casey
Sara Connelly
Natalie Copley
Joanna Delgado
James Grogan
Galina Gruder
Lolita Harmon
Carolyn Harrington
Tony Harris
Robert Del Hierro
Robbie Hurlburt
Brenda Kipling
Hugo Lazo
Kamila Mackowiak
Doug McDowell
Alison Meloni
Shannon Michelson
Gary Michon
Kyle Mowry
Marisol Olvera
Sophia Pagan
Beck Papraniku
Danielle Raby
Jenalyn Rogers
Robert Rogers
Yesenia Ruiz
Corwin Sandel
Deborah Schaan
Bruce Shapiro
Mackenzie Straughan
Kevin Sullivan
Margaret Tamuleviz
Lupe Velasquez
Sean Walsh
James Wessels
Tony Xayarath
Jennifer Zadroga
Catherine Zembik
Social
Tricia Barrett
Miranda Benson
Caitlin Biere
Jason Bouthillette
Monica Campo
Natalie Copley
Lauren Coulson
Pamela Deegan
Joanna Delgado
Brigid Doherty
Joanie Edgerly
Lisa Foyston
Marlene Gomez
Galina Gruder
Rei Ellen Harada
Carolyn Harrington
Diana Hernandez
Sherri Hicks
Katrina Jones
Ashley Kolaczynski
Jaime Lane
Lauren Lengyel
Karolina Lizak
Alison Meloni
Mark Metzger
Gary Michon
Julie Miller
Zack Osbourne
Sophia Pagan
Tara Pamplona
April Pyter
Danielle Raby
Lillie Rose
Yesenia Ruiz
Kristen Runner
Elizabeth Salazar
Lisa Salvio
Nicki Sautel
Deborah Schaan
Mackenzie Straughn
Margaret Tamuleviz
Chelsea Walker
Sean Walsh
Jennifer Zadroga
Diversity, Equity & Inclusion
Tena Cameron
Dimitry Dubov
Brenda Haraldstad
Carolyn Harrington
Katrina Jones
Lydia Jordan Parnell
Vivienne Kwong
Rachel Maguire
Minh Nguyen
Beck Papraniku
Andrea Pelka
Nadine Shehaiber
Michelle Uribe
Debbie Zehm