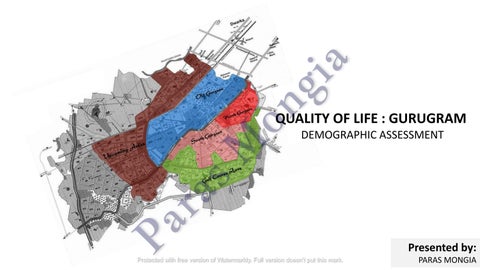
QUALITY OF LIFE : GURUGRAM DEMOGRAPHIC ASSESSMENT
Presented by: PARAS MONGIA
GURUGRAM DEMOGRAPHICS| BRIEF HISTORY AND DEVELOPMENT
BRIEF DEVELOPMENT HISTORY : GURUGRAM, HARYANA CONTEMPORARY DEVELOPMENT:
❖ Different growth led to the formation of New & Old Gurugram, based on their period of origin, location in the city and the authority that have developed them.
2008
2015
2019
❖ Area to the right of NH8 (old colonies and adjacent sectors) have been largely built by government authorities whereas the area built to the left of NH8 have been developed by private developers. PRE-LIBERALIZATION PHASE (1970-1990): ❖ Until 1971, growth was slow with only present city center. Since, 1970 growth started and the population expanded outwards.
1985
❖ Initially, sectors 4 & 7 were developed as residential sector and sector 18 as industrial. The entire area expansion of Gurugram started encroaching upon agricultural land. ❖ Maruti Udyog plant settled in 1983 within the city has been a major turning point for industrial development. In 1981, HUDA established and DLF brought series of new commercial complexes. POST-LIBERALIZATION PHASE (1990-2000): ❖ Gurugram experienced a sudden boost in employment during 1990s, followed by people moving into the city along with private real-estate investment.
1952 Source of Data: https://onemapggm.gmda.gov.in/GIS/Auth/ OneMap2D/ https://censusindia.gov.in/2011census/dchb /Haryana_tables.html
❖ Gurugram has emerged as a major industrial and corporate hub, as it’s growth have been made possible by the larger scale acquisition agricultural land by government and private developers.
GRAPH (A) SHOWS THE DECADAL GROWTH IN POPULATION GRAPH OF GURUGRAM (M.C.+O.G.) AREA, YEAR: 1971-2021 POPULATION (1971-2011 Census)
A
GROWTH RATE (±%)
RATE/ RATIO
Projected population by 2031 (42.5 lakhs) 3500000
POPULATION
400
AS PER GMDA
3000000
350
340.34
200 1500000
500000
0
YEAR
FEMALE
113,163 (2011)
61,201 (2011)
51,962 (2011)
1,26,104 (2020)
68,408 (2020)
57,696 (2020)
50.92 1971
55.93
1981
65.72
50
36.32
1991
21.93
2001
2011
2012
18.44
2013
13.86 12.46 10.4 9.5 8.6 8 2014 2015 2016 2017 2018 2019
0 2020
89115 121486 201322 886519 10,80,9 12,87,2 15,24,7 17,36,2 19,52,7 21,55,8 23,60,7 25,63,9 27,70,4
GROWTH RATE (±%)
55.93
50.92
36.32
65.72
340.34
21.93
18.44
13.86
12.46
10.4
9.5
8.6
8
0
0
PIE CHART (i) SHOWING THE MALE TO FEMALE RATIO OF POPULATION (2011)
GRAPH (B) SHOWS THE NUMBER OF LITERATES AND ILLITERATES, LITERACY RATE BY SEX IN TOWNS, 2011 FEMALE
i
MALE TOTAL PERSONS FEMALE MALE TOTAL PERSONS
POPULATION 0
100000
200000
300000
400000
500000
NUMBER OF LITERATES
GURUGRAM (M Corp. + OG)
Child Sex Ratio
-
-
-
-
87.52% (2011)
90.93%
83.50%
84.40% (2020)
-
-
830 (2011) 849 (2020)
100
POPULATION (1971-2011 Census) 57151
PERSONS
MALE
250 2000000
1000000
NUMBER OF NUMBER OF LITERATES ILLITERATES
CHILDREN (0-6 yrs.)
300
2500000
150
B
TOTAL
POPULATION TREND LINE
TOTAL PERSO NS 676571
MALE
FEMALE
380903
295668
TOTAL PERSO NS 209948
600000 700000 NUMBER OF ILLITERATES
800000
MALE
FEMALE
99139
110809
Source of Data: https://censusindia.gov.in/2011census/d chb/Haryana_tables.html http://www.indiaonlinepages.com/popula tion/gurgaon-population.html
Sex Ratio (females per 1000 males) Average Literacy (%)
847 (2011) 870 (2020)
INFERENCES:
• The steep growth of population during 2001 to 2011 to 2020 that is preceding decade indicates large scale in migration of people from neighbouring states particularly. • Sex Ratio in Gurgaon has shown great improvement in the last decade. • On the other hand the literacy rate has fallen by 3.1% • It can also be observed that Gurugram being a developing city has a child sex ratio of 849
SOCIO CULTURAL GROUPS IN GURUGRAM
Source of Data : https://shodhganga.inflibnet.ac.in/handle/10603/26624
INFERENCES:
•
Thus the essence of Gurgaon in terms of its population constitution has become very diverse.
•
Earlier it was just the local native population that constituted of largely Ahirs or Yadavs, Jats, Gujars and Punjabis but now it has a truly cosmopolitan flavour as it has people not only from the different parts of northern India, particularly, but also people from across the globe.
Reasons for Rapid Growth of Population & Migration in Gurugram: •Job opportunities are available in large numbers in Gurgaon in almost all the trades. •Better Infrastructure development and a decent standard of living. •Major IT companies have their main or branch office in Gurgaon. VARIOUS SOCIO CULTURAL GROUPS IN GURUGRAM
Gurugram was a home to largely Punjabi Hindus with the surrounding villages inhabiting Ahirs (Yadavs), Jats and Gurjars. Thus, the most dominating cultural group in Gurgaon city and the surrounding villages had been of Jaduvansi Ahirs that is the Yadavs. Muslims though were present but majority of them shifted during the time of partition and the Punjabi Hindus moved as refugees into the city.
•Connectivity of Delhi Metro to Gurgaon with Delhi and Noida offers better transport facilities at low cost. •Universities and Colleges are available in large number in Gurgaon. •Better road connectivity with Delhi and NCR Region plays another major role as traveling becomes easy and affordable.
POPULATION DENSITY MAPS OF GURGAON-MANESAR URBAN COMPLEX (2008-2018) POPULATION DENSITY MAPS (2008) Source : IMP, 2010
POPULATION DENSITY MAPS (2018) Source : Self Generated
INFERENCES:
• Population density (ppa) of town area has tremendously increased during the ten year gap between 2008 & 2018 due to migration of people (floating as well as immigrants) from different states and neighbouring towns in search of employment opportunities and a better living.
GROWTH OF RESIDENTIAL AREA IN GURGAON-MANESAR URBAN COMPLEX (1977-2031)
Source : https://tcpharyana.gov.in/DevelopmentPlan.htm
RESIDENTIAL DENSITY IN GURUGRAM
LEGEND
Data : GMDA (YEAR-2018) Source : Self Generated Map
AGE COHORT | WORKING POPULATION DISTRIBUTION
Source of Data: http://statisticstimes.com/demographics/india/haryana-population.php https://censusindia.gov.in/2011census/dchb/Haryana_tables.html
AGE-WISE DISTRIBUTION OF POPULATION IN GURUGRAM
Haryana population by Age Group (2011)
1600000 1400000 1200000 1000000 800000 600000 400000 200000 0
0 to 6
7 to 14
15 to 25 26 to 59
60+
Total
Total Population
286039
277254
312238
Total Rural Population
95300
99978
94714
524705
113703
1514432
143223
38863
472179
Total Urban Population 190739
177276
217524
381482
74840
1042253
TOTAL WORKING/MARGINAL WORKING/NON-WORKING POPULATION OF GURUGRAM (as per 2011 Census) 600000 500000
Age Cohort Diagram of Haryana As per 2011 Census
400000 300000 200000
INFERENCES:
• Female main workers and marginal workers are lesser than male • Female working population is less in the city • It can also be observed that Gurugram’s maximum urban population is in the age group 26-59. Max migration to the city happening due to employment opportunities.
100000 0
Main workers
Marginal workers
Non workers
Persons
319379
18138
549002
Males
255851
11911
212280
Females
63528
6227
336722
Persons
Males
Females
LOW INCOME LOCATIONS AND POPULATION
CHAUMAKHERA DAULATABAD
DUNDHAHERA MULAHERA
DHANKOT
SIRHAUL
SUKHRALI
BASAI
SIKANDERPUR CHAKARRPUR
KHANDSA
ISLAMPUR
According to 2001 Census• Villages in Gurugram District- 726 • Villages in Gurugram Tehsil- 149
JHARSA
SIHI GHATA KHERKI DAULA
VILLAGES
BADSHAHPUR
According to 201 Census• Villages in Gurugram (M.C+ OG) – 43
SLUMS • • •
Total no. of Households in slums in Gurugram- 30,888 There are 61 slums in Gurugram (M. Corp + O.G) Population in slums- 1,44,754
Source of Data: https://onemapggm.gmda.gov.in/GIS/Auth/OneMap2D/ https://censusindia.gov.in/2011census/dchb/Haryana_tables.html
SLUM LOCATIONS IN THE CITY
Source of Data : https://onemapggm.gmda.gov.in/GIS/Auth/OneMap2D/ https://censusindia.gov.in/2011census/dchb/Haryana_tables.html
PIE CHART (ii) NUMBER/ %AGE OF SCHEDULED CASTES AND SCHEDULED TRIBES POPULATION IN GURUGRAM TOWN, 2011
ii
8.58% (SC)
%age of General Category population to total population
0% (ST)
%age of scheduled castes population to total population
91.40% (GEN.)
%age of Scheduled Tribes population to total population
PIE CHART (iii) & (iv) SHOWING THE %AGE VARIOUS RELIGIONS & THE NUMBER AND %AGE OF SLUM POPULATION IN GURUGRAM TOWN, 2011
iii
4.70%
1%
0.60%
0.60% HINDUISM ISLAM SIKHISM
CHRISTIANITY
iv
• •
With urbanization a lot of migrants are also moving towards the city and encroachment is happening thereby leading to increase in slum population. Maximum concentration of slum population is in subcity-1 & subcity-2
144754
93% 16.3%
OTHERS Total population
Slum population
Total population , 886519
HOUSING MARKET ANALYSIS
TOTAL NO. OF HOUSEHOLDS IN GURUGRAM (CENSUS 2011) : 208229
Source of Data : https://www.magicbricks.com/Property-Rates-Trends/ALL-RESIDENTIAL-rates-in-Gurgaon
HOUSING MARKET ANALYSIS
Source of Data : https://www.magicbricks.com/Property-Rates-Trends/ALL-RESIDENTIAL-rates-in-Gurgaon
LOCATION OF FIRE STATIONS AND SERIVICES IN GURUGRAM CITY AREA
• •
Maximum concentration in the old Gurugram area Only one fire station in the Manesar region
Source of Data: https://onemapggm.gmda.gov.in/GIS/Auth/OneMap2D/
LOCATION OF CRIME SENSITIVE AREAS AND POLICE STATIONS IN GURUGRAM CITY AREA
INFERENCE Hence we can observe that most police stations are located near the crime sensitive areas. Source of Data: https://onemapggm.gmda.gov.in/GIS/Auth/OneMap2D/
CRIME RATE ANALYSIS FOR GURUGRAM CITY AREA
Source : https://www.numbeo.com/crime/in/Gurgaon