Luxury vs. The Index
A decade of $4M+ contracts against the S&P 500 Manhattan & Brooklyn | Q1 2026


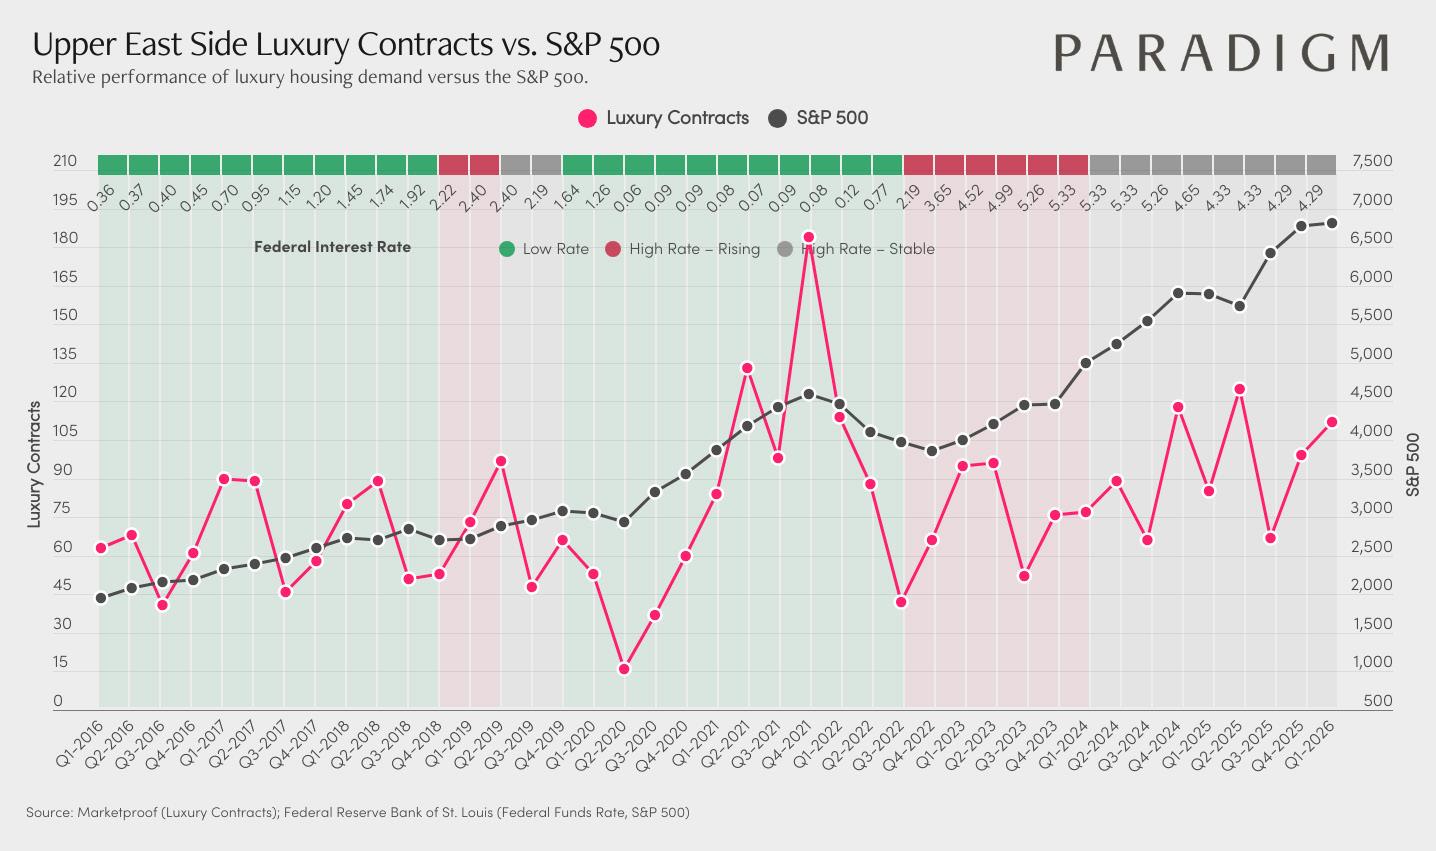
Since 2016, luxury contracts on the Upper East Side have consistently moved to their own beat, often diverging from the S&P 500. While the index climbed steadily from around 2,200 in early 2016 to nearly 6,500 by late 2024, $4M+ contract volume swung dramatically, peaking near 130 contracts in Q3 2021 before falling into the 45 to 75 range through much of 2023 and 2024. That divergence tells a clear story: luxury real estate demand here is not simply a function of equity wealth. It runs on its own fundamentals, things like inventory, buyer sentiment, and neighborhood-level demand.
What makes the rate environment particularly telling is how contract volume behaved once rates stabilized. After the sharp pullback during the high-rate rising period, volume began recovering even while rates held in the 4.29 to 5.33 range through 2024 and into 2026. Buyers adjusted. The paralysis of the rising-rate shock faded, and activity started rebuilding on its own terms.
Heading into Q1 2026, with contracts back up to around 108 and the S&P holding near 6,700, the gap between equity wealth creation and luxury contract volume is narrowing again. For buyers, that convergence points to a window where pricing has not fully caught up to the wealth environment around it. For sellers, the improving velocity signals that demand is rebuilding, and being well positioned now means you can catch that momentum as the recovery continues.
These charts plot $4M+ luxury contracts against the S&P 500 from 2016 through early 2026, overlaid with the average federal interest rates. It shows how luxury buyer demand has responded to shifting rate conditions, and where it stands relative to a decade of equity market growth.
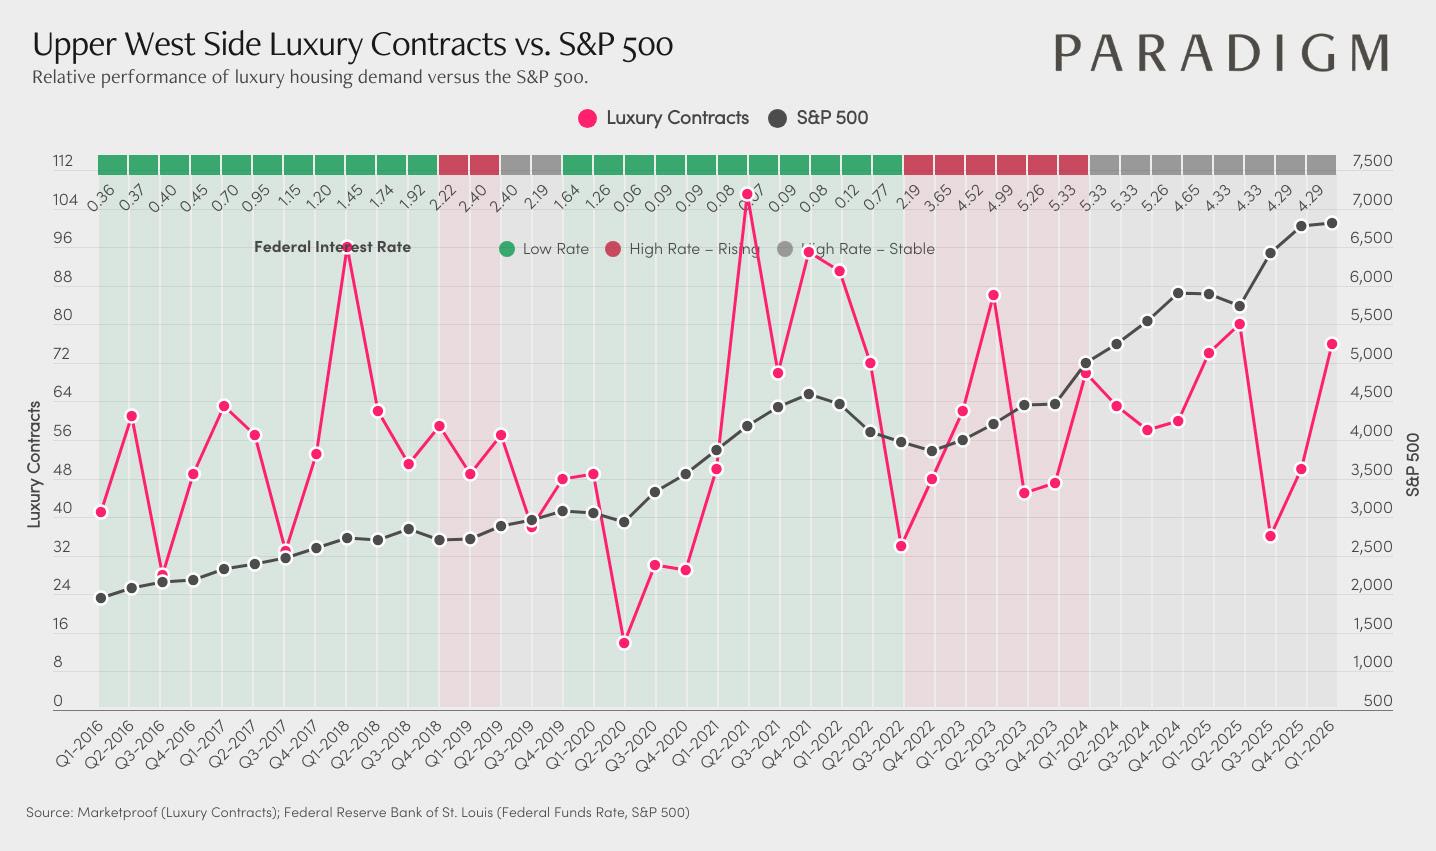
Since 2016, $4M+ luxury contracts on the Upper West Side have moved independently of the S&P 500, and the gap between the two has been especially pronounced in recent years. Contract volume peaked around 91 in Q2 2021 before pulling back sharply through 2022 and into 2023, bottoming near 33 contracts while the S&P continued climbing toward 4,500. That divergence reflects how rate-sensitive this market became once borrowing costs started rising.
What stands out is how the Upper West Side has historically snapped back. After the COVID low in early 2019, volume recovered quickly, and after the 2022 to 2023 trough, activity has been rebuilding steadily. By Q1 2026, contracts are back up to around 72, even as the S&P holds near 6,500, suggesting buyers have adjusted to the rate environment and are re-engaging on their own terms.
The Upper West Side tends to move in cycles of consolidation followed by sharper recoveries, and the current trajectory fits that pattern. For buyers, the spread between equity market strength and luxury contract volume still points to relative value that may not last as momentum builds. For sellers, the improving trend heading into 2026 is a good reason to feel confident about listing now, before that recovery fully prices in.
These charts plot $4M+ luxury contracts against the S&P 500 from 2016 through early 2026, overlaid with the average federal interest rates. It shows how luxury buyer demand has responded to shifting rate conditions, and where it stands relative to a decade of equity market growth.
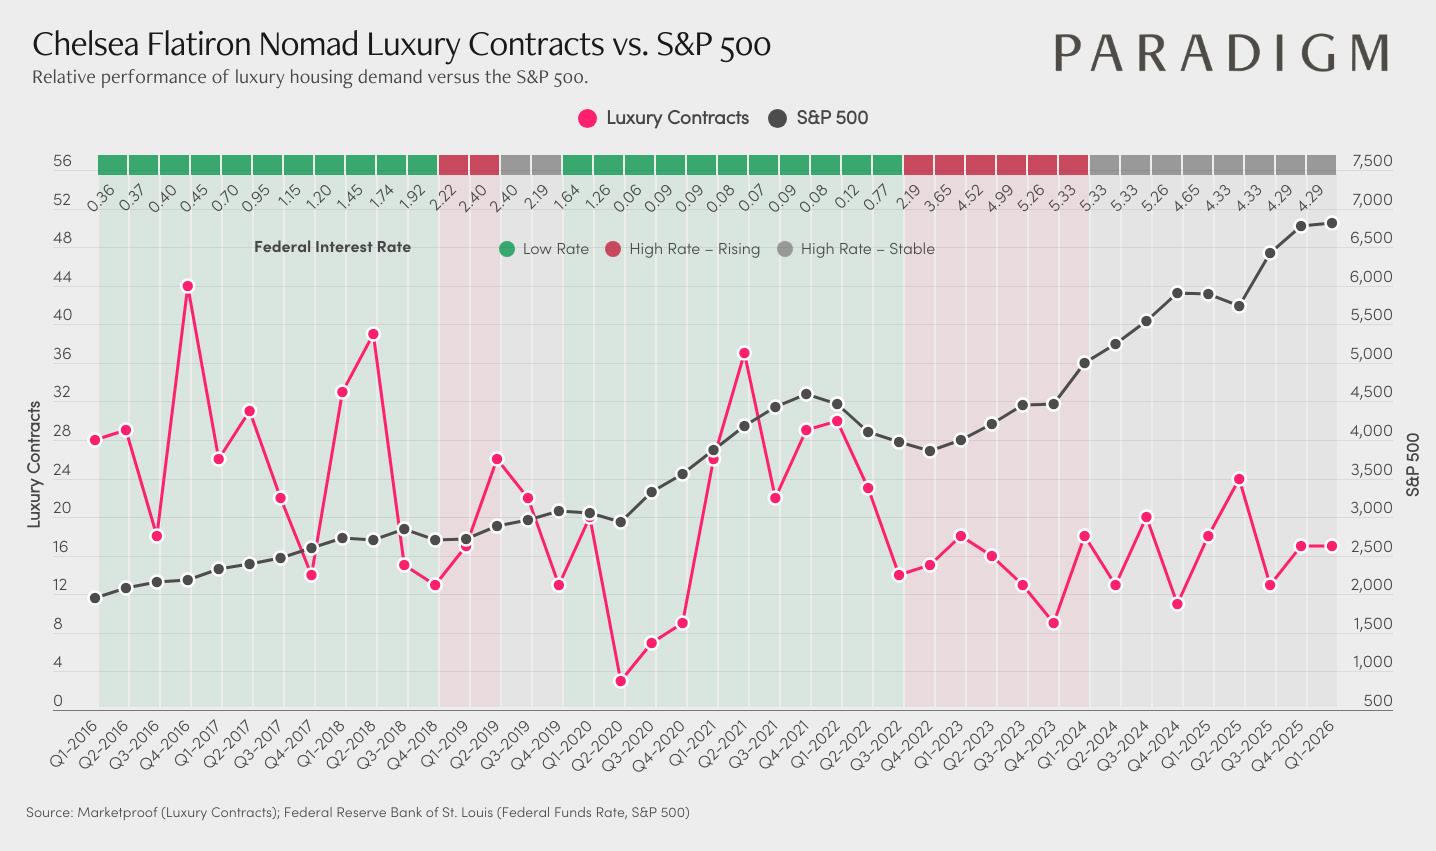
The Chelsea, Flatiron, and NoMad corridor is one of the more interesting stories among the neighborhoods we track. $4M+ contract volume hit 43 in Q4 2016 and climbed back to 36 during the 2021 rebound, showing that luxury buyer demand here can turn on quickly when conditions align.
What makes this corridor worth paying attention to right now is how wide the gap has gotten between equity market performance and local luxury activity. Contract volume has been running between 8 and 20 for most of the past two years, while the S&P 500 has pushed from around 4,000 to nearly 6,500. That means the wealth environment behind this market has gotten considerably stronger, even as contract volume has stayed relatively quiet. A steady flow of new development inventory has been absorbing buyer activity, so it reflects a shift in the mix between resale and new construction more than an absence of demand.
This corridor has shown before that it can move fast. The recovery from near zero in early 2020 to 36 contracts by mid-2021 happened within a few quarters, and the current setup, with equity wealth at a decade high and contract volume still subdued, looks similar to conditions that preceded those earlier surges.
For buyers, the spread between broader market strength and local luxury volume represents one of the more compelling entry points across Manhattan submarkets right now. For sellers, understanding where this market sits in its cycle is important for positioning and pricing well as velocity continues to rebuild heading into 2026.
These charts plot $4M+ luxury contracts against the S&P 500 from 2016 through early 2026, overlaid with the average federal interest rates. It shows how luxury buyer demand has responded to shifting rate conditions, and where it stands relative to a decade of equity market growth.
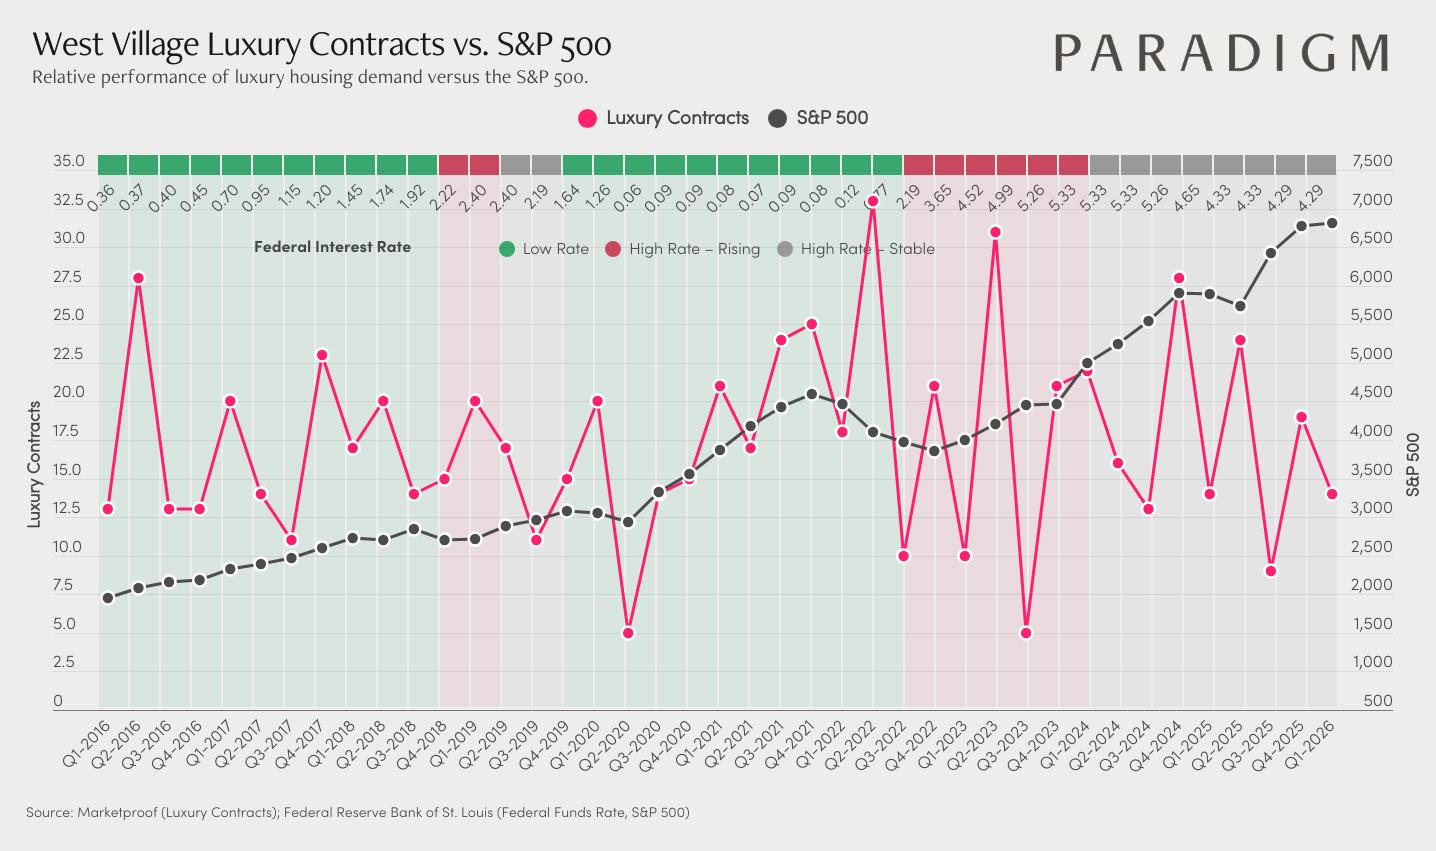
The West Village has historically produced some of the sharpest swings in $4M+ contract activity of any Manhattan submarket. Volume hit 28 contracts in Q2 2016 and has shown a consistent pattern of rapid moves in both directions, which comes down to the nature of this market. Inventory is limited, and when high-value townhouse or boutique condo deals close, they create outsized quarterly swings that you simply do not see in higher-volume neighborhoods.
That volatility is what makes the West Village story compelling. Since 2022, contracts have bounced between 5 and 30, with notable spikes in early 2022 and again in Q1 2023 showing that premium buyers still move decisively when the right product comes to market. In a neighborhood this tight on inventory, one or two transactions can shift the quarterly picture dramatically, and the West Village has demonstrated that pattern repeatedly over the past decade.
With contract volume currently running in the 13 to 18 range heading into 2026, and the S&P sitting near 6,500, the gap between equity wealth creation and local luxury activity is wider than this neighborhood’s history would suggest is sustainable. The wealth environment has moved well ahead of where transaction volume is right now.
For buyers, the West Village remains one of Manhattan’s most supply-constrained luxury markets, and the current volume level means a less competitive environment than this neighborhood typically produces. For sellers, when velocity turns here it tends to move quickly, as both the 2016 and 2022 spikes showed, and the advantage goes to those who are positioned ahead of that shift.
It is also worth noting that deals like 80 Clarkson and 140 Jane never appear in this data at all -- off-market transactions of that caliber move entirely outside public contract reporting, which means the true level of highvalue activity in this submarket is likely understated by what any graph can show.
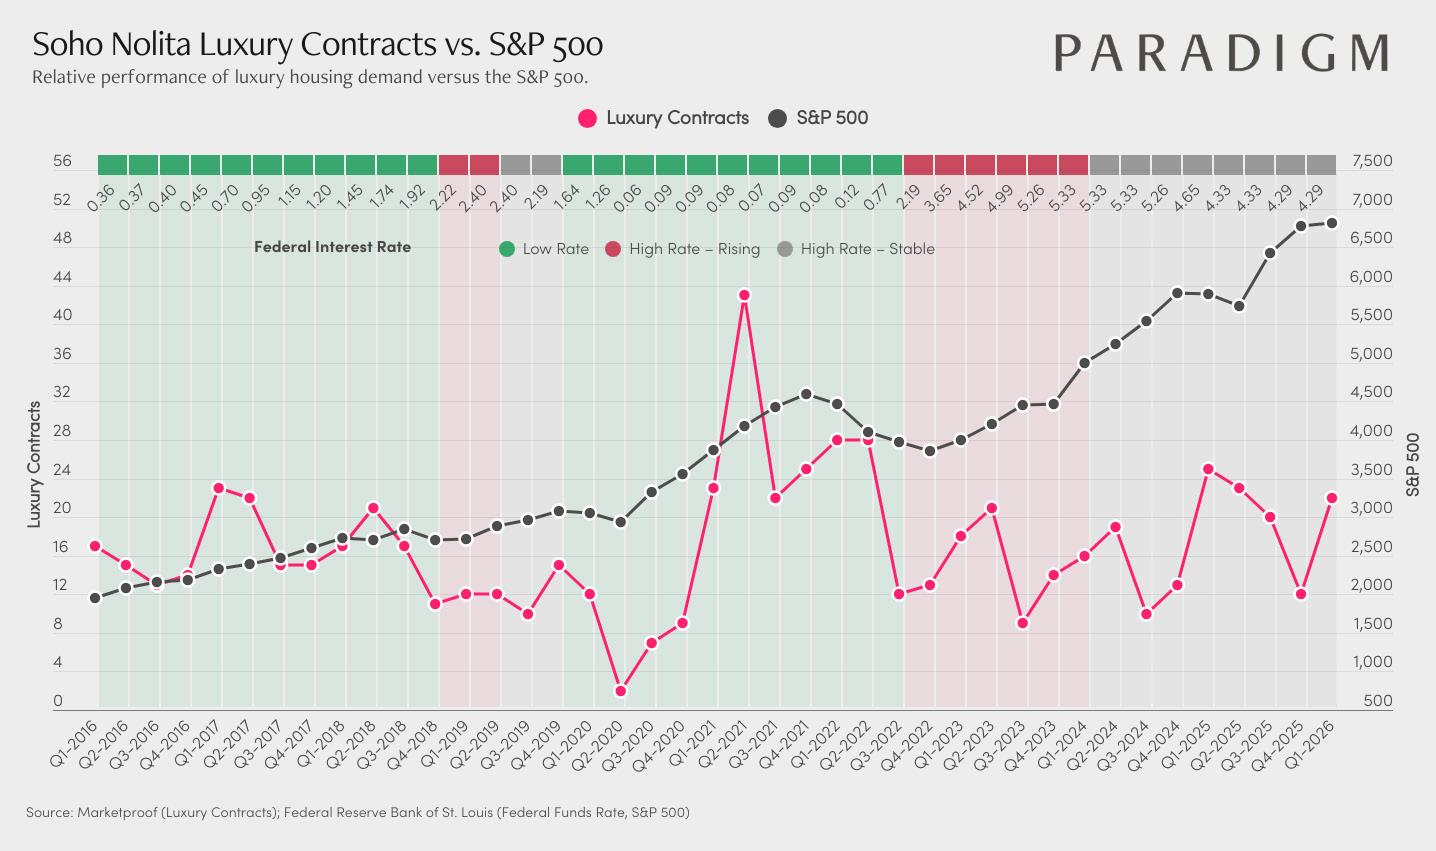
SoHo and Nolita have shown a consistent ability to generate sharp bursts of $4M+ contract activity, even in challenging rate environments. Volume hit 22 contracts in Q4 2016 and Q1 2017, then surged to 42 in Q1 2021, one of the strongest single-quarter readings across any submarket we track. When conditions align here, buyers move quickly.
That pattern has continued even through the high-rate period. Since 2022, contract volume has oscillated between 8 and 28, with recurring upward pulses showing an active buyer pool that steps in when the right product surfaces. The S&P meanwhile has climbed from around 4,000 to nearly 6,500 over the same stretch, widening the gap between equity wealth creation and local luxury activity considerably.
With volume currently around 21 contracts heading into Q1 2026 and the wealth environment at a decade high, SoHo and Nolita sit in a similar position to conditions that preceded earlier acceleration periods. This neighborhood has historically converted financial market strength into deal activity once buyer confidence catches up, and the current setup points in that direction.
For buyers, the present volume level offers one of the more favorable entry points this submarket has seen in recent years, particularly given how limited inventory remains. For sellers, the recurring activity pulses in the data confirm that well-priced listings are still finding buyers, and any shift in the rate environment could accelerate that meaningfully given the amount of wealth sitting on the sidelines.
These charts plot $4M+ luxury contracts against the S&P 500 from 2016 through early 2026, overlaid with the average federal interest rates. It shows how luxury buyer demand has responded to shifting rate conditions, and where it stands relative to a decade of equity market growth.
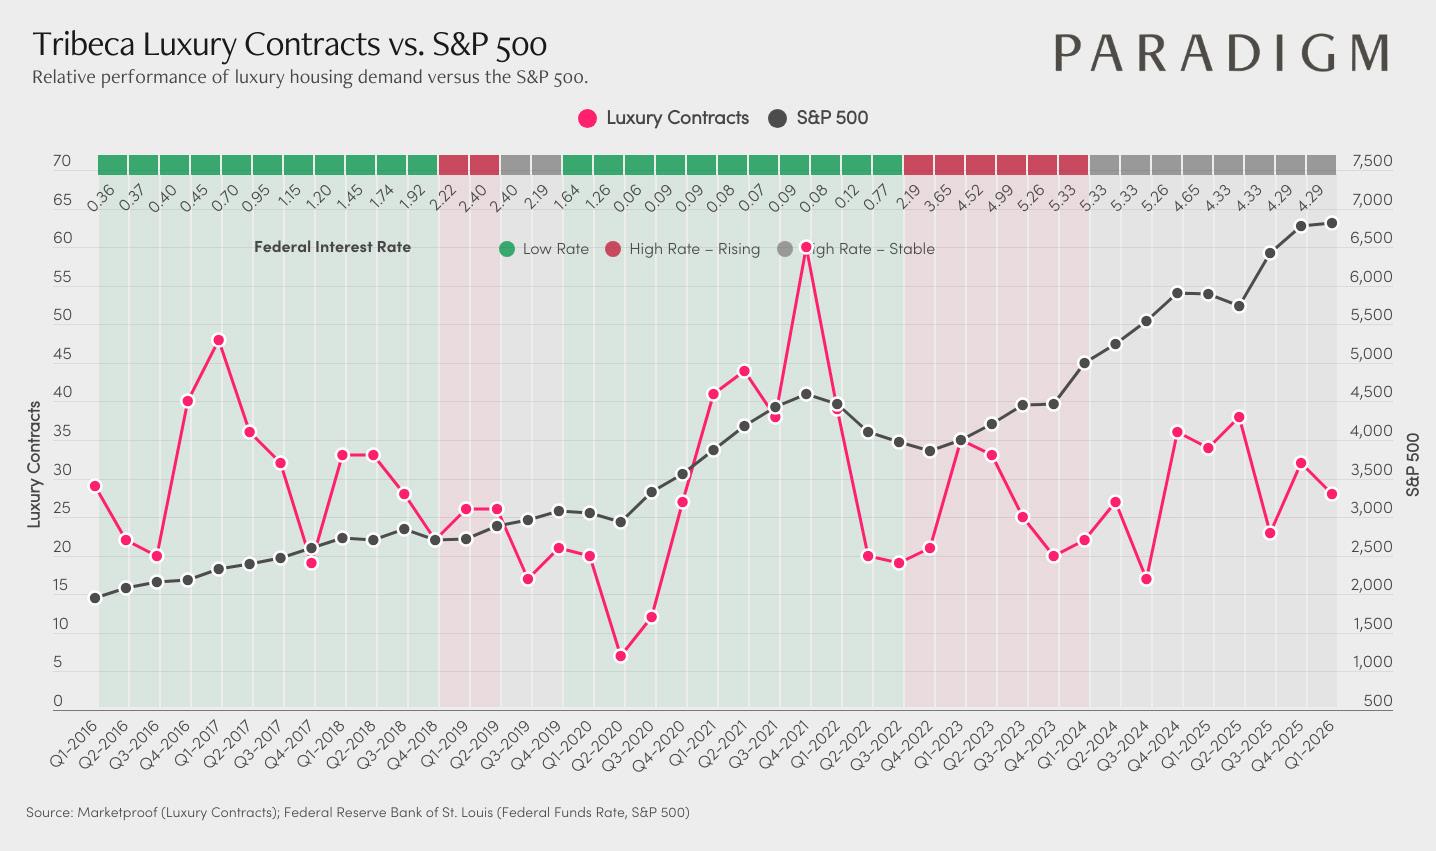
Tribeca is one of Manhattan’s most established luxury markets, and the $4M+ contract data reflects that consistently. Volume peaked at 47 contracts in Q4 2016, held steadily above 30 through most of the low-rate years, and climbed back to around 43 in Q1 2021 during the post-COVID recovery. Very few Manhattan neighborhoods have shown that kind of sustained activity at the top of the market.
What sets Tribeca apart right now is the relative steadiness of its movement compared to other submarkets. While neighborhoods like the West Village and SoHo show sharp quarter-to-quarter swings, Tribeca has ranged more gradually between 19 and 35 contracts through 2023 and into 2026. That reflects the nature of this market. Deals at Tribeca price points tend to move with more deliberation, and the buyer pool here is among the most financially insulated in the city.
The result is a growing gap between equity wealth creation and local luxury activity. The S&P has climbed from around 4,000 to nearly 6,500 since 2022 while contract volume has stayed well below its earlier highs. That represents a significant accumulation of buyer capacity sitting on the sidelines in one of Manhattan’s most coveted neighborhoods.
For buyers, there is access to some of the city’s premier addresses with less competition than this market typically produces. For sellers, the data shows that well-priced listings are still finding buyers, and the depth of the buyer pool at this price tier positions the neighborhood well as activity works back toward its earlier pace heading into 2026.
These charts plot $4M+ luxury contracts against the S&P 500 from 2016 through early 2026, overlaid with the average federal interest rates. It shows how luxury buyer demand has responded to shifting rate conditions, and where it stands relative to a decade of equity market growth.
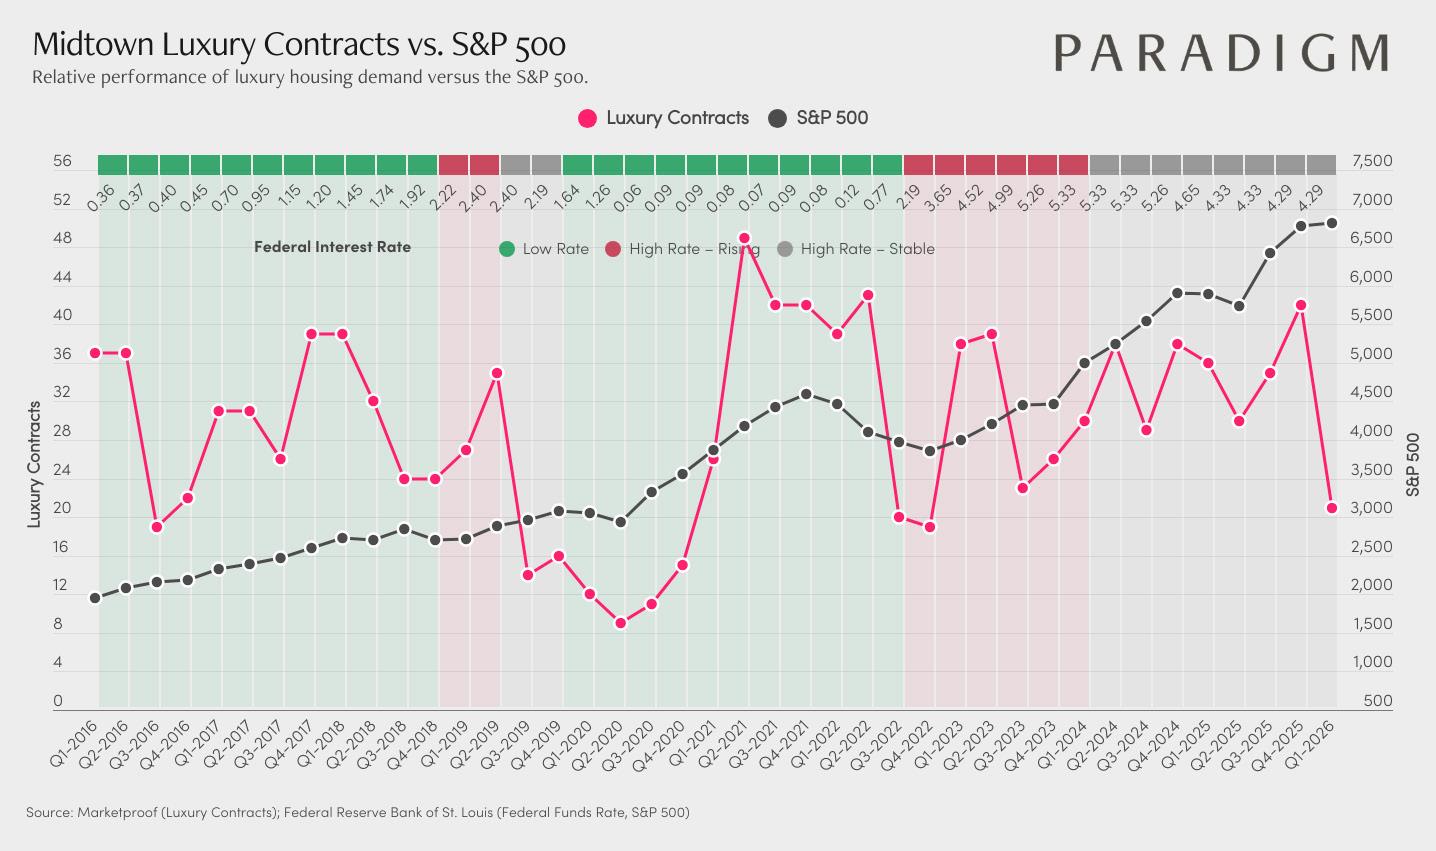
Midtown’s $4M+ contract market has real scale and a consistent track record across multiple cycles. Volume started near 36 contracts in early 2016, held in the 30 to 39 range through much of 2018, and climbed back to 43 during the 2021 to 2022 rebound before pulling back as rates rose. Across different rate environments, Midtown has demonstrated a reliable ability to absorb luxury demand, but is oversupplied with inventory.
What makes Midtown distinct from other Manhattan submarkets is the depth of inventory. A significant amount of new development product has come to market over the past several years and is actively being absorbed. From a cycle perspective that is constructive: pricing is recalibrating, inventory is clearing, and the groundwork for the next period of stronger velocity is being laid. Midtown has done this before, and historically once absorption hits a tipping point the upside follows.
Contract volume has ranged between 19 and 38 over the past two years, and the gap between S&P 500 performance and local luxury activity is wider here than in most other Manhattan submarkets. The equity wealth environment has kept building while transaction volume has stayed measured, which points to a reservoir of demand that has not fully shown up yet. With the S&P near 6,500 and contracts around 20 heading into Q1 2026, that spread is difficult to ignore.
For buyers, Midtown is one of the more compelling value stories in Manhattan luxury right now: available inventory, competitive pricing relative to historical levels, and a strong wealth backdrop for those thinking longer term. For sellers, strategic pricing that aligns with current absorption trends is key, and the ongoing clearing of inventory is setting the stage for stronger velocity ahead.
These charts plot $4M+ luxury contracts against the S&P 500 from 2016 through early 2026, overlaid with the average federal interest rates. It shows how luxury buyer demand has responded to shifting rate conditions, and where it stands relative to a decade of equity market growth.
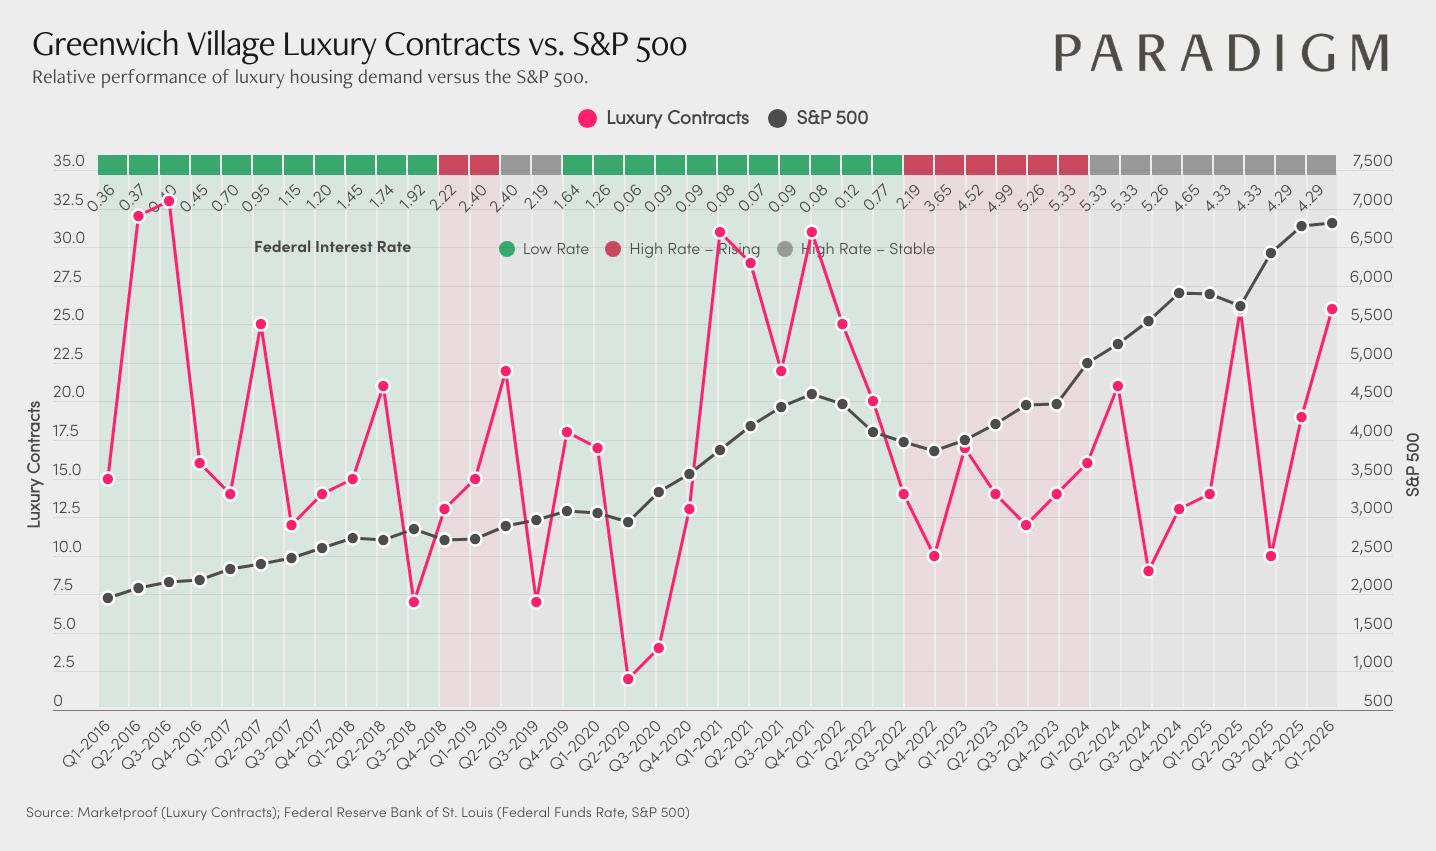
Greenwich Village has one of the strongest $4M+ contract track records in Manhattan. Volume hit 32 contracts in both Q2 and Q3 2016, stayed active through 2017 and 2018, and climbed back to around 21 in Q1 2021 during the post-COVID rebound. Very few corridors in the city have shown that level of sustained buyer conviction across multiple cycles.
Like the West Village, Greenwich Village is a market where limited inventory and high-value transactions mean a small number of deals can move quarterly volume significantly. Since 2022, contracts have ranged between 10 and 25, with periodic pushes toward the higher end of that range confirming that premium buyers are still stepping in when the right product comes along. That volatility is a feature of this market, not a weakness, and it means activity can accelerate quickly once momentum builds.
With the S&P climbing from around 4,000 to nearly 6,500 since 2022 while contract volume has stayed in a relatively narrow band, the gap between equity wealth creation and local luxury activity is one of the wider spreads this neighborhood has seen in the past decade. The wealth environment has been building while transaction volume has stayed selective, pointing to meaningful pent-up demand waiting for the right catalyst.
For buyers, Greenwich Village at current volume levels means access to one of Manhattan’s most iconic neighborhoods with less competition than this market typically produces. For sellers, this neighborhood has historically moved in sharp bursts, and with contracts already nudging back toward 25 heading into Q1 2026, the advantage goes to those who are positioned ahead of the next acceleration with a lot of new developments coming.
These charts plot $4M+ luxury contracts against the S&P 500 from 2016 through early 2026, overlaid with the average federal interest rates. It shows how luxury buyer demand has responded to shifting rate conditions, and where it stands relative to a decade of equity market growth.
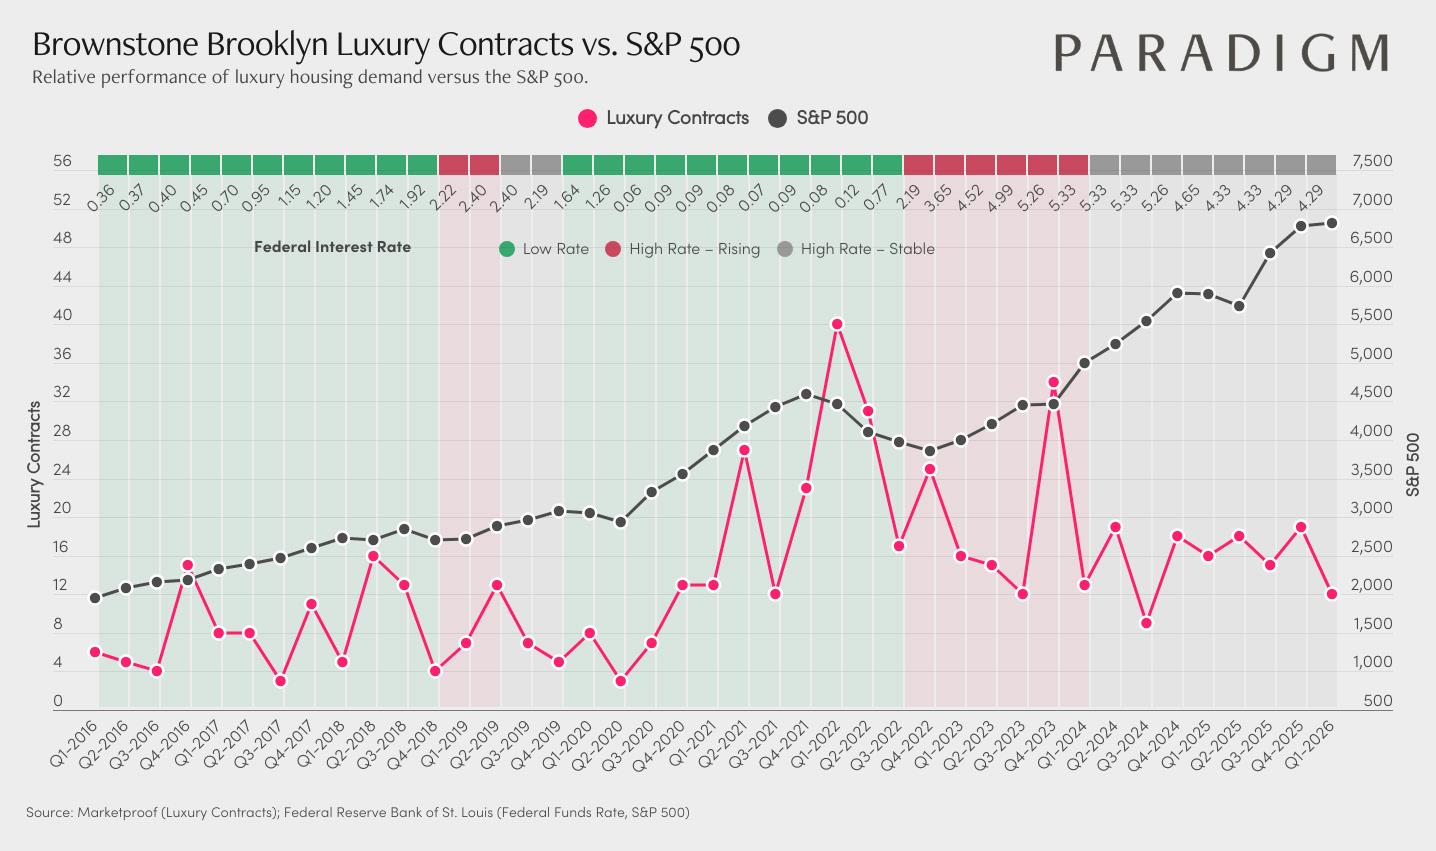
Brownstone Brooklyn stands apart from every submarket we track. While most neighborhoods saw $4M+ contract volume stay in the single digits through 2016 and 2017, Brownstone Brooklyn was already running between 15 and 40 contracts per quarter, a level that Manhattan neighborhoods with far greater name recognition were not consistently matching. That early strength set the tone for everything that followed.
The post-COVID rebound here was unlike anything else in the data. Volume climbed from around 8 contracts in early 2020 to 39 in Q1 2022, the highest single-quarter reading across any submarket in this analysis during that period. While most neighborhoods pulled back sharply as rates rose, Brownstone Brooklyn held relatively firm, with volume staying in the 16 to 32 range through much of 2022 and into 2023 before settling into a 10 to 17 range through 2024 and early 2025.
What makes this market structurally different is the buyer base. Limited new development pressure, strong neighborhood identity, and a pool of buyers that has proven less rate-sensitive than most Manhattan counterparts have kept demand more consistent here across cycles. The S&P has nearly tripled since 2016 while Brownstone Brooklyn luxury volume has grown alongside it in a way no other submarket has matched.
With contracts back around 10 to 17 heading into Q1 2026 and equity wealth at a decade high, the setup here looks similar to earlier consolidation periods that preceded the market’s strongest runs. For buyers, this is one of the few submarkets where the long-term case has been consistently validated by the data. For sellers, the structural demand story remains intact, and the current environment rewards thoughtful positioning ahead of the next acceleration.
These charts plot $4M+ luxury contracts against the S&P 500 from 2016 through early 2026, overlaid with the average federal interest rates. It shows how luxury buyer demand has responded to shifting rate conditions, and where it stands relative to a decade of equity market growth.
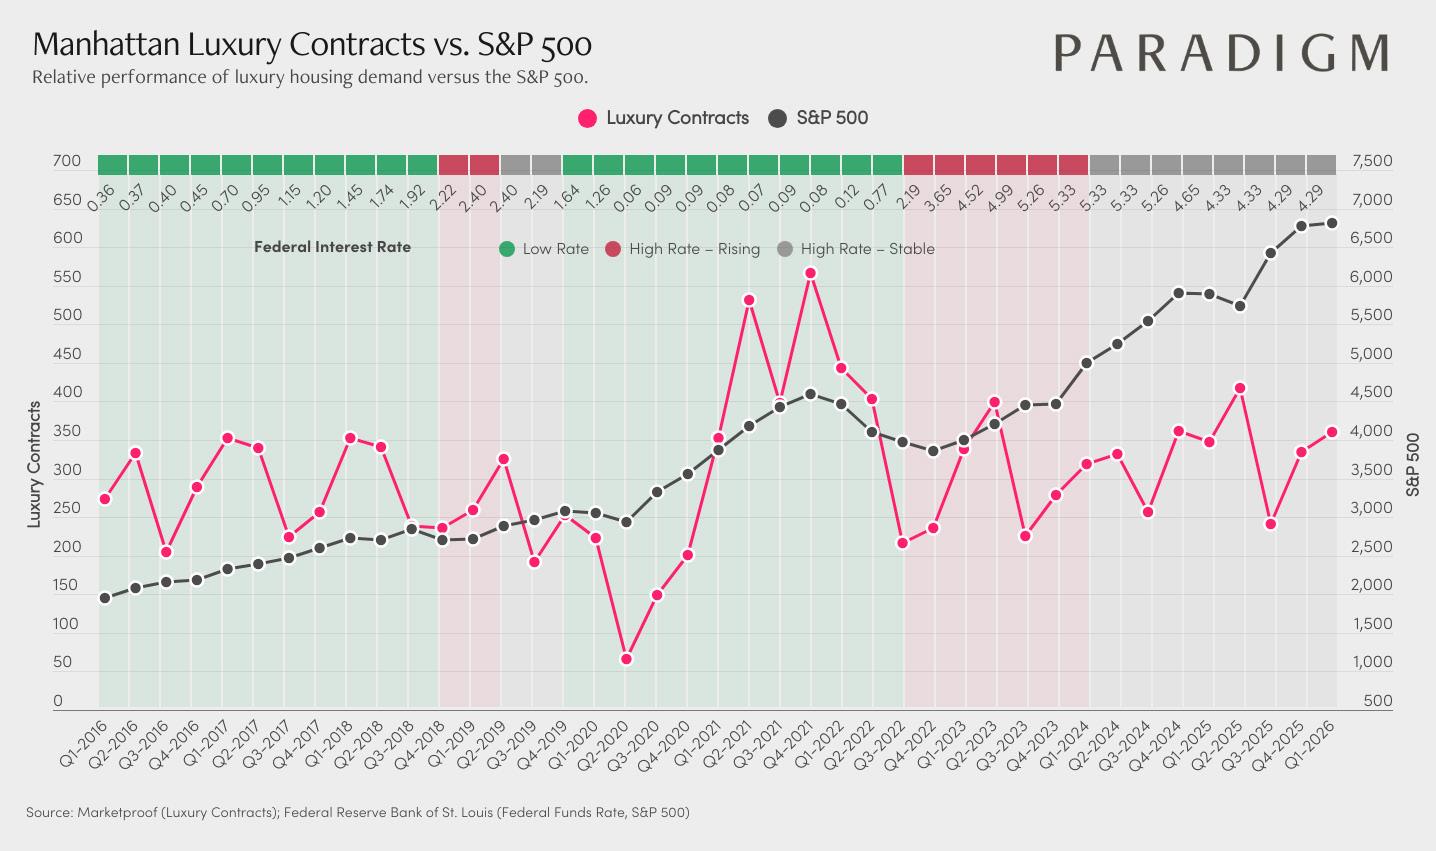
These charts plot $4M+ luxury contracts against the S&P 500 from 2016 through early 2026, overlaid with the average federal interest rates. It shows how luxury buyer demand has responded to shifting rate conditions, and where it stands relative to a decade of equity market growth.
Founded by Scott Hustis and Mark Jovanovic, Paradigm Advisory is a transformational approach to New York real estate, pairing decades of combined experience with the highest level of advisory and concierge service.
Our team’s range of expertise spans market analysis, economics, construction, architecture, and design, allowing us to deliver tailor-made strategies for a global clientele. That approach has surpassed $3 billion in sales, earned a consistent Top 75 ranking in U.S. sales volume, and grown the team to eleven agents.
We specialize in coops, condos, townhouses, and penthouses. Notable transactions include 1185 Park Avenue, 1060 5th Avenue, 220 Central Park South, 150 Charles Street, Greenwich Lane, 443 Greenwich, and the second most expensive townhouse in Brooklyn’s history. Our work has been featured in The Wall Street Journal, The New York Times, New York Post, CNBC, Bloomberg, Financial Times, Robb Report, and Variety.
For in-depth market detail, valuations, or a private consultation, reach out directly.