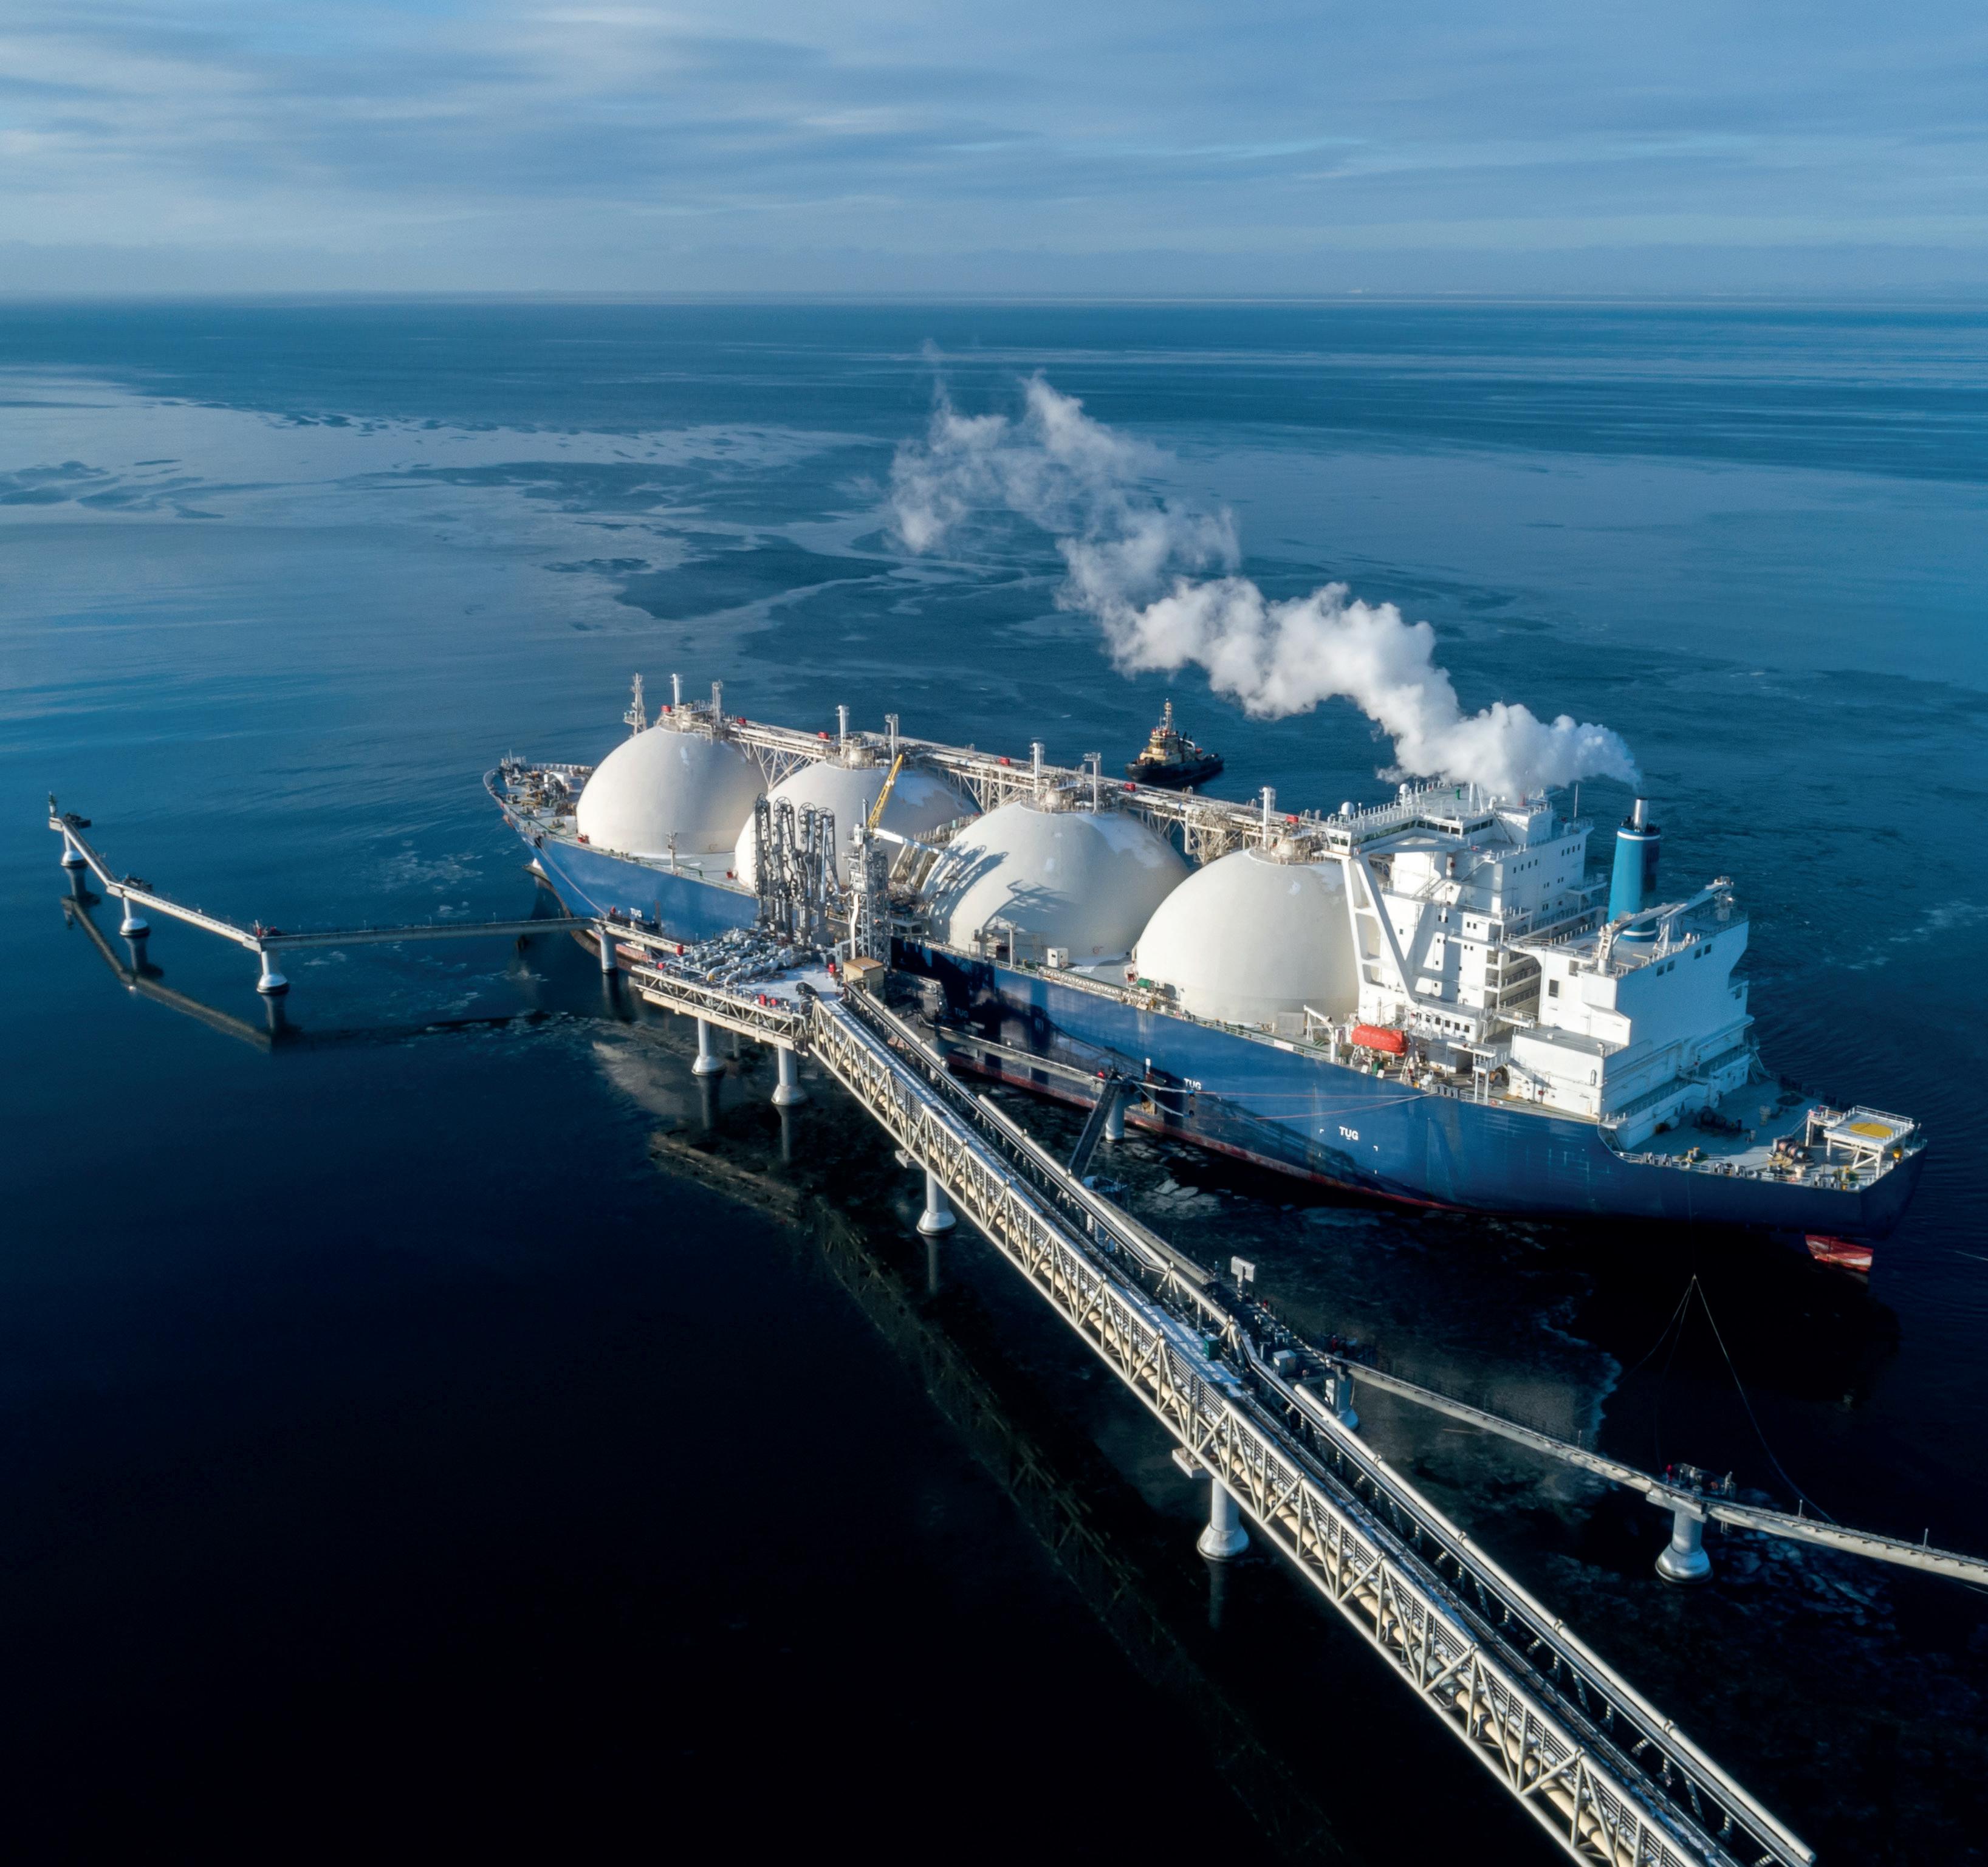
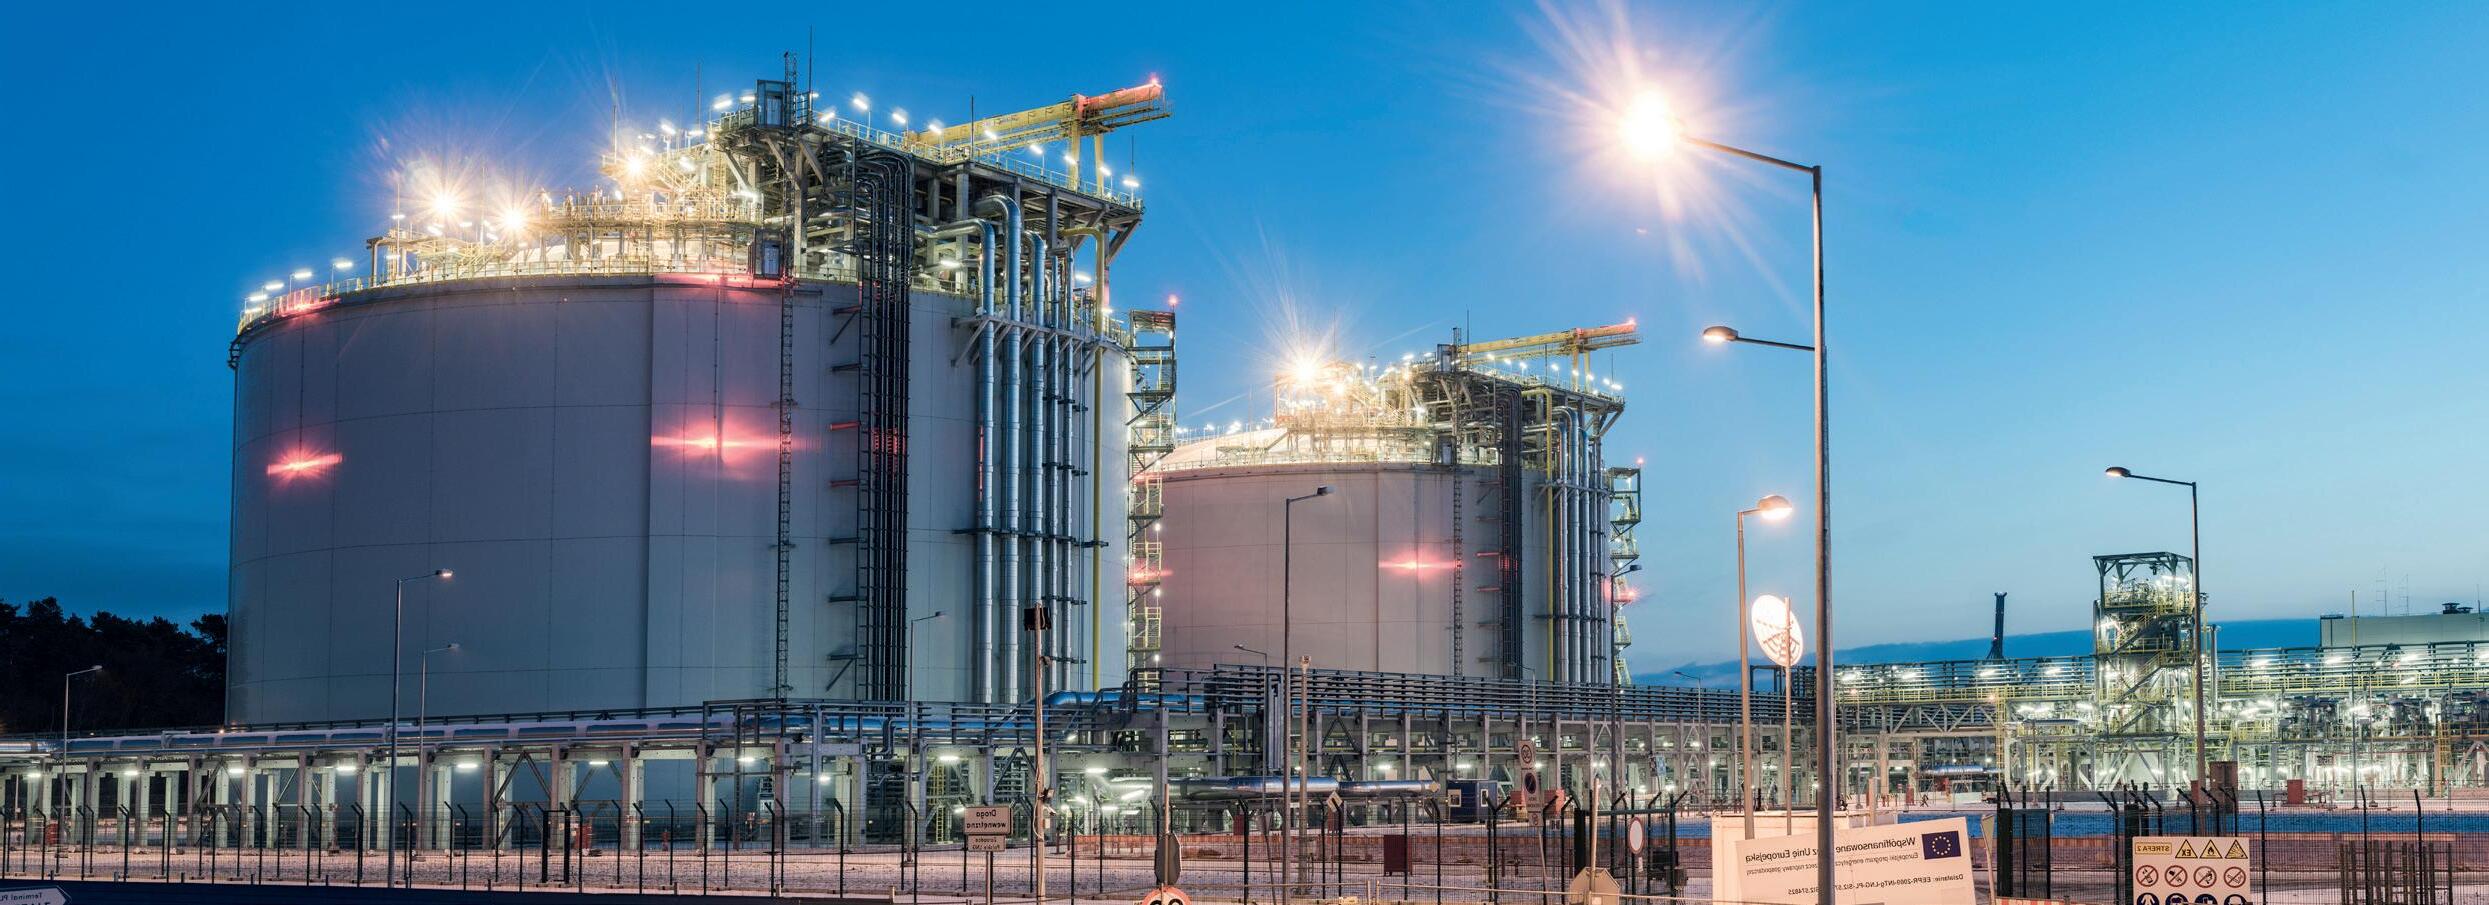
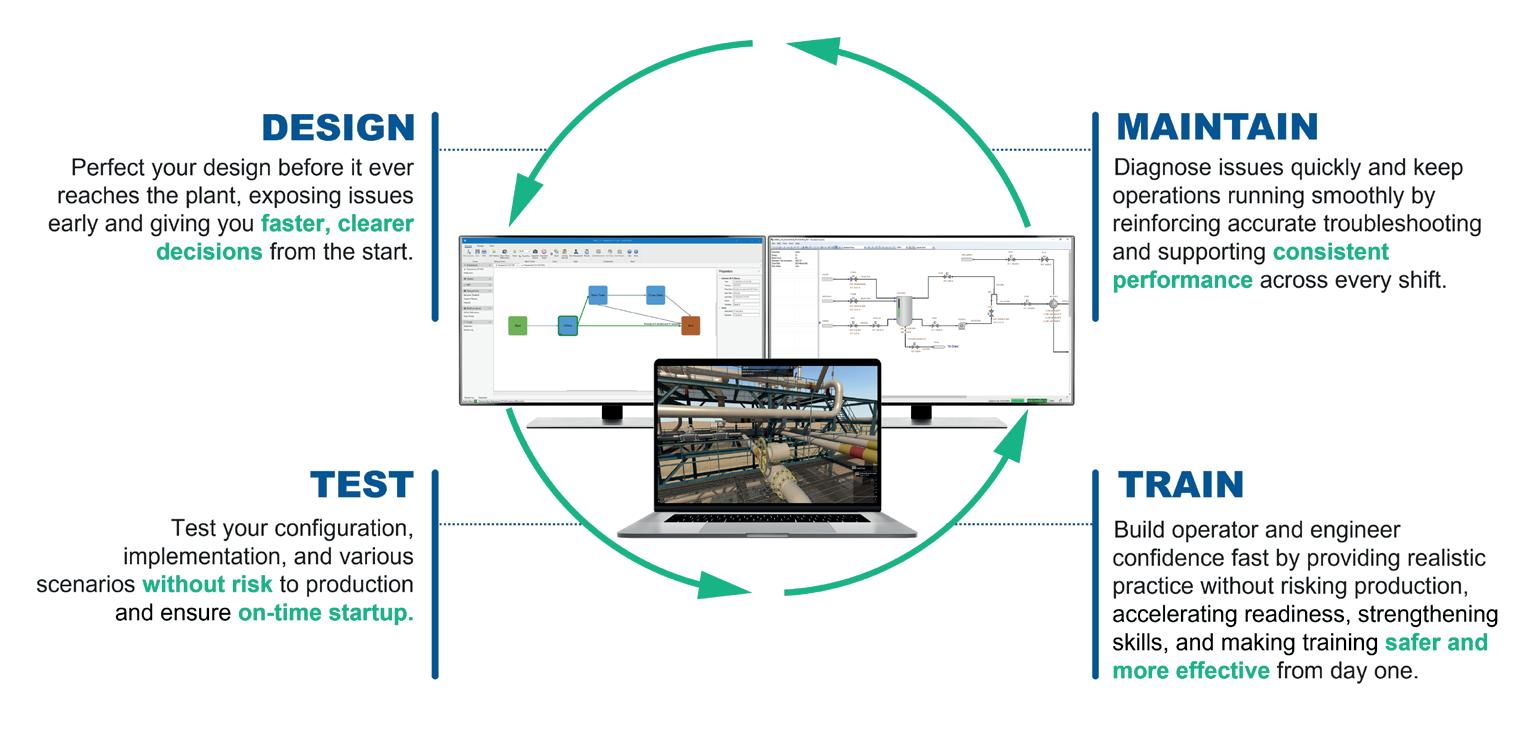
Over the entire LNG value chain, from natural gas production and processing to liquefaction, maritime transfer, and regasi cation there is an abundance of opportunities for optimization and de-bottlenecking to improve throughput, reliability & safety. Improved sustainability metrics naturally follow.
Datacor o ers process and ow simulation solutions—validated in real LNG operations—so your team can take advantage of every improvement opportunity.
www.datacor.com/lng
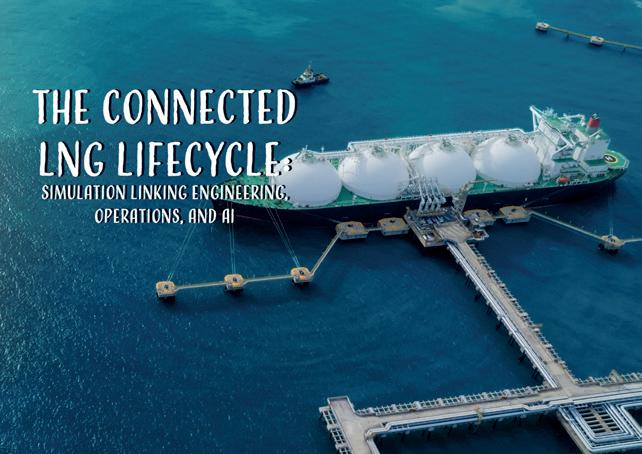
30 The connected LNG lifecycle: Simulation linking engineering, operations, and AI
Brazilian
16 Operating by design
Dean Sahr, Director, New Construction & LNG Engineering, Crowley, provides a comprehensive overview of the thought process behind designing and operating an LNG bunker barge for a US port environment.
21 Solutions for smarter ship navigation, revisited
Six years on from his exploration of e-navigation and voyage planning in LNG Industry, Dr Phil Thompson, Head of Commercial Product Development, BMT, returns to ask how artificial intelligence and digitalisation are starting to reshape pilotage, tug assistance, and port safety.
25 Shaping decisions with simulation
Ana Khanlari, PhD, Datacor Engineering Software Group, highlights how simulation is shaping modern LNG decision-making.
From design validation and operator training to real-time optimisation, lifecycle-ready simulation tied into a unified automation platform delivers speed, consistency, and reliability, says Dawn Marruchella, Emerson, Vice President for Emerson's Guardian Software and Solutions Business.
35
EPC lessons from decades of delivery
Bhupesh Thakkar, Bechtel, USA, maps out how the company has built confidence through decades of EPC delivery for Australia's LNG industry.
39
Closing the resolution gap
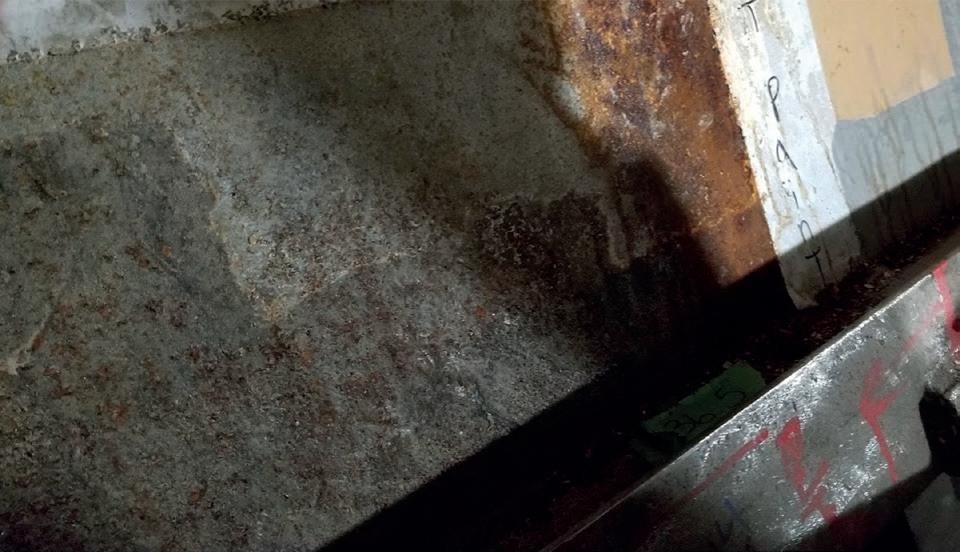
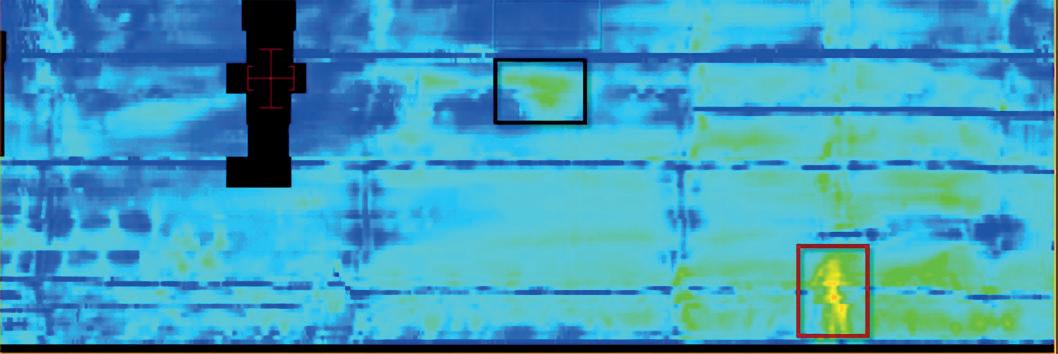
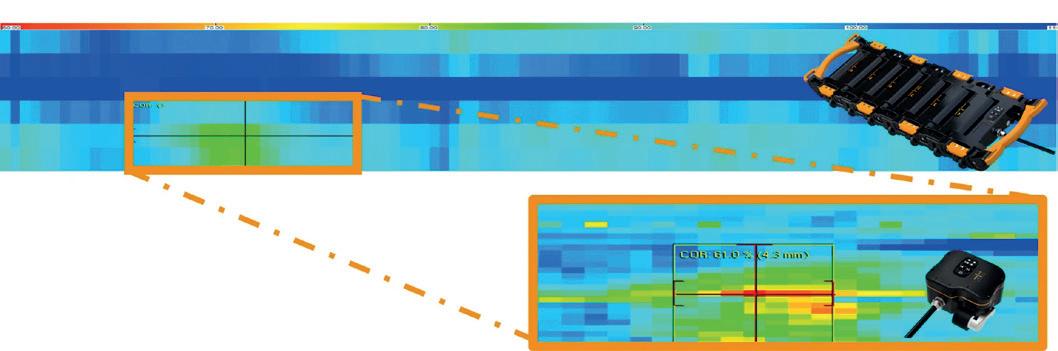
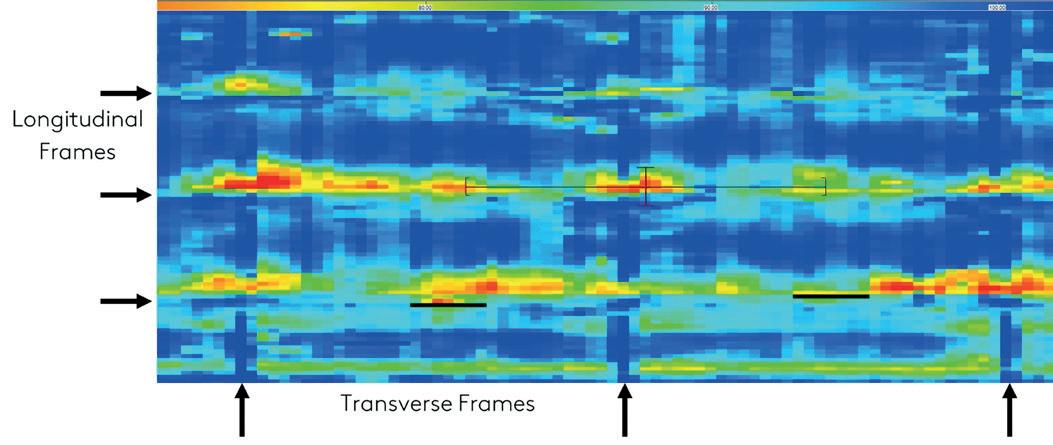
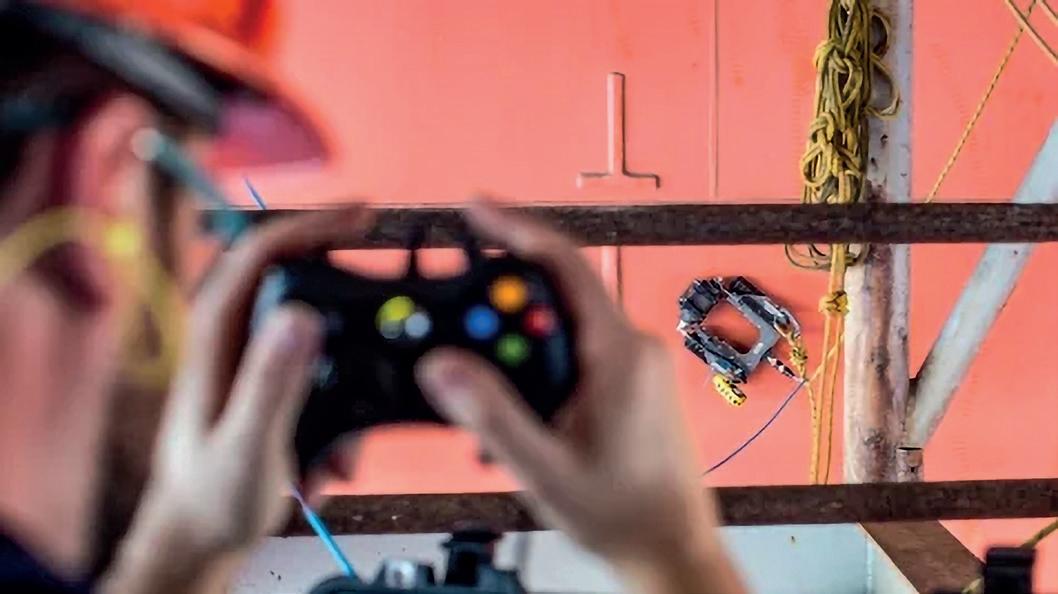
Charles Tremblay and Jeff Abt, Eddyfi Technologies, explain pulsed eddy current inspection for LNG carrier hulls.
43 IOT-based monitoring of LNG transport links
Bernhard Weiland, SAVVY® Telematic Systems AG, examines the reasons for continuous, sensor-based monitoring of LNG assets across the transport chain and evaluates the consequences for all logistics stakeholders – including shippers, carriers, terminal operators, fleet managers, and system integrators.
Managing Editor
James Little james.little@palladianpublications.com
Senior Editor Elizabeth Corner elizabeth.corner@palladianpublications.com
Ahmed Syed Jafri ahmed.jafri@palladianpublications.com
COMMENT
EMILIE GRANT ASSISTANT EDITOR, WORLD PIPELINES
As we are well aware, LNG is one of the fastest growing segments of the energy industry – especially for countries that lack the traditional pipeline infrastructure to transport natural gas. The demand for LNG has only increased in recent years, with the industry feeling the extra strain due to the conflict in the Middle East, and the closure of the Strait of Hormuz, a major shipping route, over the last five months. As a result of this pressure, many LNG markets outside of the Middle East are seeing a silver lining and have begun to flourish, particularly the US.
Looking at other regions beginning to expand their LNG infrastructure, in Africa, Mozambique has plans to benefit from a US$50 billion LNG pipeline. If able to overcome some of the hurdles it has faced, including financing issues, it will take advantage of the Rovuma Basin off its northern coastline in order to recover some of the estimated 130 – 140 trillion ft3 of natural gas that can be found there.1
In Europe, Bosnia and Herzegovina (BiH) has plans of its own for LNG. As countries across Europe try to take a step away from Russian gas, BiH had plans to construct the Southern Interconnect pipeline to diversify supply, and connect the country to Croatia’s Krk LNG terminal. However, the plan has faced major hurdles this year, including aligning with stringent EU energy law, and political contention from the Bosnian government. With the agreed support of Croatia, the project has taken some significant steps forward, but the road ahead is long, particularly when it comes to importing US LNG and potentially jeopardising access to EU funding for the project.2
Across the pond in North America, export capacity for LNG has the potential to more than double by 2029, according the U.S. Energy Information Administration.3 With this in mind, there have been some exciting developments across the continent in the first six months of 2026. In Canada, LNG Canada Phase 2 is expected to make a final investment decision this year. The project is aiming to expand its LNG facility and deliver low-carbon intensity Canadian energy to global markets, with the LNG Canada facility also recently celebrating one year of operations in June. Elsewhere in Canada, Woodfibre LNG’s proposed 2.1 million tpy export facility is now at 60% completion, with substantial completion expected by 2027.4
Over in the Asia Pacific region, the Woodside-led Browse offshore project that is currently under development could become Australia’s next largest LNG export hub, with a projected capacity of 11.4 million tpy.5 Alongside this, Scarborough LNG is supplying the expanded Pluto LNG facility. However, it is worth noting that LNG demand in Asia Pacific is predicted to fall by approximately 4.1% in 2026 (from 268 million t in 2025 to 257 million t in 2026), with this being the second consecutive year that there has been a decline.6 This is likely due to supply constraints and bottlenecks as a result of transit disruptions caused by the conflict in the Middle East – particularly with the closure of the Strait of Hormuz.
Looking forward into 2H26, despite geopolitical tensions, it is important to remain optimistic, with approximately 60% of the total new project supply for the year projected to ramp up during this period. It is clear to see that we are looking at a phase of recovery, but not a total market rebound. As the northern hemisphere nears autumn and ebbs towards the cooler months, this will hopefully help bolster the market improvements as Europe starts to restock reserves, despite the over-arching volatility.7
References
A full list of references is available upon request.
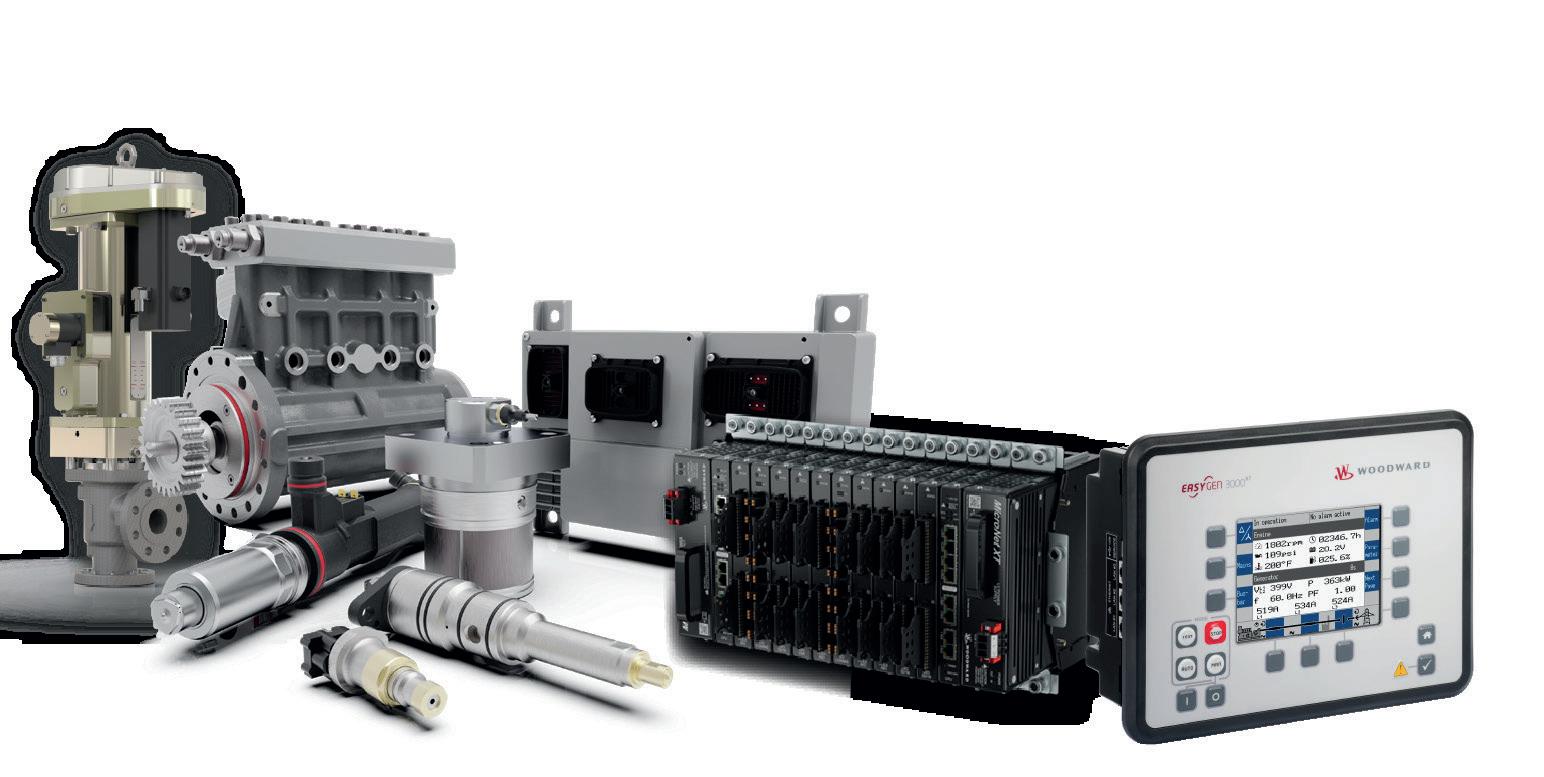
Woodward Gas Turbine, Engine, and Compressor Control Solutions for the LNG Industry
Avoid unplanned outages of your critical compressor and power generation assets by partnering with a control system solution provider with decades of proven experience. Reduce your maintenance and training costs by consolidating control systems into a single, proven platform.
Canada B.C. establishes framework to support Tilbury LNG expansion
The Province of British Columbia (B.C.) has taken a key step to enable FortisBC to move forward with the expansion of its Tilbury LNG facility in Delta.
The Tilbury Phase 1B expansion is expected to provide significant revenues to all levels of government, create highly skilled employment for B.C. residents, and reduce emissions by offering a cleaner alternative to conventional marine fuels. Recognising the project’s significant economic and reconciliation benefits, the Province has issued an order in council that exempts the Phase 1B expansion from the need to obtain a Certificate of Public Convenience and Necessity under the Utilities Commission Act. It provides greater regulatory certainty and optimises the overall investment to be made by FortisBC.
The amendments establish a framework to support the expansion and enable Musqueam Indian Band to acquire interests in the project through a partnership with FortisBC.
It represents a step forward for a project that will deliver significant economic and environmental benefits for B.C., and to meeting the Province’s 10-year goal of attracting CAN$200 billion in major-project investment, as outlined in the Look West strategy.
Mexico
LNGNEWS
Malaysia
Hokuriku Electric and PETRONAS sign HOA
PETRONAS LNG Ltd (PLL), a subsidiary of Petroliam Nasional Berhad (PETRONAS), has signed a heads of agreement (HOA) with Hokuriku Electric Power Co. for the parties to negotiate and conclude the renewal of a long-term LNG supply agreement.
PLL is expected to continue supplying up to 0.54 million tpy of LNG to Hokuriku Electric for a 10-year period from 2028.
The HOA was signed in Kuala Lumpur on 14 July 2026 by Rosdi Ab Rahman, PLL CEO, and Koji Matsuda, President of Hokuriku Electric.
PETRONAS and Hokuriku Electric have also signed a memorandum of understanding (MoU) to explore strategic collaboration on carbon-neutral initiatives. The MoU reflects their shared ambition to build a more resilient LNG supply chain, explore next-generation fuels including hydrogen and ammonia, renewable energy, and decarbonisation technologies such as carbon capture and storage, and carbon capture, utilisation, and storage.
Together, the HOA and MoU mark the continuation and expansion of a partnership that extends beyond LNG, built on supply reliability, operational collaboration, and mutual trust. It also underscores both companies’ shared commitment to advancing practical and collaborative pathways towards a lower-carbon future.
Sempra Infrastructure extends ECA LNG commissioning process
Sempra Infrastructure, a subsidiary of Sempra, continues to advance a series of key priorities in support of its corporate strategy.
One of Sempra Infrastructure’s key priorities is the completion of the ECA LNG Phase 1 project, a one-train natural gas liquefaction facility in Ensenada, Mexico. The project achieved mechanical completion in December 2025 and introduced feed gas into the facility in April 2026. Moreover, the project achieved first LNG production as part of the commissioning process in June 2026 and loaded and shipped its first cargo in early July.
On 27 July 2026, the project announced that it is extending its commissioning process. Following the export
of its first cargo, the plant was shut down for planned inspections, during which time damage was discovered in the project’s refrigerant compressors. Subject to completion of a root cause investigation and the execution of the remediation workstreams being consistent with management expectations, the project is expected to reach substantial completion in 4Q26, with sales under long-term sale and purchase agreements commencing shortly thereafter. Notwithstanding the extension of the commissioning process, Sempra Infrastructure has had strong year-to-date performance and does not anticipate a reduction in its planned earnings contributions relative to Sempra’s segment guidance ranges for 2026 and 2027.
LNGNEWS
Poland
GAZ-SYSTEM names Poland's first FSRU
GAZ-SYSTEM has decided on the name of the first FSRU vessel to be located in the Gulf of Gdansk. In an era when security of energy supply represents one of the key geopolitical challenges, ‘Solidarity’ embodies the spirit of regional collaboration and shared responsibility aimed at building Europe’s resilience.
The FSRU terminal – currently under construction – will be a defining component of Europe’s new energy security architecture. Ventures of this kind are no longer merely construction undertakings, but they have become core elements of states’ strategic resilience in response to changing geopolitical conditions.
The Solidarity FSRU terminal, built at the Hyundai Heavy Industries shipyard in South Korea and chartered by GAZ-SYSTEM from the Mitsui O.S.K. Lines (MOL) Group, will provide regasification services in the Gulf of Gdansk for the next 15 years and beyond.
India
GreenLine partners with Dabur India to decarbonise road logistics operations
GreenLine Mobility Solutions Ltd, an Essar venture and India’s only green logistics operator of LNG and electric-powered heavy commercial trucks, has announced its partnership with Dabur India Ltd, one of India’s leading fast-moving consumer goods companies, to help decarbonise its supply chain through an LNG-powered fleet.
Under the partnership, GreenLine will deploy its LNG-powered trucks across Dabur India’s logistics operations, supporting the company’s efforts to build a greener and more sustainable supply chain. The shift to LNG-powered transportation will help reduce emissions from long-haul freight while maintaining operational efficiency and reliability.
The collaboration reflects the growing momentum among Indian companies to adopt lower-emission freight solutions as part of their broader decarbonisation strategies and transition towards more sustainable supply chains.
USA Baker Hughes secures technology order for Venture Global’s CP2 LNG expansion
Baker Hughes, an energy technology company, has announced a major order, booked in 2Q26, from Venture Global LNG to provide a comprehensive liquefaction solution for its CP2 LNG expansion project in Louisiana.
The award builds on the companies’ established master equipment supply agreement, and the scope includes six liquefaction blocks for a total of 12 liquefaction modules. Each block is based on two single mixed-refrigerant liquefaction modules and related compression trains featuring Baker Hughes' centrifugal compressor technology, as well as cold boxes, air coolers, and integrated control systems.
THE LNG ROUNDUP
X GTT Marine to provide digital solutions for PETRONAS-chartered LNG carrier fleet
X Eni announces FID for Cronos project
X Seaspan Energy completes 150 LNG bunkering operations
X Stabilis Solutions receives LOR from U.S. Coast Guard
X DOE grants Argent LNG long-term authorisation to export LNG
Most LNG tanks resist earthquakes. Few isolate them.
Friction Pendulum bearings
for LNG and cryogenic storage
Most LNG tanks in seismic regions are designed to resist earthquake forces rather than isolate them.
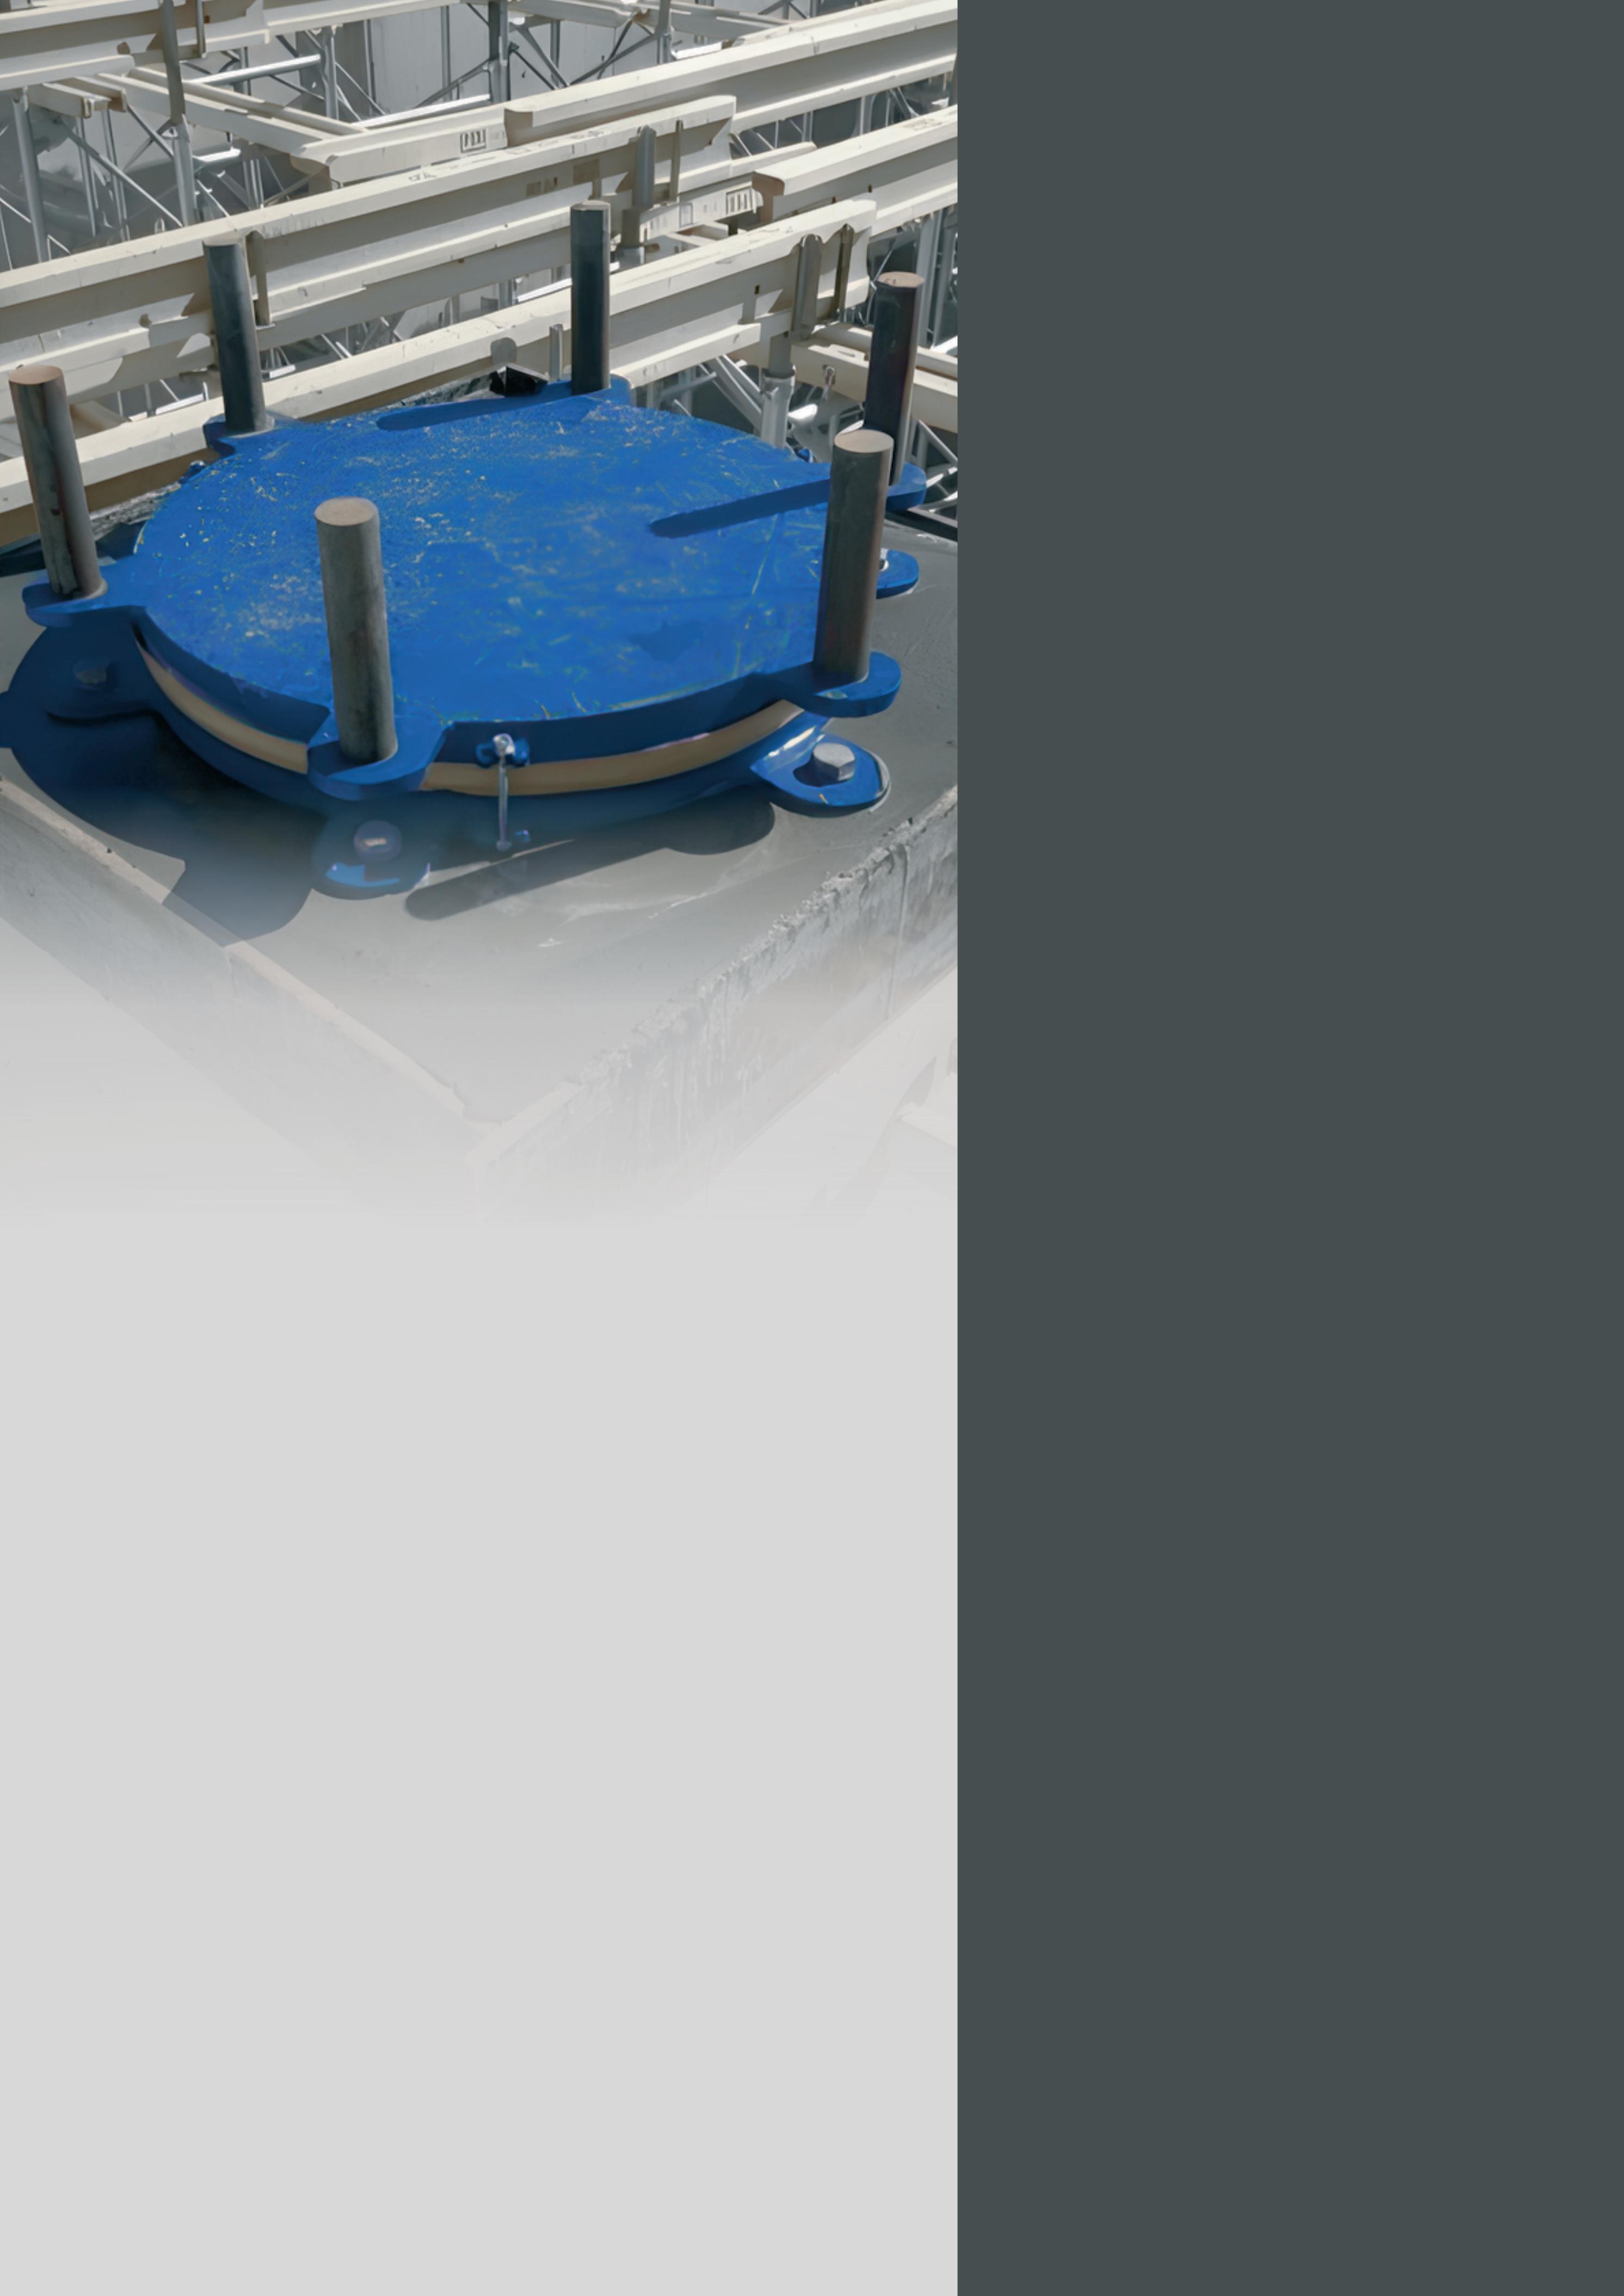
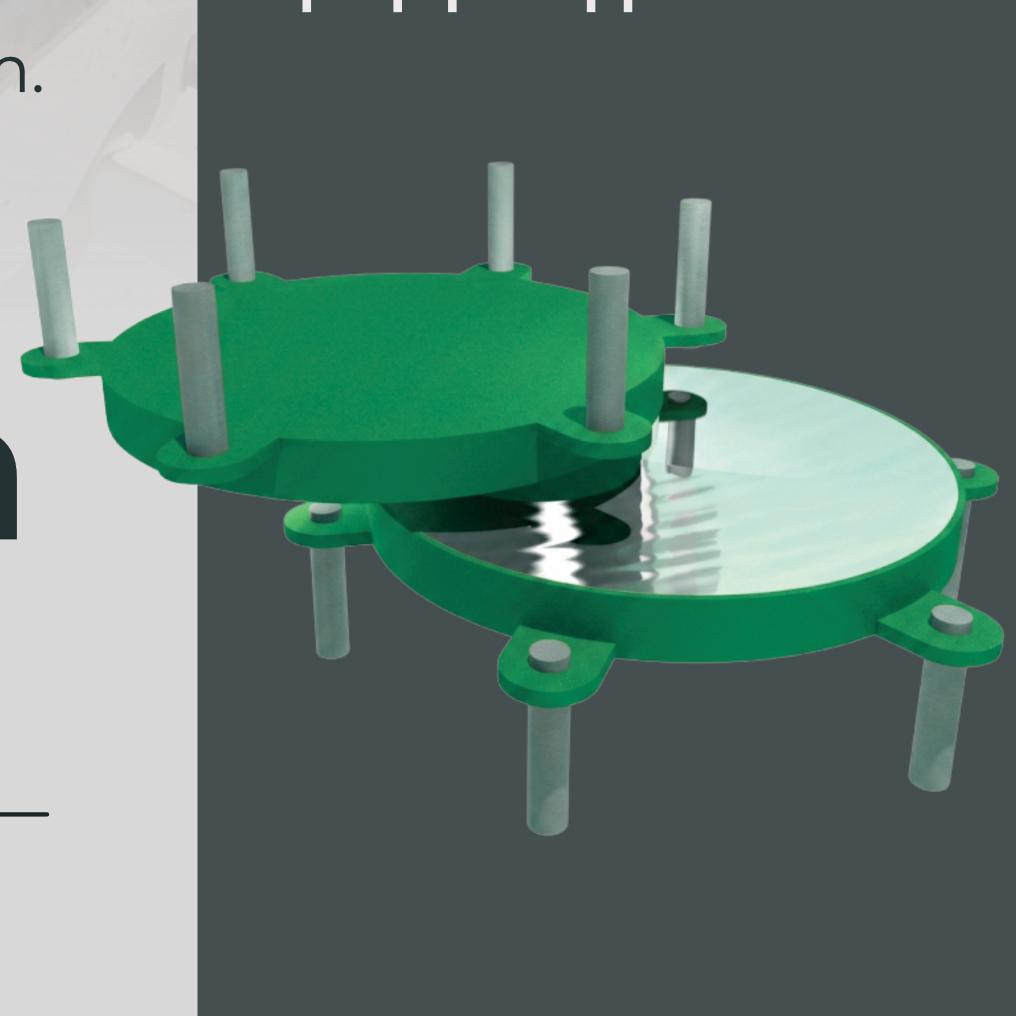
Carpenter & Paterson supplies Friction Pendulum Bearings that provide controlled seismic isolation, dissipate energy through friction and automatically re-centre the tank following a seismic event.
cpa-pipesupports.com
Friction Pendulum Bearings provide an effective seismic isolation solution for LNG and cryogenic storage tanks. Installed beneath the base slab, outside the insulation envelope and operating at ambient temperature, they reduce earthquake forces transmitted to the tank while providing reliable re-centring following a seismic event.
LNGNEWS
Türkiye
01 – 03 September 2026
NISTM's 2nd Annual
Aboveground Storage Tank Conference & Trade Show California, USA www.nistm.org
LNG Operations North America Summit Texas, USA https://lngoperations.ascentisgrp.com
13 – 15 October 2026
Americas LNG Summit & Exhibition 2026 Louisiana, USA www.americaslngsummit.com
02 – 05 November 2026
ADIPEC 2026
Abu Dhabi, UAE www.adipec.com
16 – 18 November 2026
LNG Bunkering Summit North America Florida, USA
www.oilandgasiq.com/events-lngbunkeringna
Storage capacity to increase at Marmaraereglisi LNG terminal
Construction has begun on an additional tanker with a capacity of 160 000 m3, which will increase storage capacity at the Marmaraereglisi LNG terminal, operated by BOTAŞ.
The storage of natural gas arriving by ship in liquid form – whether it is regasified when needed or transported by land tankers while remaining in liquid form – provides flexibility for energy supply security while also ensuring source diversification.
Located in Tekirdag, the Marmaraereglisi LNG terminal plays a strategic role, particularly during the winter months when natural gas consumption is high, with a daily regasification capacity of 37 million m3. The terminal accommodates not only conventional ships in the global LNG fleet, but also high-capacity vessels of the Q-Flex and Q-Max classes.
With an average of 65 LNG ships calling at the terminal each year, it single-handedly meets approximately 15% of Türkiye’s annual natural gas demand, making it one of the most critical components of energy supply security.
In addition to storing LNG delivered by ships and regasifying it for injection into the national transmission system, the terminal also conducts onshore tanker loading, fuelling, and reloading operations.
Germany Nikkiso to provide pumps for German LNG import terminal
Nikkiso Clean Energy & Industrial Gases Group (Nikkiso CE&IG) has secured a significant contract with CS Gas North to provide 16 submerged motor pumps for German LNG Terminal in Brunsbüttel.
Nikkiso CE&IG is manufacturing high-pressure, low-pressure, and ship-loading pumps for the project, which is being built by German LNG Terminal GmbH and scheduled to be operational in 2027.
The terminal includes two LNG tanks, each with a capacity of 165 000 m3, and once operational will have the capacity to send 10 billion m3/y of gas into Germany’s national grid. The project is built around infrastructure for LNG, bio LNG, and synthetic natural gas, but is also designed to enable the transition to even lower-carbon fuel alternatives like hydrogen in the future.
Nikkiso CE&IG has been contracted by the lead EPC contractor, CS Gas North S.L., to provide the pumps for the project.
Ole Skatka-Jensen, Regional Vice-President for Europe, Middle East and Africa at Nikkiso CE&IG, said: “The German LNG Terminal is a crucial part of Germany’s energy future thanks to the supply of LNG and green gases, as well as preparing for the future hydrogen economy.
“Both Nikkiso CE&IG’s presence and our contribution to major energy transition projects in Europe continues to grow. We have expertise in providing equipment and servicing support for not just LNG but also hydrogen and ammonia, and we are proud to be part of such an important project for Germany and Europe’s move to these lower-carbon fuels.”
The award of the contract with CS Gas North S.L follows a similar contract for the Hanseatic Energy Hub in Stade, where Nikkiso CE&IG is supplying 20 low-pressure and nine high-pressure pumps for Germany’s largest land-based terminal for liquefied gases.
SECURING LNG’S FUTURE IN AN UNCERTAIN SHIPPING MARKET
16-18 November 2026 | Orlando, Florida
Join every major stakeholder in the LNG bunkering industry this November as the event dives deeper into the latest developments in regulations, LNG innovations, and maritime strategy to secure LNG's future in an uncertain shipping market.
Book your ticket here!
The future of LNG is no longer just shaped by regulation, but by how effectively the industry can collaborate and demonstrate its needs.
The LNG Bunkering North America Summit provides the platform to do this and ensures LNG remains a viable and scalable pathway.
Download the agenda here!
Brazilian LNG import capacity continues to grow as demand remains static, writes JP Lacouture, Kpler, USA.
Over the last 20 years, Brazil has greatly expanded its ability to import LNG. Currently, there are seven operating regasification facilities in Brazil, by far the most in the Americas. However, actual imports are typically far below total capacity, with annual utilisation normally under 10%. In contrast, utilisation at European import terminals averages between 30 – 50%. Despite this, many new LNG projects have either been proposed or are under construction in Brazil. This begs the question:
is there enough actual demand to support additional growth in Brazilian regasification capacity?
Prior to LNG, Brazil had been reliant on fuel oil and diesel imports to mitigate power shortfalls during periods of low hydropower generation. Sustained high oil prices in 2008 and the early 2010s made the prospect of using liquid fuels for power generation economically challenging. Brazil had also recently started producing from the deepwater pre-salt oilfields, with associated gas
from these developments spurring both the conversion of existing power plants to utilise natural gas and the construction of new gas-fired facilities. Fuel oil, diesel, and coal use as power feedstock became increasingly contentious from a climate standpoint as well.
The start of Brazilian LNG imports
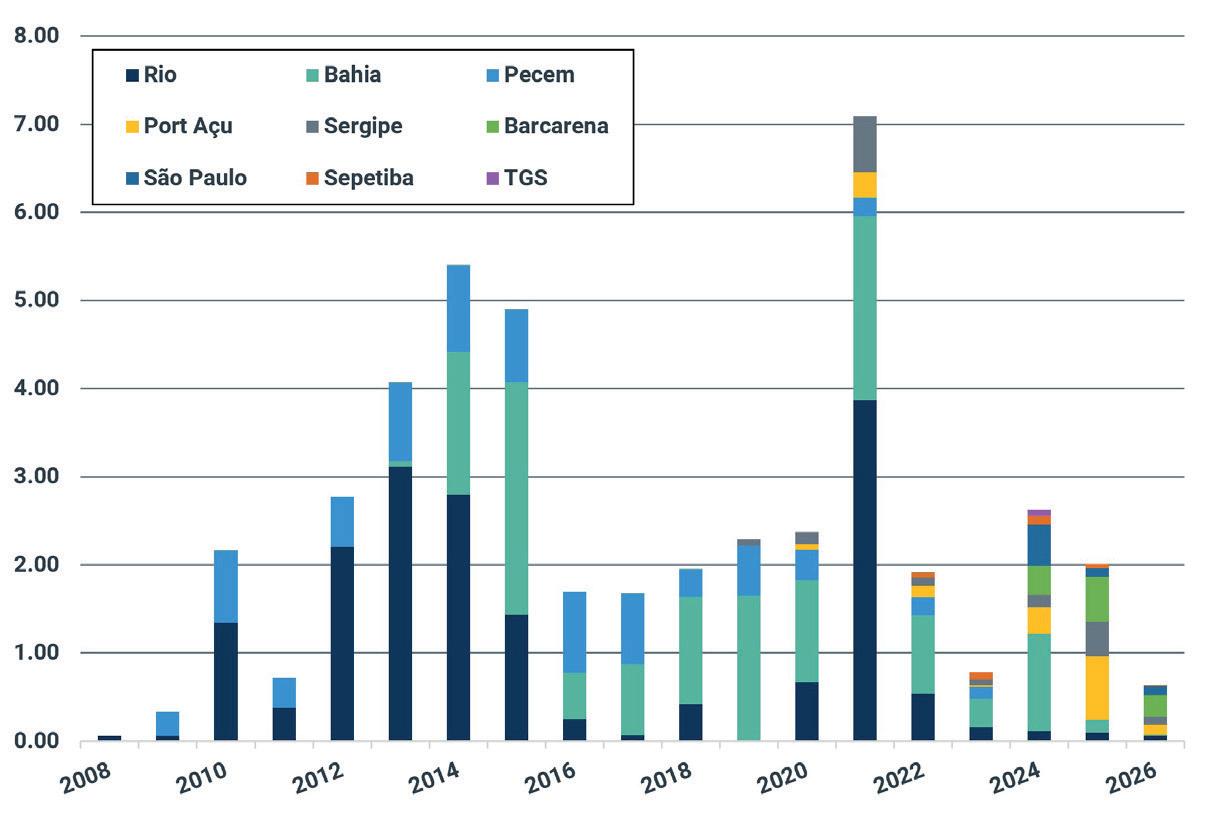
Brazil began importing LNG in 2008 after the start-up of the Guanabara Bay regasification terminal near Rio di Janeiro. Several more import terminals were built in subsequent years, with the Pecem and Bahia facilities constructed in northeastern Brazil in 2009 and 2013, respectively. LNG quickly fell into its designated role as a backstop during periods of low hydropower generation, particularly during the severe 2012 – 2015 drought period which saw LNG become effectively a baseload fuel in the power sector (Figure 1).
Once hydro levels improved in the second half of the 2010s, Brazil returned to primarily importing LNG during the dry season. After importing 4 – 5 million tpy of LNG in 2013, 2014, and 2015, annual LNG deliveries
plummeted to near 2 million t in 2016, a level sustained through 2020. Growing offshore domestic gas production in the southeast, stable hydropower levels, and an accelerating buildout of renewables generation in the northeast began to displace the need to import thermal fuels in general. While an intense drought in 2021 saw Brazil import a record 7 million t of LNG, mostly into Rio and Bahia, deliveries quickly fell to new lows once hydropower levels recovered later that year.
Several new import facilities have been constructed, with Brazil now possessing over 40 million tpy of installed regasification capacity. Most of these more recent projects are third party-led LNG-to-power initiatives, with the terminals directly supplying feed gas to purpose-built power plants. Recent regulatory changes have also enabled third party-operated LNG facilities to inject gas into the domestic pipeline grid. Many of these developments are located in regions with limited access to domestic gas production, particularly the north and northeast.
The first of these projects, a 5.6 million tpy facility located in the northeastern state of Sergipe, came online in 2019 to supply a bespoke 1.5 GW gas-fired power plant. Sergipe was followed by the 5.6 million tpy Port Açu regasification terminal in the state of Rio di Janeiro in 2020. Four additional projects have also entered service, adding a combined 18.5 million tpy of capacity. While total regasification capacity is technically 45.6 million tpy, two terminals comprising 8.5 million tpy, Terminal Gas Sul (TGS) and Pecem, currently do not have FSRUs installed, rendering them idle and unable to import.
Though regasification capacity has significantly expanded, demand has failed to keep pace. With 2 million t of LNG imported in 2025, overall utilisation stood at only 6%. Despite this, there are still many planned and under construction projects. Recent power reserve capacity auctions awarded capacity to several new LNG-to-power projects, including two that would see FSRUs return to both Pecem and TGS (Table 1).
The rise of renewables
Though many market players are doubling down on gas-fired power in Brazil, the usage of thermal generation appears to be waning rather than growing, particularly when considering the rapid buildout of wind and solar generation.
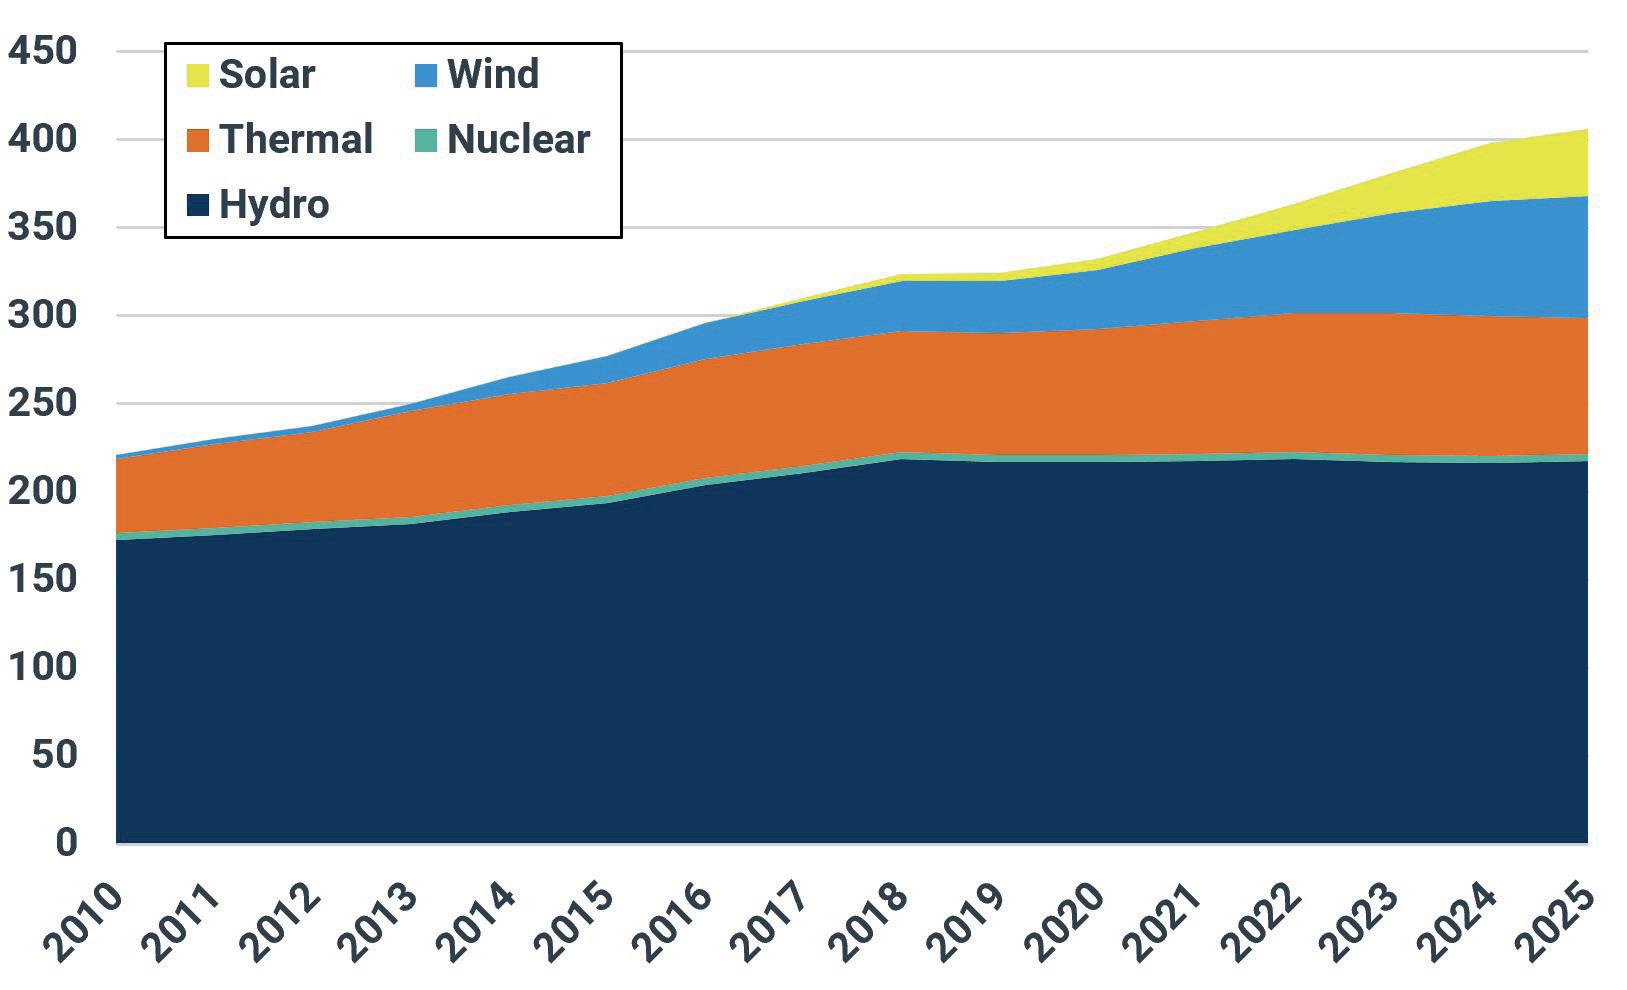
Solar and wind generation has increased dramatically over the last decade, rising from roughly 6% of Brazil’s installed capacity in 2016 to nearly 27% in 2026. In terms of raw output, wind and solar delivered 207 TWh to the grid in 2025, up from 33 TWh in 2016. In the context of the total power market, demand grew from 567 TWh in 2016 to 710 TWh in 2025, a 142 TWh increase. Thus, not only have renewables kept pace with rising power demand, but have also actively displaced other fuels in the power mix,
Table 1. Regasification capacity by facility (million tpy)
Figure 1. LNG imports by facility (million t).
predominantly thermal. Thermal generation accounted for roughly 18% of electricity produced in 2016, falling to 11% in 2025 (Figure 2).
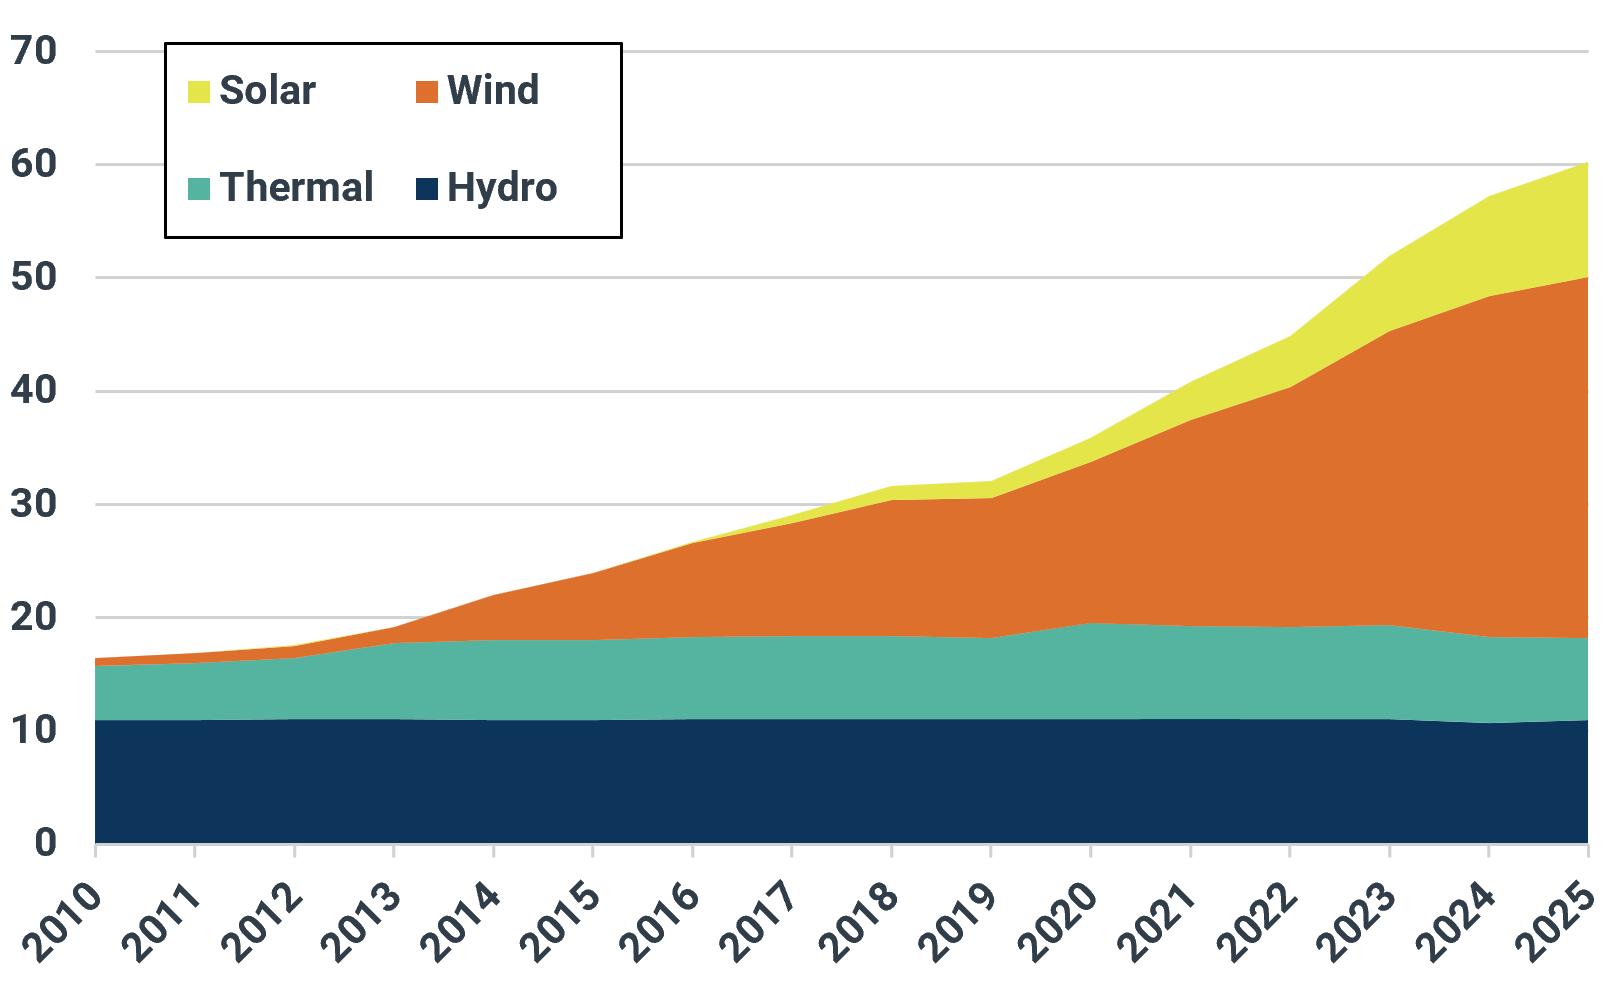
Much of the buildout in renewables has taken place in the northeast, which historically relied more heavily on thermal generation than other areas of Brazil. With limited access to domestic gas supply and the lowest regional hydropower generation potential, coal, diesel, and fuel oil were all baseload fuels for power generation for many years. The construction of large wind farms in the northeast began in earnest in early 2014, with capacity rising from 1.6 GW to 31.5 GW in 2026. The first large solar generation facilities came online in 2017, with capacity increasing from 0.01 GW to 11.2 GW by 2026. Wind now comprises 50% of installed generation capacity in the northeast, while solar accounts for 18.5%. Thermal generation fell from 29% of the generation mix in 2016 to only 11.8% while hydropower decreased from 45% to 18%. In terms of actual output, renewables produced 80% of the electricity dispatched in the northeast in 2025, with thermal at only 5% (Figure 3).
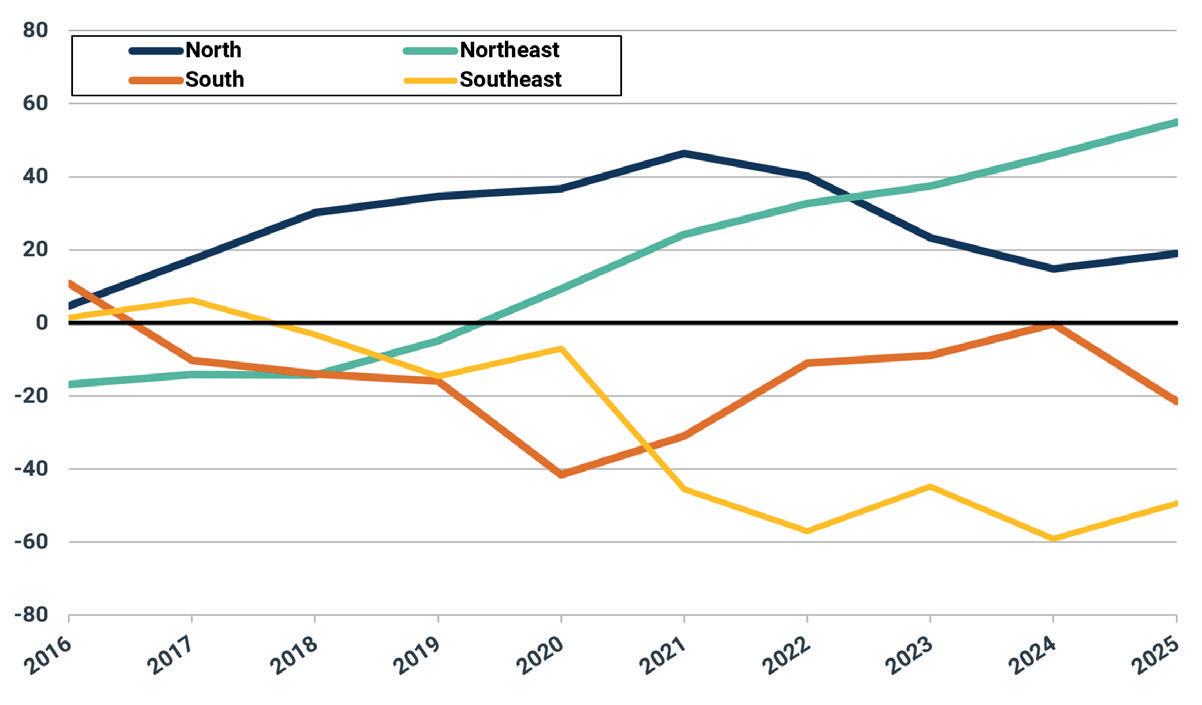
The ascent of renewables has also allowed the northeast to start exporting vast amounts of electricity to neighbouring regions, particularly the southeast. This dynamic allowed for the southeast to both reduce its reliance on thermal generation and preserve reservoir levels. Wind generation also has important counter seasonality with the dry season, with wind speeds
peaking between July and August when hydropower is at its lowest levels (Figure 4).
The southeast experienced a more recent, comparatively modest, expansion to solar generation, with capacity increasing from 1 GW in 2021 to 9 GW in 2026. However, the 58 GW of installed hydropower still dominates the power mix, accounting for 72% of electricity generated in the southeast in 2025, with thermal and solar equally responsible for the remaining 28%.
Domestic gas production growth
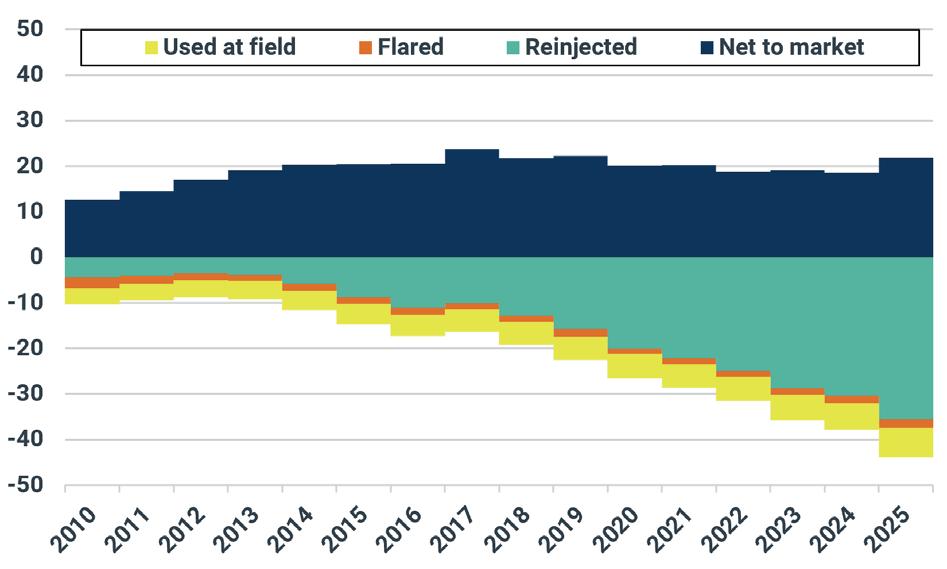
In addition to renewables displacing thermal generation, recent growth in domestic gas production has potentially decreased the need for LNG imports in the southeast, with output having increased from 38 billion m 3 in 2016 to 65 billion m 3 in 2025. In particular, development of deepwater oilfields in the pre-salt areas of the Santos and Campos basins has led to the production of vast quantities of associated gas. However, the majority of produced gas is either reinjected to maintain reservoir pressure or consumed for on-site fuel. Only roughly 30% of Brazil’s gross gas production is delivered to the domestic market, a result of both the prioritisation of oil output and limited pipeline capacity capable of bringing gas to shore. Pipeline constraints were partially alleviated in 2024, when the long-awaited 18 million m 3/d Rota-3 offshore-onshore pipeline entered service.
This, coupled with new oilfields coming online, saw offshore gas deliveries to the domestic market increase from 12.9 billion m 3 in 2024 to 15.6 billion m 3 in 2025, the highest level since 2019 (Figure 5).
The gas produced in the offshore pre-salt areas is delivered to the state of Rio de Janeiro, the largest generator of gas-fired power in Brazil. This may potentially displace the need to import LNG into the Rio,
São Paulo, and Sepetiba import terminals as domestically-produced gas is typically cheaper than imported LNG. Additionally, the increase in gas production helps to offset falling natural gas pipeline imports from Bolivia, which have decreased from 7.3 billion m 3 in 2021 to 4.4 billion m 3 in 2025. Lower flows from Bolivia are primarily a result of declining natural gas production.
An uncertain role for LNG
With skyrocketing renewables output and increased availability of domestic natural gas in key markets in the southeast, the role of LNG appears to be somewhat tenuous. Given the inflexibility of renewables generation and associated gas production, as well as a continued reliance on hydropower and a lack of underground gas storage, LNG is very likely to continue serving as a mostly intermittent, but important, peaking fuel. That said, some facilities have more defined niches in Brazil, especially those supplying more isolated areas of Brazil.
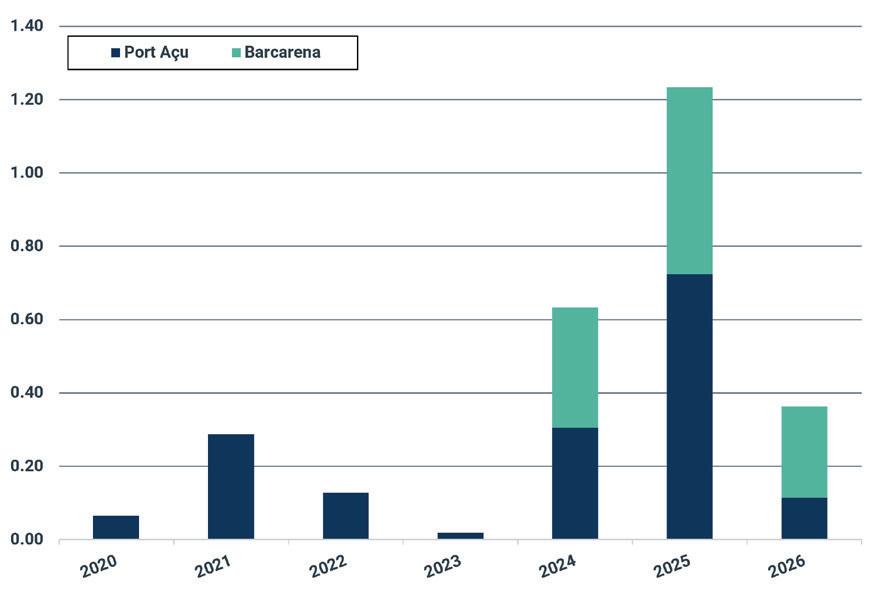
For example, the 6 million tpy Barcarena terminal, located in the far northern state of Pará, has imported LNG consistently since its start-up in 2024. This is a result of the project being underpinned by a 15-year contract with Norsk Hydro to supply gas to the massive Alunorte alumina refinery, which previously relied on fuel oil for on-site power. While the project also includes purpose-built gas-fired power plants, having a large industrial anchor customer requires a steady flow of LNG into the Barcarena terminal. Though the project is the most consistent importer of LNG in Brazil, bringing in a cargo every 1 – 2 months, utilisation remains under 10%.
Unlike Barcarena, the 5.6 million tpy Port Açu project in northeastern Rio de Janeiro is located relatively close to the country’s largest population centres. It has also become one of Brazil’s more regular LNG importers. The facility provides feedstock to the 1.3 GW Gas Natural Açu (GNA) I and 1.7 GW GNA II gas-fired power plants. However, for the first several years of operation, when only GNA I was online, utilisation of the LNG facility averaged only 3%. This changed when GNA II entered service in 2025, which saw utilisation rise to 13% and Port Açu become the largest importer of LNG in Brazil that year. The increase is largely a result of the inflexibility clause in GNA II’s power supply contract, which requires the plant to operate at a minimum of 40% capacity during Brazil’s dry season. While still seasonal, it provides the Port Açu project
Figure 2. Installed power generation capacity by fuel (GW). Source: ONS, Kpler Insight.
Figure 3. Power generation capacity by fuel in Northeastern Brazil (GW).
with guaranteed demand instead of mostly operating when the market is short of gas.
The upcoming Suape LNG project, located in the northeastern state of Pernambuco, however, is looking to operate in a similar manner to previous projects: supplying regasified LNG to the Termopernambuco power plant and hoping to then sell additional gas to other customers in the local market. However, with the development located in the heart of Brazil’s renewable energy boom, the Termopernambuco facility has rarely dispatched since the 2021 drought.
Other projects, such as TGS in the southern state of Santa Catarina and Pecem in Ceara, are also looking to underpin their projects via supply to power plants, though these regions still burn a modest amount of coal that could potentially be displaced.
Despite the headwinds, LNG continues to be more of a focus for developers in Brazil, with several more proposed projects on the horizon. That said, LNG’s place in the Brazilian gas market is likely to remain marginal, relegated to its current role as a mostly backstop fuel during periods of lower hydropower generation. While LNG demand is unlikely to increase in lockstep with regasification capacity, without significant battery storage to support renewables or large underground natural gas storage facilities Brazil will still be reliant on the flexibility that LNG provides. However, it is difficult to imagine a future where Brazil becomes one of the world’s major importers of LNG, particularly given the massive growth of renewables in recent years.
Figure 5. Brazil’s domestic gas production (billion m3). Source: ANP, Kpler.
Figure 6. LNG imports into Barcarena and Port Açu (million t).
Dean Sahr, Director, New Construction & LNG Engineering, Crowley, provides a comprehensive overview of the thought process behind designing and operating an LNG bunker barge for a US port environment.
As LNG-fuelled vessels become a more common feature in global shipping, the focus has shifted from fuel selection to building systems that enable reliable, repeatable bunkering at scale. In US ports, where infrastructure, traffic density, and regulatory frameworks vary from one location to another, bunker barges have emerged as a flexible solution for connecting LNG supply with receiving vessels. Their role extends beyond fuel delivery to include maintaining cargo within precise operating conditions, interfacing with diverse vessel designs, and executing transfers within tightly constrained port environments.
This article examines how these technical and operational requirements are addressed through the design and operation of an LNG bunker barge, using activities in Savannah, Georgia, as a case study to
illustrate how engineering decisions, operational planning, and port integration work together in practice.
LNG-fuelled vessels and bunkering: Global and US context
LNG continues to be one of the most widely adopted alternative marine fuels in commercial shipping, with growth visible in both the operating fleet and forward orderbook. 1 Industry data indicates that LNG-capable vessels have expanded significantly in recent years, with hundreds currently in operation and a substantial pipeline of additional vessels on order extending into the early 2030s. Projections show that the global LNG-fuelled fleet could exceed 1200 vessels by the end of this decade, reflecting continued investment across container, tanker, and passenger segments. At the same time, bunkering infrastructure has expanded in parallel. LNG bunkering
is now available in nearly 200 ports worldwide, with additional locations under development, supported by a growing fleet of specialised bunkering vessels that has increased from a single asset a decade ago to more than 60 in operation today. 2
In the US, LNG bunkering capability remains more geographically concentrated and is shaped by local supply access and regulatory frameworks such as IGC Code, U.S. Coast Guard, and port authority requirements that define safety, handling, and operational limits that influence asset deployment. While global infrastructure spans hundreds of ports, US bunker-barge capacity is comparatively limited, with a small number of operational LNG bunker barges supporting multiple ports and vessel operators. In regions without dedicated bunkering assets, LNG fuelling has been conducted using truck-based delivery, illustrating both the presence of demand and the operational constraints these approaches can introduce at scale. As a result, ports with proximate LNG supply and consistent LNG-fuelled vessel calls are positioned to support higher-frequency bunkering operations. Taken together, these trends indicate that the near-term growth in LNG-fuelled vessel activity is being matched by continued expansion of bunkering access and specialised bunkering assets, even as vessel and port-specific constraints influence how quickly individual regions scale operations.
LNG bunkering demand and the US port context
LNG bunkering demand is increasingly influenced by the availability of infrastructure and the operational realities
of port environments. Where permanent bunkering facilities are limited, bunker barges can provide a mobile solution that enables fuelling at or near the berth without requiring fixed infrastructure at every terminal. In contrast, reliance on alternative delivery methods can introduce logistical complexity for high-volume operations, particularly in ports with significant throughput.
US ports such as Jacksonville, Cape Canaveral, and Savannah in the Southeast, as well as Port Fourchon and the Houston/Galveston region on the Gulf Coast, provide a representative case for examining these dynamics. LNG supply proximity and sustained vessel activity create conditions where bunkering operations must be repeatable, compatible with multiple receiving vessel interfaces, and integrated into a port that is managing continuous throughput. In such environments, operational integration and execution consistency become as important as transfer capability.
Functional requirements for an LNG bunker barge
A useful starting point for bunker barge design is a clear definition of functional requirements tied to the operating profile. At a baseline, the asset must store LNG safely and transfer it to a receiving vessel under controlled conditions, with safeguards that support rapid isolation and emergency shutdown. Depending on customer and operational needs, some bunker barges may also be configured to provide terminal-like services on a mobile platform, such as supporting inerting, gas-up, and cool-down activities that are typically associated with shore terminals.
These requirements translate into design priorities that include thermal performance and cargo conditioning, stable pressure management to match receiving vessel limits, high system availability within port schedules, transfer and measurement integrity for commercial documentation, and port operability driven by mooring, fendering, and environmental operating constraints.
LNG containment approach and cryogenic materials
Containment selection and materials specification are critical factors influencing both safety performance and operational flexibility. For bunker barge applications, C-type tanks are frequently chosen due to their robust pressure capabilities and strong thermal performance. Safety performance is ensured through compliance with established design standards, including the IGC Code and applicable regulatory and classification requirements, which govern containment integrity, pressure relief, and structural design. Utilising pre-approved tank and system designs can help streamline development by reducing the need for repeated redesign and approval processes. Replicating designs that have already been approved by classification societies and regulatory authorities, such as the Coast Guard, can further accelerate the timeline for future builds and minimise engineering effort.
Selecting appropriate cryogenic materials is essential for maintaining system integrity during low-temperature operations and repeated thermal cycles. Tank construction commonly utilises 9% nickel steel, while 304 stainless steel is a standard choice for cryogenic piping. As the
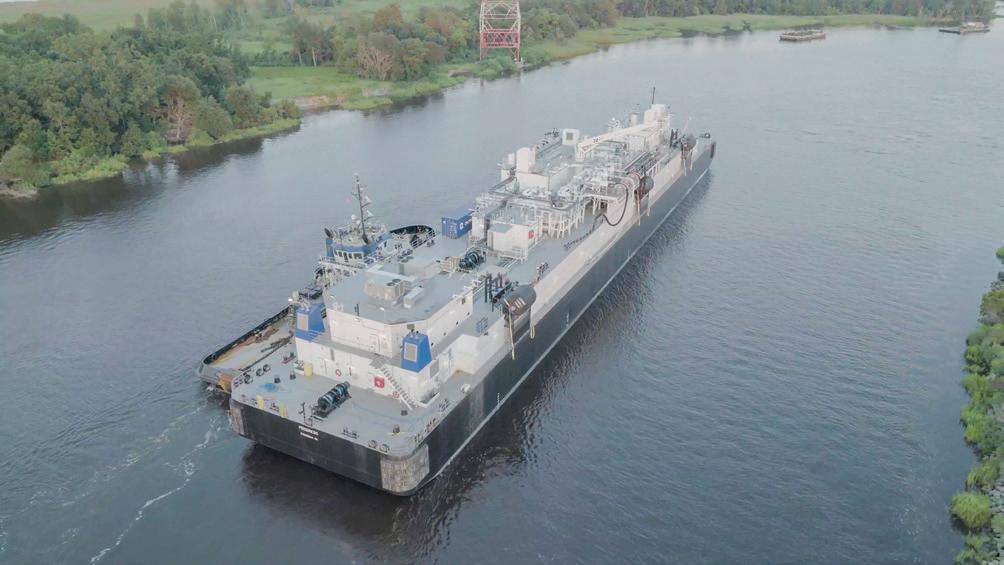
Figure 1. Crowley’s LNG bunker barge Progress transiting Georgia’s Savannah River, providing a consistent supply of LNG to ship operators at the Port of Savannah.
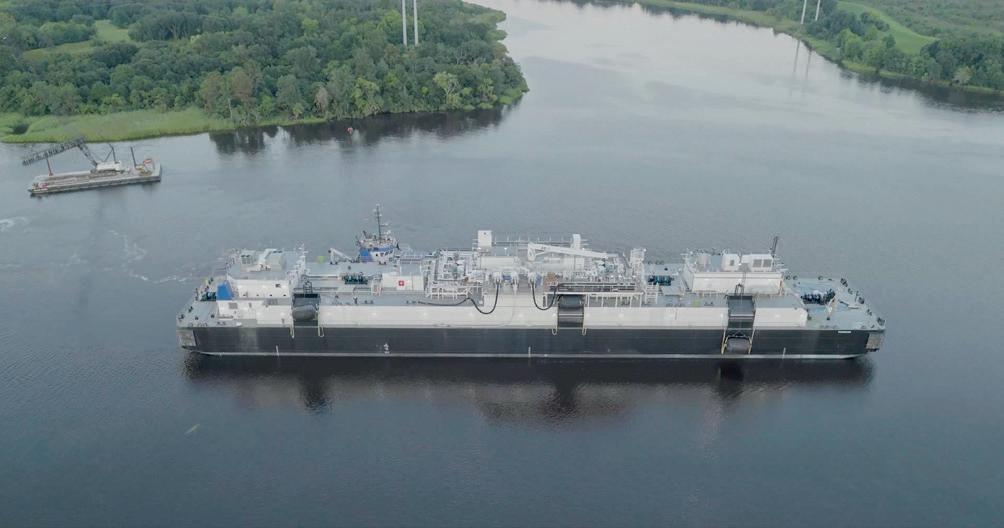
Figure 2. Progress, the largest US-built and flagged LNG bunker barge, is 416 ft long, has a 12 000 m3 capacity, and operates as a floating LNG fuelling terminal.
industry evolves, new materials are being approved for cryogenic service, offering potential benefits for fabrication. However, these alternatives may require adjustments to welding techniques and construction controls. All material choices must adhere to applicable codes, fabrication standards, inspection protocols, and anticipated maintenance requirements throughout the asset’s lifecycle.
Insulation quality should also be a primary design consideration, as it directly impacts heat ingress, boil-off gas (BOG) generation, and the energy required to keep cargo within specified operating limits. Effective insulation is fundamental to achieving optimal thermal performance and minimising vapour production while supporting cargo conditioning strategies that must be sensitive to pressure variations.
BOG and pressure management
Effective BOG and pressure management is essential for bunker barge operability, especially when servicing vessels with low permissible tank pressures. A bunker barge must be able to maintain cargo pressure within a compatible range to avoid operational delays or extended preparation times. Achieving low internal tank pressure targets is often required as part of cargo conditioning to support bunkering to receiving vessels with low-pressure LNG tank systems. Typically, cargo conditioning durations range from 24 – 48 hours, depending on the initial cargo state and readiness requirements.
CRYOGENIC PUMP SURVIVAL!
Managing vapour generation requires a layered approach that combines thermal performance with active equipment capacity. High-quality insulation reduces heat ingress and limits vapour production. Subcoolers can support reliquefaction of vapour when necessary, while gas combustion units provide additional vapour-handling pathways for operational control. Both systems should be sized to meet the demands of typical bunkering operations, such as handling up to 1 tph or approximately 600 m3/h of vapour.
Low BOG generation enhances operational flexibility. When vapour production is minimised and cargo maintains significant thermal capacity, vapour-handling needs during operations can be addressed without continuous reliance on subcooling equipment. Typical boil-off performance for bunker barges is around 0.35 – 0.2% per 24 hours.
Case study: Port of Savannah
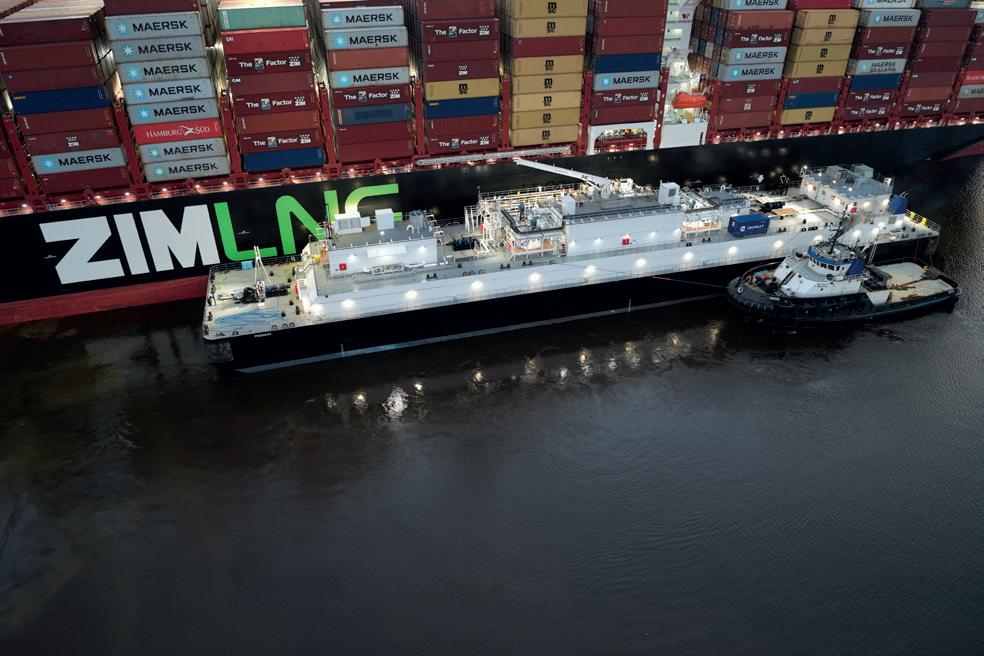
Crowley’s Progress, designed and developed in partnership with charterer Shell, is the largest LNG bunker barge operating in the US at 416 ft and with a capacity of 12 000 m 3. The vessel provides a practical example of how design and operational strategies are applied within a US port environment.
In Savannah, LNG bunkering is driven by the frequent arrival of LNG-powered vessels and the close proximity to LNG supply. Within this dynamic environment, Progress operates as a floating LNG fuelling terminal, offering many of the capabilities traditionally provided by a fixed
shore facility. Its advanced design allows for effective cargo conditioning, seamless interaction with a variety of vessel types, and efficient bunkering operations that accommodate port scheduling and heavy traffic.
A defining feature of Progress is its ability to support vessels equipped with low-pressure membrane LNG tanks, which are common among vessels calling at the Port of Savannah. The barge is designed to condition cargo to low internal pressure levels, enabling compatibility with these receiving systems and allowing LNG transfer under controlled conditions. This capability reflects its broader functional design as a mobile terminal, where preparation steps such as pressure management and cargo readiness can be performed onboard rather than relying solely on shore-based infrastructure.
This operational flexibility is supported by design elements focused on thermal performance and vapour management. The barge’s insulation and cargo handling systems enable low BOG rates, while integrated subcooling and vapour-handling systems allow for controlled management of vapour during transfer operations. Together, these elements support stable cargo conditions and reduce the need for continuous auxiliary operation, which is particularly relevant in a port environment where timing and readiness are critical.
Reliability and operational continuity are further emphasised through a high level of redundancy across pumping, control, power, and instrumentation systems. This design approach aligns with the operational record reported during the first 19 months of service, during which Progress completed 213 transfers across 45 vessels, delivering approximately 1.53 million m 3 of LNG with no missed operations. These metrics illustrate how design choices tied to redundancy and compatibility directly support consistent execution in a high-frequency operating environment.
The vessel also incorporates commercial-grade custody transfer and quality verification systems, reinforcing its role as a mobile fuelling terminal. Dual measurement methods and onboard quality analysis support certified documentation of fuel quantity and composition at the point of delivery. In parallel, proximity to LNG supply at Elba Island enables frequent operating cycles, while ongoing refinements
such as simplified manifold configurations to reduce crew workload demonstrate how operational experience feeds back into design evolution. These combined elements – cargo conditioning, vapour and pressure control, redundancy, verified transfer systems, and operational efficiency – define how Progress functions as a practical floating LNG fuelling terminal within the Port of Savannah.
Scaling LNG bunkering to meet vessel demand
The design and operation of LNG bunker barges reflect a convergence of engineering, operational planning, and port integration requirements that are distinct to the US operating environment. This article has outlined how key design elements work together to support safe and repeatable LNG bunkering operations. Equally important are the operational frameworks that enable these systems to function effectively within active ports, where co-ordination with vessel scheduling, environmental limits, and terminal activity is required for consistent execution.
As illustrated through the case study of Progress, these design principles are not theoretical; they are directly tied to operational performance, enabling a bunker barge to function as a mobile extension of LNG terminal infrastructure. When combined with proximity to LNG supply, trained personnel, and continuous operational refinement, these elements demonstrate how bunker barges can support high frequency fuelling operations within port environments. This level of operational reliability contributes directly to improved vessel scheduling consistency and reduced turnaround uncertainty, which are key considerations for operators integrating LNG into fleet operations.
At a broader level, the continued growth in LNG-fuelled vessels is increasing demand for scalable and adaptable bunkering solutions. In the US, where infrastructure development is more gradual and geographically concentrated, bunker barges provide a practical pathway for meeting this demand without requiring extensive fixed investments at each port location. Their ability to operate within existing port systems, while delivering terminal-level functionality, positions them as a viable and flexible solution for expanding LNG fuelling capability.
Taken together, the technical and operational characteristics discussed in this article support the conclusion that LNG bunker barges are an effective component of the evolving marine fuel supply chain. As LNG-fuelled vessel adoption continues, these assets are expected to play a central role in enabling access to fuel, maintaining operational continuity, and supporting the broader transition in marine energy systems across US ports.
References
1. ‘Global Fleet: The number of vessels using LNG as a marine fuel is growing rapidly’, SEA-LNG, https://sea-lng.org/whylng/global-fleet/
2. ‘Focus on practicality drives LNG pathway growth in 2024’, SEA-LNG, (23 January 2025), https://sea-lng.org/2025/01/focuson-practicality-drives-lng-pathway-growth-in-2024/
Figure 3. Progress conducting its first bunkering operation with the cargo ship Zim Mount Vinson in the Port of Savannah in 2024.
Six years on from his exploration of e-navigation and voyage planning in LNG Industry, Dr Phil Thompson, Head of Commercial Product Development, BMT, returns to ask how artificial intelligence and digitalisation are starting to reshape pilotage, tug assistance, and port safety.
In an article for LNG Industry in 2020, it was argued that the progressive fusion of richer, machine-readable hydrographic data would reshape e-navigation and voyage planning for the LNG sector and the wider shipping community. The vehicle for that change was the International Hydrographic Organisation’s S-100 Universal Hydrographic Data Model: a framework designed
to carry not just charts, but high-resolution bathymetry, water levels, surface currents, and under-keel clearance information within a single, interoperable display.
At the time, S-100 was a framework rich in promise but short on operational products. That has now changed. In January 2026, the first phase of S-100 product specifications entered into force, and S-100-capable ECDIS became legal to use, with a transition period running to 2029 during which S-57 and S-100 charts will operate in parallel – the so-called ‘dual-fuel’ period. The future that was described is, in a real sense, now closer to arriving on the bridge.
But the more profound shift since 2020 is not only about better charts. It is about what can be done with the data once it has been obtained. The same period has seen rapid maturing of the tools that turn data into decision support – fusing high-fidelity simulation, digital forensics, and machine learning (ML) that is increasingly supporting some of the people making the hardest calls in a port, including pilots and VTS operators, as well as vessel traffic control. That is the story worth telling in 2026.
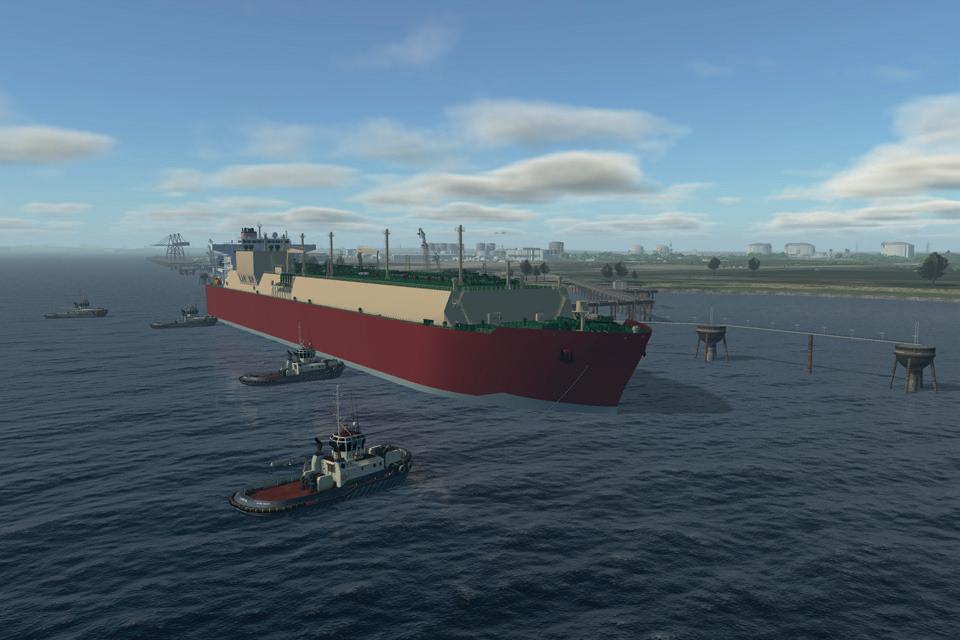
Figure 1. An LNG carrier is guided to berth under tug escort within BMT’s REMBRANDT digital twin – the same high-fidelity environment used to generate the hundreds of thousands of synthetic manoeuvring scenarios that underpin BMT’s AI pilot and tug-assist consultancy and advisory services work.
The future of port risk assessment is poised for significant transformation, driven by technological advancements and evolving regulatory requirements. It begins with a more thorough understanding of potential high-impact, low-probability risks, allowing LNG stakeholders to forge robust mitigation strategies that ensure both compliance and financial security. As ports and terminals grow in complexity, innovative risk assessment methods – quantitative and qualitative alike – are becoming essential. And the integration of artificial intelligence (AI) and ML, drawing on rich datasets from past incidents, is set to enhance predictive analytics, allowing port and terminal stakeholders to assess risks more accurately and put effective mitigation in place.
From richer charts to richer decisions
The value of S-100 for deep-draught vessels in tidal, constrained channels is much as was set out in 2020. The S-101 electronic navigational chart provides the base layer; S-102 adds high-resolution bathymetry resolved to centimetres rather than coarse contour bands; S-104 and S-111 bring dynamic water levels and surface currents; and S-129 supports under-keel clearance management. For an LNG carrier working a long-tidal, controlled transit window, the operational prize remains the ability to plan to the vessel’s actual draught and the real tidal height, widening access and operability windows while protecting safety margins.
Yet charts, however dynamic, describe the environment. They do not tell a pilot what will happen if a tug is made fast a minute late, if an engine trips in a cross-current, or if a chosen speed is fractionally too high for the bend ahead. The next frontier is not a better description of the water – it is a credible anticipation of outcomes. That is where AI advisory tools come in, and where the harder engineering problem lies.
The data problem behind AI advisory tools
The appeal of an AI-based pilot and tug-assist advisory tool is easy to state: an early-warning system that recognises a developing situation and proposes safe alternative paths. The obstacle is data. Supervised ML needs vast, labelled datasets, and not just of routine arrivals and berthings, but of the rare, dangerous combinations of speed, tug configuration, weather, tide, and equipment failure that define the edge of safe operation.
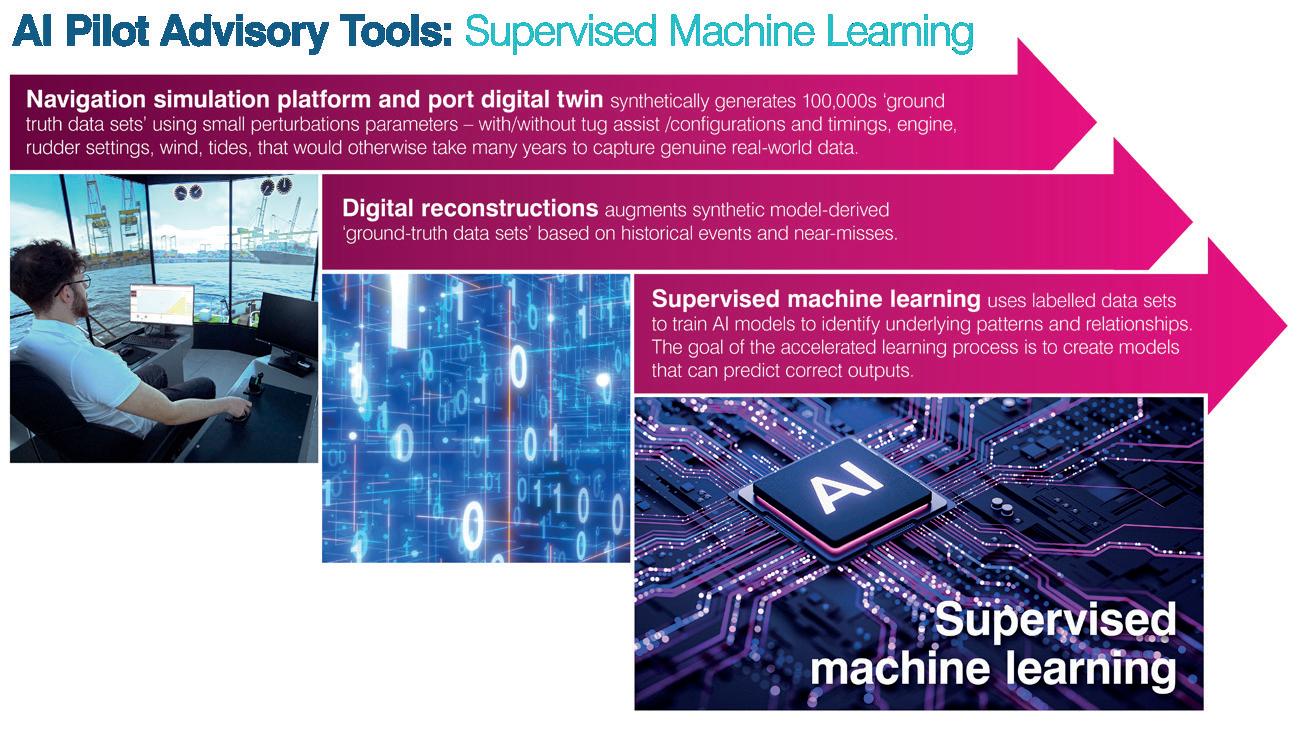
Figure 2. From historic incident records and BMT REMBRANDT-generated synthetic scenarios to trained recurrent neural networks: BMT’s supervised machine learning workflow shows how simulation and digital forensics are fused to deliver real-time path planning and early-warning support for pilots and tug masters.
The alternative to synthetic data would be to wait and collect enough real-world data to populate those datasets. In practice that would take many years and is not a sensible option – not least because the most instructive scenarios are precisely the ones no port wants to experience. The way through is to generate the data synthetically, at scale, in a high-fidelity simulation of the specific port and ship.
Fusing simulation, digital forensics, and machine learning
This is an area BMT has been exploring through REMBRANDT, its real-time manoeuvring, berthing, and training simulation platform. The approach is less a novelty than a long evolution: REMBRANDT is DNV-accredited and has been used for port feasibility and pilotage studies for over 35 years, building on a heritage in maritime simulation that reaches back through the National Maritime Institute and 60 years of operating towing tanks and manoeuvring basins. What is new is the ML layer now placed on top. Recently brought together with synthetic environments and a remote operations centre in BMT’s new Digital Innovation and Simulation Centre, and operating as a port-specific digital twin, the platform can generate hundreds of thousands of synthetic ‘ground-truth’ datasets by running ship and port-specific manoeuvres with small perturbations in each scenario: tug assist configuration and timing, bollard pull, engine and rudder settings, the pilot’s chosen speed, wind, and tide. Crucially, the same approach can model emergency responses such as loss of propulsion, loss of steerage, tug failure, and collision-avoidance measures – the very events that real-world data sets so rarely capture.
BMT has worked in collaboration with the US NTSB, the UK MAIB, and Singapore TSIB for several years to develop a range of digital forensic tools in REMBRANDT that allows the augmentation of this ML approach. Alongside synthetic data generation, the simulator can
reconstruct real incidents and near-misses using direct feeds from voyage data recorders automatic identification systems, and portable pilot units. This digital-forensic capability allows historical events to be replayed in 3D and then folded back into the training environment so that ML models learn from genuine casualties as well as simulated ones. Trained on these combined datasets, recurrent neural networks can offer path-planning suggestions and warnings for potential incidents arising from the variables in any chosen scenario.
The intent is not to remove the pilot or tug master from the decision, but to give them an early warning system and a set of safe alternative paths grounded in both historical and synthetic experience. It is one approach among several the industry is pursuing; the broader and more durable point is the method, fusing state-of-the-art simulation, digital forensics, and supervised ML to compress decades of operational experience into something usable today.
Preparing for the worst
The same digital reconstruction capability has an obvious application after a serious casualty. Recent high-profile incidents – among them the loss of the Francis Scott Key Bridge in Baltimore in 2024 – are a brutal reminder of how quickly a single ultra-low probability failure can trigger an extreme, catastrophic event when it occurs in a confined channel and in the vicinity of critical infrastructure. The combination of ultra-low
GIVING YOU RELIEF UNDER PRESSURE
probability but high consequence events represents a traditional blind spot in the training of masters, pilots, and other port and terminal stakeholders. But this is exactly where digital forensics and synthetic, data-based ML can fill the void. Generating such events in a high-fidelity synthetic environment and exploring how different emergency response strategies (e.g. escort tug policies, emergency anchorages, channel transit speeds) might have unfolded, builds a transferable digital library of lessons for port and terminal risk assessments and stakeholder training. The aim is never to second guess those who faced an unforgiving situation in real time, but to learn from it collectively. As vessel sizes and traffic density continue to increase and intensify in many ports, that kind of structured, simulation-led learning is becoming a basic tool of due diligence rather than a refinement.
There is a human dimension to this that is easy to overlook. Work on crisis decision-making consistently shows that time is the enemy of good judgement: under acute pressure, people decide faster, lean more heavily on heuristics and bias, and tend to produce lower-quality outcomes. What counters this is prior experience and the rare, high-consequence scenario is precisely the one a pilot or tug master is least likely ever to have met. A synthetic training environment and even a synthetic, data-based ML pilot advisory tool would offer a way to close that gap, letting crews rehearse the worst case repeatedly and safely, so that when seconds matter the response is drawn from experience rather than improvisation. It is the point at which the data problem and the human problem turn out to be the same problem.
A regulatory tailwind and the autonomous horizon
2026 is proving a landmark year for the policy framework around all of this. Alongside S-100 becoming operational, the International Maritime Organization (IMO) adopted its first Code of Safety for Maritime Autonomous Surface Ships (the MASS Code) at MSC 111 in May 2026. Adopted as a non-mandatory, goal-based instrument effective from 1 July 2026, it sets out a framework intended to hold remotely operated and autonomous ships to the level of safety, security, and environmental protection expected of a conventional ship, with a structured experience-building phase to follow and a mandatory code targeted for the early 2030s.
Notably, the code keeps the human element and accountability at its core. For port and terminal operations, the realistic near-term picture is not crewless ships but a spectrum of supervised, autonomous, and remotely-supported operations, and harbour tugs may well sit at the leading edge of that transition, as projects such as the IntelliTug collaboration in Singapore have shown. The same synthetic-data-and-forensics method that can train a human advisory tool is precisely what is needed to train and assure future autonomous designs. Demonstrating that such a system behaves safely and correctly is best done in a synthetic environment first, where extensive, accelerated performance ‘stress-testing’ includes all forms of extreme scenarios that can be deployed, allowing incremental improvements before
autonomous designs even enter the water. That, too, is how the evidence base for the experience-building phase will, in part, be built. For the master mariners and pilots at the heart of these operations, the code’s insistence on human judgement and accountability is precisely the reassurance this transition needs.
Safety and sustainability are the same conversation
It would be a mistake to treat the safety case and the sustainability case as separate. The industry increasingly describes the port of the future in four words – smart, safe, secure, and sustainable – and the threads are more tightly bound than they first appear. Optimising speed in channels, widening long-tidal operability windows, and selecting the best tug deployment options (the operational prizes that richer data first unlocked) all reduce fuel burn and emissions while improving port access. Fewer incidents also avoid the very real environmental and economic costs of a casualty. The dynamic data layers now arriving under S-100 underpin all of it, and ML advisory tools help translate that data into the marginal decisions that, aggregated across thousands of port calls, add up to a more efficient and lower-carbon operation.
This is also where navigation safety meets the wider decarbonisation agenda that ports, consultancies, classification societies, and academia are increasingly tackling together, from future fuel road-mapping to the environmental and economic modelling that quantifies the trade-offs. None of it is the work of any single organisation; the value lies in connecting the data, disciplines, and institutions that have historically sat apart. In short, safety and sustainability are two sides of the same decision: the same richer data and decision support that make a port call safer are exactly what make it cleaner.
None of this displaces the seafarer. The pilot and mariners remain the decision-makers; the role of the data, the simulation, and the advisory tool is to widen the options in front of them and to flag risk earlier than instinct alone would allow. That principle – keeping human judgement and accountability at the centre, even as the systems around them grow more capable – is the same one the IMO has written into the foundations of the MASS Code, and it is the right one to carry into everything that follows.
Conclusion
In 2020, the argument was that progressive data fusion would make navigation smarter and safer. In 2026, the data standards are arriving on the bridge, and the methods to exploit them, fusing simulation, digital forensics, and ML, are maturing fast. The opportunity is to move from describing the environment to anticipating it: safer pilotage, better-trained tug masters, a credible and well-evidenced path towards progressive, assured autonomy, and ports and terminal operations that are at once safer and more sustainable. The tools to support that journey are taking shape; the task now is to apply them thoughtfully, with safety and the human element firmly at the centre.
Ana Khanlari, PhD, Datacor Engineering Software Group, highlights how simulation is shaping modern LNG decision-making.
With global energy demand continuing to rise, the world is turning to both renewable and non-renewable energy sources. While solar, wind, nuclear, and bio-based energy each offer clear advantages, they face scalability and reliability challenges. LNG, by contrast, has emerged as an energy transition fuel strengthening all three pillars of the energy trilemma.1
The importance of LNG to energy security became especially evident in the aftermath of the Russia-Ukraine war, when LNG exports from the US and Qatar provided a
critical supply lifeline to European industries. While the longer-term impacts of recent Middle East geopolitical tensions and infrastructure damage remain uncertain, LNG nonetheless continues to stand out as a leading energy transition fuel and a critical contributor to global energy security.
Over the past decade, the LNG industry has benefited from growing global demand. Its immediate availability and operational flexibility make LNG a leading option for fuelling power generation, from India to Vietnam.2
In addition to power generation, industrial users, residential heating, and maritime transportation continue to drive LNG consumption.
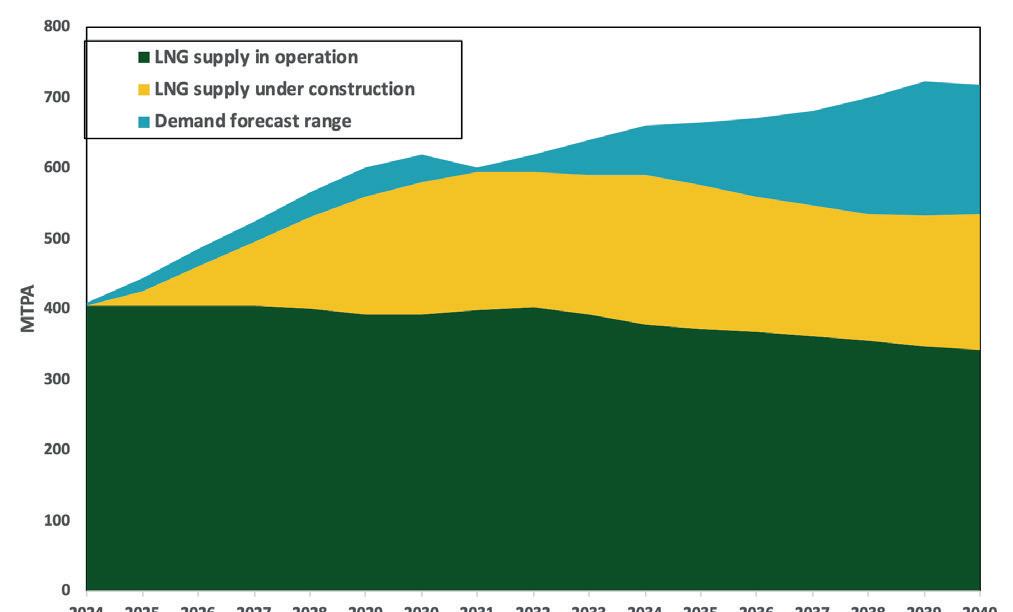
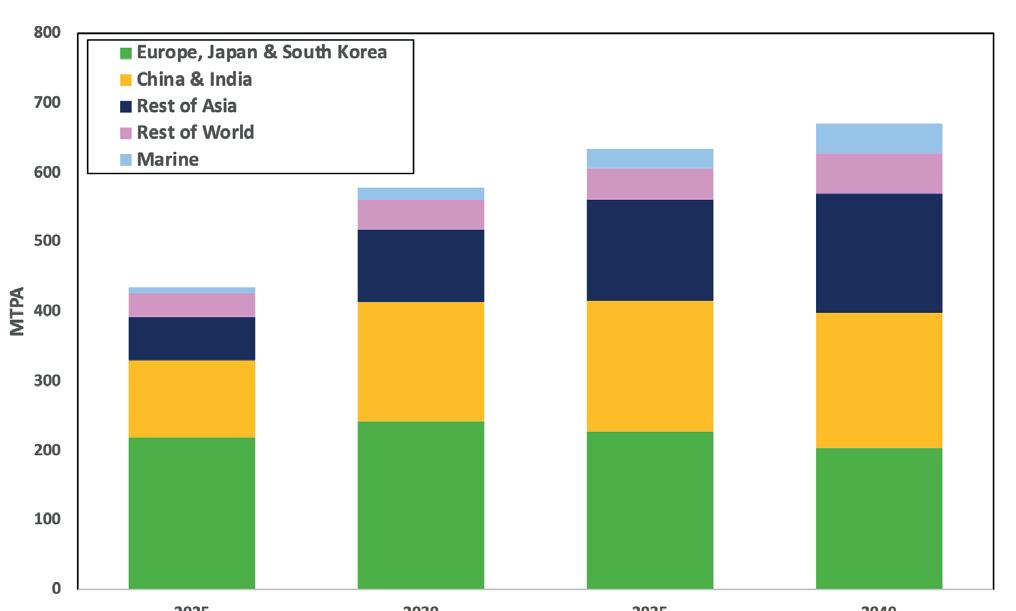
Looking ahead, the primary drivers of LNG production growth over the next decade include rising electricity demand associated with artificial intelligence (AI)-driven digital transformation, increased adoption of LNG in the transportation sector, and the gradual replacement of higher-carbon fossil fuels with lower-carbon gas alternatives. 3 Figure 1 summarises the global LNG supply and demand outlook until year 2040 and regional demand increases during the same period. 3
The global landscape of LNG suppliers and consumers is evolving rapidly. According to the Shell LNG Outlook, the US became the world’s largest LNG exporter in 2024, followed by Australia and Qatar. On the demand side, Asia (excluding China), China, India, and Europe remain the primary LNG importing regions. Although the changing regulatory landscape, like Europe’s Carbon Border Adjustment Mechanism (CBAM), can impact global trade by increasing cost associated with upstream emissions and carbon tax price.
One of the fastest growing segments of LNG consumption is maritime transportation. The number of vessels operating on LNG is expected to increase from approximately 250 in 2015 to more than 2000 by 2029.4 As a marine fuel, LNG is outpacing methanol, LPG, and ammonia due to its relative technological maturity, established bunkering infrastructure, and immediate availability. As a result, the development of new technologies to improve engine efficiency, reliability, and fuel gas management has become a key industry focus.
Despite the benefits of LNG as a transition fuel, significant challenges remain across the LNG value chain. A 2025 International Energy Agency (IEA) report estimates that approximately 350 million t of CO2-e emissions are associated with global LNG activities, with nearly 30% attributed to unburned methane released through leaks and ageing gathering, transmission, and distribution infrastructure. 5 Addressing these emissions while improving overall value chain efficiency remains a critical priority.
For LNG operators and the engineering firms that support them, staying competitive now means far more than meeting production targets. It requires embracing modern tools that improve energy efficiency, reduce emissions,
and enable agile optimisation. As energy costs rise and environmental policies tighten, the LNG industry must prioritise digital innovation to design and operate plants that are not only effective, but also sustainable and future ready – without the need for real world testing or trial and error optimisation.
Simulation’s role in the LNG value chain
Modelling and simulation tools are widely used throughout the development and operation of the LNG value chain. Natural gas production relies on reservoir, process, and hydraulic simulations to estimate production rates and design robust processing systems. After the wellhead, simulation tools support every major step of gas treatment, including the removal of condensate (NGLs), water, acid gases, moisture (dehydration), nitrogen, and mercury, as well as downstream fractionation and sweetening processes.
Natural gas liquefaction and maritime transfer represent the next critical stages in the value chain, offering significant opportunities for energy optimisation and safety improvement. LNG regasification and pipeline transportation similarly benefit from rigorous simulation models with sensitivity analysis capabilities to ensure reliable and stable operation.
Digital simulation tools are particularly critical for predicting the dynamic behaviour of LNG systems. Applications include managing surge forces, planning and executing safe emergency shutdowns, evaluating start-up and shutdown procedures, and accounting for external heat loads or changing maritime engine demands. By capturing sudden system responses, dynamic simulation enables safer, more reliable operation under transient conditions. Table 1 summarises applications of steady-state vs dynamic models in a typical liquefaction plant.
Digital tools are particularly valuable during early project phases, when critical decisions are made regarding equipment specifications, control strategies, and energy integration. Their value, however, extends well into operations, enabling teams to test retrofit scenarios, troubleshoot system anomalies, respond to changing feedstock conditions, and support operator training.
The following examples illustrate how simulation tools can help engineers validate brownfield projects and enhance the efficiency, safety, and reliability of LNG facility designs.
Figure 1. Global LNG supply vs demand (left); global energy demand by regions (right). Adapted from 2024 Shell LNG Outlook report.3
Expansion brownfield projects
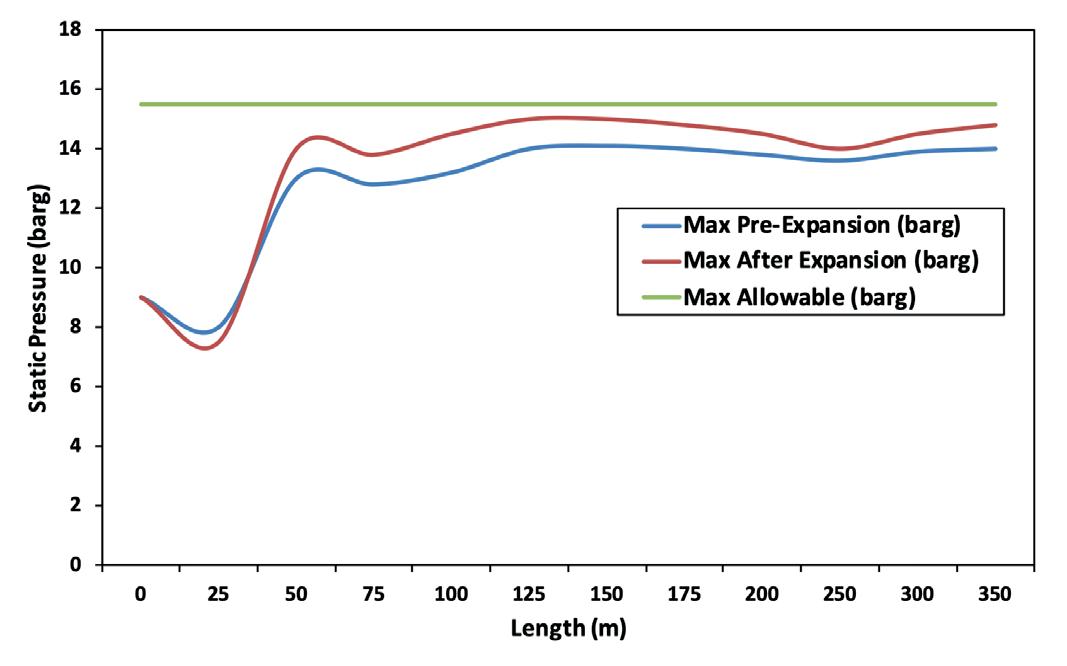
During an LNG plant expansion study, CB&I engineers evaluated the impact of increasing plant throughput by 60%, to more than 100 000 ft 3/h. One of the key challenges associated with this expansion was the potential for surge pressures in the LNG transfer system between the storage reservoir and the boil-off gas (BOG) condenser.
To assess these risks, the engineering team performed a detailed hydraulic analysis using Datacor Impulse surge and water hammer simulation software across multiple operating scenarios. By modelling two post-expansion cases, the study confirmed that predicted surge pressures remained within allowable design limits (Figure 2), providing confidence that the expanded system could operate safely.
Safety assessments
Hydraulic simulation is also critical for evaluating emergency conditions during LNG cargo loading operations. In these scenarios, flow through the loading arms must be rapidly halted by closing a sequence of valves,
Figure 2. Transient simulation studies show maximum predicted surge pressures following LNG system flow expansion remain below allowable design limits.
tripping transfer pumps, and opening vent valves. The resulting sudden deceleration of flow can generate significant pressure surges throughout the piping system, potentially leading to catastrophic failures if not properly assessed during design.
In one such study, researchers at Lamar University in Beaumont, Texas, conducted an emergency shutdown surge analysis using Datacor Impulse. The analysis (Table 2) identified operating scenarios in which surge pressures exceeded maximum allowable limits, creating unsafe conditions. The results were used to develop design and operating guidelines that enabled the terminal operator to properly size and rate LNG piping components for emergency events.
Energy and emissions reduction
During the design of a new LNG offloading terminal, CB&I’s Process Engineering Division pursued an energy efficient regasification strategy by leveraging waste heat from a nearby power plant. A key design requirement was to ensure that the new interconnecting system did not compromise the mechanical integrity or operational stability of the existing plant cooling system.
Using Datacor Impulse, CB&I engineers developed a hydraulic model of the existing cooling network, identifying fouled heat exchangers and flow restrictions.
Cooldown procedure verification for thermal stress management
Anti-surge control and recycle valve logic optimisation
ESD pressure & flare capacity analysis
Cargo loading transient analysis (pressure surges, water hammer)
A series of transient simulations were then performed to evaluate system behaviour following the addition of new pumps and heat exchangers. The analysis revealed conditions that could result in reverse flow and air ingress into cooling towers after transfer line pump trips. By redesigning the system to incorporate variable speed pumps and eliminating unnecessary valves and check valves, the team achieved a more robust hydraulic design and enabled a simpler, more reliable control philosophy. A second example illustrates the role of dynamic process simulation in reducing emissions and commissioning risk. An international LNG terminal required replacement of a pressure control valve due to changes in operating conditions. Rather than relying on traditional field installation followed by live tuning, the engineering team developed a dynamic process model in CHEMCAD using available plant data, with particular emphasis on start-up and emergency shutdown behaviour.
Anomaly detection and predictive maintenance (digital twin)
Predictive BOG control based on weather and carrier schedules
Operational guidance and autonomous control during load changes
- MCHE: Main cryogenic heat exchanger.
- NRU: Nitrogen rejection unit.
- BOG: Boil-off gas.
- HHV: Higher heating value.
While some discrepancies were observed – primarily due to incomplete information on the existing valve’s stroke characteristics – the model proved sufficiently accurate to validate the revised control strategy and tune proportional, integral, and derivative parameters in a virtual environment. This approach reduced gas release
Table 1. Steady-state vs dynamic simulation application in LNG liquefaction plants
during commissioning, shortened start-up time, and ensured stable control system performance once implemented in the field.
Maritime engine optimisation
Azbil, a Japanese automation company, in partnership with CHEMCAD engineers, undertook an initiative to improve LNG carrier fuel gas management. The objective was to develop a more accurate and controllable approach for matching BOG generation with dual fuel engine demand, thereby reducing flaring and validating control strategies prior to onboard deployment.
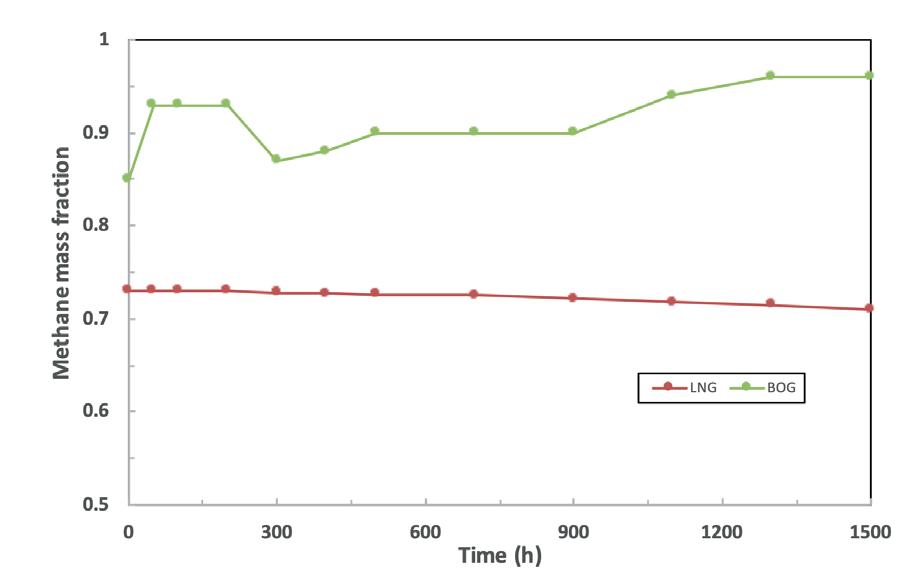
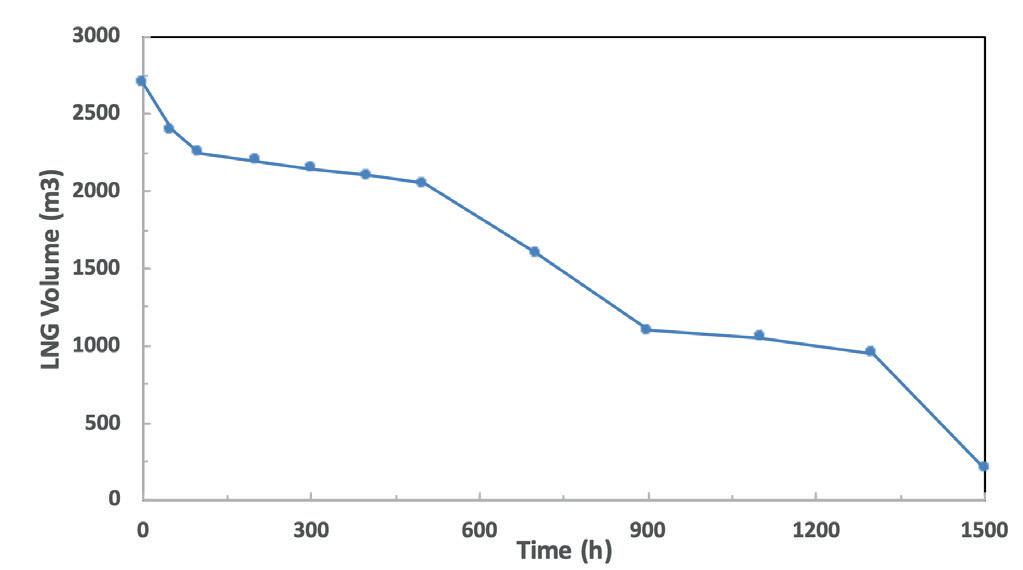
To achieve this, a dynamic process model of the vessel’s fuel gas management system – including compressors, recirculation loops, buffer tanks, and control valves – was developed in CHEMCAD. The model was used to tune control parameters, test start-up and shutdown procedures, and evaluate system stability under varying BOG generation rates and engine load conditions. Figure 3 shows the predictions of the dynamic model over the length of the ballast journey (with heavy LNG remaining in the heel).
The model was subsequently integrated with the vessel’s distributed control system (DCS), allowing the simulator to function as a real time virtual plant for verifying control logic and operator interactions. In parallel, an empirical, equation-based LNG tank model was developed as a hybrid component to better capture heat and mass transfer effects, weather influences, and mist zone behaviour. This hybrid modelling approach enabled more accurate prediction of BOG rates and LNG heel inventory during ballast voyages.
Results demonstrated that the combined dynamic and hybrid models successfully reproduced compressor pressure control behaviour, stable engine fuelling, proper anti-surge performance, and realistic BOG generation profiles. Integration with the DCS environment also reduced commissioning time and enabled early identification of control and operability issues, validating the overall fuel gas management and control strategy prior to deployment.
Conclusion
As LNG cements its role in the global energy transition, operators are being held to a higher standard of performance – economically, environmentally, and operationally. Simulation technologies allow engineers to tackle complexity with clarity, and to design systems that meet today’s demands while anticipating tomorrow’s constraints. By combining deep domain expertise with powerful simulation tools, LNG engineers can not only meet performance targets, but exceed them in a way that is safe, sustainable, cost-effective, and scalable.
References and notes
1. A term coined by the World Energy Council encompassing energy security, energy equity, and environmental sustainability.
2. ‘The new energy equation: Why LNG is vital to the future of supply chains’, World Economic Forum, (24 July 2025), www.weforum.org/stories/2025/07/lng-liquefied-natural-gassupply-chains
3. ‘Shell LNG Outlook 2025’, Shell, (2025), www.shell.com/whatwe-do/oil-and-natural-gas/liquefied-natural-gas-lng/lngoutlook-2025.html
4. MARTINEZ, C., ‘SEA-LNG: LNG-powered fleet will reach more than 2000 vessels as demand grows’, World Ports Organization, (5 April 2025), www.worldports. org/sea-lng-lng-powered-fleet-will-reach-more-than-2000vessels-as-demand-grows
5. ‘New IEA report assesses emissions from LNG supply and maps out opportunities to reduce them’, International Energy Agency, (19 June 2025), www.iea.org/news/new-ieareport-assesses-emissions-from-lng-supply-and-maps-outopportunities-to-reduce-them
Table 2. Comparison of maximum surge pressure for each transient case. Only the worst case, with both pump and vent valve failures, exceeded the design pressure
1.
Figure 3. Methane mass fraction evolution in the BOG and liquid phases during a ballast voyage (left); prediction of LNG liquid volume in the fuel tank vs voyage time (right).
From design validation and operator training to real-time optimisation, lifecycle-ready simulation tied into a unified automation platform delivers speed, consistency, and reliability, says
Dawn Marruchella,
Vice President
Emerson,
for Emerson’s Guardian Software and Solutions Business.
The demand for LNG is increasing at a pace that nobody could have anticipated just five or 10 years ago. Today, the world has over 400 million tpy of production capacity, and experts anticipate another 150 – 250 million t will come online by the end of 2030.
To meet these intense goals, LNG companies have accelerated expansion, developing new projects at a staggering pace. Consequently, they are shifting focus on how
Figure 1. As LNG organisations explore more flexible operations to try secure ‘one more ship’, they need equally flexible simulation technology.
they deliver those projects to help ensure success by eliminating the challenges that hamper traditional project implementation (Figure 2).
One such shift can be seen in project design. While many organisations are still building traditional 5+ million tpy mega-trains, others are moving towards a more modular model, constructing many smaller trains that can start up much faster and deliver quicker return on investment (ROI). This frees up capital for further investment, empowering companies to deliver the same final output, but with cash flow spread out over a more manageable period of time.
However, modular build styles, small-train replication, and compressed schedules all create engineering and staffing strain. Moreover, LNG plants typically operate with lean crews and no buffer, meaning that from the very first moments of operation, the stakes for successful processes are incredibly high. Therefore, organisations need solutions to help them reduce schedule risk and operational risk simultaneously so they can succeed in this increasingly challenging environment.
Fortunately, a solution exists. Simulation software designed as part of a seamless technology portfolio can tie planning, project engineering, operator training, and lifecycle operations together. Such a strategy provides a lifecycle tool that delivers continuous value from final investment decision through decades of continuous operation.
One model, many purposes
Today’s most advanced automation solutions providers are not designing simulation software as a standalone product, but rather as part of a seamlessly integrated enterprise operations platform (EOP). An EOP is a software-defined, operations-ready digital automation platform designed to unify, modernise, and optimise industrial operations across plants and enterprises. When organisations view their simulation investment as part of an EOP-centric, lifecycle-focused architecture, simulation software evolves from a single-use project tool into a technology that supports LNG operations from end-to-end across the lifecycle, delivering far greater ROI.
The key is selecting software designed to make simulation the connective tissue of the entire LNG asset lifecycle. When process and equipment configuration from steady-state models can be seamlessly integrated into dynamic simulation software, teams reduce rework and preserve continuity. Those dynamic models can be used for testing, tuning, and optimisation before the project starts to ensure seamless transition between project phases. In parallel, the dynamic models can be used for operator training to ensure operators are up to speed on day one of operation. After the plant starts up, the models continue to deliver value as a safe and efficient test bed for process optimisation and continuous training, even as equipment and operations change.
In the EOP environment, simulation tools are seamlessly integrated with other automation software. Ultimately, a single evolving model becomes a collaboration sandbox for process engineering, controls, operations, and maintenance. Every change –graphics, advanced process control, state-based control, safety logic updates, and more – can be tested first, eliminating risk and error at every stage, while speeding project execution and increasing uptime during operations.
In short, lifecycle integration avoids siloed simulation that dies on the vine after commissioning (Figure 3).
Designing right the first time
Like many industries, LNG manufacturers are finding deep expertise to be increasingly rare. Project engineers are often less experienced and need more support than their predecessors, many of whom have retired in the last decade. Moreover, even if an organisation can find engineers or bring them up to speed quickly, today’s workforce is more transient,
Figure 2. LNG operations are complex, a factor that is only increasing as project timelines are accelerated.
Figure 3. Lifecycle integration is key to driving the most value from a simulation investment.
so they are likely to move on well before the passing of a decade.
To address this and related issues, simulation tools provide an intuitive environment in which modern digital workers can upskill quickly to design projects faster and with more confidence. Early-phase design simulation on steady state models supports engineers in their design workflows, helping teams ensure ‘right-the-first-time’ engineering. This capability becomes increasingly valuable with more modular projects, where the need for inter-module testing is increased. With simulation software designed as part of a seamlessly integrated automation ecosystem, the ability to import process and equipment configuration from steady-state models helps teams navigate modularity. Simulation also helps ensure package vendors and engineering, procurement, and construction teams have shared expectations.
In addition, teams can use dynamic simulation software to perform virtual factory acceptance testing and commissioning to accelerate timelines. Performing all these tasks in advance also helps avoid late-stage surprises that destabilise budget and timelines.
People are key
While LNG processes rely heavily on automation, human operators are the first pillar of LNG production reliability. Like engineers, however, experienced operators are increasingly hard to find and retain. Organisations are employing an increasing number of inexperienced personnel who must be upskilled quickly for the plant to meet its operational excellence goals.
In most cases, operators can easily be trained via a multitude of methods to manage the steady state operations that make up most of their tasks. Operators rarely see upsets or unusual scenarios – such as start-ups and shutdowns – but when they do, they must respond instantly and flawlessly to preserve safety and productivity.
When organisations employ dynamic operator training simulation that is designed as part of a seamless automation portfolio, the system replicates real control room behaviour using the exact system interface operators will use on a day-to-day basis. That experience helps operators using the training system build instinctual responses and reduces cognitive load during real events. Operators are not translating similar experiences but instead relying on deeply ingrained muscle memory.
The most advanced operator training software leverages design simulation models to provide early access, empowering teams to start training operators well before equipment starts arriving on site. Fit-for-purpose operator training software also provides personalised, tracked training to ensure certification and currency, making the software a valuable tool well before start-up, and across the lifecycle, tracking operator readiness at every stage.
Feature-rich software delivers flexibility
Seamless integration is a critical competency for simulation software operating in the LNG environment. However, as project teams evaluate their options, there are other capabilities they should pursue as well.
LNG operations are a blend of many different technologies and processes. Consequently, an organisation’s simulation software needs flexible fidelity to support the many different model types the organisation may need. Today’s most advanced simulation software offers this flexibility, providing high fidelity dynamic modelling for critical equipment, along with medium fidelity options to scale simulation across the balance of plant assets (Figure 1).
In addition, that same blend of technologies means that an LNG organisation will likely implement many different solutions across the plant over its lifecycle. Ensuring the simulator can manage vendor-agnostic control system simulation and programmable logic controller (PLC) integration helps teams ensure that they can model any of their critical operations, regardless of the systems controlling them.
Because outdated simulations lose value quickly, LNG’s dynamic operating environments also demand simulation solutions that can be easily updated. The most advanced simulation software provides intuitive synchronisation features to quickly and easily bring plant models in line with the actual operating environment, even as changes are made to meet evolving needs.
AI brings lifecycle acceleration
As the rise of industrial artificial intelligence (AI) continues, the value proposition for simulation software in LNG increases dramatically. First and foremost, automation suppliers are already developing AI tools to accelerate model creation. These intuitive AI support tools will ingest historical data, design documents, piping and instrumentation diagrams, and more to help engineers automatically develop configurations. Moreover, the same tools will be able to consume new documentation and historical data as it becomes available to automatically update simulation as the plant evolves.
As these AI use cases emerge, it will become increasingly important to have simulation software built on the same EOP as the organisation’s other automation solutions. With the seamless AI-ready connectivity offered by an EOP architecture, AI will become the connective tissue that bridges simulation, real plant data, and engineering and operational intent. Repeatability, faster configuration, and standardisation will become the rule, rather than the exception.
Simulation is foundational to LNG’s competitive future
Today, simulation accelerates capital projects, strengthens operator readiness and capability, supports safer operations, and enables faster and more effective digital transformation. When implemented effectively as part of a lifecycle initiative grounded in an integrated platform, simulation software also empowers teams to move from project-centric models to continuous lifecycle optimisation, helping support operational excellence at every stage, while dramatically increasing ROI.
In coming years, AI-enhanced simulation will supercharge operations, further defining the next generation of LNG engineering and operations, and becoming a core element of competitive advantage in an increasingly challenging marketplace. In an industry where speed and reliability define competitiveness, lifecycle-ready simulation is no longer optional, it is foundational.
Bhupesh Thakkar, Bechtel, USA, maps out how the company has built confidence through decades of EPC delivery for Australia’s LNG industry.
Australia’s rise as an LNG powerhouse is a story of engineering ambition and execution certainty. Since the 1950s, Bechtel has been part of that journey, delivering projects that account for roughly half of Australia’s LNG export capacity. From pioneering liquefaction in the Northern Territory to building megaprojects on remote islands, the company’s work has helped shape Australia’s energy landscape and, to a greater degree, global LNG delivery standards.
The scale of Australia’s LNG transformation cannot be overstated. In less than two decades, the country moved from a modest exporter to one of the world’s top suppliers, competing with Qatar and the US for market leadership. This achievement was about execution over resource abundance. LNG projects are among the most complex undertakings in the energy sector, requiring thousands of craft professionals, intricate supply chains, and co-ordination between engineering, procurement, and construction. They demand certainty in a world where volatility is the norm.
For EPC contractors, the challenge is clear: deliver multi-billion-dollar facilities safely, on schedule, and to specification, often in remote environments with
limited infrastructure. Australia’s LNG boom tested every facet of project delivery: logistics, workforce management, modularisation, and stakeholder engagement at a scale rarely seen before. The lessons learned during this period have become global benchmarks, influencing how LNG projects are executed from the US Gulf Coast to East Africa.
This article explores four landmark projects – Darwin LNG, Curtis Island LNG, Wheatstone LNG, and Pluto LNG Train 2 – and the insights they offer for today’s industry. These projects demonstrate that finding gas is important, but success in LNG is about building confidence. And in an era of growing energy demand, decarbonisation, and heightened scrutiny, that confidence is more valuable than ever.
Darwin LNG: Proving the model
When Darwin LNG came online in 2006, it marked a turning point for Australia’s LNG ambitions. The single-train facility, with a capacity of 3.5 million tpy, was the first LNG export plant in the Northern Territory and among the earliest globally to use ConocoPhillips’ Optimized Cascade® process. Its scope included a 500 km subsea pipeline from the Bayu-Undan
gas-condensate field, a 188 000 m3 storage tank, and a marine jetty, all delivered despite cyclone risks and limited infrastructure.
The technical design was forward-thinking. The liquefaction train employed multi-staged, cascaded refrigerant circuits for efficiency, and gas turbine drivers were selected for reliability in tropical conditions. Darwin LNG demonstrated that remote gas could be processed reliably onshore, proving the viability of LNG in Australia.
Execution was not without challenges. Logistics required shipping massive cryogenic heat exchangers and turbine generators to a newly-built wharf at Wickham Point. Construction scheduling accounted for monsoon rains and cyclone risks, with robust preparedness protocols that kept the project on track. Early EPC engagement aligned the plant’s timeline with upstream readiness, avoiding costly delays – a lesson that resonates across the LNG industry today.
Darwin LNG also left a lasting local legacy. Bechtel trained a Darwin-based operations workforce and partnered with local contractors, introducing new skills to the region. For Australia, Darwin LNG was proof that execution certainty could unlock global confidence and investment.
Figure 1. Silhouette of worker at Darwin LNG plant. The Darwin LNG facility in Northern Territory was Bechtel’s first Australian LNG project (operation starting 2006). The single-train plant (3.5 million tpy) uses ConocoPhillips’ Optimized Cascade® process and has reliably exported LNG for nearly two decades.
Figure 2. Aerial view of Curtis Island LNG plants. Three adjacent LNG complexes in Gladstone, Queensland, were built concurrently by Bechtel (2010 – 2016). This megaproject required modular construction of over 260 pieces and a peak workforce of 14 500 on site.
Curtis Island LNG projects: Industrialising megaproject delivery
If Darwin LNG was a milestone, Curtis Island was a moonshot. Between 2010 – 2016, Bechtel built six LNG trains across three adjacent sites: Queensland Curtis LNG, Gladstone LNG, and Australia Pacific LNG, in Gladstone, Queensland with a combined capacity of approximately 25 million tpy and total owner investment of around US$60 billion. It remains one of the largest concentrations of new LNG capacity ever built.
The scale demanded innovation. Bechtel standardised designs across projects, enabling repeatability and bulk procurement. All trains used ConocoPhillips’ Optimized Cascade process and were of similar size, allowing engineering teams to leverage proven designs and procurement teams to bulk-order equipment. Common control systems eased commissioning and reduced costs.
Modularisation was pivotal. More than 260 large modules were fabricated in Asian yards and shipped to Curtis Island, reducing on-site hours and improving safety. Modules ranged from pipe racks to massive pre-assembled process units weighing up to 5000 t. Logistics were a feat in themselves: 83 module shipments travelled 340 000 nautical miles, and self-propelled modular transporters (SPMT) moved modules from dock to foundations with pinpoint accuracy.
Managing a peak workforce of 14 500 required robust systems, including ferry transport, purpose-built camps, and comprehensive safety programmes. Community engagement was equally critical. A centralised liaison body co-ordinated housing, traffic, and health services while training initiatives produced Australia’s largest-ever apprentice intake and employed over 500 First Nations Australians. These efforts earned Bechtel recognition as Queensland’s ‘Employer of the Year’ in 2015.
Curtis Island proved that LNG’s real constraint is execution capacity, not resources. Its success redefined industry expectations for delivery certainty and demonstrated that megaprojects can be industrialised and treated almost like a production line to achieve speed and consistency.
Wheatstone LNG: Integrating domestic supply
While Queensland was building at scale, Western Australia (WA) advanced its own LNG frontier. Wheatstone LNG, near Onslow, added two trains (4.45 million tpy each) and a domestic gas plant supplying 200 TJ/d. Construction began in 2011; first LNG flowed in 2017.
Wheatstone combined offshore gas processing with onshore liquefaction and domestic supply, a dual-purpose design requiring precision. The plant included carbon dioxide removal, dehydration, and mercury removal units, plus two parallel liquefaction trains and two 160 000 m3 storage tanks. Integrating domestic gas facilities within an LNG complex meant meeting two sets of specifications and regulatory regimes. Domestic gas required higher heating value and strict quality control for pipeline injection, so additional process units were installed to ensure compliance.
Modularisation again played a role, with 114 modules fabricated in Indonesia, Malaysia, and China. The largest weighed nearly 4800 t, requiring specialised transport and sequencing. A temporary port and offloading facility were built to handle these modules, and SPMT moved them into position. This approach reduced on-site work and improved safety by minimising labour at heights and in confined spaces.
Digital execution tools were critical. Advanced Work Packaging aligned EPC, while real-time material tracking ensured that when a module arrived, all necessary components were ready for installation. Commissioning leveraged digital twin models for operator training and control logic testing, accelerating start-up.
Local impact was significant: thousands of jobs, First Nations contracting, and strict environmental compliance near sensitive marine habitats. Dredging was monitored to protect coral, and a turtle conservation programme safeguarded nesting beaches. Wheatstone LNG reinforced a critical truth: execution predictability drives project bankability. In volatile markets, that certainty is as valuable as the gas itself.
Pluto LNG Train 2: Next-gen expansion with integrated operations
Pluto Train 2 is a part of the latest chapter in Australia’s LNG story. The onshore component of the Woodside-operated Scarborough Energy Project adds approximately 5 million tpy of LNG capacity to an existing operating Pluto LNG facility, with capacity to supply into the WA domestic gas market, while applying lessons from Bechtel’s previous Australian projects and embracing new technology. Heavy modularisation of 51 modules was once again self-performed by Bechtel teams at a fabrication yard on Batam Island, Indonesia, including the first-time modularisation of the LNG compressor buildings, making Pluto Train 2 the most modularised project of Bechtel’s LNG fleet to-date.
Digital tools track every weld and flange connection in real time, feeding into 3D models accessible to the entire project team. The massive construction effort has been taking place alongside an operating LNG plant, where every system tie-in is meticulously planned so as not to impact safe and reliable operations. Commissioning teams are using dynamic simulators to train operators and test control sequences before live gas is introduced, with provisions made for Woodside to ultimately operate the train remotely from Perth over 1200 km away from site.
Pluto Train 2 also reflects the project’s focus on community engagement. First Nations engagement is embedded in the execution strategy, with over AUS$50 million in contracts awarded to First Nations enterprises and collaborative cultural heritage management actively integrated into planning.
Sustainability is also front of mind in the design with efficient aero-derivative turbines and heat integration. In the long run, Pluto Train 2 is designed with the intent to adapt to new technologies in the decades ahead.
As the Scarborough Energy Project approaches first LNG cargo, Pluto Train 2 aims to play a role in supporting energy security and the project’s host communities.
Lessons from building Australian LNG and why they matter now
The LNG industry is entering a new era. Demand remains strong, but the conditions for success have changed. Projects are larger, schedules are tighter, and stakeholders, from financiers to governments, expect certainty, sustainability, and social value. Bechtel’s Australian experience demonstrates that these expectations can be met when EPC execution is treated as a strategic enabler rather than a service.
Execution certainty is now a currency in LNG. It determines whether projects secure investment, meet market windows, and maintain credibility with buyers. Modularisation and digitalisation are no longer optional; they are essential tools for managing complexity and reducing risk. Workforce development and local engagement are not just social performance commitments; they are risk mitigation strategies that strengthen community support and expand the talent pool.
As global LNG expands from North America to East Africa, the lessons from Darwin, Curtis Island, Wheatstone, and Karratha will continue to shape how megaprojects are delivered. Australia proved that execution excellence is more about building confidence than building the plants themselves. And in an industry where billions ride on certainty, that confidence is the ultimate competitive advantage.
Figure 3. Wheatstone LNG at dusk. Wheatstone’s compressor building, shown, was constructed on site. It was followed by the installation of several large pre-fabricated process modules (over 4000 t). Wheatstone used 114 modules, delivered via a purpose-built port near Onslow. Modularisation and on-site infrastructure enabled timely completion in a remote area.
Figure 4. Pluto Train 2 module arriving by ship to the Burrup Peninsula and being offloaded. Pluto’s expansion relied on 51 big modules from an Indonesian fabrication yard, greatly reducing on-site construction hours in the Pilbara.
Charles Tremblay and Jeff Abt,
Eddyfi Technologies, explain pulsed eddy current inspection for LNG carrier hulls.
Corrosion management is one of the more persistent maintenance burdens facing the LNG carrier fleet. Hull steel is exposed to seawater, ballast conditions and, on older tonnage, coating systems well past their design life. Class societies require periodic thickness surveys to confirm that the structure remains fit for service. The inspection method used to gather that data, however, has changed little in decades. Single-element ultrasonic testing (UT), carried out on a coarse grid from inside the hull or, where access is not possible, from outside at height or by remotely operated vessels underwater, remains the default. It is reliable for establishing general plate condition, but its point-by-point nature and typical 150 mm x 150 mm (6 in. x 6 in.) grid spacing mean that small, localised corrosion cells can go undetected between measurement points.
Pulsed eddy current (PEC) technology offers a way to close that resolution gap. Already established in the petrochemical sector for non-intrusive corrosion assessment through coatings, insulation, and even floor tiles, and now referenced in ASME Section V, Article 21 as a basis for inspection procedures, PEC has more recently been adapted for hull-specific applications. This article describes that development path, from probe design through field validation and robotic deployment, and outlines what it means for LNG carrier hull integrity management.
The corrosion mechanism behind the inspection gap
The corrosion pattern that conventional UT grids are most likely to miss is well understood. On ageing vessels, corrosion tends to concentrate immediately above longitudinal stiffeners. Drain holes designed to route water down to a collection point gradually clog with debris; once that passive drainage path is compromised, water becomes trapped above the stiffener and creates a persistently wet, corrosion-prone zone. Wastage develops just above the structural member and can progressively weaken the hull plate. Because the affected area often spans only a few centimetres, a coarse external UT grid has a real chance of stepping over it entirely. External conditions compound the problem: detached coating or heavily attenuating coating systems can make ultrasonic measurement impossible without first removing the coating, which adds cost and schedule time to a survey (Figure 1).
How PEC array technology works
PEC is an electromagnetic technique, not an acoustic one, and that distinction is what drives most of its practical advantages on a hull. A transmitter coil in the probe generates a pulsed magnetic field, which induces eddy currents in the underlying steel. When the pulse switches off, those eddy currents decay,
and a receiver coil measures the rate of that decay over time. Because the decay rate is governed by the material’s thickness, conductivity, and permeability, the resulting signal can be inverted into a wall-thickness estimate without the probe ever touching bare metal. Since the magnetic field passes freely through non-conductive layers, PEC reads straight through coatings, marine growth, insulation, and standoff gaps of a centimetre or more, conditions that would defeat conventional UT, which needs a couplant and reasonably direct contact with the steel to transmit an acoustic pulse.
A single-channel PEC probe still only produces one reading at a time, though, which limits it to the same point-by-point logic as UT, just with better tolerance for coatings and standoff. A PEC array changes that by placing multiple transmitter-receiver coil pairs side by side within one probe housing. Each channel is fired and read in sequence across the array, so a single pass of the probe produces a full strip of adjacent thickness readings rather than a single point. Stitched together, successive passes build a continuous C-scan image of the surface instead of a sparse grid of spot checks. This is what allows the hull probe described below to combine wide, fast coverage with a 45 mm x 22.5 mm effective resolution: the array does with one sweep what a single-channel probe would need many discrete placements to approximate. It is also what makes the pattern-based discrimination shown in Figure 2 possible, since distinguishing true wall loss from a structural member or a material-property variation relies on seeing how the signal behaves across neighbouring channels, not just at one point.
These two operating principles lead to fairly different trade-offs in practice. Table 1 summarises how PEC array technology and conventional single-element UT compare on the criteria that matter most for hull surveys.
Adapting PEC for hull inspection
Eddyfi Technologies’ first dedicated naval PEC application targeted ship deck plate, measuring thickness beneath floor tiles and coatings without removing them. That deck-inspection experience, combined with trials conducted with national navies on representative hull structures and damage mechanisms, provided the starting point for a hull-specific solution.
Two existing probes shaped the development work: the PECA-6CH-MED, built for wide coverage, rapid scanning, and use through thick coatings or insulation, and the smaller, more sensitive PECA-HR-SM. Data collected with both probes on real hull sections (Figure 3) informed the design trade-off between scanning speed and detection sensitivity that any hull probe has to make.
testing (UT) for hull thickness measurement
Criteria
Physical principle Electromagnetic (pulsed field, eddy current decay)
(pulse-echo)
Surface contact No direct contact needed Requires couplant and near-direct contact
Coating/insulation tolerance
Typical spatial resolution
Material applicability
Reads through coatings, insulation, marine growth, and standoff up to roughly 1 cm or more
45 mm x 22.5 mm per array pass (continuous C-scan)
Thick or disbonded coating can block the signal; often requires removal
Point measurement, commonly on a 150 mm x 150 mm grid
Ferromagnetic and nonferromagnetic (thickness only) Any conductive or solid material
Scan speed/coverage Fast; wide-array single-pass coverage Slow; single point per placement
Underwater/submerged use Yes, demonstrated to 60 m depth on a magnetic crawler
Best suited to
Corrosion mapping under coating, hidden structural wastage
Possible via diver or ROV, but couplant and contact are harder to maintain underwater
General baseline thickness surveys on accessible, bare, or lightly coated steel
Working with a NATO-member navy, Eddyfi Technologies subsequently engineered a purpose-built hull probe that balances productivity against accuracy. At 311 mm (12.25 in.) wide, it is rated to a depth of 30 m (99 ft) and can be reconfigured quickly between manual handles and mounts for magnetic crawler deployment (Figure 3). Its 45 mm x 22.5 mm (1.75 in. x 0.875 in.) resolution is substantially finer than a conventional UT grid, allowing it to map the
Figure 1. Internal corrosion in the bilge area of an ageing vessel, illustrating the wastage pattern that develops above longitudinal stiffeners.
Figure 2. Pulsed eddy current (PEC) array data mapping structural elements on a predominantly intact hull, with true wall loss highlighted in the red rectangle and material-property variation delineated in the black rectangle.
Table 1. Comparison of PEC array and conventional ultrasonic
Podcast
Never miss an episode - subscribe to the LNG Industry Podcast at the link below or on your favourite podcast app.
www.lngindustry.com/podcasts
localised wastage described above rather than sampling around it.
Field performance
In field trials, the probe consistently detected corrosion developing from the inside of the hull, just above the longitudinal framing, despite the signal influence that structural members introduce (Figure 4). Corrosion severity is displayed on a colour scale from green (minor) through yellow to red (severe), against blue for a sound, uncorroded plate.
The technique also has value on hulls with little or no active corrosion. Because PEC data clearly resolves structural features, it is well suited to building a digital twin during new-build construction, against which data collected later in the vessel’s life can be compared. Figure 2 shows this discrimination in practice: PEC array data maps structural elements on a largely intact hull, with genuine wall loss isolated within the red rectangle and material-property variations, which can otherwise be mistaken for wastage, delineated within the black rectangle. Advanced analysis tools available in Eddyfi’s Lyft® CPN software support this separation of true corrosion from structural and material-property influences on the raw signal.
Robotic deployment
A hull scale NDT technique only delivers its full value if it can be deployed without placing personnel at height or requiring surface preparation. To that end, Eddyfi Technologies tested the PEC probe on its standard magnetic robotic crawler platform, confirming that the electromagnetic PEC sensor does not interfere with the crawler’s magnets or motors, and vice versa (Figure 5).
Rated to a depth of 60 m (200 ft), VersaTraxTM magnetic crawlers can carry out underwater hull inspection before a vessel enters dry dock. That early visibility into corrosion condition gives naval and marine engineers more lead time to plan repairs, which in turn helps reduce unplanned repair costs and shorten disruption to the refit schedule.
The latest release of Eddyfi’s ICONTM 5 crawler operating system, together with the ICON SDK, extends this further by letting operators write their own scripts to control crawler behaviour during an inspection. Custom routines allow the crawler to execute a defined scan pattern automatically, improving the repeatability of the resulting dataset from one survey to the next – a useful property for the historical comparisons described above.
Outlook
For LNG carrier operators managing an ageing fleet against tightening dry-docking schedules, the combination of a finer-resolution PEC probe and magnetic crawler deployment addresses two persistent pain points at once: the risk of missing small, high-consequence corrosion cells between UT grid points, and the safety and cost burden of accessing hull surfaces manually. As robotic NDT platforms continue to add onboard intelligence through tools like ICON SDK, the direction of travel is towards inspection data that is not only more complete, but more repeatable and easier to compare across a vessel’s service life.
That trajectory extends beyond any single survey. As PEC array data accumulates across a hull’s service life, and as digital twins built from newbuild scans mature into baselines rather than one-off references, the more interesting long-term opportunity is predictive rather than purely inspective. A repeatable, high-resolution dataset collected at successive dry-dockings can support corrosion-rate modelling for specific structural zones, not just point-in-time condition reporting, which is a meaningful step towards risk-based inspection planning and away from fixed inspection intervals.
For LNG carrier operators specifically, that shift arrives at a useful moment. Regulatory pressure from measures such as the International Maritime Organization’s Energy Efficiency Existing Ship Index (EEXI) is already prompting owners to bring vessels into dry dock for retrofits, whether that means engine power limitation, air lubrication, or other efficiency measures. Bundling a higher-resolution hull corrosion survey into a retrofit-driven dry-docking, rather than scheduling it as a separate event, is a straightforward way to extract more value from yard time that is already being spent. As those two drivers, mandatory efficiency retrofits and a growing appetite for condition-based hull maintenance, continue to converge, robotic PEC array inspection is well placed to become a standard part of the LNG carrier survey toolkit rather than a specialised alternative to it.
Figure 3. Corrosion mapping on ship hulls using the standard PECA-6CH-MED and PECA-HR-SM probes.
Figure 4. Corrosion mapping with PEC, showing severity from minor (green) to severe (red).
Figure 5. VersaTrax M-Series crawlers are able to climb vertical surfaces while carrying the PEC hull probe.
Bernhard Weiland, SAVVY® Telematic Systems AG, examines the reasons for continuous, sensor-based monitoring of LNG assets across the transport chain and evaluates the consequences for all logistics stakeholders – including shippers, carriers, terminal operators, fleet managers, and system integrators.
Global LNG trade has expanded substantially over the past two decades. Driven by the fuel’s favourable emissions, compared to coal and oil, its versatility as both an
industrial fuel and an energy carrier, as well as through the growth of small scale LNG infrastructure supplying road transport, rail, and industrial consumers. According to the International Gas Union (IGU), global LNG trade volumes have grown consistently, with small scale distribution networks expanding particularly rapidly in Europe and Asia.
This growth has led to an increased focus on the technical and organisational requirements for safe and efficient LNG transport and storage. Unlike conventional liquid fuels, LNG requires cryogenic storage at around -162˚C, comes with strict equipment certification requirements, and has a hazard profile that requires continuous operational supervision. With that being said, the deployment of real-time internet of things (IoT) monitoring systems across LNG transport assets has proven itself to be both a crucial safety and logistics optimisation parameter.
This article addresses said topics systematically, considering the basis of LNG hazards, the regulatory environment, the economic driver for monitoring investment, and the environmental scope that increasingly contributes to logistics decision-making. It then evaluates the technological and operational capabilities that a purpose-built monitoring system must deliver to meet the requirements of all parties involved in the LNG logistics chain.
Thermodynamic hazard profile of LNG in transport
Cryogenic properties and phase behaviour
LNG consists mainly of methane (CH₄, typically >85% by volume), with fractions of ethane, propane, and other hydrocarbons depending on the source. In its liquefied state, it occupies approximately 1/600th of the volume compared to its gaseous state, making it highly efficient for bulk transport. However, this phase stability is entirely dependent on maintaining its cryogenic temperatures.
Heat ingress through tank insulation causes progressive vaporisation. In a sealed, pressure-rated tank, this leads to a gradual increase in vapour pressure, known as boil-off. Under normal operating conditions, boil-off is managed through pressure relief systems. However, if heat ingress exceeds design parameters – due to insulation degradation, mechanical damage, or prolonged storage – tank pressure can reach and exceed relief valve thresholds, potentially leading to structural damages to the transport or storage asset.
Explosion and dispersion risks
The ignition point of methane in air is well characterised: the lower flammable limit is approximately 5% by volume, and the upper flammable limit is approximately 15%. Within this range, ignition by a spark or hot surface of enough energy can produce a deflagration or, under confinement, can lead to detonation. In the context of transport incidents, the rapid vaporisation of a large LNG release can produce a vapour cloud with dimensions that exceed local ATEX zones, leading to a significant public safety risk.
Additionally, when in contact with water, LNG undergoes rapid phase transition. This produces pressure waves of a magnitude that can lead to structural damage to vessels and
other surrounding infrastructure – a hazard particular to terminal operators and maritime carriers.
Cryogenic burns and cold-zone hazards
At -162˚C, LNG causes immediate and severe cryogenic burns upon contact with human skin. Vapours at cryogenic temperatures are also denser than surrounding air, causing them to accumulate in low-lying areas like drainage channels, cable ducts, and vehicle undercarriages. This leads to hazardous cold zones that may not be noticeable without instrumentation.
All together, these hazard profiles deliver the basis for a continuous, multi-parameter monitoring of LNG transport assets, covering a minimum of internal pressure, temperature distribution, and fill level.
Regulatory framework
Road and rail transport
The transport of LNG by road in Europe is governed by ADR (Agreement concerning the International Carriage of Dangerous Goods by Road), which classifies LNG under UN 1972 Class 2.1, flammable gas. ADR specifies detailed requirements for tank design and testing, pressure relief system specifications, vehicle marking, driver training and certification, and transport documentation. Similar provisions for rail transport are listed in RID (Regulation concerning the International Carriage of Dangerous Goods by Rail).
Equipment certification in explosive atmospheres
Any electronic device installed in an environment where explosive atmospheres may occur – which includes all LNG handling and transport environments – must comply with ATEX Directive 2014/34/EU in Europe, and with IECEx standards in the international context. These frameworks command that equipment must be designed and certified to prevent it from becoming an ignition source.
For logistics stakeholders, this means that monitoring devices installed on LNG assets cannot be general-purpose IoT hardware. They must be certified to the applicable zone classification, with documentation available for inspection.
Operational and economic dimensions
Predictive maintenance and asset lifecycle management
Using condition monitoring data to predict maintenance cycles is well established in the industry. In LNG logistics, the continuous transmission of pressure, temperature, and fill-level data generated by sensors provide the basis for anomaly detection. This helps to identify deviating trends showing the development of mechanical issues before they manifest. Ultimately, this leads to a reduction in both unplanned downtime and the cost of asset maintenance.
Fleet utilisation and supply chain visibility
For fleet managers and logistics co-ordinators, real-time asset visibility transforms the decision-making process. Knowledge of the current operational status –
Diane Cordell, Executive Secretary of the Pigging Products
Neil MacKay, PPSA President
Mark Elliott, Vice President
Navigating the world of pipeline pigging
In this episode of the World Pipelines Podcast, Elizabeth Corner is joined by Diane Cordell, Executive Secretary of the Pigging Products and Services Association (PPSA), together with PPSA President Neil MacKay and Vice President Mark Elliott.
The conversation explores the role of the PPSA in supporting pipeline operators around the world, from connecting them with specialist expertise to promoting knowledge sharing, collaboration and safety across the pipeline pigging industry.
LISTEN NOW
CATCH UP ON RECENT EPISODES
Offshore Energy, Engineered 30 years of UKOPA: safety, stewardship and the energy transition CCS Forum 2026: CCUS panel discussion [part 2 of 2]
Listen and subscribe here
Elizabeth Corner
location, fill level, pressure, temperature – of every asset within the fleet enables dispatch optimisation, reduces unnecessary movements, and supports more accurate delivery data. For shippers and end customers, access to transport status data via smart software reduces uncertainty in supply planning and supports just-in-time inventory management.
Return on investment considerations
The financial case for investments in IoT monitoring systems in LNG logistics is supported by multiple parameters: boil-off gas (BOG) loss reduction, maintenance cost optimisation, fleet utilisation improvement, and avoidable incident costs. Industry data shows that integrated monitoring solutions of the type described in this article typically achieve full financial amortisation within a period of 12 months or less. This reflects the extent of the addressable cost base relative to the required investment.
The SAVVY® platform: A technology assessment for logistics stakeholders
Device architecture and certification
The SAVVY® CargoTrac-S is a solar-powered, ATEX/IECEx/ CSA-certified IoT device designed for mounting on hazardous goods transport assets. Its certification to ATEX and IECEx standards – covering Zone 1 and Zone 2 explosive atmospheres – ensures its suitability for deployment across all LNG asset types. This includes road tank containers, ISO tanks, stationary storage tanks, rail tank cars, and multi-element gas containers without requiring infrastructure modifications or additional explosion protection measures.
The solar panel provides independence on external power supplies – a significant advantage in transport processes where continuous connection to fixed infrastructure is not possible. The device can be used to supply power to industrial sensors, acquire their analogue, digital, or BUS outputs, and perform local data processing prior to transmission, which leads to a reduction in bandwidth requirements and enables temporary operation in areas with no network coverage.
Multi-parameter monitoring
The SAVVY CargoTrac-S supports acquisition of pressure, temperature, and fill-level data from connected industrial sensors (and more), covering the most important parameters to LNG transport safety and operational management. Configurable alerting via the SAVVY® Synergy Enterprise Portal enables notifications adapted to the roles and responsibilities of individual logistics actors: fleet managers, depot operators, maintenance teams, and emergency response co-ordinators.
Enterprise integration and data interoperability
The SAVVY Synergy Enterprise Portal provides a web-based interface for real-time asset monitoring and historical data analysis, accessible across devices without the need for software installation. Critically for logistics operators, the platform supports data export and connectivity to third-party enterprise resource planning (ERP) and transport
management system platforms via standardised data interfaces. This positions the SAVVY solution not as a standalone monitoring solution, but as a data layer that enriches existing IT architectures.
Remote management and operational scalability
Over-the-air firmware updates and remote device configuration enable centralised management of monitoring hardware without requiring physical access to individual assets. This is crucial for logistics operators managing large, geographically-distributed fleets, where the cost and logistical complexity of on-site hardware accessibility would otherwise lead to a significant barrier to firmware and configuration maintenance.
Implications for logistics stakeholders
The deployment of IoT monitoring systems on LNG transport assets has different impacts across the logistics stakeholder spectrum:
z Shippers and cargo owners benefit from enhanced supply chain visibility, verifiable proof of transport conditions, and a stronger basis for liability allocation in the event of cargo loss or damage claims.
z Carriers and fleet operators achieve measurable reductions in BOG losses and maintenance costs and improve their asset utilisation.
z Terminal and depot operators gain real-time awareness of asset status at intake and dispatch, supporting more efficient turnaround management and reducing the risk of accepting assets with undetected defects.
z Regulatory authorities and auditors benefit from access to complete, timestamped operational data records that support incident investigation, compliance verification, and emissions reporting.
z ERP and system integrators find an interoperable data source that can enrich existing systems with highly frequent, operational data, to enable more refined analytics and decision-making capabilities.
Conclusion
The monitoring of LNG transport assets represents a junction of safety, regulatory, economic, and environmental parameters that collectively make IoT-based measurement not only advisable but increasingly obligatory for responsible logistics operators. The physical hazard profile of LNG, the certification requirements of the regulatory frameworks, the financial benefits of data-driven asset management, and the growing obligations for emissions reporting under EU and international law all point in the same direction: real-time, sensor-based visibility across the entire transport chain. Integrated solutions such as the SAVVY CargoTrac-S and the SAVVY Synergy Enterprise Portal demonstrate that the technical requirements are fulfilled today and that systems are already delivering operational and financial value across the LNG logistics community.
...ON BRAZIL
15FACTS
Brazil’s expansion of LNG regasification capacity is driven by an integrated LNG-to-power strategy
Brazil began importing LNG in 2008
The largest Japanese population outside of Japan is in Brazil
Rio de Janeiro served as the capital of Portuguese Empire from 1808 – 1821, making it the only European capital located outside of Europe
Annual utilisation of LNG import facilities is normally under 10%
Brazil is the only country in South America that speaks Portuguese
There are currently seven operating regasification facilities in Brazil, the most in the Americas
Prison sentences are reduced for every book a prisoner reads under the ‘Remission for Reading’ law
Brazil is the world’s largest exporter of coffee
Brazil has the largest population of Catholics
The stars on Brazil’s flag represent the night sky over Rio de Janeiro on 15 November 1889, the day the country became a republic
Brazil imported a record 7 million t of LNG after an intense drought in 2021
Brazil possesses over 40 million tpy of installed regasification capacity
The 6 million tpy Barcarena terminal has imported LNG consistently since its start-up in 2024
Recent growth in renewables and domestic gas production is decreasing the need for LNG imports