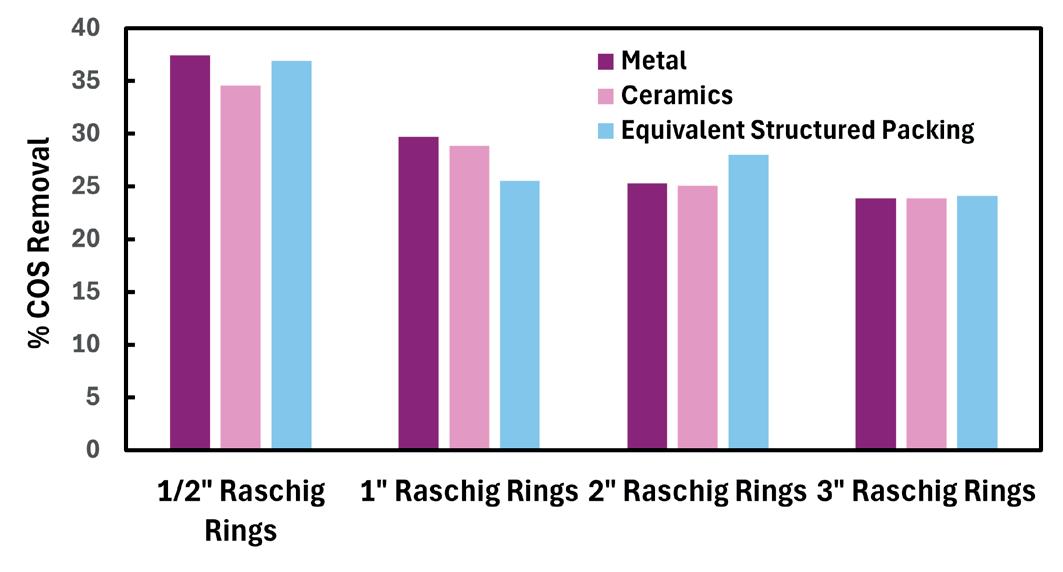
It’s called chemistry.The best teams have it.Your unit needs it. Crystaphase technologies help hold the line against foulants and pressure drop - from first whistle to stoppage time. Let’s play the long game.
crystaphase.com
33 Systems engineering for surge control – part 1
08 Turbulence and turmoil
Ng Weng Hoong, Contributing Editor, considers how current turbulence in the Middle East could affect oil markets across Asia and Australasia.
13 Rethinking mechanical integrity
Bryan Clementson, MISTRAS Group, considers how managed mechanical integrity programmes can improve reliability while reducing costs across the hydrocarbon processing industry.
19 Extending service life
Andre Roodzant, Integrated Global Services (IGS), discusses practical life extension strategies for delayed coking drums.
25 Optimising pump selection and solutions
Francesca Rizzi, Trillium Flow Technologies, Italy, explores pump solutions to meet the challenges of the downstream oil and gas market, with particular focus on a refinery modernisation project in North Africa.
29 Expanding into LNG
Dr. Kevin Kaupert, Nikkiso Clean Energy & Industrial Gases Group, UAE, describes LNG liquid cryogenic expanders, with an outlook towards increasing their refrigeration benefit using flow flashing.
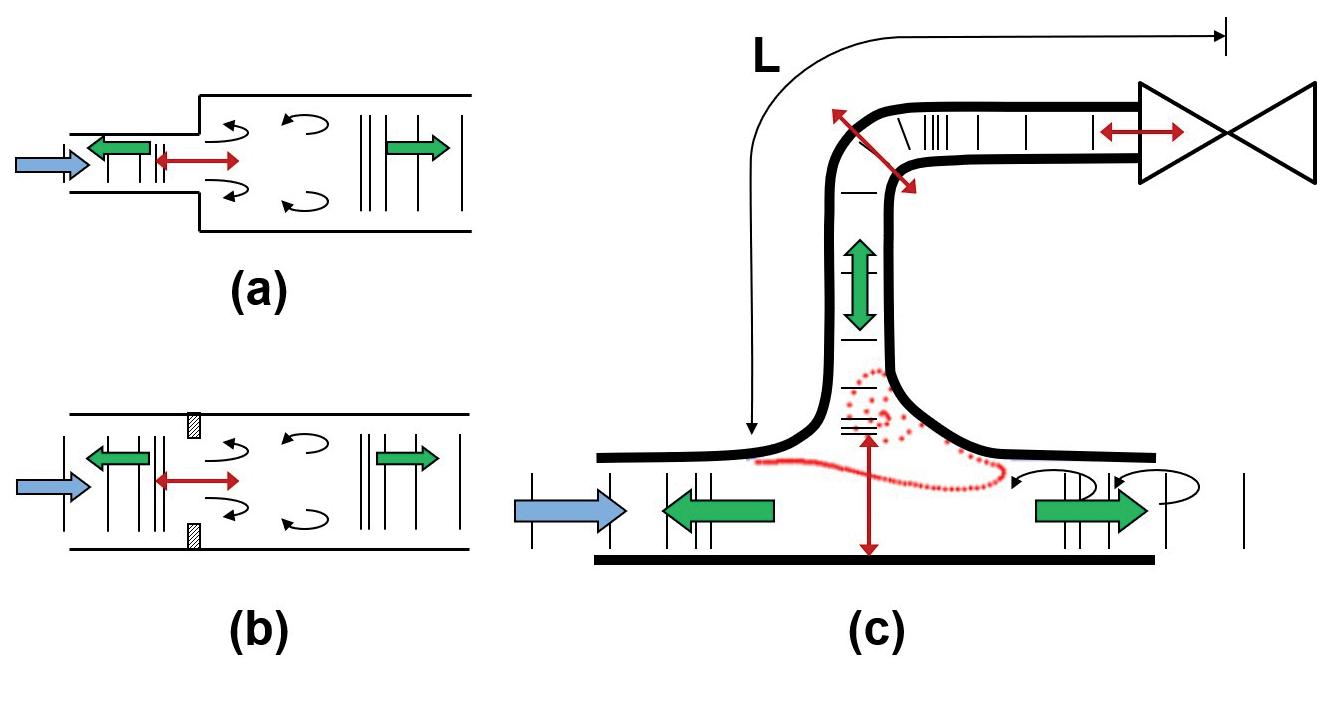
Attilio Brighenti, Christian Casonato, and Alessandro Mafolino, S.A.T.E. (Systems and Advanced Technologies Engineering S.r.l.u.), Italy, consider the side-effects of early design decisions.
37 Contamination control and compressor systems
Carl Hahn and Matt Thundyil, Transcend Solutions LLC (a CECO Environmental Company), examine how advanced coalescer design tackles compressor oil carryover to improve reliability, accuracy, and gas processing performance.
42 A new rate-based model for sulfur removal in liquid treaters – part 2
In the second part of this two-part article, Prashanth Chandran and Ralph H. Weiland, Optimized Gas Treating Inc., present case studies on the effect of solvent and equipment attributes.
48 Improving LNG safety and purity
Rhys Jenkins, Servomex, discusses how operators can best maximise safety, purity, and profitability across the whole LNG production value chain.
53 From platform to volume
Dr. Lars Hildebrandt, nanoplus, considers the importance of TDLAS gas detection systems for hydrocarbons in the mid-infrared spectral region.
57 Engineering trust
Ryan Cumpston and Jeff Wuenschell, AMETEK Process Instruments, discuss how operators can best ensure reliable moisture measurement in real-world natural gas operations.
61 Modernising water systems
Caroline Bird, Bachan Ramharack, and Tim Meeuwissen, Solenis, examine how cooling water programmes can drive water savings and improve operational reliability.
Optimized Gas Treating Inc. (OGT) delivers high-quality software and consulting services for gas treating and sulfur recovery. What began 30 years ago as the first ever true, fundamental, mass transfer rate-based amine absorber programme has expanded into the OGT|SuiteTM of rate-based process simulation tools. OGT’s customisable software minimises costs and enhances efficiency by allowing you to license only the features you need.
ET Black™
Carbon Black Technology
Carbon black is everywhere: mobility, infrastructure, manufacturing, and everyday products.
ET Black™ produces all ASTM-grade carbon blacks with consistent quality and operational flexibility, delivering up to 50% CO₂ reduction and superior fine-particle capture.
CONTACT INFO COM MENT
MANAGING EDITOR James Little james.little@palladianpublications.com
ADMIN MANAGER Laura White laura.white@palladianpublications.com
CONTRIBUTING EDITORS Nancy Yamaguchi Gordon Cope
CALLUM O'REILLY
SENIOR EDITOR
This month’s regional report (p. 8) takes a deep dive into the impact of current tensions in the Middle East on Asia and Australasia.
As Contributing Editor Ng Weng Hoong explains, the response in the region has been mixed. While large swathes of the continent – particularly the Asia Pacific region – have been hit hard and quick, Asia’s major economies (China, India, Japan, and South Korea) have largely weathered the storm so far, thanks to their substantial stockpiles of crude oil.
Indeed, Japan recently pledged to provide US$10 billion to help its Asian neighbours secure energy. The co-operation framework aims to assist Asian countries in their efforts to procure crude oil and petroleum products, as well as expand their stockpiles.
The pledge also reflects Japan’s underlying supply chain exposure. Announcing the agreement, Prime Minister Sanae Takaichi emphasised Japan’s dependence on neighbouring economies for petroleum-derived products, noting that the country is “closely interconnected with each Asian country through supply chains and mutually dependent with them.” This reliance is particularly acute in relation to naphtha, with concerns over potential shortages carrying knock-on implications for sectors such as healthcare. It is easy to see how the interconnectedness of the global economy means that no country is immune to the impact of current tensions in the Middle East. A fascinating recent article in the New York Times explores the multiplying problems that are being generated by the war – with transportation, manufacturing, and upward mobility all being hit hard in Asia – and how the forces of scarcity may soon spread across the world.1 Citing the International Monetary Fund (IMF), the article notes that the world economy is slowing nearly everywhere because approximately one-fifth of the world’s oil and LNG, along with vital byproducts, have been held back from the global market since the start of the war. It warns of the “dark forces” that resource scarcity tends to unleash in human psychology and capitalism.
SUBSCRIPTION RATES
Annual subscription £110 UK including postage/£125 overseas (postage airmail). Two year discounted rate £176 UK including postage/£200 overseas (postage airmail).
SUBSCRIPTION CLAIMS
Claims for non receipt of issues must be made within 3 months of publication of the issue or they will not be honoured without charge.
APPLICABLE ONLY TO USA & CANADA
Hydrocarbon Engineering (ISSN No: 1468-9340, USPS No: 020-998) is published monthly by Palladian Publications Ltd GBR and distributed in the USA by Asendia USA, 701C Ashland Avenue, Folcroft, PA 19032. Periodicals postage paid at Philadelphia, PA & additional mailing offices. POSTMASTER: send address changes to HYDROCARBON ENGINEERING, 701C Ashland Ave, Folcroft PA 19032.
The New York Times article also explains how recent interviews with farmers, labourers, drivers, and executives, suggest that public concern is more readily apparent than is portrayed in the controlled public messaging of politicians, who are seeking to project calm. This is well illustrated in Australia, where the public has been panic buying fuel despite reassurances from those in government. The country has fallen short of the International Energy Agency’s 90-day fuel stockholding obligation for over a decade; a fact that has been brought into the spotlight since the start of the war. Recent polling suggests that Australians are overwhelmingly concerned about fuel security and rising energy costs, with 92% of survey respondents in support of increasing emergency fuel reserves, 78% in favour of producing more oil domestically, and 76% keen to build more refineries.2 Ultimately, the current tensions in the Middle East are not contained within regional energy markets, but are exposing the depth of global interdependence. While governments continue to emphasise preparedness and cooperation, public concern is increasingly shaped by the lived reality of price volatility and underlying uncertainty. As recent events in Asia show, energy security is no longer a national issue in isolation, but a shared and rapidly evolving global challenge.
15 South Street, Farnham, Surrey
GU9 7QU, UK
Tel: +44 (0) 1252 718 999
1. CAVE, D., ‘The Forces of Scarcity Hitting Asia May Soon Spread Across the World’, New York Times, (20 April 2026), https://www.nytimes.com/2026/04/20/world/asia/asia-pacific-iran-war-oil.html
2. ‘Australians back accelerated energy development to strengthen fuel security’, Australian Energy Producers, (9 April 2026), https://new.energyproducers.au/news/australians-back-accelerated-energydevelopment-to-strengthen-fuel-security
Reliable H2S, COS and Mercaptan Treatment for Hydrocarbon Streams
Efficient, easy to operate technologies for variable flow and composition with minimal aqueous carryover
Our FIBER FILM® Contactor technologies provide robust treatment for LPG, NGL, condensates and other light hydrocarbon streams:
• High turndown to 15% for light hydrocarbon streams
• Compact vessels for easy retrofitting in existing systems
• Simple operation and low maintenance minimizing manpower requirements
• Minimum consumption of treatment chemicals and utilities, reducing OPEX
• Proven technology and expert technical support built on 50 years of sulfur treatment experience
• Optimal phase separation, up to 6 times faster than conventional mass transfer
Speak with our experts about optimizing your stream.
WORLD
Nigeria | Honeywell to help Dangote deliver petrochemical expansion
Honeywell will provide petrochemical process technologies and catalysts to Dangote Petroleum Refinery and Petrochemicals FZE (Dangote) to create plastics and detergents, helping the region strengthen energy security by reducing reliance on imports, stimulating industrial growth, and strengthening regional supply chains.
Honeywell UOP’s Oleflex TM technology will be used to produce an additional 750 000 tpy
of propylene at the refinery, supporting the manufacturing of packaging materials, consumer goods, and industrial products. Additionally, Dangote will deploy a suite of Honeywell UOP’s petrochemical technologies and catalysts to make 400 000 tpy of linear alkylbenzene (LAB), a key ingredient in detergents and surfactants for household and industrial cleaning products.
Once at full production, Dangote’s Lekki LAB plant will be one of the largest in the world.
The Netherlands | WPU plans new chemical recycling facility for end-of-life plastics
WPU, Vitol’s plastics recycling business, plans to build a new chemical recycling facility for end-of-life plastics at the Port of Rotterdam, the Netherlands, alongside Vitol’s refinery, VPR.
The new plant will have the capacity to process 80 000 tpy of post-consumer end-of-life plastic, increasing WPU’s total recycling capacity to 100 000 tpy.
The Rotterdam facility is expected to be one of Europe’s largest chemical recycling plants for
end-of-life plastics. Using WPU’s proprietary batch pyrolysis technology, it will convert end-of-life plastic into pyrolysis oil, a circular feedstock for the production of circular chemicals, intermediates, and new plastics, targeting a lower carbon intensity than fossil naphtha. The project comes as demand grows for circular feedstocks and as European policy continues to support higher recycled content and the decarbonisation of petrochemical value chains.
Spain | H2SITE deploys hydrogen technology at refinery
H2SITE, a technology company specialised in advanced hydrogen production and separation solutions, has signed a strategic agreement with Petronor to deploy its high-efficiency hydrogen separation technology at Petronor’s refinery in Spain.
The partnership sets the stage for the joint development of a first-of-a-kind unit, integrating H2SITE’s proprietary membrane technology into the steam methane reforming (SMR) process in refineries to improve overall plant efficiency, enhance CO 2 capture opportunities, and ultimately strengthen operational performance and industrial competitiveness.
Petronor’s engineering and operations teams are joining forces with H2SITE’s technical experts, leveraging decades of refinery expertise, industrial integration, and large scale project execution.
This partnership combines advanced membrane reactor technology with deep operational expertise to accelerate efficient, low-carbon, and sustainable hydrogen production.
Gabon | Technip Energies awarded two FEED contracts by SOGARA for refinery complex
Technip Energies has been awarded two front-end engineering design (FEED) contracts by Société Gabonaise de Raffinage (SOGARA) for its refinery in Port-Gentil, Gabon. The FEED scope covers both the revamp and the expansion of the existing refinery.
The first contract covers the FEED for debottlenecking SOGARA’s existing refinery. It targets key process units and includes a new kerosene sweetening
unit and four new storage facilities. Technip Energies will ensure full process integration across existing and new units.
The second contract covers the FEED for a new, modularised hydrocracker complex designed to significantly expand SOGARA’s refining capacity. The scope also includes a new marine jetty and offloading facility. Technip Energies will leverage its engineering excellence and technology
integration know-how, including its proprietary steam methane reforming (SMR) technology for hydrogen production.
Both projects are designed to meet Africa 5 fuel quality standards –the continent’s most stringent specifications for sulfur content in transportation fuels – supporting a meaningful reduction in sulfur emissions and improved air quality.
WORLD NEWS
DIARY DATES
19 - 21 May 2026
Asia Turbomachinery & Pump Symposium Kuala Lumpur, Malaysia atps.tamu.edu
19 - 21 May 2026
World Hydrogen Summit Rotterdam, the Netherlands www.world-hydrogen-summit.com
09 - 11 June 2026
Global Energy Show Canada Calgary, Alberta, Canada www.globalenergyshow.com
15 - 16 July 2026
Downstream USA
Houston, Texas, USA events.reutersevents.com/petchem/downstream-usa
14 - 17 September 2026
Gastech Bangkok, Thailand www.gastechevent.com
20 - 23 September 2026
GPA Midstream Convention San Antonio, Texas, USA www.gpamidstream.org/gpa-midstream-convention
22 - 24 September 2026
Turbomachinery & Pump Symposia Houston, Texas, USA tps.tamu.edu
USA | Axens selected as technology licensor for America First Refining facility
Axens has announced that it has been selected by America First Refining (AFR) as the technology licensor for its large-scale refining facility at the Port of Brownsville, Texas, US. The project marks the first new refinery to be built in the US in more than 50 years.
As part of the agreement, Axens will provide its refining technologies to support the design and operation of the facility, including critical systems that will contribute to the refinery’s overall
performance and reduced energy consumption.
Axens has been engaged on the project since 2017, working alongside AFR entities to advance the development of a facility purpose-built for US energy.
The AFR facility will leverage commercially proven technologies to efficiently process US shale oil into gasoline, diesel, and jet fuel. Once operational, the refinery is expected to process more than 60 million bbl/yr of domestic crude.
Saudi Arabia | Sulzer signs long-term agreement with Aramco
Sulzer has signed a long-term Corporate Procurement Agreement (CPA) with Aramco, which sets a framework for the supply of centrifugal pumps, spare parts, and aftermarket services across Aramco’s global operations. This five-year strategic partnership, which has an extension option for an additional three years, will help ensure high asset performance
across critical upstream, midstream, and downstream operations.
“This CPA helps to strengthen the resiliency of our supply chain, support Aramco’s capital projects, and ensure we maintain the reliability and efficiency of our pump assets across our operations,” said Sulaiman M. Al Rubaian, Aramco Senior Vice President of Procurement & Supply Chain Management.
Global | Wood Mackenzie: Europe and Asia’s response to Middle East crude export collapse
Middle East crude exports collapsed nearly 60% between early February and early March 2026, falling from 18.7 million bpd to 5.9 million bpd as the Strait of Hormuz faced paralysis, according to Wood Mackenzie’s VesselTracker. This disruption has triggered an unprecedented global energy realignment, with Europe importing record North American crude and refined products while simultaneously exporting surplus gasoline and fuel oil (FO) to Asia.
“This is not a temporary disruption but a structural shift in global energy flows,” said Javier Solis, Analyst at Wood Mackenzie – Maritime Team. “Europe’s diesel deficit and gasoline surplus, combined with Asia’s role as the balancing valve, represent a moving landscape in which pricing and flows remain tightly linked to political decisions rather than purely commercial signals.”
Wood Mackenzie expects European diesel premiums to remain elevated through 2H26.
The oil market’s nightmare scenario – the dreaded blockade of the Strait of Hormuz – has arrived.
“The largest supply disruption in the history of the global oil market,” proclaimed the International Energy Agency (IEA) as fear gripped the global energy markets. Asia was hit by fuel shortages and panic buying a week after the start of the latest Middle East war on 28 February 2026.
In response to the US and Israeli aerial bombardment of Iran that killed much of its political and military leadership, the Iranian army started attacking vessels passing through the strait. The narrow 39 km waterway has a direct view of 20% of the world’s oil and gas supplies flowing out of the Middle East to the global markets.
Brent crude held firm in the US$90 - 110/bbl range through the first six weeks, up some 40% from around US$72 before the start of the war.
Ng
Weng Hoong, Contributing Editor, considers how current turbulence in the Middle East could affect oil markets across Asia and Australasia.
Asia was initially calmed by US assurances that this would be a quick war. But panic set in once fighting escalated and the deadline extended indefinitely. Instead of yielding to the US-Israel bombardment, Iran fired missiles and drones to inflict serious damage on the oil and gas fields, refineries, storage terminals, and pipelines of its neighbours.
The extensive damage to the region’s energy industry and Hormuz’s prolonged blockade could send the Brent crude price to US$200/bbl, warned Qatar’s energy minister in an interview with the Financial Times. Analysts at Rystad Energy and Macquarie Group concurred.
Israel’s cities and US military bases in the region have also been hit, provoking Trump’s decision to send in troops in preparation for a long campaign. Analysts warn that a ground war will likely lead to a protracted war that will destabilise the entire region for years.
Asia, which relies on the Middle East for over 60% of its oil supply, has shown a mixed response to the latest oil shock.
The region’s smaller countries along with Australia are reeling while the ‘Big Four’ (China, India, Japan, and South Korea) have so far maintained an appearance of calm owing to their ample stockpiles of crude and products.
Bangladesh, Indonesia, Myanmar, and Sri Lanka have imposed fuel rationing while South Korea, Australia, the Philippines, and Thailand are planning to do so. Malaysia, Vietnam, and the Philippines are encouraging people to work from home.
India seems to be coping after an initial run on LPG supply forced restaurants to temporarily cease operations. The government has begun drawing from its stockpiles, with officials stating that its strategic petroleum reserves are sufficient to meet 74 days of national consumption.
China appears the best prepared for a crisis of this scale as it has built up the world’s largest national oil stockpile, estimated at between 1.2 - 1.3 billion bbl. Beijing has also banned the export of gasoline, jet fuel,
kerosene, and diesel to prioritise supply to domestic consumers.
But even China will feel the pain if the war drags on. For years, China has had access to 1.5 million bpd of heavily discounted Iranian crude which has slowed to a trickle since the start of the war. Since early 2026, Chinese refiners have also lost some 600 000 bpd of cheap crude oil supply from Venezuela after its president was ousted from power by the US.
China
Energy security hit by defeat in Venezuela
On 3 January 2026, China suffered a blow to its energy security when the US captured Venezuelan leader Nicolás Maduro in a lightning raid on Caracas.
In ending his nearly 13-year stay in power, the US has regained some of its previous influence over the energy-rich Latin American country at the expense of China.
The two superpowers are locked in a competition for the world’s natural resources, especially oil and gas, as well as influence over Latin America, Africa, the Middle East, and Asia.
Venezuela, which holds the world’s largest crude oil reserves of 303 billion bbl and a vast amount of minerals and metals, had been an anti-US stronghold since Hugo Chávez’s election as president in 1999.
Following Chávez’s death in 2013, his successor, Maduro, expanded ties with China by using oil as a cornerstone of their countries’ bilateral relationship. Under Maduro, China took in as much as 80% of Venezuela’s oil production at huge discounts and on terms that favoured Chinese buyers.1
According to US Secretary of State Marco Rubio, Chinese firms benefitted from a US$20/bbl discount, and it all came at the expense of the Venezuelan people.2
In losing Maduro, China’s credibility suffered for its failure to protect one of its most important allies in the Global South. With the Americans now effectively in charge of Venezuela, the Chinese have lost a guaranteed source of cheap oil supply. They must also pay cash for the heavy-sour Merey 16 crude from the Orinoco Belt that their refineries have become used to processing.
Some analysts downplay Venezuela’s importance as it contributed to just 4% of China’s seaborne crude oil imports. This positive spin is misplaced as 600 000 bpd of guaranteed oil supply at a US$20/bbl discount for the long-term is a significant loss even for China’s huge 16.8 million bpd market. It represents an immediate and unbudgeted loss of at least US$4.3 billion a year for China’s refiners competing in a cut-throat industry.
But Beijing’s worry extends far beyond the profitability of its oil refiners. It must reckon with the long-term loss of easy access to 17% of the world’s total oil reserves, which in now in the hands of its biggest adversary. This will be a major consideration in any scenario for future conflict.
Even before 3 January, China was already behind the US in the race for oil self-sufficiency. China’s 28 billion bbl of proven reserves are equal to just 62% of the US’ 45 billion bbl.3 China’s 4.3 million bpd domestic production is far from meeting the country’s oil appetite of 16.8 million bpd. To meet the rising net shortfall of 12.5 million bpd, China is increasingly importing oil from politically unstable producers in the Middle East and Africa, as well as war-stricken Russia.
By contrast, the US is already the world’s largest oil producer with an output of 13.2 million bpd bolstered by the assurance of back-up supplies from neighbouring Canada and Mexico. In gaining control over Venezuela’s oilfields, the US has extended its energy advantage over China.
Refiners to rely more on Russia
China’s oil refiners are staring at a difficult 2026 with the loss of access to cheap oil supplies from Venezuela and Iran. Despite being sanctioned by the US, the two countries were able to meet more than 12% of China’s oil consumption, due to the work of an underground network of traders.
The trade had grown dramatically since the start of this decade in response to US attempts to starve the two OPEC members of cashflow. Combined, the two regimes delivered
a total of 2.1 million bpd of oil to China and a smaller amount to India.
With Maduro’s ouster from power, the Trump administration has returned Venezuelan oil to the open markets to be sold at higher prices.
Iran’s sales to China reached a peak of around 1.5 million bpd at a discount of US$10 - 12/bbl in 2025.4,5
The loss of Iran and Venezuela now leaves Russia as China’s main source of discounted oil.
Australia
Fuel rationing not ruled out Australians went into full panic mode over fuel shortages and sharp price increases shortly after the start of the Iran war on 28 February.
Gasoline prices surged by more than 50% in the country’s two largest cities, Sydney and Melbourne, within the first three weeks of the war. From an average AUS$1.80/l on 28 February, it rose to between AUS$2.50 and AUS$3.
In some parts of New South Wales, Australia’s most populous state, angry motorists were confronted by depleted retail outlets (US$1=AUS$1.42).
Prime Minister Anthony Albanese warned that the government would implement ‘emergency measures’ to deal with fuel hoarding amid reports of depleted gasoline and diesel supplies in some parts of the country.
His deputy, Richard Marles, hinted at the prospects of rationing, although that was quickly shot down by other senior officials.
Energy Minister Chris Bowen stated that Australia is prepared to deal with the challenges arising from the Middle East conflict, as the Brent crude price held steady in the US$100 - 110/bbl range on the world markets.
Bowen said the government had undertaken three immediate measures to try to calm Australian consumers: n Release up to 20% of the country’s diesel and fuel reserves to address regional shortages.
n Temporarily amend national fuel standards to keep more locally-refined fuels onshore.
n Crack down on fuel retailers from price gouging.
The government also named veteran energy official Anthea Harris to the newly created position of Fuel Supply Taskforce Coordinator to deal with the fuel and other supply chain challenges arising from the conflict in the Middle East.
These measures are unlikely to calm Australian nerves as the world faces a period of sustained supply disruption from the massive damage inflicted on the oil and gas infrastructure in the Middle East’s oil-producing countries.
Australia has been the author of its own misery.
Successive governments have ignored the IEA warnings that Australia needed to raise its crude stockpile to meet the minimum 90 days of consumption.
In an update, Bowen said Australia has only about 36 days of gasoline in storage, 29 days of jet fuel, and 32 days of diesel. Its oil companies must now compete with other countries to import increasingly expensive fuels from refineries in Asia to offset the loss of supplies from the Middle East.
India
World’s fastest growing oil consumer over the next decade
India will continue to drive global oil consumption but will still be a fraction of China’s market size over the next decade, according to recent forecasts by two agencies.
The IEA said it expects India’s oil demand to rise from 5.5 million bpd in 2024 to 8 million bpd in 2035. This implies an annual average growth of nearly 3.5%, more than 7.9 times the global rate of 0.44% projected by the agency in its recent World Energy Outlook (WEO).
Driven by a better-performing economy and a much larger younger population, India recently overtook China to become the world’s fastest-growing oil market.
China’s oil appetite, which drove the global market for much of this century, will decline over the next decade, said the WEO. Nevertheless, China’s oil market will remain much larger than India’s.
The report said Chinese oil demand will fall from 16.2 million bpd in 2024 to 15.8 million bpd in 2035, which makes it twice as large as the projected Indian market by then. China’s oil use will be dampened by its rapidly expanding fleet of electric vehicles in place of fossil fuel-powered transportation.
The IEA’s forecast has been criticised for its overly pessimistic assessment of the fossil fuels industry in recent years. In the WEO, the agency has conceded to critics by retreating from its previous forecasts that global oil demand would peak before 2030. It has watered down the assumption that climate policies would force the world to reduce its dependence on oil.
It even sprung a big surprise by publishing an upbeat forecast for the oil industry to continue growing over the next 15 years.
It said global oil demand will rise to ‘105 million bpd in 2035 and 113 million bpd in 2050’ from the baseline of 100 million bpd in 2024.
The US Energy Information Administration (EIA), which has consistently maintained a fairly bullish outlook on oil, has endorsed the IEA’s changed stance.
In its latest assessment, the EIA said the world’s consumption of crude and liquid fuels will rise by an annual average 1% in 2026 and 2027. This is more than twice the rate forecasted by the IEA.
The EIA expects India’s oil consumption to rise by 4.6% in 2026 and 5.7% in 2027, again easily outpacing the rate forecast by the IEA.
Singapore
Asian companies increase presence in oil refining industry
Asian companies are increasing their presence in Singapore’s oil refining industry long held by Western firms.
Chevron Corp. is the latest founding member to exit the country’s downstream industry following in the footsteps of Shell, BP, and the Singapore Petroleum Co. (SPC). The US oil giant is reportedly looking to divest its 50% stake in the
Singapore Refining Co. (SRC) which owns a 290 000 bpd refinery, a chain of retail stations and an oil storage terminal. Chevron expects to complete the sale in the coming months as part of its global strategic shift to focus on the more profitable upstream sector.
According to the Singapore media, the US major is in talks to sell its shares to a consortium comprising Japanese oil company Eneos and international commodities trader Glencore.
Together with BP and the SPC, Chevron was a founding member and equal shareholder of SRC in 1979. In 2004, BP sold its 33.3% stake to leave SPC and Chevron as SRC’s joint owners. Five years later, PetroChina, a state-owned Chinese firm, acquired SPC.
In 2025, Shell sold its 237 000 bpd refinery, 1.1 million tpy ethylene cracker, and other downstream assets to a consortium comprising Indonesia’s PT Chandra Asri Pacific and Glencore.
Chevron’s exit will leave ExxonMobil as the only founding member to remain in Singapore’s 55-year-old refining industry.
Mongolia
Proposed oil refinery with India faces enormous hurdles
India and Mongolia face a slew of hurdles to build their proposed refinery project in the landlocked country in northern Asia.
Mongolia’s government has long sought to build a refinery to reduce dependence on importing fuels and refined products from neighbouring China.
The economics are daunting given the project’s estimated cost of US$1.7 billion. Its viability is challenged by its remote location and planned small size of 30 000 bpd in an age when proximity to markets and size are of paramount importance.
The Indian government has offered to finance the project through a soft line of credit that was announced during the visit of Mongolia’s president to New Delhi in October 2025.
The refinery will be located in Altanshiree in the country’s southeastern province of Dornogovi. It will be fed by some 15 000 bpd of domestic crude from the neighbouring Dornod province that is currently exported to China.
Neither government has mentioned how the refinery will source the other 15 000 bpd to maximise its utilisation when it is supposed to start up in 2028.
Bryan Clementson, MISTRAS Group, considers how managed mechanical integrity programmes can improve reliability while reducing costs across the hydrocarbon processing industry.
Mechanical integrity (MI) programmes remain one of the most challenging aspects of process safety management in the hydrocarbon processing industries. Despite decades of regulatory focus and industry attention, MI consistently generates the highest number of findings in OSHA Process Safety Management (PSM) audits. Recent analysis of US Department of Labor data from 2020 through 2025 shows that MI audit findings significantly outpace those for other PSM elements, indicating widespread struggles with programme maturity across the industry. Identifying and addressing MI findings in a timely manner is paramount to keeping operations safe and reliable while avoiding significant costs from failures. For example, in 2012, a refinery on the West Coast of the US had a catastrophic rupture of an extremely corroded carbon steel pipe caused by sulfidation corrosion in a crude unit, releasing flammable hydrocarbon process fluid that ignited. This resulted in the operator paying US$2 million in penalties and restitution, almost US$1 million in regulatory fines, and more than US$20 million in safety enhancements.
This persistent challenge stems not from lack of awareness or effort, but from the inherent complexity of comprehensive MI programmes and the resource constraints facing most facilities. While technology solutions continue to advance, a significant gap persists between where facilities stand today and where they need to be to achieve full compliance and optimal performance. This gap has widened as workforce reductions limit available expertise and headcount, even as regulatory expectations and operational demands increase.
Recent industry discussions have highlighted an emerging model that addresses these challenges through integrated, managed, turnkey MI services such as MINT by MISTRAS. This approach represents a fundamental shift from traditional fragmented service delivery, or even from managed NDE data collection, offering a pathway to comprehensive MI programme maturity that can actually reduce total costs while improving reliability and compliance.
The four elements of comprehensive MI programmes
Many organisations initially approach MI primarily as an inspection and testing function. This narrow focus, while understandable, addresses only one quarter of the full compliance requirement. When viewed through the lens of OSHA PSM 1910.119, comprehensive MI encompasses four distinct but interconnected elements.
Inspection and testing
This traditional focus area involves scheduled inspections, thickness measurements, and equipment testing according to applicable codes and standards. Most facilities handle this element reasonably well, having established relationships with inspection service providers and NDT contractors. However, even within this seemingly straightforward category, challenges persist around data quality, scheduling optimisation, and application of appropriate inspection methods.
Deficiency management
This frequently-overlooked element addresses what happens after inspections identify issues. How are recommendations tracked? What workflow ensures they move through engineering evaluation, prioritisation, work planning, and execution? How does the organisation prevent recommendations from being lost before completion? Analysis of major incidents reveals that deficiency management failures – not inspection failures – frequently contribute to
catastrophic events. Equipment may be inspected regularly and problems identified, but if recommendations do not complete their workflow, the inspection provides no protection.
Programme establishment
This element encompasses developing written procedures, determining applicable regulatory frameworks, making technical decisions about which codes and standards apply to specific equipment, and establishing an MI programme that can realistically be sustained by those responsible. Is a particular pressure vessel subject to API 510, or does API 653 apply? Should piping follow API 570, or does the configuration require API 571 damage mechanism assessment? Who in the organisation possesses the expertise to make these determinations authoritatively? Many facilities struggle to maintain current knowledge across the dozens of relevant API standards, ASME codes, and local jurisdictional regulatory requirements, each potentially hundreds of pages long and subject to periodic revision.
Training and quality assurance
The fourth element addresses personnel qualifications, certifications, and quality programmes for both repairs and new equipment procurement. Are inspection personnel properly certified? Do their certifications remain current? What quality assurance procedures govern repair work? How does the organisation verify quality in new equipment purchases? This area represents another common gap, as facilities may lack formal quality assurance programmes or struggle to maintain documentation of qualifications and certifications.
Six categories of MI programme challenges
Industry experience suggests that most MI programme problems fall into six primary categories, each reflecting resource and organisational constraints rather than technical impossibility:
n Limited headcount constrains what internal teams can accomplish, even when individuals understand what needs to be done.
n Lack of specialised expertise creates knowledge gaps, particularly regarding the breadth of applicable codes and standards.
n Siloed vendors fragment programme
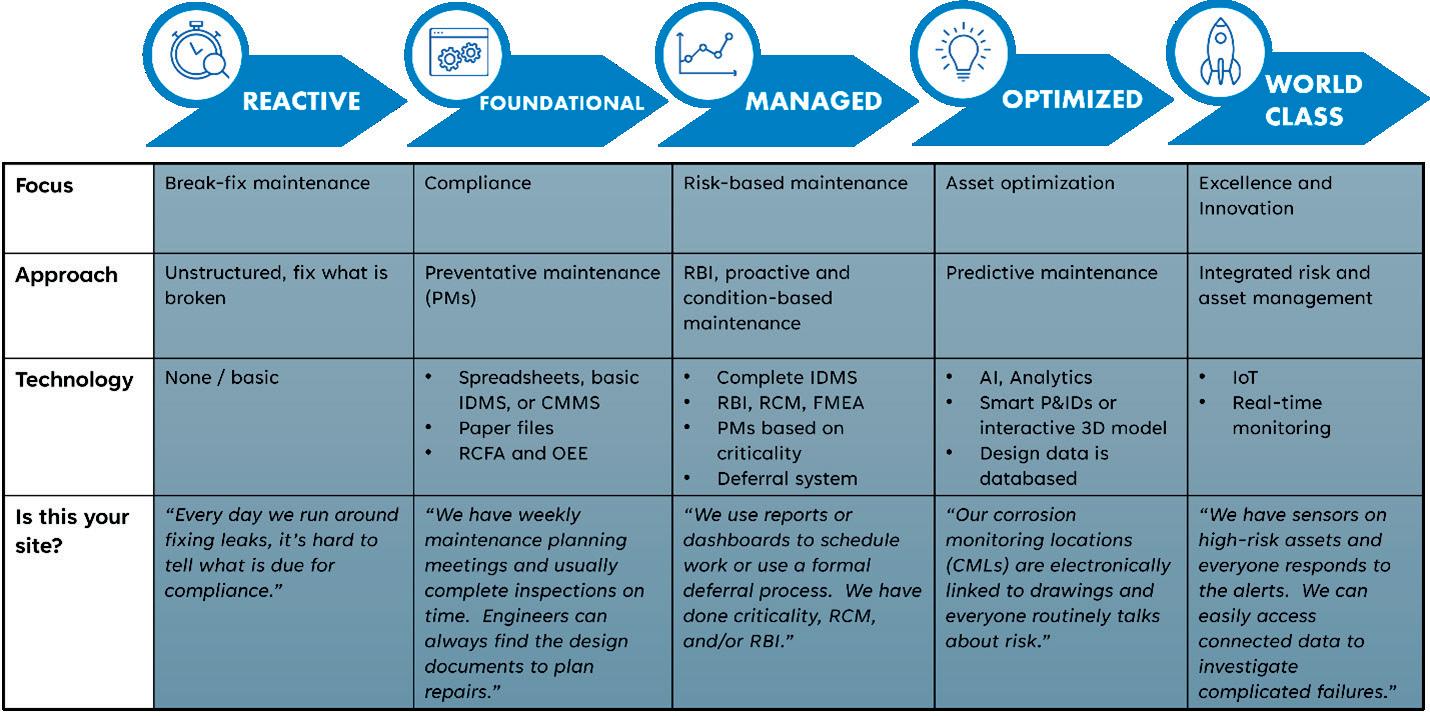
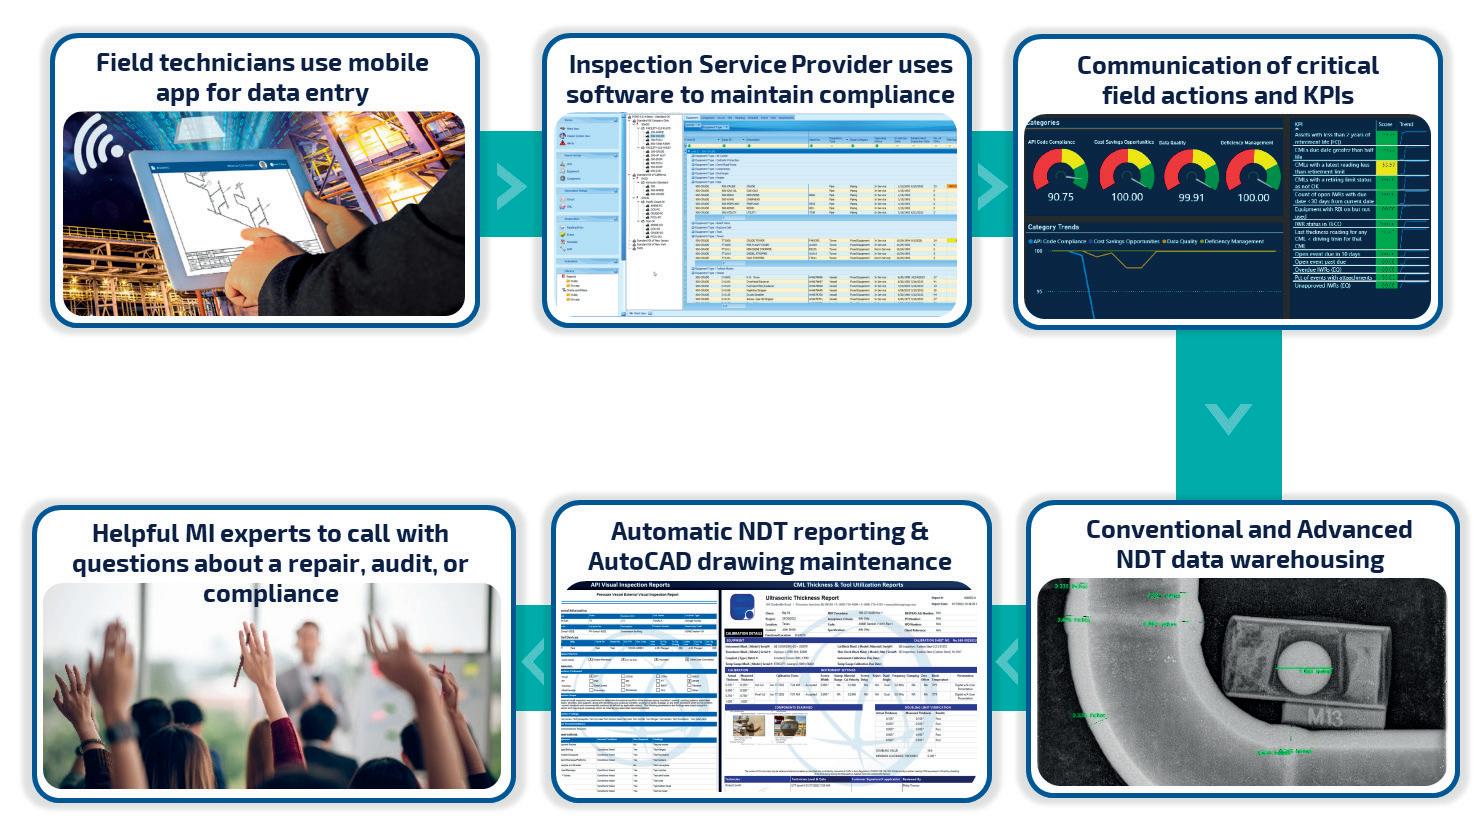
Figure 1. This asset integrity maturity model outlines the evolution from reactive maintenance to excellent asset management. The emergence of managed MI programme models can help organisations close the gap between the current state and comprehensive programme maturity.
One Catalyst. Many Feeds. That’s FUSION ®
If your FCC unit needs to handle everything from hydrotreated VGOs to high-metals resid, Grace’s FUSION® catalyst technology delivers uncompromising performance, so you can maximize conversion, minimize coke and unlock flexibility across feed types.
Why FUSION®?
• Industry-leading coke selectivity
• Exceptional bottoms-cracking performance
• True feedstock flexibility
Proven Performance, Global Reach
Trusted worldwide, FUSION® operates in FCC units with equilibrium catalyst Ni+V levels from 800 ppm to over 12,000 ppm. Whether you’re optimizing for metals, conversion, or yield selectivities, FUSION® can help you adapt and succeed.
Ready to expand your FCC flexibility?
Visit Grace.com or talk to your Grace representative.
Figure 2. Built for plants with limited time, headcount, or MI expertise, a managed MI services model integrates inspection, data management, and engineering support from a single expert provider.
delivery, with separate organisations handling inspection, data entry, engineering analysis, and other functions.
n Fragmented systems create integration challenges when CMMS, IDMS, and other platforms do not communicate effectively.
n Compliance risk and audit stress intensify when organisations cannot confidently demonstrate programme maturity.
n Unpredicted budget issues arise when previously uncaptured equipment enters the programme or when reactive maintenance demands exceed planning assumptions.
Recent industry polling indicates that unpredicted budget challenges rank as the most pressing concern, followed closely by lack of expertise and limited headcount. Notably, all three top concerns relate to resource constraints rather than technical capability.
The critical role of data management
Recent industry surveys reveal that the biggest software challenges in MI programmes relate to inputting data into databases accurately and consistently. These issues stem from two root causes: user willingness to engage with software systems, and user expertise in knowing how to use them properly. Inspection reports frequently experience significant delays in data entry, with personnel uncertain about which fields are critical or which information belongs where. These challenges have likely been further amplified by personnel shortages and expertise gaps amid widespread workforce reductions. The problem manifests most clearly in organisations where tens or hundreds of people enter data into inspection data management systems. Despite detailed procedures – sometimes extending to 70 pages or more –achieving consistency across multiple data entry personnel proves nearly impossible without systematic standardisation. The consequences of poor data management extend beyond administrative inconvenience. Analysis of major industry incidents over the past two decades reveals that failures in data
management and deficiency tracking contributed to multiple catastrophic events:
n A refinery incident involving accelerated corrosion, where poor MI culture led to delayed preventive maintenance despite clear inspection findings.
n A pipeline explosion resulting in eight fatalities, where incorrect MAOP calculations and missing quality control documentation for historical weld repairs created unrecognised hazards.
n A heat exchanger failure where inspection recommendations to replace damaged sections became lost in the workflow, leading to an explosion despite multiple prior replacements.
n A well-publicised refinery incident where multiple inspection recommendations were made and engineering teams notified, but no action was taken before the equipment failed catastrophically.
These incidents demonstrate that while data management alone cannot solve all MI programme problems, it represents a key contributor to programme performance, working alongside organisational culture and other factors to prevent failures.
Beyond traditional turnkey inspection services
Turnkey inspection services have existed in the industry for years, typically encompassing field inspection, thickness measurement, data entry into client IDMS systems, and isometric drawing updates. While valuable and straightforward, this traditional model addresses only the inspection and testing element of MI. Three of the four essential MI elements remain the client’s responsibility, without addressing optimisation of inspection spending and prevention of data entry errors.
An emerging alternative model provides comprehensive MI programme management rather than just inspection services. This managed approach includes several key components that distinguish it from traditional offerings.
Mobile digital inspection
Traditional inspection workflows introduce error through manual transcription. A field technician takes thickness readings with a UT meter, manually records values on paper, then passes that paper to data entry personnel who type the readings into a computer. Across thousands of measurements, human transcription errors inevitably occur at both steps.
Modern mobile inspection systems eliminate these errors by transmitting measurements directly from the inspection instrument to the database, either in real-time via wireless networks or through automatic upload when connectivity becomes available. No human intervention occurs between the
measurement and the database entry, ensuring the recorded value exactly matches what the instrument measured. While efficiency gains accompany this approach, the primary value lies in data quality improvement – essential for organisations seeking to leverage advanced analytics and AI-based tools.
Standardised data management
Regardless of which IDMS platform an organisation selects, if people are not willing, able, and knowledgeable about entering information correctly, the system will not deliver results. Managed MI programmes address this challenge by making data quality and consistency the provider’s responsibility, rather than expecting dozens of facility personnel to maintain expertise in database structure and data entry conventions.
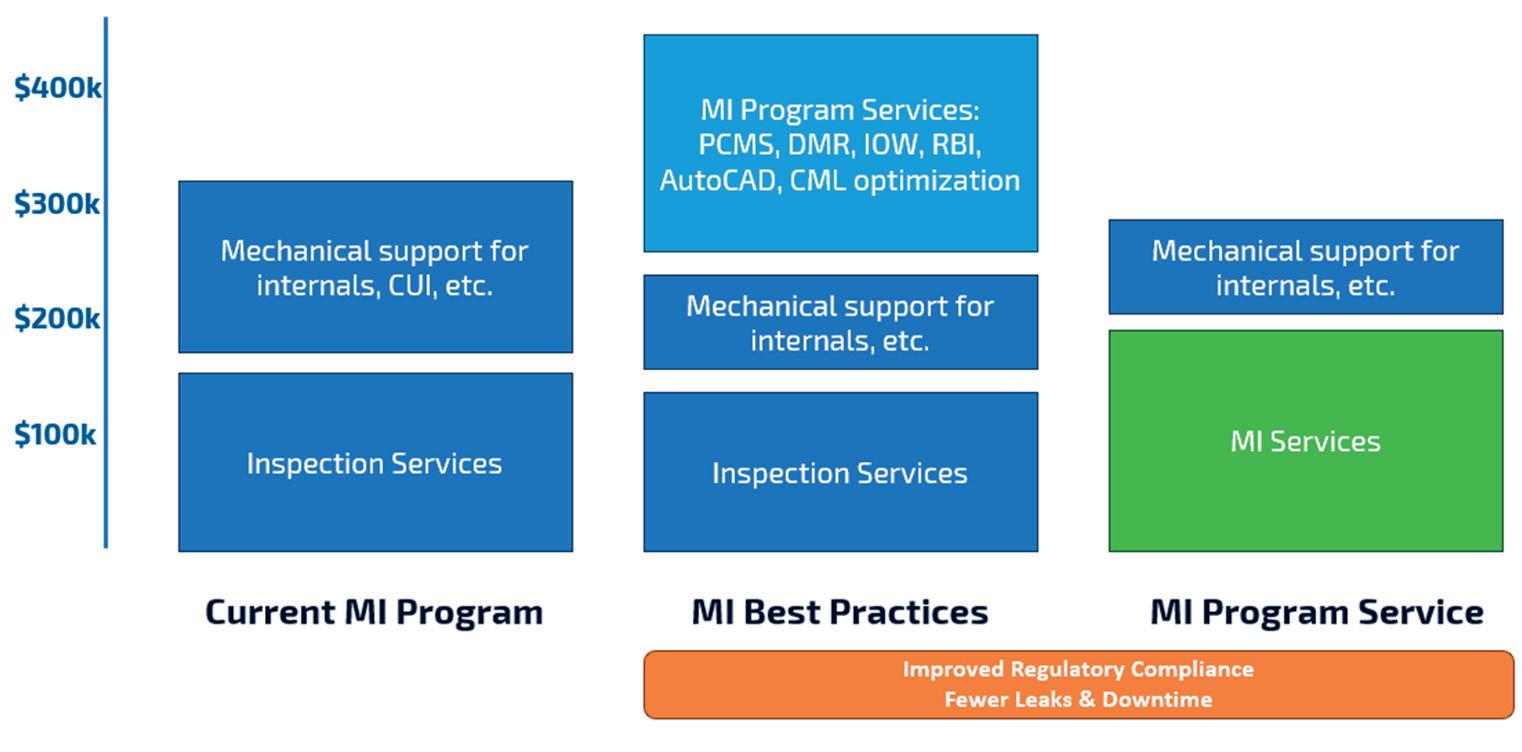
Figure 3. Plants can lower the overall cost of inspection by bundling asset integrity services together with an MI partner.
Expert consultation access
This approach proves particularly valuable for organisations attempting enterprise-level programme views across multiple sites. Achieving consistency in how different facilities populate databases becomes nearly impossible without coordinated oversight – a natural fit for managed programme providers serving multiple client locations.
KPI monitoring and reporting
Industry standards like API 592 recommend monitoring key performance indicators (KPIs) to manage MI programme health. Common metrics include overdue inspections, overdue recommendations, equipment below minimum thickness, and temporary repairs. These KPIs have become largely standardised across the industry.
Many organisations have addressed KPI reporting by having internal personnel learn business intelligence tools and build custom dashboards. While effective, this approach creates sustainability risks when those dashboards depend on one or two individuals who understand the database queries. If those key individuals leave, compliance visibility may disappear with them. Managed programmes provide industry-standard KPI solutions, allowing organisations to focus on improving performance rather than maintaining reporting infrastructure.
Drawing management
Maintaining accurate, current isometric drawings and P&IDs represents one of the most common gaps in MI programmes. Drawings often have not been updated in years or exist only as hand-drawn paper documents that are difficult to modify. As document management functions have disappeared from many facilities, responsibility for drawing accuracy has become unclear.
Managed MI programmes explicitly include drawing maintenance as a core deliverable, ensuring that as-built documentation remains synchronised with physical equipment configuration. Some programmes are even incorporating 3D model maintenance, though this requires significantly more sophisticated capability than traditional 2D CAD management.
Even small facilities benefit from access to specialised expertise in areas like fitness-for-service assessment, failure analysis, corrosion engineering, and regulatory compliance. However, engaging consultants through traditional procurement processes – issuing RFPs, awarding purchase orders, and scheduling availability – introduces delays that may be unacceptable when time-sensitive decisions are required.
Managed programmes provide on-demand access to these specialties without procurement delays. While most facilities do not need full-time fitness-for-service engineers or corrosion specialists, having immediate access to this expertise when needed provides significant value. This model proves particularly effective for smaller facilities that experience infrequent but critical needs for specialised knowledge.
Economic considerations and total cost
Understanding the true cost of MI programmes requires looking beyond inspection service contracts. A typical facility pays for inspection services but also incurs substantial internal costs for the mechanical support necessary to execute inspections, manage data, track deficiencies, and maintain compliance. This internal cost often equals or exceeds the external inspection service cost.
Organisations pursuing best practices through traditional approaches typically add multiple new service contracts to existing inspection arrangements: IDMS software licences and IT implementation, data entry services, or additional internal headcount, CAD drawing update services, and business intelligence tool development. The cumulative cost of separate scopes plus coordination overhead can be substantial.
Managed MI programmes deliver similar or superior capabilities through different economics. By consolidating traditionally separate services under unified management, providers can achieve operational efficiencies – elimination of redundancy between providers, standardised processes across clients, shared specialised resources, and maintained expertise pools – which enable pricing structures that may compete favourably with current spending despite adding extensive new capabilities.
Various commercial structures have emerged to support managed programmes, including fixed-price arrangements that provide budget certainty, subscription models that align costs
with operational periods, and hybrid approaches. The key insight is that total programme cost may not increase significantly even while capabilities expand dramatically, particularly when accounting for reduced internal coordination effort and improved reliability, which reduces reactive maintenance.
Expected performance improvements
Facilities implementing comprehensive MI programmes, whether through internal development, traditional multi-vendor approaches, or managed programme models, consistently report several categories of improvement.
Reduced process safety events
Effective MI programmes reduce leaks and process safety incidents. While risk-based inspection provides powerful tools for achieving these outcomes, even basic improvements in data management and disciplined deficiency tracking prevent failures. The fundamental purpose of MI – finding and fixing problems before they become incidents – depends critically on closing the loop from inspection findings through corrective action completion.
Optimised maintenance costs
Access to expert guidance enables the selection of the most cost-effective approaches to compliance. Many different inspection strategies can achieve equivalent safety and regulatory compliance, but costs vary dramatically between approaches. Organisations characterised by reactive maintenance – constantly responding to failures rather than preventing them – experience higher costs and more challenging work environments.
Code optimisation represents another significant opportunity. Within API and ASME codes, numerous exceptions, alternative approaches, and risk-based options exist that can reduce inspection frequency or scope while maintaining safety. However, identifying and properly applying these options requires deep code knowledge that may exceed internal expertise.
Improved uptime
Well-managed programmes that prevent process safety events naturally enable better uptime and higher production. Facilities report production improvements ranging from 1 - 5%, depending on starting conditions, with greater improvements correlating to larger gaps between the initial state and best practices. These uptime gains often dwarf other programme benefits when translated to revenue impact.
Confident compliance
Organisations uncertain about compliance status – common when relying on spreadsheets and incomplete documentation – face significant stress during audits. Comprehensive managed programmes, particularly those with integrated expert support like MINT, enable confident compliance demonstration. Rather than scrambling when auditors arrive, facilities can immediately present organised programmes with clear documentation and knowledgeable personnel who can authoritatively explain programme elements and technical decisions.
Implementation considerations
Organisations considering managed MI programmes should evaluate providers against holistic programme criteria such as:
n How does the provider ensure drawing accuracy and maintain design documentation?
n What process determines applicable regulatory frameworks and code selection?
n How are data entry errors prevented systematically?
n What mechanisms track deficiencies from identification through resolution?
n How does the programme optimise inspection spending while maintaining compliance?
n What expertise is available for time-sensitive technical decisions?
n How does the commercial structure align with operational needs and budget constraints?
The answers to these questions reveal whether a programme offers truly comprehensive MI management or merely repackaged traditional services. It is particularly important to understand how the managed approach addresses the four MI elements beyond just inspection and testing.
Conclusion
The persistent challenge of MI in the hydrocarbon processing industries stems less from technical barriers than from fragmented approaches, limited resources, and sustainability concerns. Organisations understand what comprehensive MI programmes should accomplish but struggle to assemble and maintain the necessary capabilities given headcount constraints, expertise gaps, and coordination demands.
Managed MI programmes represent an evolutionary response to these challenges, consolidating traditionally separate functions under unified management. By addressing all four MI elements – inspection and testing, deficiency management, programme establishment, and training and quality assurance – within a coordinated framework, these programmes can deliver comprehensive capabilities at competitive total costs while reducing organisational burden.
The industry data is clear: MI remains the most problematic PSM element, data management challenges are intensifying, and major incidents continue to stem from programme execution failures rather than technical impossibility. Whether facilities choose internal development, traditional multi-vendor approaches, or managed programme models, the fundamental requirement remains consistent: comprehensive attention to all programme elements, supported by disciplined data management, expert guidance, and systems that enable rather than hinder the work.
As the industry continues evolving, the key question for each organisation is whether its current MI improvement approach proceeds in an organised, cohesive manner, or whether fragmentation and inefficiency are consuming resources better directed toward actual reliability, safety, and performance improvements. The emergence of managed MI programme models provides a new option for organisations seeking to close the gap between the current state and comprehensive programme maturity.
Andre Roodzant, Integrated Global Services (IGS), discusses practical life extension strategies for delayed coking drums.
Delayed coking drums operate under some of the most severe cyclic thermal conditions in the refining industry. Cycles of heating to approximately 480 - 500°C (900 - 930°F) followed by rapid water quenching generates large thermal strain ranges through the vessel wall. Over years of operation, these daily expansion and contraction cycles drive fatigue crack initiation and propagation, particularly at geometric discontinuities and structural transitions.
Industry standards such as API 934-J, ASME Section VIII, and API 579-1 / ASME FFS-1 provide essential design and assessment frameworks. However, field repair and life extension decisions often require engineering judgement beyond strict code compliance. This article examines dominant damage mechanisms in coke drums, inspection realities vs field conditions, repair methodology selection (including post-weld heat treatment [PWHT] vs temper bead welding), and practical strategies for extending safe operating life under severe cyclic fatigue.
The thermal fatigue environment of coke drums
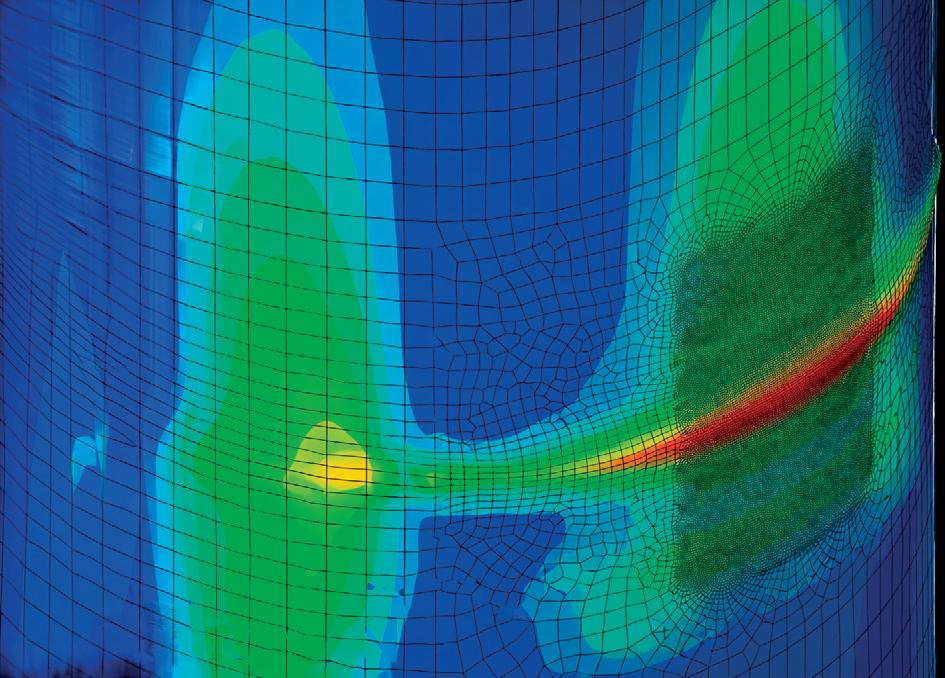
Delayed coking is inherently cyclic. Depending on refinery configuration and throughput targets, cycle durations typically range from approximately 14 to 28 hrs, meaning a single drum may experience hundreds of severe thermal cycles each year (Figure 1). During each cycle, residual feedstock is introduced at an elevated temperature and held during thermal cracking before the drum is rapidly quenched with large volumes of water.
Unlike many refinery vessels, where corrosion is the dominant degradation mechanism, coke drum life is most often governed by cyclic mechanical fatigue rather than progressive metal loss.
The severity of the quench phase is frequently underestimated. One cubic metre of liquid water expands to approximately 1700 m3 of steam, and this rapid internal phase change imposes steep thermal gradients across the shell thickness.
During heating:
n The shell expands.
n Structural attachments lag thermally.
n Local bending stresses develop.
During quench:
n The shell cools rapidly, but unfortunately not evenly (compare this to a soft drink poured into a glass full of ice cubes: it fills the voids, creating cold zones in the still very hot drum, causing high thermal stresses which can ultimately lead to local bulging of the wall).
n At joints with external parts, especially the skirt attachment area, the wall remains comparatively hot.
n Tensile stresses reverse direction.
This daily strain cycling produces high-cycle fatigue conditions. Crack initiation is typically governed by thermal strain range (ΔT-induced expansion mismatch), stress concentration factors (Kt) at weld toes and transitions
Figure 1. Simulated temperature and deformation response during thermal cycling, highlighting stress concentration at the skirt-to-shell junction.
(surface finish), local restraint conditions, material toughness and microstructural condition, and corrosion.
Once initiated, fatigue crack growth is driven by cyclic stress intensity range (ΔK). Growth rate typically accelerates as crack length increases, particularly where residual stress and geometric discontinuities amplify the local stress intensity.
Fatigue damage in coke drums is not anomalous; it is a structural consequence of operating design.
Dominant damage mechanisms in service
Table 1 summarises common fatigue-dominant damage locations, their primary drivers, and typical integrity responses used in practice.
Skirt-to-shell weld cracking
The skirt-to-shell weld is one of the most fatigue-sensitive locations in a coke drum.
During coking, the shell approaches operating temperature while the skirt, partially shielded and structurally restrained, heats and cools more gradually. This thermal mismatch generates cyclic bending stress at the weld interface.
Over time, cracks initiate at weld toes, propagation occurs circumferentially, and multi-site cracking may develop.
Field experience shows that once established, skirt weld cracks rarely self-arrest; they continue to grow unless stress is redistributed or the geometry is modified.
In advanced cases, circumferential cracking can approach full separation. Progressive displacement between skirt and shell has been documented, occasionally accompanied by fretting and incremental settlement.
Table 1. Common fatigue-dominant coke drum damage mechanisms and response logic
Damage mechanism/ location
Skirt-to-shell weld cracking
driver(s) What to look for (field indicators)
Thermal mismatch, local restraint, high Kt at weld toe
Bulging/shell deformation
Clad seam/restoration weld cracking
Cyclic thermal strain and local stress redistribution
Dissimilar metals and cyclic strain; HAZ hardness/ toughness
Cone/lower section damage
Mechanical abrasion and clad loss and erosion
Toe cracks, circumferential indications, settlement/fretting signs
Laser scan bulge growth; sharp transitions; proximity to seams
Cracks at clad restoration zone; shallow-to-deep progression
Clad thinning, exposed substrate, impact wear
In many designs, the skirt-to-shell junction effectively functions as a structural fuse. Concentrating cyclic stress at this interface helps preserve primary shell integrity, but it also makes the skirt weld the most fatigue-prone location in the assembly.
VT and MT/PT at toes; UT for depth; dimensional checks
Laser scanning trending and FFS screening (API 579)
Targeted UT mapping; PT on clad; excavation confirmation
VT; thickness mapping; define cut-line after insulation removal
Excavation and engineered repair length; consider TBW vs PWHT feasibility; monitor crack recurrence trend
Trend-based decision; repair if growth rate/geometry drives unacceptable stress
Localised repair with metallurgical controls; conservative assessment if base metal involvement suspected
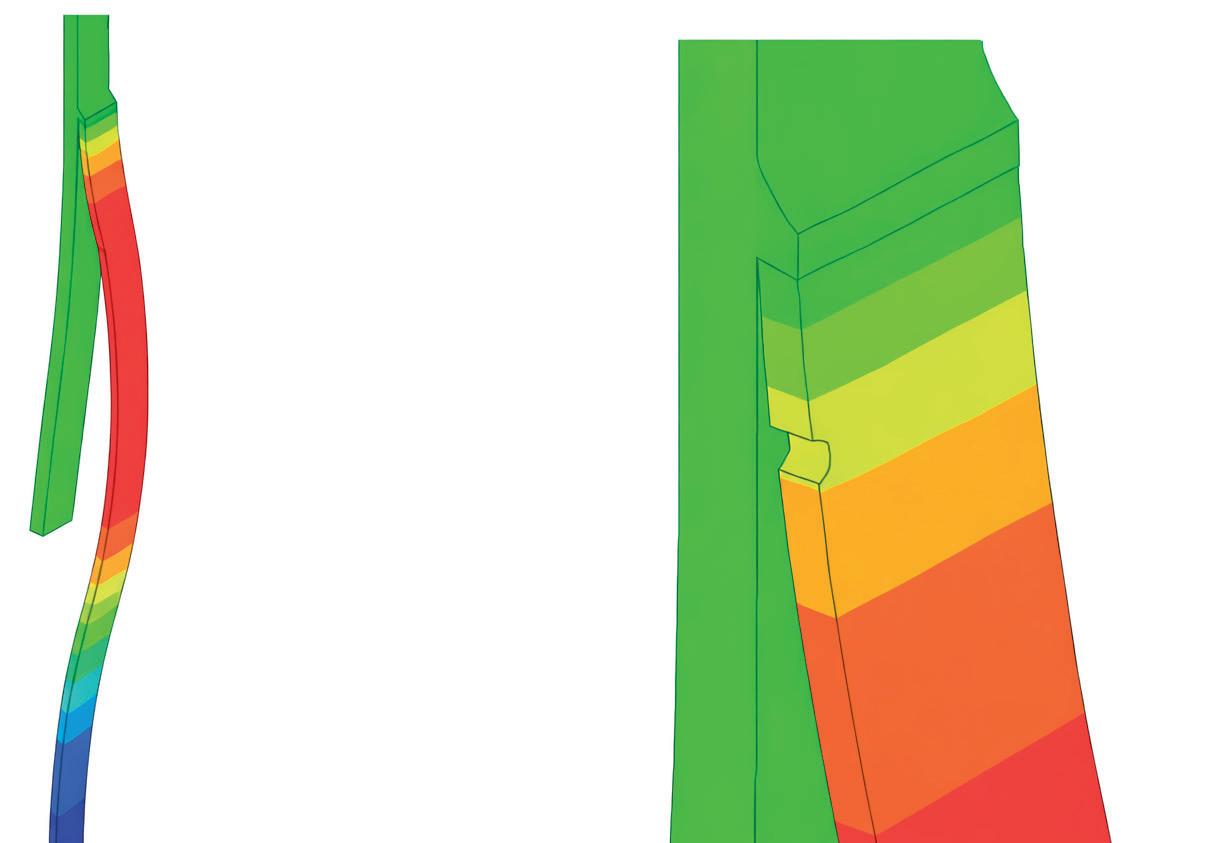
Bulging is frequently identified during internal laser scanning (Figure 2). However, not all bulges require immediate intervention. Critical assessment factors include:
n Bulge height-todiameter ratio.
n Radius of curvature transition.
n Membrane vs bending stress distribution.
In-situ analysis + Stress-free performance
Get insights into combustion control
with the Servomex Laser 3 Plus series, which offers a built-in display, advanced diagnostic and high measurement stability.
Learn
Inspection reports vs field reality
A recurring challenge in coke drum repair is the discrepancy between inspection assumptions and exposed conditions.
Inspection reports may classify cracking as superficial. Upon excavation, findings often include through-wall fatigue cracks, multi-site cracking over extended circumferential distances, metallurgical embrittlement in heat-affected zone (HAZ) regions, or previously undocumented repairs.
Clad systems can mask underlying crack depth. Ultrasonic grid mapping may under-represent crack severity in complex geometries.
Effective life extension planning requires:
n Pre-qualification of multiple welding procedures.
n Contingency planning for scope escalation.
n Availability of alternate repair strategies (e.g., PWHT vs temper bead).
n Structural assessment support during execution.
n Growth rate across inspection intervals.
n Proximity to weld seams.
A gradual deformation over a large area may be structurally less critical than a sharp geometric discontinuity with high local stress concentration.
Fitness-for-service evaluation under API 579-1 Level 2 or Level 3 methodologies is often required to determine remaining life. Trending data is essential. Single-scan geometry assessment without growth-rate context can lead to overly conservative or premature repair decisions.
Clad seam and restoration weld cracking
Most coke drums are fabricated from clad plate, typically low-alloyed Cr-Mo steel with approximately 3 mm stainless lining.
These dissimilar material interfaces exhibit differing coefficients of thermal expansion and mechanical properties. Under cyclic loading, local stress redistribution frequently leads to crack initiation in the clad restoration weld or adjacent heat-affected zone.
Initial cracks are often shallow. However, if fatigue propagation extends into the base material, through-wall risk increases significantly.
These areas require careful crack depth mapping and conservative assessment.
Cone and lower section damage
The lower cone region experiences mechanical abrasion from falling coke during decoking operations. Repeated impact and erosive action can compromise clad integrity and expose the carbon steel substrate.
Determining the appropriate cut line for cone replacement often requires insulation removal and in-situ inspection. Pre-fabricated replacement sections should allow dimensional flexibility, as actual degradation boundaries frequently differ from pre-TAR estimates.
In practice, successful outcomes depend less on the initial inspection narrative and more on readiness for what is uncovered. Programmes that perform best typically mobilise with pre-qualified procedures (including alternates), defined inspection/repair hold points, and welding engineering oversight to adapt repair strategy in real time. This approach, common in larger drum reliability programmes, helps prevent scope creep from becoming schedule creep.
Repair methodology – PWHT vs TBW
PWHT
For heavy-wall pressure vessels, ASME Section VIII commonly requires PWHT to reduce residual stress and temper heat-affected zones.
In coke drum skirt repairs, however, practical constraints arise:
n The skirt supports full drum weight.
n Heating to 650 - 700°C (1200 - 1290°F) reduces yield strength.
n Under sustained load, distortion risk increases.
n Extended heating cycles may not align with turnaround schedules.
n The number of previously performed heat treatments after repair.
While – in most cases – metallurgically beneficial, PWHT may introduce unacceptable mechanical risk when performed under structural load.
Engineering judgement must weigh metallurgical benefit against structural consequence.
Temper bead welding (TBW)
Temper bead welding provides a viable alternative to PWHT where global heating introduces structural or schedule risk.
The method relies on controlled heat input and deliberate bead sequencing to temper and refine the HAZ of previously deposited weld passes. By managing interpass temperature and bead placement, subsequent layers reheated within qualified limits reduce (peak) hardness and improve toughness without elevating the temperature of the entire component.
Figure 2. Bulged area displacement (magnified five times).
Table 2. Practical considerations when selecting PWHT vs TBW for skirt repairs
Consideration PWHT tends to fit when: TBW tends to fit when:
Structural load during heat treatment Drum can be safely supported/unloaded
Schedule Heat cycle and controls fit TAR window
Metallurgical requirement Code/assessment requires full stress relief
Execution risk
Heat treatment controls are robust on site
Heating under load presents distortion risk
TAR window is tight; localised control preferred
Hardness control and HAZ tempering can be verified locally
Procedural discipline and in-process verification are available
In coke drum skirt repairs, TBW is often considered where:
n The skirt remains load-bearing.
n Full circumferential heating may reduce yield strength under sustained weight.
n Turnaround duration limits extended heat treatment.
However, TBW is not a simplified substitute for PWHT, it is a widely accepted compromise when full PWHT is undesirable or impracticable. Its effectiveness depends on strict procedural discipline. Because performance is highly sensitive to bead placement accuracy and heat input control, execution benefits from weld engineering oversight, in-process verification, and documented hardness mapping rather than reliance on workmanship alone.
When applied within a qualified framework, TBW can provide a balanced solution in fatigue-dominant repairs where structural constraints limit the feasibility of PWHT.
The practical selection between PWHT and TBW is typically driven by structural, metallurgical, and schedule constraints, as summarised in Table 2.
Replacement vs managed life extension
Many coke drums currently in service were designed decades ago for different crude slates, operating severities, and anticipated service lives. Increased cycle frequency, heavier feedstocks, and extended life expectations have shifted fatigue demand beyond original design assumptions. Life extension strategy is therefore not corrective, but adaptive engineering in response to evolving operating realities.
Full coke drum replacement presents significant challenges:
n Long fabrication lead times (often up to 24 months).
n Major lifting and transport logistics.
n Extended outage risk.
n TAR integration impacts across adjacent units.
n High capital expenditure.
Many refineries also lack sufficient upstream storage capacity to tolerate prolonged drum downtime.
As a result, life extension strategies frequently serve as bridge solutions, maintaining safe operation while deferring capital replacement. The objective is not restoration to ‘as-new’ condition, but controlled mitigation of fatigue progression within defined structural margins.
Where crack depth, plastic deformation, or load-path compromise exceeds acceptable limits, structural weld overlay (SWO) may be applied to redistribute stress and restore structural margin without full drum replacement.
Where localised degradation is severe, partial shell replacement (‘window’ or ‘can’ replacement) may be performed. Automated welding processes are often employed in these cases to improve weld consistency, control heat input, and manage residual stress in heavy-wall repairs.
A practical framework for life extension decision-making
An effective repair strategy typically follows a structured evaluation:
n Crack characterisation: depth, orientation, and fatigue vs corrosion dominance.
n Load path assessment: is structural continuity compromised?
n Thermal constraint evaluation: would PWHT introduce unacceptable mechanical risk?
n Fitness-for-service analysis: remaining life under projected cycling frequency.
n Operational constraint review: turnaround duration and window limitations.
In many drum programmes, these steps are formalised into a repair decision tree supported by pre-approved welding procedure specification (WPS) packages and rapid-turn structural review when findings change.
Philosophy of coke drum reliability
Thermal fatigue in coke drums is thermodynamically unavoidable. The objective is not elimination, but predictability. Successful life extension depends on:
n Accurate damage characterisation.
n Procedural readiness.
n Metallurgical control.
n Structural awareness.
n Field adaptability.
Cracks may reappear over time. The goal is to slow propagation, preserve load paths, and extend safe operating cycles while supporting long-term capital planning.
Conclusion
Delayed coking drums operate in a fatigue-driven environment defined by severe thermal cycling. Codes provide essential boundaries, but real-world life extension requires engineering judgement informed by field experience.
Repair decisions must integrate fracture mechanics, metallurgical considerations, structural constraints, and operational realities. In practice, the most effective life extension strategies are those that acknowledge fatigue as inevitable and focus instead on managing it safely, predictably, and within defined structural margins over time.
Coke drum reliability is not about eliminating thermal fatigue, but about improving the predictability of how operators can control its progression.
Francesca Rizzi, Trillium Flow Technologies, Italy, explores pump solutions to meet the challenges of the downstream oil and gas market, with particular focus on a refinery modernisation project in North Africa.
The downstream oil and gas sector encompasses refining, conversion, treatment, and distribution processes that transform crude oil into market-ready products. Within this segment, refineries operate some of the most complex and demanding process environments in heavy industry. Equipment is
required to perform reliably under high temperatures, aggressive fluids, variable operating conditions, and increasingly strict regulatory constraints. Among critical rotating equipment, process pumps play a central role in ensuring continuous, safe, and efficient plant operation.
Refinery operators today face a convergence of challenges. These include the need to expand capacity to meet domestic demand, upgrade existing assets to comply with modern fuel specifications, manage tighter environmental requirements, and execute projects within constrained schedules and budgets. In this context, pump selection is no longer limited to meeting basic hydraulic requirements; it increasingly involves detailed customisation, material selection, auxiliary system integration, and close coordination with plant engineering and construction activities.
This article examines a refinery expansion and modernisation project in North Africa, focusing on the supply of API 610-compliant pump systems. The project illustrates how a technically complex pump package, covering a wide range of services and configurations, can be engineered and delivered to support refinery performance, operational reliability, and long-term sustainability objectives.
Project overview
The project involved modernising and expanding an existing refinery as part of a broader national strategy to increase domestic refining capacity and reduce reliance on imported petroleum products. The scope included a 60% increase in throughput, bringing total capacity to approximately 160 000 bpd, alongside upgrades to meet Euro 5 fuel quality standards.
In addition to capacity expansion, the project placed strong emphasis on sustainability and operational efficiency. Design objectives included reducing emissions, optimising energy use, and minimising the consumption of natural resources. These goals had direct implications for process equipment selection, particularly for pumps operating in critical and energy-intensive refinery services.
As part of the expansion, Trillium Flow Technologies (Trillium) was selected to deliver a comprehensive
package of API 610 centrifugal pumps mounted on complete skids. The scope comprised 40 different pump models, supplied as 67 different complete skid units, serving both new process units and the replacement of existing equipment within the operating refinery.
Pump supply scope and technical requirements
The pump supply covered six API 610 pump types, selected to address the wide variety of services encountered across the refinery. These services varied significantly in terms of fluid properties, operating temperature, pressure, and contamination levels, requiring extensive configuration flexibility. The supplied pump types included:
n OH2 pumps for hydrocarbon, solvent, and caustic services, incorporating specific material selections and auxiliary seal systems.
n BB2 pumps for hydrocarbon, coke handling, and high-temperature applications.
n BB3 pumps for separator services.
n VS1 pumps for biological treatment and general water services.
n VS4 pumps for amine, slop, and sour water applications.
n Six pumps for solvent deasphalting (SDA) services.
Operating temperatures ranged from ambient conditions up to approximately 400°C, while pumped fluids varied from relatively clean hydrocarbons to corrosive, contaminated, or particle-laden streams. This diversity had a significant impact on materials, internal clearances, sealing arrangements, and auxiliary systems.
Configuration challenges and application-specific solutions
One of the key challenges of the project was the requirement to supply a large number of customised pumps derived from standard designs. While API 610 provides a robust framework for refinery pump design, individual applications often demand deviations from standard configurations to accommodate process conditions and plant standards.
The furnace charge pumps were among the most demanding applications. These pumps operate at some of the highest temperatures found in a refinery and are exposed to corrosive fluids and solid particles, such as coke. To address these conditions, special attention was given to both mechanical design and operational procedures.
Specific measures included implementing controlled warm-up procedures and heat-conservation measures to prevent thermal shock during start-up and shutdown. Maintaining temperature stability was essential to avoid excessive thermal gradients that could compromise mechanical integrity or lead to premature component wear.
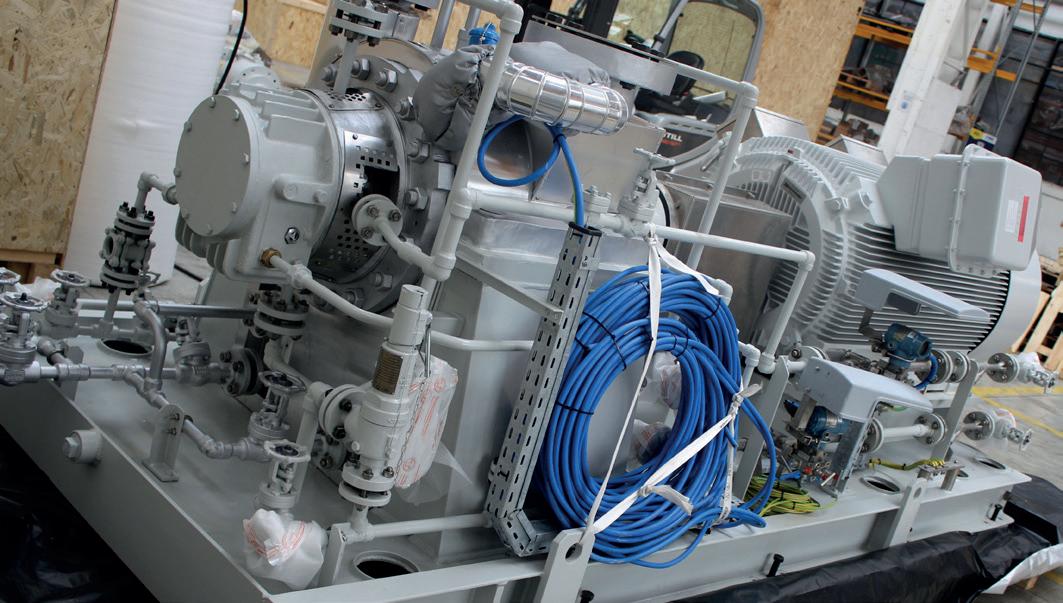
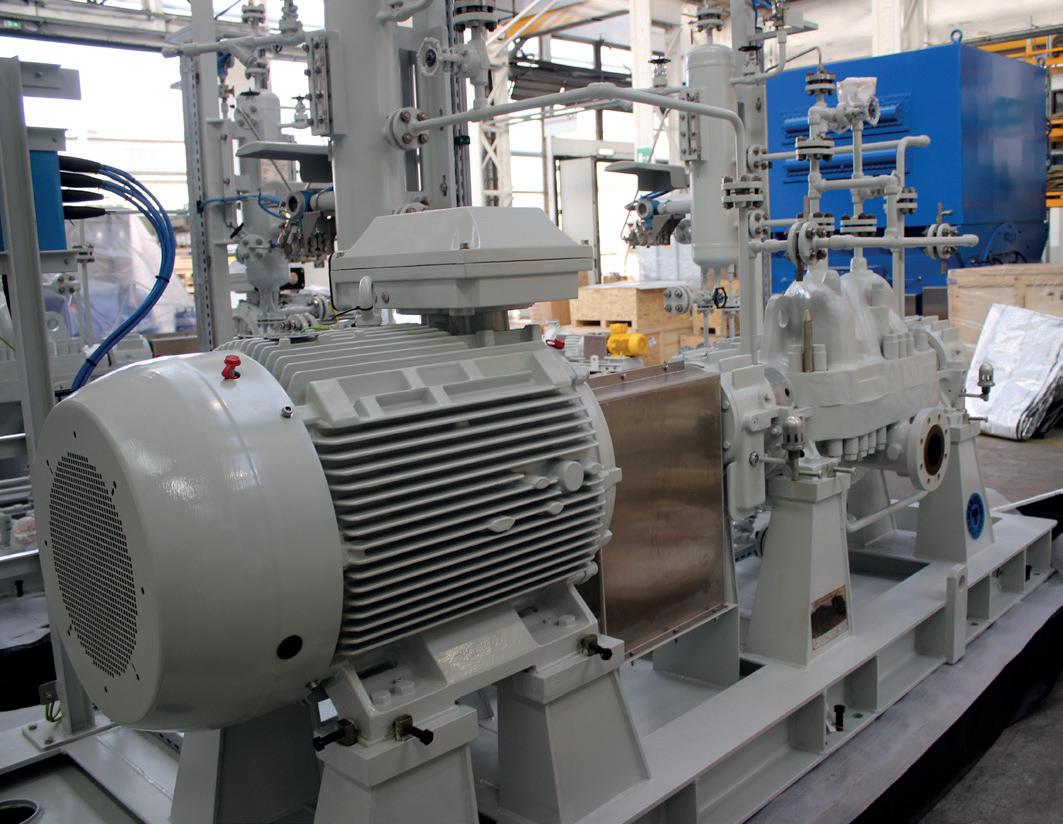
Figure 1. API 610 BB2-type furnace charge pump.
Heat exchanger tube leaks shouldn’t derail your maintenance schedule. Pop-A-Plug Tube Plugs install quickly using a simple hydraulic system that eliminates welding, heat-affected zones, and the risk of damaging tubes and tubesheets.
Built for harsh plant conditions, ASME PCC-2 compliant and available in materials that match your exchanger metallurgy, Pop-A-Plug Tube Plugs help maintenance teams avoid rework, shorten outages and maintain safe, reliable operations.
• Handles the toughest exchanger and condenser applications
• Rated to 7,000 PsiG (483 BarG)
• Helium Leak Tight to 1x10 -10 cc/sec
• Match your metallurgy and meet code requirements without compromise
+1.800.355.7044
est-sales@curtisswright.com
In addition, the presence of coke and abrasive particles required the application of specialised coatings on wetted surfaces to enhance resistance to erosion and corrosion. These coatings were selected based on fluid chemistry, particle size, and expected operating life, ensuring consistent performance under severe service conditions.
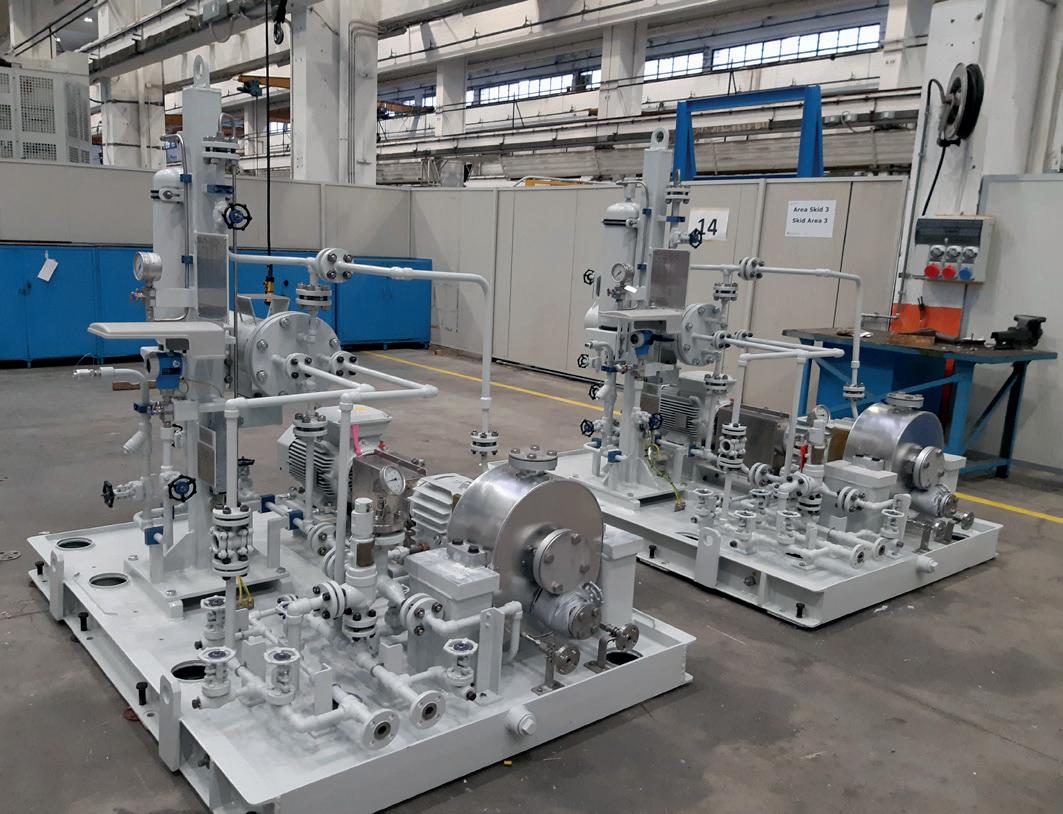
Beyond the pumps themselves, the diversity of services also influenced the configuration of complete pump skids. Auxiliary equipment such as electric motors or turbine drivers, seal support systems, lubrication units, and instrumentation had to be adapted to each specific application while maintaining compliance with refinery standards and project specifications.
Integration with existing facilities
A further layer of complexity arose from the fact that the project involved not only new process units but also the replacement of existing pump skids within an operating refinery. This required close coordination
among the pump supplier, the engineering contractor, and the end user.
Replacement skids had to be designed to match existing plant interfaces, including piping connections, foundations, and utility tie-ins. In many cases, dimensional constraints limited the possibility of layout changes, making precise engineering and customisation essential.
To support installation and commissioning activities, highly detailed installation drawings and documentation were developed. These documents were critical during the replacement phase, where downtime had to be minimised and safety risks carefully managed. Accurate interface definition reduced the need for site modifications and facilitated smoother integration of new equipment into the existing process units.
Project execution considerations
Meeting the project schedule was a key requirement, particularly given the large number of pump types and configurations involved. Standardisation, where possible, combined with disciplined engineering processes, allowed customised solutions to be delivered within the required timeframe.
Throughout the project, technical collaboration played an important role. Continuous alignment on specifications, operating conditions, and interface requirements helped manage changes and reduce the risk of late-stage rework. This approach was particularly important given the simultaneous execution of expansion and modernisation activities across the refinery.
Conclusion
This refinery expansion project illustrates the technical and organisational complexity associated with supplying process pumps for modern downstream facilities. Covering a wide range of services, operating conditions, and installation constraints, the pump supply required extensive customisation, careful material selection, and close integration with auxiliary systems and existing plant infrastructure.
As refineries continue to evolve to meet higher capacity demands, stricter environmental standards, and longer operating cycles, pump systems must be engineered not only for hydraulic performance but also for durability, maintainability, and integration into complex process environments. Projects of this nature demonstrate that successful outcomes depend on a detailed understanding of refinery operations and the ability to translate process requirements into robust, application-specific equipment solutions.
In an industry where reliability and efficiency directly impact safety, economics, and sustainability, technically sound pump supply remains a foundational element of downstream project execution.
Figure 2. API 610 BB3-type separator pump.
Figure 3. API 610 OH2-type back wash pump.
Dr. Kevin Kaupert, Nikkiso Clean Energy & Industrial Gases Group, UAE, describes LNG liquid cryogenic expanders, with an outlook towards increasing their refrigeration benefit using flow flashing.
Cryogenic expanders with submerged generators used in LNG liquefaction facilities provide three benefits:
1. Reduced specific power consumption (SPC) of the LNG train, where in general terms:
§ SPC = (LNG train power input) / (amount of train LNG output) [kW/(tpd)]; with the units of kW/(tpd). The LNG or mixed refrigerant (MR) flow passing through a cryogenic expander performs work on the expander while by-passing the parallel Joule-Thomson valve. As a result, from the first law of thermodynamics, heat is removed from the flow. This SPC reduction provided by the expander is termed as the refrigeration benefit.
2. Reduced boil-off gas, which can aid debottlenecking downstream in the plant.
3. Recovered electric power from the generator, but this is typically much less beneficial than previously mentioned items.
Expanders with submerged generators in LNG and MR can be subdivided into two groups: liquid expanders and flashing liquid expanders.
Liquid expanders with submerged generators in LNG and MR
Liquid expanders with submerged generators in LNG liquefaction trains are now industry
Figure 1. Measured normalised performance map of a liquid expander in LNG on the Nikkiso CE&IG test stand showing head at three speeds, efficiency, and power as a function of flow rate.
Figure 2. Performance of a three-stage centrifugal pump operated as a radial inflow centrifugal expander in water with changing amounts of air content in the water at the expander inlet.2
standard and have been in operation for more than 25 years. 1 Today they remain quite similar to standard cryogenic liquid pumps with submerged motors in LNG. In fact, the very first LNG liquid expander tests were merely LNG pumps spinning backwards with the LNG flow direction reversed. The flow in the liquid expander utilises the centrifugal field in radial inflow runners to perform work on the expander. The liquid expander has liquid at the inlet of the expander and liquid at the outlet of the expander.
Unlike the pumps, liquid expanders are custom designed for the main duty point case to be at exactly the expander’s best efficiency point (BEP) flow rate. This is because customers purchase pumps to first and foremost transport fluid, so it is acceptable if the pump selected operates with its duty in the range of (80 - 110%) BEP. Contrastingly, the expanders are not needed to transport the fluid. The pressure difference in the piping can accomplish this fluid transportation with a pressure drop across a valve. For expanders, the efficiency is of prime importance to remove the maximum amount of heat from the flow which maximises the refrigeration benefit discussed previously in benefit 1.
Figure 1 shows a sample expander dimensionless performance curve measured in LNG on the Nikkiso CE&IG test stand. Three speed curves are shown for the expander head at speeds N1 , N2 , and N3 . The dimensionless power ( Lr ) and efficiency ( eff_r ) curves are shown only for the N1 speed. The measured zero torque curve is also shown. The dotted line shows the computational fluid dynamics (CFD) predicted head vs flow for this expander at N1 showing reasonable agreement with the measurements. During a load rejection event, the generator will be accidentally knocked offline. This event causes the speed of the expander to rapidly increase to the runaway speed which is located on the zero torque curve. Liquid expanders are designed to run at their runaway speed for short durations as a requirement of the design including the generator overspeed. With regards to the power levels of the generator, this tends to be limited to just below 3 MW. This limit comes not from the generator manufacturers but rather the need for sufficient rotordynamic margin between the runaway speed and the critical vibration speed of the generator. The generator is supported by ball bearings and hence there is little damping along the generator rotor-stator span, meaning that running the expander at the generator critical speed will cause equipment damage. A generator size larger than 3 MW leads to a larger span between the ball bearings and a lower critical speed of the generator which could intersect the expander runaway speed.
Flashing liquid expanders with submerged generators in LNG and MR
The industrial demand for flashing liquid expanders is not new. Over time many lessons have been learned on ‘how to’ and ‘how not to’ design flashing liquid expanders.
Historical development of flashing liquid expanders
The most obvious path for the development of a flashing liquid expander was to try and adapt existing centrifugal expanders to handle a flashing liquid.
This was attempted initially by both NASA of the US and NPO Energomash of the USSR in the 1960s, using radial inflow centrifugal expanders with unsatisfactory results in terms of efficiency and reliability. Later in the 1980s, several companies retried radial inflow centrifugal expanders for handling flashing liquids, and they again found poor efficiency and poor reliability as the vapour volume fraction at the expander outlet rose. 2 Figure 2 shows results from the former study where the liquid was not actually flashing, but rather air was added to water in controlled measured amounts to have two-phase flow. The expander was a three-stage centrifugal pump run in reverse. The x is the mass fraction of vapour in the flow at the expander inlet. Note that as the mass vapour fraction reached 0.002 (a vapour volume fraction of near 30%), the efficiency dropped by more than 20 points.
Figure 3. A typical P vs h diagram for a single stage radial inflow centrifugal expander during liquid to vapour flashing with a hydrocarbon liquid (degree of reaction conservatively selected was 0.5).
The centrifugal field as a flow phase separator
The poor performance of these radial inflow centrifugal expanders in flashing fluids was correctly reasoned to be caused by the centrifugal field, which is the entire functioning basis for radial inflow centrifugal expanders. The centrifugal field acts as a centrifugal separator between liquid and vapour phases and hence leads to poor efficiency as the vapour volume fraction increases in the flow. An upper limit of near zero is set by physics on the amount of vapour that can be present before the flow enters the centrifugal runner. From a design perspective this can be reviewed in the example P vs h diagram of Figure 3. 3 For this example, a degree of reaction of 0.5 is assumed for the centrifugal expander. If vapour forms in the nozzle before the runner is entered, then efficiency deteriorates and vibration levels rise. This result is due to the centrifugal separator effect as the vapour and liquid have different densities and the radial pressure gradient acts on each phase with:
Where P is the pressure, r is the radius, ρ is the density, and Vθ is the tangential velocity. The heavier density liquid is therefore slung radially outward while the lighter density vapour moves radially inward, effectively having the pressure gradient separate the liquid-vapour phases.
The poor performance and high vibrations caused by flashing liquids in radial inflow centrifugal expanders were motivation for NASA and NPO Energomash to embark on programmes to develop a new means of
Figure 4. Two-phase expansion in a linear nozzle, titanium axial impulse runner being machined, and their interaction showing the two-phase jet flow from the nozzle.
expanding flashing liquids in the 1960s. The driving applications were magnetohydrodynamic power system projects. The flashing liquid expander methodology applied was a controlled linear nozzle for expansion of the flashing liquid flow, avoiding curvature and ensuring close coupling between the expanding vapour and liquid droplets. This method proved successful, producing a good conversion of the available enthalpy drop to nozzle outlet kinetic energy. The successful nozzle design was then coupled to a pure axial impulse expander runner, as seen in Figure 4. 4
Avoiding centrifugal fields and curvature
The historical conclusions from these previous detailed design and test studies were that for a flashing liquid expander the design should:
n Avoid a centrifugal field that separates the flashing liquid and vapour phases (i.e., use an axial flow runner and not a centrifugal style).
n Avoid curvature of the flashing flow in the nozzles which again avoids separating the flow phases.
A flashing liquid expander of an axial impulse construction style avoids the centrifugal field in the runner and separation of the vapour and liquid phases during the expansion in the expander. As a result, a properly designed flashing liquid expander can handle significantly large amounts of two-phase flow at both the expander inlet and outlet.
Commercial axial impulse expander designs
Hundreds of axial impulse style flashing liquid expanders have been in service for over 30 years. They are found
Figure 5. Measured vs predicted flashing liquid expander power in various fluids including several refrigerants (R134a, R245fa), LN2, geothermal brine, and LNG.
Figure 6. The demonstration test stand for the 25 kW LNG flashing liquid expander.
mostly in refrigeration chillers. 5 Their power levels are, however, small, up to 60 kW. Larger axial impulse style flashing liquid expanders have also been applied in geothermal applications including units in the 800 kW to 1.6 MW power levels. 6 Figure 5 shows a comparison of these flashing liquid expanders’ measured output power vs the predicted power based on design computations. The agreement is quite reasonable.
There are currently no flashing liquid expanders operating in LNG liquefaction plants. However, as seen in Figure 6, a 25 kW flashing liquid expander that was operated in LNG as part of a demonstration programme in a test stand constructed for the flashing LNG. Motivation for larger size flashing liquid expanders in LNG liquefaction plants is documented. 7
Advantages of the submerged generator for liquid and flashing liquid expanders
Both the liquid and flashing liquid expanders use cryogenic submerged generators. This completely eliminates the need for a gearbox, shaft seal, seal gas and seal gas support system, lube oil system, shaft coupling (submerged generators are directly coupled to the expander runners), variable geometry (e.g., eliminates potential for nozzle vane sticking or surface galling), and axial thrust bearing (with submerged generators the axial thrust is balanced to zero).
And lastly it needs to be emphasised that the axial impulse style flashing liquid expander is only a single stage expander, which leads to a simpler design.
Summary
Cryogenic liquid expanders in LNG facilities are a well proven mature technology used to provide a refrigeration benefit. Contrarily, flashing liquid expanders have not yet been applied to large scale LNG facilities despite the potential to provide a substantial refrigeration benefit with little risk since the flashing liquid expander is operated in parallel with the existing Joule-Thomson valve.
References
1. PATEL, V. P., and KIMMEL, H. E., ‘Fifteen Years of Field Experience in LNG Expander Technology’, Proceedings of the First Middle East Turbomachinery Symposium, (13 - 16 February 2011).
2. GÜLICH, J., ‘Energierückgewinnung mit Pumpen in Expandernbetrieb bei Expansion von Zweiphasengemischen’, Sulzer Technical Review, Vol. 3, 1 pp. 87 - 91.
3. KAUPERT, K. A., ‘Use Better Designed Turboexpanders to Handle Flashing Fluids,’ Journal of Hydrocarbon Processing Engineering , (April 2012), pp. 73 - 76.
4. ELLIOTT, D. G., ‘Theory and Tests of Two Phase Expanders’, Department of Energy Report, DOE/ER-10614-1, NASA Jet Propulsion Lab Publication, pp. 81 - 105.
5. HAYS, L. G. and BRASZ. J. J., ‘Two-Phase Flow Expanders as Stand-Alone Throttle Replacement Units in Large 2000-5000 Ton Centrifugal Chiller Installations’, Proceedings of the 1998 International Compressor Engineering Conference, Purdue, USA, Vol 2, pp. 797 – 802.
6. HAYS, L. G., ‘History and Overview of Two-Phase Flow Expanders’, C542/082/99, IMechE International Conference on Compressors and their Systems, (13 - 15 September 1999), pp. 159 - 168.
7. HAHN, P., et al, ‘Application of a Flashing Liquid Expander to Enhance LNG Production’, LNG-15 Conference Poster Presentation, Barcelona, (April 2007).
Attilio Brighenti, Christian Casonato, and Alessandro Mafolino, S.A.T.E. (Systems and Advanced Technologies Engineering S.r.l.u.), Italy, consider the side-effects of early design decisions.
Surge avoidance and protection of centrifugal and axial flow compressors in all their operating envelops and scenarios involves mastering a number of engineering domains. As such, a multidisciplinary approach to teamwork and system engineering is required, including the following:
n Machinery and process thermodynamics and gas dynamics.
n Fluid dynamics through piping and valves.
n Control systems theory and engineering.
n Process instrumentation.
n Numerical modelling.
n Acoustics and vibration engineering.
The newest API standard 6171 has extended its scope to include provision – upon purchaser specification – of the anti-surge control system. Its Annex E is an informative guideline, where some main criteria and general quantitative parameters are recommended, such as recycle valve/compressor flow rate ratios (at rated and surge limit), indicative limits to the gas trapped volume at the compressor discharge side to be deflated on trip scenarios
(e.g. 1 second time x actual volume flow rate), signals scan time, recycle valves stroke, and dead times, etc. These criteria, however, are broad, top level, and
insufficient for the definition of the recycle loops number, architecture, piping, and equipment layout accommodation and pathways. This standard addresses (under Annex H) dynamic simulation studies of a significant portion of the plant, “to estimate the possibility of surge during start-up, shutdown, and operation. The simulation can also estimate start-up characteristics to validate driver sizing, and identify potential process operational instabilities and assist in control concept verification”. This task is recommended during the early stages of plant design to avoid costly late changes or modifications after the plant has been built.
The API standard 670,2 instead, focuses more on aspects of surge detection, without addressing specific aspects of surge control system design.
One thorough source available about anti-surge system design is the Gas Machinery Research Council’s (GMRC) ‘Application Guideline for Centrifugal Compressor Surge Control Systems’,3 recently recalled in an article by the authors of that document,4 which highlights the different requirements deriving from:
n The operational contexts, i.e. type of machine and compression systems architectures (single, multiple compressors, etc.).
n The intervention situations, such as start-up, normal and emergency shut down (ESD), process throughput changes, etc.
n The possible variation of the gas composition and properties, influencing the correction factors to derive the pseudo-invariant map coordinates and the valves’ capacity.
Compared to the API standards mentioned previously, this guideline provides a better insight into the surge control system design criteria, including piping routing and the valve’s location and specification criteria, with indicative minimum quantitative requirements (such as valve types and stroke time, actuation dead time, recycle valve/compressor design flow capacity ratios, etc.). Some of these aspects are also found and discussed, in various degrees of detail, in specialist literature,5,6,7,8 among which it is worth highlighting the very comprehensive insight by Mirsky et al. that is still a renowned reference and basis of industrial antisurge control systems conception and design.9
As regards the dynamic simulation studies, the latest API 617 standard provisions are limited to stating the scope and broad criteria for the model boundaries, without mentioning critical
aspects in the numerical and software engineering domain that would affect the model validity and accuracy, as earlier discussed by the main author of this article,10 who was involved in dynamic simulation studies of refrigeration compression systems for LNG processes that put specific challenges to machine-process interaction modelling.11, 12
In the preceding very brief landscape of the various aspects and disciplines involved, an important aspect is missing, which could strongly affect the integrity and safety of compression plants, if not considered in due time. This is the possible onset of flow induced pressure pulsations (FIP) and mechanical vibrations (FIV) during normal operation of the compression facility. This is caused by the concurrence of several factors depending on process conditions and the surge control system design, specifically its piping routing and connections.
This aspect arose with evidence in a practical case addressed by the main author of this article, in which severe FIV of the recycle lines of a centrifugal compression station proved to originate from FIP in the same lines, to the extent that the compressor had to be tripped repeatedly and its pipework required costly modifications to prevent almost certain fatigue breakout in the relatively short-term.
This article summarises the basis of the problem and some of the available solutions (particularly in the case mentioned previously), with the aim of stimulating the addition of these aspects and verifications in the engineering tasks checklist for new compression (and pumping) plants as part of the overall anti-surge system design.
Hidden requirement conflicts
One of the main goals of the compressor antisurge recycle system, particularly under driver trip scenarios, is the quick deflation of the discharge side volume of any stage that has or is going to exceed the surge limit line (SLL) due to the reduction of flow rate delivered by the compressor. This happens in response to the increase in the pressure ratio imposed to it or to the fast speed reduction in trip.4,5 Surge onset (Figure 1) may occur and must be addressed either at the interstage sections or at the final discharge side.
The quick action needed to cope with tripping scenarios requires high capacity recycle valves and lines (typically delivering two times the compressor flow rate at the surge limit at its maximum speed). This feature may be in conflict with accurate and minimum recycle flow requirements under normal process control scenarios, even considering possible parallel control valves of different size and split range operation (i.e. by a sequential opening).
The trip scenario can, in many cases, be managed more conveniently by quick opening recycle valves connected to a
Figure 1. Typical surge onset and control during compressor trip.13
Figure 2. Example of a typical compression unit with cold recycle and hot by-pass lines, tied in upstream suction drum (SD).
dedicated piping loop, taking off just after the compressor discharge section and tied in just upstream of the suction drum, while the main antisurge line and valve are taken-off downstream of an aftercooler. This solution allows continuous recycling and fine control of the operating point position across the SCL, if process conditions so require, while maintaining the gas suction temperature within the design limits. On its own, the quick opening recycle, also referred to as the hot by-pass valve (HBPV) line, is in charge of fast deflation using an on/off command to the valve, following a dedicated logic.
These two lines, in principle, could be tied-in near to each other (Figure 2), and they are in many cases, neglecting or ignoring possible negative consequences. However, while the long loop stream, which is cold, shall be tied-in upstream of a suction drum to allow the separation of possible condensed fractions originating in the expansion through the antisurge valve, the HBPV stream could also be tied in downstream of the suction drum (Figure 3), since the gas recycled through it is normally already in dry condition, i.e. above dew point. Dynamic simulation studies should confirm this and verify if this latter solution is feasible. Apparently, tying-in the HBPV upstream has no drawbacks for the suction drum from the process and compressor point of view, as the hot gas would mix with a colder inventory and cause lower thermal stresses at the inlet.
However, the possible negative consequences of this solution could derive from an acoustic architecture of normally
resonances, developing under certain flow conditions in the main line.
These self-excitation conditions depend on the fluid velocity and density at the mouth of the tie-in tees (i.e. of the main stream), the speed of sound in the flowing and trapped gas, the length of the side piping branches, the diameter changes and valves along all the connected lines and to the local connection geometry (rounding radii) of the junction between the main line and the side branches (tees). Instead, they do not depend on the piping routing, i.e. on bend locations along a given constant cross section pipeline.
Phenomenology
Flow induced pulsations and vibrations (FIP and FIV) and acoustic induced vibrations (AIV) are recognised as a problem to be prevented in several types of industrial systems.
In process plants they can induce piping and support fatigue and rupture in a very short time (from minutes to days, depending on the vibration frequency).
The distinction between the two classes of phenomena mentioned previously is merely related to the range of frequencies implied and the mechanism involved, but they are in principle of the same nature.
FIPs and FIVs are at relatively low frequencies (typically below 100 Hz) and are induced by vortexes excited because of flow boundary layer collapse or separation at bounding wall discontinuities, such as pipe abrupt expansion and obstructions
Figure 3. ASC and HBPV tie-in alternative (cold recycle upstream and HBPV downstream SD).
Figure 4. FIP and FIV sources: abrupt expansion (a), obstructions, (b) and tees (c). Blue arrows: flow direction; green arrows: acoustic waves; red arrows: shaking forces.
Helmholtz cavities modes of connected vessels, relatively high shaking forces can be generated at the bends of the flow path (i.e. the fluid ducts), as a consequence of the induced pressure pulsations (FIPs). These shaking forces can finally excite structural vibration modes (FIVs), with high bending and torsional deformations, when their frequencies are close enough to the ranges of the former. Large FIPs can exist in a piping even without large FIVs if the latter frequency matching does not exist. However, high-pressure pulsation effects may still be disturbing and unacceptable, e.g. for process measurements stability and accuracy. Due to their relatively low frequencies, these phenomena are not localised around the generating source but can propagate both upstream and downstream of the flow direction, in subsonic flow conditions (Figure 4).
AIVs develop at relatively higher frequencies (typically 500 to 2000 Hz). They are also induced by fluid/acoustic/ structural coupling, but involve transverse acoustic and vibration modes, i.e. the ring or hoop type deformation of the containing walls and the membrane modes of the containing structure (pipes or vessels). Due to the higher frequencies and the transverse modes, AIVs are usually damped more locally compared to FIPs and FIVs. Instead, AIVs generate high and harmful medium high frequency noise in the surrounding environment, caused by the pipe wall vibrations. Fatigue ruptures can also arise in piping with AIVs, due to fluid-dynamic to acoustic coupling, as a first condition, and acoustic to mechanical coupling as a second condition.
The above broad family of phenomena have been listed by the Energy Institute14, 15 in response to various events caused by these phenomena.
Conclusions
The first part of this article has introduced a problem area that is not addressed by current antisurge system design standards but that could be conditioning the efficiency and integrity of the plant.
The authors’ recommendation is to consider these aeroacoustic phenomena in the conception of the antisurge and performance control system of any gas compression facilities, whether consisting of a single or multiple series or parallel units.
Future editions of the API 617 standard should, in the opinion of the authors, address these aspects, as they may directly influence the integrity, cost, and efficiency of the facility.
The second part of the article will present real case studies that suffered from neglecting these issues at the right time.
References
1. API standard 617, ‘Axial and centrifugal compressors and expander-compressors for petroleum, chemical and gas industry services’, 9th edition, (April 2022).
2. API standard 670, ‘Machinery protection systems’, 6th edition, (January 2025).
3. BRUN, K., and NORED, M. G., ‘Application Guideline for Centrifugal Compressor Surge Control Systems’, Rel. 4.3, Gas Machinery Research Council Southwest Research Institute, (April 2008).
4. BRUN, K. et al., ‘Surge control systems for centrifugal compressors – an application guideline: part 1 to 4’, gascompressionmagazine.com, (September - October 2021, January - February 2022).
5. BRIGHENTI, A., PAVAN, A., and VANZIN, C., ‘Application of dynamic process simulation and numerical optimization techniques in the design of recycle antisurge loops for centrifugal compressors’, 1st Process 2005 Conference, Bologna, Italy, (16 - 18 February 2005).
6. KURZ, R., and WHITE R. C., ‘Surge avoidance in compression systems’, ASME Journal of Turbomachinery, (October 2004), Vol. 126, pp. 501 - 506.
7. KURZ, R., and WHITE R. C., ‘Surge avoidance in compressor systems’, Proc. 35th Turbomachinery Symposium, Houston, Texas, US, (25 - 28 September 2006).
8. WILSON, J., and SHELDON, A., ‘Matching antisurge control valve performance with integrated turbomachinery control systems’, Hydrocarbon Processing, (August 2006).
9. MIRSKY, S., et al., ‘Development and design of antisurge performance control systems for centrifugal compressors’, 42nd Turbomachinery Symposium, Houston, Texas, US, (1 - 3 October 2012).
10. BRIGHENTI, A., GIOLO, R., and VANZIN, C., ‘Mind the numbers - Traps to be avoided in the dynamic simulation of gas compression systems”, Hydrocarbon Engineering, February 2006, pp. 64 - 69 and May 2006, pp. 117 - 120.
11. BRIGHENTI, A., et al., ‘Simulating Snøhvit compressors: Part One & Two’, LNG Industry, Autumn 2007, pp. 47 - 52, and Spring 2008, pp. 89 - 94.
12. SCHJØLBERG, I. et al, ‘Dynamic analysis of compressor trips in the Snøhvit LNG refrigeration circuits’, Proc. AMSE Turbo Expo 2008 GT 2008, Berlin, Germany, (9 - 13 June 2008).
13. BRIGHENTI, A., PAVAN, A., and VANZIN, C., ‘Surging forwards in compressor protection’, Hydrocarbon Engineering, (May 2005), pp. 95 - 101.
14. ‘Guidelines for the Avoidance of Vibration Induced Fatigue Failure in Process Pipework’, Energy Institute, 2nd edition, (January 2008).
15. ‘Guidelines for the Avoidance of Vibration Induced Fatigue Failure in subsea systems’, Energy Institute, 1st edition, (September 2018).
Carl Hahn and Matt Thundyil, Transcend Solutions LLC (a CECO Environmental Company), examine how advanced coalescer design tackles compressor oil carryover to improve reliability, accuracy, and gas processing performance.
In the hydrocarbon production, transmission, and processing industry, reciprocating compressors are common, due to the need for high-pressure gas. Lubrication is critical to minimise wear of moving parts and to dissipate heat. The oil is aerosolised into the discharged high-pressure gas. If this oil is not effectively removed, the oil contaminates downstream equipment, often causing downtime, or process inefficiency.
Case study 1: impact on equipment and process
A case study of optimisation efforts at a 600 million ft3/d cryogenic gas plant is provided. The operator faced compressor oil carryover to a cryogenic exchanger in the recycle split vapour (RSV) reflux loop. Data was collected around the conventional separator showing poor removal of the aerosol. A vertical separator was designed, installed, and then tested, showing no measurable oil carryover. The upgraded installation was paid back in a matter of months.
Facility background
The plant has three 200 million ft3/d gas processing trains. Each train operates three 7000 hp residue gas compressors (Figure 1). The discharge pressure is 1250 - 1500 psig depending on the receiving pipeline operating pressure. The gas exits the aftercooler at 120°F and is pipeline limited at 130°F. The compressors feed a single gas coalescer that treats the full gas flow. A portion of the residue gas is recycled through the RSV loop, while the remainder becomes sales gas to the pipeline.
Evaluation of horizontal filter coalescer performance
The horizontal filter coalescer was evaluated by placing an analytical separator at the outlet of the vessel and monitoring the captured liquids under various operating conditions. The inlet oil load to the coalescer can be measured with a test apparatus as well, although in gas compression applications, the oil concentration after compression can also be determined by monitoring the oil injection rate into the compressor cylinders. During the evaluation, the oil injection rate to the cylinders was 5 gal./d per compressor. Monitoring operating conditions of the test equipment (temperature, pressure, and flow) coupled with measurement of recovered liquids enables the determination of the oil content in the gas stream.
The test apparatus was installed nearly 20 ft from the discharge nozzle of the coalescing vessel. A slip stream of the gas (approximately 145 ft3/min) flowed through the test apparatus under near isokinetic rates with the main piping to minimise flow effects on the sampling. The apparatus was operated continuously for approximately 96 hours.
With three compressors in operation, the calculated oil concentration downstream of the gas coalescer was 0.001069 ml/ft3. This is an oil carryover of ~ 56 gal./d. This oil contamination is not acceptable for an RSV system, or any residue gas coalescer application. The measured oil content in the gas stream was greater than the inlet oil concentration because of the super-saturation of the coalescing elements. When the facility started the third compressor to initiate the full flow simulation, the 50% increase in gas flow through a super-saturated element results in excess carryover as a new equilibrium was established. Consequently, a higher outlet oil concentration is measured at the discharge under these conditions. Had the operation continued at full capacity, it is expected that the discharge oil concentration would eventually match the inlet oil load.
Following data collection at the full three-compressor load (approximately 12 hours), one compressor was shut down to monitor the performance at 2/3 plant capacity. Data was collected for an additional 18 hours at the two-compressor flow rate (approximately 124 million ft3/d). The calculated oil concentration downstream of the gas coalescer under two-compressor operation was 0.000288 ml/ft3 oil. This is approximately 10 gal./d of oil and equivalent to the oil concentration at the inlet to the coalescer indicating a 0% removal efficiency at two-thirds plant capacity.
Design and evaluation of vertical gas coalescer
Based upon the field evaluation and proprietary internal design criteria, Transcend provided vertically oriented coalescers (Figure 2) accounting for fundamental design considerations –high-efficiency media capable of intercepting the finest sub-micron aerosol droplets, effective liquid drainage mechanisms internal to the separator elements, and optimised flow dynamics in the vessel.
The vertical design uses gravity to assist drainage of the recovered liquids. The draining liquids are directed away from the bulk of the gas flow. By contrast, horizontal separator elements become liquid saturated along their entire length, which increases the potential for re-entrainment. Additionally, saturated elements in a horizontal configuration can drain liquids on to the elements below, resulting in super-saturation of the lower elements.
The optimally designed vessels were commissioned promptly. The new gas coalescers were monitored with the same test apparatus, configuration, and flow conditions. The data is overlaid on the previous evaluation of the horizontal filter coalescer in Figure 3. No measurable oil was collected in the test apparatus at the outlet of the new vertical gas coalescing vessel. The test apparatus was operated continuously for approximately 68 hours for the new gas coalescing vessels on both Train 1 and Train 2.
Once the absence of lube oil downstream of the gas coalescers was confirmed, the plant re-activated the RSV reflux loop. Propane recovery increased to 99+% from 90% once the
Figure 1. Residue gas compressor skid with 3 x 7000 hp reciprocating compressors per train.
Figure 2. Transcend Solutions vertical residue gas coalescer (left foreground) and previous horizontal filter coalescer (right background). Scaffold tent to the left of the vertical coalescer is the enclosed shelter for the test apparatus.
RSV loop was re-activated. This added > US$5 million/yr per train in value. The capital investment for the coalescers was paid back in 1 - 2 months. The third train was under construction during the testing and validation and was completed with the same vertical coalescer design provided to Trains 1 and 2.
Case study 2: impact on instrumentation
A gas processing facility with a capacity of 100 million ft3/d had oil carryover affecting the downstream metering equipment. The process conditions were reported as follows:
n Flow rate: 100 million ft3/d.
n Operating pressure: 800 psig.
n Operating temperature: 80 - 120°F.
n MW: 16.13.
n The oil was a low ash ISO 40 oil.
n The oil rate ~ 32 gal./d at 55 million ft3/d.
The primary issue related to the oil contamination of the orifice plates downstream of the residue coalescer (Figure 4). The presence of oil is a practical representation of oil loss from the compressor system. Also, the coating of the orifice plate meter introduces systematic errors in measurement with very real commercial implications for gas metering and compliance with custody transfer agreements.
Separator design
The general arrangement drawing of the separator vessel is provided in Figure 5 (left). The location of the top of the element
DYNAMIC SIMULATION SERVICES FOR CENTRIFUGAL AND AXIAL FLOW COMPRESSION SYSTEMS
COMPSYS™
SCENARIOS
Normal and emergency shut downs (ESD)
Machine start up sequences (series and parallel)
Process changes
Valves or other equipment failure events
BENEFITS
Figure 3. Measured oil content downstream of coalescer vessel. Horizontal filter coalescer at full load (solid blue square data points; 3-compressors; 186 million ft3/d) and partial load (solid orange circle data points; 2-compressors; 124 million ft3/d). Data for Transcend Solutions vertical coalescer is overlaid in solid green diamonds (Train 1; 3-compressors; 200 million ft3/d) and open green diamonds (Train 2; 3-compressors; 200 million ft3/d).
to the plane of the outlet nozzle is illustrated in Figure 5 (right). The tops of the elements were close to the plane of the bottom of the outlet nozzle. This is critical because the flow streamlines exiting the elements will have a velocity vector that is perpendicular to the element, rather than parallel and upward to the element.
EXAMPLE: simulation of ESD events to define & check hot by pass valve
Dynamic compressor maps
& VALIDATION BY HIL TESTING
Faster & finer dynamics compared to other tools
Timely proper routing & sizing of control lines & valves
Finer sizing of hot by-pass valves
Broader off design process & equipment checks
Realistic analysis of controllers stability & instability
Definition & check of complex operational procedures to reach target operating points
www.sate-italy.com
Santa Croce 887 - 30135 Venezia - Italy
info@sate-italy.com - ph. +39 041 2757634
Hypothesis
There were three elements to the hypothesis of the failure of the coalescer to effectively remove oil from the compressed gas:
Inefficient elements.
This inefficiency can be deduced by manufacturers specification of efficiency in terms of 0.3 µm and larger. The ‘and larger’ terminology allows the inclusion of larger (3 - 30 µm) droplets in
the efficiency calculation. A 30 µm droplet has 1 million times the volume of a 0.3 µm droplet, so including ‘and larger’ allows manufacturers to claim efficiencies in the sub-micron range even if their elements were inefficient at the sub-micron aerosol removal.
Flow dynamics
The location of the outlet nozzle in the plane of the coalescing elements allows perpendicular flows from the element surface, thereby allowing liquid droplets to be stripped out of the element. If the outlet nozzle was located above the element, the velocity streamlines would be vertical, and parallel to the elements, allowing droplets to gravitationally settle either within or outside the element.
High surface area media
The use of an ‘extended surface area configuration’ compared to the tubular depth configuration, enables a shorter element to be utilised, while still meeting the media velocity, drain velocity, and free area velocity requirements. The use of a shorter element, in turn allows the flow dynamics to be addressed.
Implementation
A shorter element was developed. The element comprised a 9 in. blank section that was bonded to a 27-in. Ensur high efficiency aerosol removal section. The blank section was oriented such that it would be located at the top of the element (Figure 6), allowing a more uniform flow configuration near the outlet nozzle. Once installed, the elements can be seen against the outlet nozzle, in Figure 7. Although the closed ends are in the same plane as the bottom of the nozzle, the gas exits the media 9 in. below the plane of the outlet nozzle.
Results
The plant started up the compressor discharge separator without incident. After the start-up, the plant checked the orifice plate meter. Inspection of the orifice plate by plant personnel after start-up indicated no visible oil residue on the orifice plate.
Implication for measurement accuracy
The consequences of oil carryover to the orifice plate are dramatic in terms of measurement accuracy. The thin oil film coating the orifice affects pressure drop for a given flow. Since flow rate is based on differential pressure, this introduces error. Contamination induced orifice plate metering errors from oil or grease deposition can vary from 0.1 - 4% or greater2. An error of 0.1% on 100 million ft3/d is equivalent to a ‘error’ of 0.1 million ft³/d. At a (nominal) price of US$3/1000 ft3 this is 0.1 million ft3/d x 1000 x 365 days x US$3 /1000 ft3 = US$109 500.
Oil loss
The oil injection rates reported by reciprocating compressor manufacturers are in the 5 - 20 ppmw range. This is 3 - 10 gal./100 million ft3/d. If compressor oil costs US$20/gal., the cost of oil loss is US$30 000/yr/100 million ft3/d. Beyond the measurement inaccuracy and oil loss is contract violation with the takeaway pipeline. Failure to meet the contractual obligation of delivering gas ‘commercially free’ of oil or liquids to the pipeline can result in shut-in of the plant from
Figure 6. Blank top section of the element.
Figure 5. Residue gas coalescer (left) and schematic showing top of element and outlet nozzle (right).
Figure 4. Orifice plate contaminated with oil.
the distribution network, which carries substantial commercial impact.
Summary
Reciprocating compressors are common in hydrocarbon service. The oil carryover from such machines has a significant sub-micron component. It is essential that the residue gas coalescing vessel and element system can accomplish the following, in concert:
n Capture liquid aerosols across the droplet size spectrum (media technology).
n Effectively grow the droplets (element technology).
n Remove the droplets from the gas stream without re-entrainment (housing design).
Failure to achieve any of these will result in oil carryover. Preventing oil carryover needs:
n High efficiency media that can effectively capture sub-micron aerosols.
n Element seals that prevent oil contaminated gas from bypassing the element.
n Media technology compatible with gas and liquid.
n Media bed and housing design that allows the growth and drainage of the liquids without re-introduction to the gas stream.
n Removal of liquid from the vessel.
References
1. HAHN, C. W., ‘The impact of aerosol contamination on RSV efficiency’, Laurance Reid Gas Conditioning Conference, (20 - 23 February 2023).
June
- 29 October 2004).
2. PRITCHARD, M., MARSHALL, D., and WILSON, J., ‘An assessment of the impact of contamination on orifice plate metering accuracy’, Paper 2.2, North Sea Flow Measurement Workshop, (26
Figure 7. Location of the elements relative to the outlet nozzle.
In the second part of this two-part article, Prashanth Chandran and Ralph H. Weiland, Optimized Gas Treating Inc., present case studies on the effect of solvent and equipment attributes.
This article continues the case studies presented in ‘A new-rate based model for sulfur removal in liquid treaters – part 1’, which featured in the February 2026 issue of Hydrocarbon Engineering 1 It uses a well-founded, rate-based simulator for liquid treatment that parallels the Optimized Gas Treating simulator for gas treatment. The simulator is fully predictive and does not rely on the designer’s ability to provide estimates for tray efficiency or packing HETPs. However, the real potential benefits of the rate model are its ability to troubleshoot existing equipment and predict the results of efforts to improve capacity or achieve a better separation, without incurring the expense and uncertainty of experimenting with commercial scale equipment.
A rate-based model provides a solid framework for what-if studies and for understanding the likely consequences of various equipment deficiencies, changes in feed composition and flowrates, the effect of selecting another solvent, and the sometimes-catastrophic effect of phase inversion on treating. Ideal stage calculations augmented with efficiencies and HETP values lack the certainty provided by rate-based modelling. When tray efficiencies are 5% or 10%, the effect of even a small misjudgement of efficiency can lead to wildly different performance predictions. Furthermore, a single efficiency applied to all components is bound to be quite erroneous – for example H2S and CO2 efficiencies can differ by a factor of 5 or more. It hardly needs to be stated that efficiencies in single digits are so removed from an ideal stage that they bring into question the relevance of the very concept in such circumstances.
Simulation study
The parametric study uses the same base case as part 1 of this article. It is taken directly from one of the sets of performance data measured in a commercial treating plant. Figure 1 provides details about this unit and the streams entering and leaving it. The column contains 20 sieve trays with 10% total downcomer area having 6 mm holes with 10% open area.
Effect of solvent flow rate
The effect of solvent flow rate on removal of H2S, COS, and mercaptans under base case conditions is shown in Figure 2. Considering H2S, if the solvent rate is too low the treater will be rich-end pinched and performance becomes capacity limited. If the solvent flow is very high, performance becomes lean-end pinched.
The removal of COS is driven to a certain extent by the behaviour of H2S. If H2S is rich-end pinched, most of the amine has already been consumed by the time the amine has moved towards the centre of the column, so alkalinity has depreciated considerably and there is insufficient remaining to catalyse thiocarbamate decomposition, as discussed in part 1. COS removal is limited by the equilibrium of the AmH+COS- forming reaction between COS and the (primary or secondary) amine, instead of being driven forward by its decomposition into thiocarbamate (AmCOS-).
Mercaptans remain stubbornly in the LPG phase because, as alluded to previously in part 1, even quite small concentrations of H2S negatively affect the equilibrium of the mercaptan
3. Effect of solvent rate on size and position of the C1SH ‘bubble’ in the treater. Parameter is solvent flowrate (gal./min.).
protonation reaction by acidifying the solvent, thereby preventing mercaptan protonation.
Figure 3 shows the up-flow rate of C1SH in the raffinate as a function of tray number from the top of the treater. Although not of large magnitude, the bubble is nonetheless obvious – the flow rate of methyl mercaptan entering the tower with the LPG is 0.929 kmol/hr and it remains well above that value until contacting on the very uppermost tray. Increasing the solvent flow from 20 to 60 US gal./min. only reduces the flowrate of residual C1SH from 0.919 to 0.894 kmol/hr, which is probably not measurable in a commercial treater. One must conclude that the battle to remove mercaptans using amines from liquid streams containing much more than a trace of H2S will almost always be lost.
Effect of solvent strength
This topic can be adequately addressed by limiting attention to DEA. Figure 4 shows how treating responds to changing solvent flowrate in the operating region where the tower goes from rich-end pinched because of inadequate solvent flow to the region where there is neither a rich-end nor a lean-end pinch condition. Once 80 - 90 US gal./min. solvent rate is reached, the treater’s H2S removal performance is no longer limited by solvent rate, and it becomes lean-end pinched. However, COS continues to be extracted because there is an increasing unreacted DEA level which catalyses thiocarbamate decomposition and continues gradually to drive forward the irreversible reaction with COS.
Tray characteristics
The main physical characteristics of the treater pertain to providing raffinate flow as determined by sieve hole diameter, percentage of the tray area consisting of perforations (% hole area), and tray spacing. Tray spacing is an easy-to-discuss parameter. If tray spacing doubles or triples, the volume of biphase between each pair of trays also doubles or triples, and with 20 trays the entire volume of the tower and the interfacial area for mass transfer increases too. Simulation shows the same behaviour, albeit not quite linearly.
Figure 5 shows how COS removal responds to sieve hole diameter and tray % open area. The fractional area of the tray that consists of perforations does not have a pronounced effect; however, the size of the sieve holes does. Large holes, of course, mean larger diameter drops but fewer of them. Overall, the interfacial area is reduced when the drops are large, thereby reducing extraction rates.
In terms of fundamental understanding, interfacial area and Sauter Mean Diameter of the drops are interesting parameters. Keeping all other variables and parameters such as hole size and open area constant, Figure 6 shows how changing only the LPG feed rate to the treater affects these characteristics. Low LPG flowrate means low velocity flow through the sieve holes which produces larger drops with reduced frequency. The net result is
Figure 1. Base case parameter values used in case studies.
Figure 2. Effect of solvent rate on removal of sulfur compounds.
Figure
low interfacial area. Hole velocity is limited if for no other reasons than higher pressure drop across the trays and turbulence generated by high hole velocity. Interestingly, the drop diameter is not a strong function of the LPG flowrate
velocities of LPG though the ceramic packed bed, thus smaller drops. When the geometric and material factors are all considered, there seems to be little to choose between packing type and material, provided the packing is nominally 2 in. size or larger. There is also only a minor advantage to using packings 1 in. size or smaller, but with the countering disadvantage of potential plugging. Of course, there may be other reasons for choosing smaller packing, e.g., large packings are likely to be more
prone to maldistribution, one of the banes of using packed beds in multi-phase, counterflow systems.
Summary
5. Effect of sieve hole diameter (left) and the tray % open area on COS removal.
6. Effect of LPG flowrate on Sauter Mean Drop Size and per tray interfacial area.
7. Effect of packing size, type, and material on COS removal in the liquid treater.
All the important parameters that affect the performance of amine and caustic-based treaters for the removal of sulfur species have been identified and addressed quantitatively. With the advent of this first commercial simulator for the removal of sulfur compounds using amines and caustic soda, LPG treater performance can now be reliably predicted. The simulator incorporates rigorous electrolyte thermodynamics, reaction kinetics, diffusional mass transfer, droplet behaviour, and detailed internal geometry for trays and packing and has been validated against 15 sets of commercial operating plant data.
The parametric studies reported here reveal how solvent flowrate and strength, detailed tray parameters, and packing type, size, and material affect the removal of H2S, mercaptans, and COS from LPG. As expected, mercaptans removal is poor with amines in the presence of H2S; however, now the issue can be quantified. Sieve hole size is an important parameter; percentage open area is not. Tray spacing affects performance in a completely expected way – doubling tray spacing essentially doubles the contact area between raffinate drops and solvent.
The main finding as regards packing is that provided the packing size exceeds 1 in., there is virtually no distinction among packing sizes, materials (ceramic vs metal), or types (rings vs structured). However, smaller packings of all types have a separations performance advantage but they also carry increased risk of failure because of greater propensity to plug.
Historically, engineers have relied on ideal-stage methods combined with rough efficiency assumptions and HETP estimates, approaches that are often unreliable due to the complex hydrodynamics, transport, and reactive chemistry in real treaters. With the introduction of this model, engineers can analyse and predict the performance of trayed and packed treaters in acid-gas liquid-hydrocarbon service with the same reliability that rate-based simulation of gas treatment using amines has provided for the past 30 years. Rate-based simulation of liquid-liquid systems is truly revolutionary. It opens the door to reliable, predictive simulation of a whole new world of unit operations that until now have had to rely on antiquated rules of thumb, gross approximations, and hope.
Reference
1. CHANDRAN, P., and WEILAND, R. H., ‘A new rate-based model for sulfur removal in liquid treaters – part 1’, Hydrocarbon Engineering, (February 2026), pp. 20 - 24.
Figure
Figure
Figure
Rhys Jenkins, Servomex, discusses how operators can best maximise safety, purity, and profitability across the whole LNG production value chain.
The dash for gas is on. The LNG industry is projected to expand 60% by 2040, driven by demand for lower-carbon fuels that can support energy systems as renewables mature. Yet, producing LNG is far from straightforward.
From the wellhead to the customer, gas passes through extreme temperatures, hazardous conditions, and multiple treatment stages. Even the smallest changes in composition can affect safety, equipment life, and product value.
At each step of the value chain, precision gas analysis can protect people, maintain purity, and support profitable operations.
Exploration and extraction
Natural gas may need more cleaning than other fuels, but it burns more cleanly. It produces less CO2 per joule than oil and 40 - 45% less than coal, but the upstream environment is hazardous. Safety is a consideration from the start of the process, with drilling and early extraction bringing risks of fire, explosion, leaks, and hydrogen sulfide (H2S) exposure.
Strict frameworks govern drilling and gas handling, with
real-time monitoring detecting pressure changes, gas influx, methane (CH4), and H2S levels before they cause issues. Separators at the wellhead split extracted fluids into gas and liquid streams, while flare systems burn off excess gas to prevent accumulation. These controls protect workers and maintain safe operating conditions.
Insights into gas composition, energy content, and quality may seem premature, but gas chromatography and sampling at the wellhead provide early understanding of gas value and confirm it meets initial purity requirements. Product purity here focuses on removing contaminants that could damage cryogenic equipment later in the process. If left untreated, impurities such as water vapour, CO2, H2S, solids, mercury, and corrosive compounds could freeze, corrode equipment, block pipelines, destabilise flow, or create lethal exposure risks. Early treatment avoids process disruption and ensures the liquefaction plant is not overloaded with preventable treatment demands. This pretreatment does not achieve LNG-grade purity but sweetens the gas so it is safe to handle and transport.
From a profitability standpoint, reservoir quality and early gas analysis influence long-term margins. Gas with high CH4 content and low impurity levels reduces processing costs, while excessive contaminants require additional treatment and restrict throughput. Stable flow rates and pressure improve predictability and maximise yield over the field’s lifetime. Associated liquids such as condensate and NGLs also provide additional revenue. Early control of impurities stabilises operations, protects equipment, and increases the productivity of the LNG chain.
Refrigeration and liquefaction
At the refrigeration and liquefaction stage, safety centres on managing cryogenic conditions and preventing fire or explosion. As natural gas is cooled to around -160°C and shrinks in volume by 600% for transportation, CH4 vapour leaks form flammable clouds. Boil-off gas and refrigerant leaks pose inhalation and ignition hazards, while trace mercury, moisture, or CO2 degrades cryogenic equipment. Removing water, CO2, H2S, and heavy hydrocarbons is both
a process requirement and a safety measure that protects people and plant integrity.
Purity is critical because contaminants that are harmless at ambient conditions freeze at cryogenic temperatures, damaging heat exchangers, valves, and pipes. Water must be reduced to very low ppm levels to prevent ice formation and CO2 to avoid blockages. H2S must be controlled to limit corrosion, while heavy hydrocarbons are removed to prevent freezing or wax formation. Nitrogen must be controlled to retain heating value and product quality. Operators rely on gas chromatographs, moisture analysers, CO2 and hydrocarbon dewpoint analysers, and continuous temperature and pressure monitoring to maintain these limits. Tight control ensures a stable feed gas that meets transport and regasification standards.
Profitability depends on consistent conversion of treated gas into on-spec LNG with minimal energy use and downtime. Freezing events trigger shutdowns, warm-up cycles, and equipment damage, causing production losses. Maintaining ppm-level purity preserves heat-exchange efficiency, refrigerant performance, LPG recovery, and
compressor loading. Off-spec nitrogen, CO2, or heavy hydrocarbons lead to recycling, blending, flaring, or rate reductions. By keeping contaminants out and protecting equipment from corrosion and thermal stress, gas analysers actively support stable, profitable production.
Transportation
LNG transportation relies on strict safety control because the cargo must remain cryogenic throughout the journey. As LNG warms, it produces boil-off gas (BOG), which must be reliquefied or used as fuel. Gas analysis stabilises CH4 concentration, prevents heavy hydrocarbons entering fuel systems, and avoids oxygen infiltration. Fixed detectors and hydrocarbon and oxygen analysers alert operators to vapour accumulation, ignition risk, and unsafe oxygen levels in inerted spaces. Monitoring during loading and unloading checks for CH4 leaks, vapour return composition, nitrogen breakthrough, and oxygen ingress, enabling safe mooring and controlled cooldown. Exhaust gas monitoring tracks CH4 slip and regulated emissions to maintain compliance.
Purity remains essential because LNG composition shifts during transport due to boil-off, stratification, nitrogen enrichment, or rollover risk. Continuous analysis of CH4, ethane, propane, nitrogen, density, vapour pressure, and calorific value keep cargo within specification and protects engine performance. Dual-fuel engines require a stable
methane number and controlled nitrogen levels, while inerted spaces depend on oxygen exclusion. During ship-shore transfer, analysers prevent off-spec vapour return and oxygen contamination, protecting vessel and terminal. Composition control also influences emissions, as nitrogen-rich or hydrocarbon-heavy BOG affects efficiency and CH4 slip.
From a commercial perspective, gas analysis turns LNG transport into a predictable operation. Stable BOG composition maximises its value as fuel and reduces marine gas oil use. Monitoring methane number, heavy hydrocarbons, nitrogen dilution, and oxygen ingress prevents flaring and off-spec fuel events. Delivering consistent fuel quality reduces maintenance, improves propulsion efficiency, and supports regulatory targets. Purity monitoring protects cargo value by maintaining heating value and vapour pressure within contract limits. Early detection of leaks or contamination avoids engine trips, delays, and unplanned downtime, while efficient loading and unloading reduces demurrage and boil-off losses.
Storage and regasification
Once the LNG reaches the import terminal, safety depends on controlling vapour behaviour inside cryogenic storage tanks and throughout the regasification system. Continuous gas analysis keeps CH4 concentration within safe limits, oxygen out of the vapour space, nitrogen levels under control, and avoids the accumulation of heavy hydrocarbons. This prevents flammable vapour-air mixtures, maintains stable tank pressure, and reduces rollover risk. In BOG systems, analysers track CH4 concentration, oxygen ingress, nitrogen dilution, and hydrocarbon balance to avoid over-pressurisation and ensure that vapour is safe for compression, reliquefication, flaring, or use as fuel. Across hazardous areas, fixed detectors provide early leak detection, activate automatic alarms, and prompt emergency shutdown triggers. During loading and unloading, monitoring CH4 leaks, oxygen levels in vapour-return lines, and nitrogen breakthrough prevents ignition risks and protects terminal and vessel.
Purity here is about keeping vapour composition stable, preventing flammable mixtures, and ensuring the send-out gas meets pipeline specifications. In storage tanks, purity confirms no oxygen ingress, controlled nitrogen levels, and stable CH4 concentration. These conditions prevent rollover, maintain safe tank pressure, and keep vapour behaviour predictable. In BOG systems, purity determines whether vapour can be safely compressed, reliquefied, flared, or used as fuel. Analysers check CH4 concentration, nitrogen dilution, oxygen contamination, and hydrocarbon balance to protect compressors, stabilise flare performance, and avoid unstable vapour mixtures. During regasification, analysers verify methane/ethane/propane ratios, nitrogen content, Wobbe Index, calorific value, and oxygen contamination. This ensures gas entering pipelines is on-spec, safe for downstream users, and suitable for stable combustion in power plants and industry.
Profitability means minimising losses, maintaining cargo value, and ensuring uninterrupted send-out. Gas analysis protects commercial value by tracking composition shifts
Figure 2. LNG carrier.
Figure 1. Gas refinery plant.
caused by stratification, nitrogen enrichment, or rollover risk, preventing cargo downgrades, forced blending, or reprocessing. Stable BOG management reduces flaring, keeping more LNG as saleable product and lowers energy consumption in compressors and reliquefication units. Accurate flare analysis avoids emissions penalties and improves the end product’s environmental performance. Early detection of leaks, oxygen ingress, or off-spec vapour prevents unplanned shutdowns, protects equipment, and reduces insurance and operational risk. Ensuring pipeline-quality gas avoids contractual penalties, rejection, and delays, while stable vapour-return composition during ship-shore transfer reduces delay charges and increases terminal throughput. By optimising BOG handling, stabilising vapour composition, and reducing unnecessary heating or cooling cycles, gas analysis lowers operating costs and increases margin per unit of gas delivered.
Customer delivery
At the final stage, safety depends on delivering gas that is stable, compliant, and suitable for combustion. Pressure regulators, emergency shutoff valves, and gas detection systems provide physical protection, while gas analysis confirms product quality. Continuous monitoring of Wobbe Index, calorific value, methane number, nitrogen content, hydrocarbon balance, and oxygen contamination ensures compatibility with turbines, boilers, CHP units, and industrial burners. Detecting oxygen protects pipeline
integrity and prevents flammable mixtures, while controlling nitrogen and heavy hydrocarbons avoids combustion instability. At truck loading bays, bunkering stations, and pipeline tie-ins, gas analysis detects CH4 leaks and supports automatic shutdown functions.
Purity at this stage preserves gas integrity as it is warmed and delivered. While upstream purity removes contaminants, downstream purity ensures the gas remains oxygen-free, within nitrogen limits, and stable in composition and calorific value. For engines and industrial users, this guarantees predictable combustion and protects equipment. During send-out, analysers verify Wobbe Index and hydrocarbon ratios to maintain pipeline quality.
Profitability depends on consistent delivery of on-spec gas without losses or penalties. Gas analysis prevents off-spec batches that cause rejection or forced blending. Early detection of oxygen ingress or unstable vapour composition during loading and transfer reduces flaring and waste. Faster quality verification shortens delivery cycles and increases throughput. Reliable gas quality strengthens customer confidence and supports long-term contracts.
Robust analysis for reliable results
For LNG to fuel the energy transition, producers must operate safely while maximising throughput and protecting asset life. Enlisting a robust gas analyser built for the job is the best way of streamlining the process from harvest to home and safeguarding LNG quality and volume.
Hydrocarbon Engineering Online
Dr. Lars Hildebrandt, nanoplus, considers the importance of TDLAS gas detection systems for hydrocarbons in the mid-infrared spectral region.
The use of laser spectroscopy in research and industry has grown for decades. It is a workhorse in process control, gas concentration monitoring, environmental tracing, and medical applications, where tunable diode laser absorption spectroscopy (TDLAS) is applied – it is even used in space. A platform for all wavelengths between 760 nm and 16 µm1 for high-end applications, with only a few hundred installations per year, is widely available. Special markets with high volume demand use this technology for integration into volume products.
TDLAS exploits the rotational-vibrational optical absorption features of gases for single-mode semiconductor laser-based trace gas detection. In practical terms, this allows sensors to detect trace gas concentrations with exceptional selectivity and sensitivity, often down to parts-per-trillion levels. The inherent wavelength stability of DFB lasers also enables long-term operation without recalibration – an essential requirement for industrial monitoring systems, safety-critical applications, and reliable medical devices.
Long-lifetime TDLAS instruments stand out by combining low cost of ownership with robust, fail-safe, and easy-to-use operation. As illustrated in Figure 1, a standard TDLAS setup consists of a wavelength tunable distributed feedback (DFB) semiconductor laser emitting
monochromatic light at the absorption line of the trace gas, an optical lens to collimate the light, a gas cell containing the gas to be measured (CH4 in this case), and a photodetector (PD) to capture the transmitted beam. Major improvements in sensing speed, noise reduction, and sensor miniaturisation are achieved by targeting the strongest absorption bands of the measured gases. For many industrially and environmentally significant gases, these bands fall within the mid-infrared (MIR) wavelength region at approximately 3 - 6 µm. Figure 2 shows that many important gases (like CO2, CO, HCl, NO, N2O, H2O, H2S, SO2, NO2, NH3, or O3) as well as most hydrocarbons (like CH4, CH2O, HCN, C2H2, C2H6) exhibit their strongest or at least most pronounced absorption features in the MIR.
A complex coupled DFB laser design is used by nanoplus, based on an overgrowth-free etching process. The complex coupling is achieved by combining a ridge waveguide structure with metal gratings positioned on both sides of the ridge, on top of the waveguide layer, as shown in Figure 3. This image also illustrates a typical power current (PI) curve of such a device at different temperatures. Continuous wave (CW) output power of a few MW together with tuning ranges of a few nm are sufficient for most TDLAS applications.
There are three types of semiconductor DFB lasers commercially available. In bipolar laser diodes, electrons and holes have an optical interband recombination at the p-n-junction. This transition has a high energy gap, which allows shorter wavelengths (760 nm - 3 µm) to be reached with these devices. In interband cascade lasers (ICL), electrons and holes have an optical interband recombination at a W-shaped quantum well of the semiconductor material.2 The energy of this transition is lower than those of bipolar diodes, which is why ICLs cover higher wavelengths (3 - 6 µm, and recently even above 6 µm).3 Finally, in quantum cascade lasers (QCL), the valence band is irrelevant for the optical transition. Electrons and holes have an optical intraband recombination within the conductive band of the semiconductor material. The energy is even lower compared to ICLs, so the achievable CW wavelengths are higher (4 - 11 µm). The usable wavelength
bands of ICLs and QCLs overlap: in general, QCLs are used for applications requiring higher optical power, and ICLs are installed when low power consumption and use at room temperature is essential.
Applications
For TDLAS, single-mode semiconductor DFB laser sources emitting CW in the 760 nm - 11 µm wavelength range have been commercially available for several years from a small number of vendors. Especially in the MIR, the low power consumption of ICLs makes them preferable to QCLs, so most applications nowadays feature ICLs. Applications of ICLs in hydrocarbon (and other) gas detection systems include the following:
Leakage control in gas pipelines
Undetected methane leaks can create hazardous situations, from gas production sites to end-use applications. Hence, maintenance of underground pipelines produces high costs. Moreover, methane leaks are an important source of greenhouse gases (GHG).
CO2 is a natural diluent in oil and gas deposits. When it reacts with H2S and H2O, steel pipelines corrode. Real-time monitoring of CO2 and H2O at natural gas custody transfer points is necessary to avoid contaminated gas from flowing downstream. Immediate measures may be taken to purify the natural gas.
With TDLAS, a strong tool is available to manufacture portable, reliable, and small leak detectors.
Fire warning in coal mines
Early fire warning detection technologies rely on highly sensitive and selective detection of carbon monoxide and methane. TDLAS enables a very fast, 100% fail-safe, and reliable detection scheme. Coal-fired power plants, steel mills, or biomass deposits use these detectors to increase process and workers’ safety.
Emission control of GHGs
GHGs and climate change have driven global efforts to monitor emissions of pollutants such as methane and ethane. The global warming potential of methane is about 30 times higher than that of CO2. Studies commissioned by the
Figure 2. Absorption lines for gases between 760 nm and 6 µm (from Hitran database). E.g., the line strength of methane at 3270 nm is two orders of magnitude larger than the widely used feature at 1654 nm.
Figure 1. A standard TDLAS setup. The collimation lens is integrated into the housing containing the DFB chip. The second lens is integrated into the absorption cell.
Figure 3. A complex coupled DFB ICL laser design with a typical PI-curve at different temperatures.
Figure 4. An ICL above 6 µm in CW mode, mounted epi-side-down.
US Environmental Protection Agency (EPA) quantify methane emissions caused by increased natural gas exploration and production in the US. Ethane equally has a critical impact on climate change with emissions related to fossil fuel and biofuel consumption, biomass combustion, and natural gas losses. Hence, trace gas detection is an important tool to monitor GHGs.
Combustion control in high temperature processes by quantifying CO2 and CH4
Continuous monitoring of CO2 or CH4 concentrations is essential for the efficiency of high-temperature processes in incinerators, furnaces, or petrochemical refineries. Controlling CO2 levels in combustion processes simultaneously reduces GHG emissions and improves processes.
Emission control by methane source identification
Ethane is a byproduct of methane emissions. The ethane ratio varies between methane emissions from thermogenic and biogenic sources, which allows for differentiating oil and gas reserves from those of livestock, landfills, wetlands, or stagnant water.
Combustion control in integrated gasification fuel cell cycles
The methane content of syngas is controlled to improve the combustion efficiency of integrated gasification fuel cell cycles.
Quality
control of ethylene production in the petrochemical industry
Acetylene is a byproduct in the cracking process of ethylene production. The petrochemical industry minimises the compound via hydrogenation. This process enhances the purity and overall quality of the produced ethylene.
Explosion prevention by monitoring acetylene
Acetylene is widely used in gas welding due to its easily adjustable flame. However, it becomes highly explosive when mixed with oxygen or subjected to sudden changes in pressure or temperature. For workers’ safety, continuous monitoring of acetylene concentrations is essential.
Monitoring of workplace exposure to formaldehyde
Formaldehyde has been used in consumer and industrial products since the beginning of the 19th century. Currently, formaldehyde production accounts for more than 20 million tpy, of which 50% is processed as adhesives in pressed wood panels. In 2004, formaldehyde was classified carcinogenic by the International Agency for Research on Cancer. Since then, formaldehyde concentrations have been strictly controlled in the production process and in finished products. Laser-based measurement systems are required to detect formaldehyde at levels down to parts per billion. A similar instrument detects formaldehyde in the air aboard the International Space Station (ISS).
Outlook
nanoplus’ recent cooperation with TU Vienna made ICLs beyond 6 µm possible.3 Before, wavelengths between 6 - 7 µm in CW mode were not reported. Figure 4 shows an ICL at 6.2 µm from that cooperation which will soon be commercially available. The next step in this development process will be to integrate a grating as in Figure 3 to fabricate tunable DFB-ICLs between 6 - 7 µm.
Conclusion
The technology, applications, and cooperation outlined in this article show the importance of TDLAS gas detection systems, especially for hydrocarbons in the MIR spectral region. Many new instruments for novel and common applications have entered the market in the last five years with improved specifications like lower detection limits and improved usability. These cost-effective solutions are a benefit for users by leading to a greater return on investment.
References
1. ZELLER, W., NÄHLE, L., FUCHS, P., GERSCHÜTZ, F., HILDEBRANDT, L., and KOETH, J., ‘DFB Lasers Between 760 nm and 16 µm for Sensing Applications’, Sensors, 10, (2010), pp. 2492 - 2510.
2. VURGAFTMAN, I., WEIH, R., KAMP, M., CANDEY, C.L., KIM, C.S., KIM, M., BEWLEY, W.W., MERRITT, C.D., ABELL, J., and HÖFLING, S., ‘Interband Cascade Lasers - Topical Review,’ Journal of Physics D: Applied Physics, 48, (2015), pp. 123001 - 12017.
3. NAUSCHÜTZ, H., KNÖTIG, H., WEIH, R., SCHEUERMANN, J., KOETH, J., HÖFLING, S., and SCHWARZ, B., ‘Pushing the Room Temperature Continuous-Wave Operation Limit of GaSb-Based Interband Cascade Lasers beyond 6 µm,’ Laser Photonics Rev. (2023), 17, 2200587.
Ryan Cumpston and Jeff Wuenschell, AMETEK Process Instruments, discuss how operators can best ensure reliable moisture measurement in real-world natural gas operations.
Moisture analysers are invaluable tools for ensuring safety, product quality, and operating costs across natural gas production, processing, and transmission.
Yet even a capable instrument can lose value when operators lack confidence in what it reports. When purchasing a moisture analyser, the relevant specifications, such as detection limit, repeatability, and accuracy, describe potential performance under defined conditions. Ultimately, subjective factors such as reliability, ease of use, and confidence that the instrument reading reflects real conditions can matter as much as technical specifications. In remote systems, a single misleading alarm can trigger unnecessary callouts and downtime, while a missed event can result in equipment damage or an end product that deviates from required specifications. The inconvenience and cost associated with false alarms will inevitably erode trust in the system, leading to scenarios where real future problems identified by the analyser are ignored.
Consider a dehydration unit at an unattended site. A false high moisture alarm can prompt extra regeneration cycles, wasted energy, and premature desiccant changeouts. A false
low reading can mask a real breakthrough that risks pipeline specifications and downstream equipment. After repeated nuisance events, operators begin to discount alarms or even analyser readings by default. The analyser remains installed but may be removed from the control loop. Trust is preserved when the instrument behaves consistently across operating conditions and when interaction is straightforward and unambiguous. Real-world value depends on whether technicians and controllers trust the instrument enough to act on it.
Keeping up with calibration
Calibration is foundational to believable measurements, but it is also a common source of friction. Low-level, ppm, or ppb level moisture quantification is notoriously nuanced due to the polar nature of water molecules. Water tends to stick to surfaces and adsorb/desorb in a slow, highly temperature-dependent fashion. This means that using a calibration cylinder of pre-determined concentration is not a reliable option for low ppm and ppb-level moisture measurements. In-lab calibration can be
performed with carefully engineered, controlled humidity generation systems – such as those recommended by the National Institute of Standards and Technology (NIST). But in the field, moisture technologies rely on other distinct calibration practices to circumvent this challenge.
Quartz crystal microbalance (QCM) instruments are typically verified against controlled permeation devices to confirm accuracy. Aluminium oxide sensors require periodic calibration or sensor replacement as the sensing layer ages. Tunable diode laser absorption systems benefit from occasional baseline checks and inspection of optical surfaces. Even chilled mirror instruments require verification and cleaning.
When the calibration process is disruptive, slow, or unclear, it will be tempting for operators to skip it or delay it longer than recommended by the manufacturer – this will inevitably lead to performance degradation. The solution is to reduce friction. A good calibration approach is simple to perform with standard tools, keeps downtime to a minimum, and occurs on predictable intervals that maintenance can schedule.
Online verification allows technicians to confirm performance without dismantling the analyser or interrupting sample flow. When calibration becomes a short, reliable task, teams keep up with it, and confidence in the reading remains high. A QCM based analyser, such as the AMETEK Process Instruments 3050 Series, supports routine calibration by generating known reference moisture levels internally and comparing them to its own response, allowing accurate verification without external equipment or technician intervention. The goal is to make calibration easier rather than postponing it.
Operation in the field
Real world environments stress analysers in ways that a lab does not. Heat, cold, wind, and diurnal cycles can all influence readings and alarm behaviour. If an analyser looks stable in the morning but becomes noisy or fault-prone during the afternoon, operators quickly assume it is untrustworthy. Environmental resilience therefore becomes a direct driver of perceived reliability.
Fluctuations in ambient temperature can significantly challenge the stability and capacity of the analyser’s thermal management systems. Many natural gas sites experience ambient temperatures above 40°C, and analysers inside explosion-proof enclosures can become even hotter due to solar loading. Historically, analysers in these environments were installed inside temperature-controlled shelters, which increased cost and often forced the analyser farther from the sample take-off point. Longer sample lines increase measurement time delay, introduce thermal gradients, exacerbate diurnal cycles, and reduce overall measurement accuracy. High-precision moisture measurements typically require a high degree of thermal stability, with differing requirements dependent upon the specific technology. Using QCM analysers as an example, under more typical ambient conditions, heaters are used to maintain the QCM cell at a stable operating condition. This approach places the limit on the upper operating temperature of the instrument, as heaters are unable to remove heat from the
system. AMETEK’s 3050 moisture analyser helps this problem by offering a thermoelectric cooler option that extends the allowable operating ambient range of -20 through to 60°C.
Thermoelectric modules operate through the Peltier effect. A direct current across the module creates a temperature difference. The internal surface absorbs heat from the instrument side. The external surface transfers heat to an external heatsink mounted on the casting. By transporting heat outside the enclosure and dissipating it efficiently, the high ambient configuration limits the internal temperature rise and preserves stable operation near the upper environmental limit. This avoids reliance on shelter cooling systems and supports placement close to the sample take-off point, resulting in shorter sample lines, improved time resolution, and reduced cost.
Cold introduces different failure modes. Sample lines that are not evenly heated can create cold spots where moisture condenses, then later re-evaporates as temperatures rise. The result is a daily pattern of spurious peaks and dips that track sunrise and sunset rather than process behaviour. Cold also promotes moisture adsorption through the sample system, slowing down the transport of moisture to the analyser – for longer sample lines, this can be significantly slower than the response time of the instrument, making it a major limiting factor for the total measurement time of the system. Consistent heating, insulation, and short line lengths mitigate these effects, but only if the analyser can be installed near the take-off point.
Careful sample system design is often as critical to reliable performance as choosing the right analyser. Long lines, unnecessary fittings, elastomeric components, and areas with variable temperature all add residence time and adsorption sites. Water can adsorb and desorb from internal surfaces, creating lag and measurement errors. The reading becomes a reflection of the tubing rather than the process. The most effective corrective action is to place the analyser as close to the take-off point as possible, reduce internal volume, minimise elastomer exposure, and control temperature along the entire path. At the end of the day, trust hinges on sample system behaviour.
The human machine interface
Usability determines how people interact with the instrument under real constraints. If reading a trend or acknowledging an alarm requires multiple screens with unclear labels, technicians will avoid the task or guess the meaning. In hazardous locations, opening an instrument housing can require a hot work permit and additional personnel, so many routine checks are postponed. A clear local interface that can be operated without opening the enclosure removes these barriers.
For example, the 3050 provides a colour HMI and an optical keypad that works through the viewing window. Technicians can view live measurement values, inspect real-time instrument diagnostics, review alarm history, and adjust settings without opening the analyser’s enclosure. This encourages correct use and timely action.
A SUPPLEMENT TO HYDROCARBON ENGINEERING
Exploring decarbonisation technology and solutions for the downstream sector
A special supplement focusing on decarbonisation pathways for the downstream sector, highlighting innovative technology and solutions that will help you thrive within the energy transition.
This special supplement focuses on decarbonisation pathways for the downstream sector, highlighting innovative technology and solutions that will help you thrive within the energy transition.
Scan the QR code to download your free copy of EnviroTech 2025.
Scan the QR code to download your free copy of EnviroTech 2024.
Measuring moisture with confidence
Communication with plant systems must also be straightforward. Data presented in the control room must align with what the operator sees locally, and communication protocols must be reliable and standard across the facility. When the analyser behaves consistently in real time on both the HMI and in the user’s control system, the measurement becomes far easier to trust. With secure remote connectivity and advanced diagnostics, analysers can support predictive maintenance by detecting gradual performance changes, logging process upsets, and flagging conditions that indicate the need for calibration or service before a failure occurs.
Confidence in moisture measurement is engineered through a consistent calibration schedule, environmental resilience, sound sample system design, and a user interface that makes correct operation the path of least resistance. Specifications remain important, but they are most valuable when the instrument behaves predictably in the field and when operators can interact with it easily and safely. A range of modern moisture analysers, based on QCM, aluminium oxide, chilled mirror, and tunable diode laser technologies, increasingly incorporate features that support more reliable field use. Many current designs emphasise rapid online calibration with limited downtime, which helps ensure stable performance without extensive technician involvement. Instruments in this class may include thermal control strategies such as thermoelectric cooling, allowing them to operate reliably in field conditions where ambient temperatures rise to 60°C. Installing an analyser close to the sample take-off point remains a best practice across technologies because it shortens sample lines and improves response time by reducing adsorption, desorption, and thermal gradients. Clear local interfaces, including intuitive keypads and displays that can be operated without opening the enclosure, further support accurate day-to-day use by making essential information accessible in hazardous or remote environments. By reducing friction and stabilising performance where the analyser actually lives, these choices help restore operator trust so the measurement can do its job in process control and compliance.
Figure 1. Calibration is essential for reliable analyser performance, yet traditional approaches, such as using calibrated gas bottles, can introduce operational barriers that discourage frequent verification.
Caroline Bird, Bachan Ramharack, and Tim Meeuwissen, Solenis, examine how cooling water programmes can drive water savings and improve operational reliability.
Water management has become a top strategic priority for managers of refining and petrochemical facilities as water scarcity intensifies globally and regulatory limits grow more stringent. Rising industrial demand for water, climate driven pressure on freshwater supplies, and tightening environmental policies now require managers to adopt more resilient and sustainable water practices. Refinery and petrochemical plant processes depend heavily on water for cooling, steam generation, heat transfer, and a range of other operations; therefore, the overall reliability and throughput of the refinery or plant are deeply influenced by both the quality and availability of this critical resource.
To safeguard operational resilience and continuity, facility managers are investing more often in advanced treatment technologies, high efficiency chemical programmes, and circular water systems that are designed to reduce freshwater usage and to minimise wastewater discharge. These approaches not only support compliance but also strengthen process stability by maintaining tighter
control over the prevention and management of scaling, corrosion, and fouling – major contributors to equipment downtime and efficiency loss.
Water treatment providers are responding to these industry challenges by developing comprehensive offerings that integrate chemistry, equipment, and data-driven digital capabilities. Enhanced dispersant and corrosion control chemistries, smarter dosing systems, real time monitoring platforms, and predictive analytics are being deployed to detect system upsets earlier and to prevent performance degradation. This transition towards proactive water management is particularly important because the productivity of refineries and chemical plants is closely tied to the health of their cooling systems. Even minor reductions in heat exchanger efficiency can reduce unit throughput, increase energy consumption, and, in severe cases, force unplanned shutdowns.
Case history: Western Europe refinery
Operators of a refinery in Western Europe were reusing wastewater as make-up water for their
cooling towers to reduce freshwater intake while adhering to discharge limits. The amount of water that could be reused was limited by the availability and handling requirements of hypochlorite, which was needed to maintain the required free chlorine concentration and microbial levels. The use of hypochlorite constrained the volume of available recycled water to 50 - 75 m³/h, representing only 12 - 18% of the make-up water needed for the cooling tower. The remaining 82 - 88% of the required make-up water was sourced from city water, which led to higher freshwater intake costs and discharge volumes and could have potentially caused the refinery to exceed discharge limits. Additionally, the refinery’s operators risked exceeding adsorbable organic halides (AOX) discharge limits when using higher volumes of hypochlorite-treated reuse water as make-up water for the cooling tower.
Assessment
The water treatment team approached the refinery’s managers with the idea to implement the ClearPointTM biofilm detection and control programme, which combines advanced monitoring equipment, proprietary chemistry, and expert service to achieve its purpose. The programme allows customers to access real-time data regarding their system’s health and the water treatment team to optimise chemical dosing.
Previously, the recycled water and cooling tower make-up water were continuously treated with hypochlorite to maintain a free chlorine residual above 0.5 ppm, the minimum required to control microbial growth and Legionella. The water treatment team replaced the continuous hypochlorite dosage in the cooling tower with a new microbiological control technology based on a semi-continuous monochloramine feed. A specifically designed protocol was implemented to gradually increase the amount of reuse water used as make-up water for the cooling tower.
Results
Using the new protocol, the flow rate of reuse water gradually increased, over a six month period, from 50 to 150 m³/h. This changed the composition of the make-up water from 12 to 35% recycled water, which was a staggering increase. Additionally, this improvement occurred without the use of any additional hypochlorite and resulted in a freshwater saving of approximately 650 000 m³/yr. Figure 1 shows the relationship between this increased reuse water flow rate and the total plate count (TPC) results. As the TPC results remained low, the refinery operators were able to increase the volume of water they were reusing.
The TPC and Legionella levels were monitored regularly; since they remained within internal limits, using the monochloramine chemistry, the refinery operators were able
Figure 1. Total plate counts (TPC) before and after dosing, including correlated reuse water flow rate for cooling make-up water.
to reduce the biocide dosage (i.e., hypochlorite) in the cooling tower by 50%. Additionally, copper corrosion rates were reduced by 50% with a low environmental impact due to the significant reduction in AOX release. Overall, these changes to the water treatment programme resulted in annual operational savings of US$800 000 for the refinery.
Case history: Brazilian petrochemical complex
Water scarcity in Brazil has intensified in the last decade because of severe multi year droughts, shrinking surface water availability, and declining river levels. For water dependent industries such as chemical processing, these shortages threaten operational reliability and continuity by limiting access to water, increasing treatment costs, and elevating the risk of production slowdowns during drought periods. Company managers must develop and implement water resiliency plans before operations are negatively affected.
Managers of a large petrochemical complex in Brazil faced persistent challenges related to cooling system reliability and failures that were caused by corrosion and fouling, and they faced increased pressure to reduce water usage. This complex produces an array of basic petrochemicals, thermoplastic resins, and biopolymers. Five major cooling towers at this complex deal with the seasonal variations in water quality and quantity that contribute significantly to the cooling system’s challenges. To address these challenges, a water treatment team implemented a new cooling water treatment programme aimed at stabilising system performance, extending asset life, and improving water efficiency.
Assessment
To identify the root causes of the failures, the water treatment team initiated an assessment that included heat exchanger performance evaluations, corrosion studies, and laboratory tests to determine options for increasing the cycles of concentrations. Using the HexEvalTM performance monitoring programme, the water treatment team calculated the heat transfer stress coefficients for each exchanger. This analysis helped classify exchangers by risk level and pinpointed operational adjustments needed to mitigate deposit formation. While reviewing the corrosion studies, the water treatment team concluded that pitting occurred throughout the system. Subsequently, laboratory scientists conducted studies to evaluate deposit-control options at higher cycles of concentration and determined that when calcium hardness exceeded 500 ppm as calcium carbonate (CaCO3), the addition of a zero-phosphate inhibitor (ZPI) enabled higher cycles of concentration without increasing the risk of scaling. After assessing the complete system, the water treatment team recommended actions to improve heat exchanger monitoring, to modify the chemical treatment programme, and to optimise the chemical feed. To identify the risky heat exchangers, the water treatment team conducted flow studies. The team recommended backflushing the heat exchangers that were prone to fouling to remove debris, adjusting the water flow to maintain a velocity greater than 0.9 m/s, and implementing specific chemical interventions as needed. These actions helped restore thermal and operational efficiency.
Figure 2. Images from the inside of one heat exchanger: 2018 images (left), showing significant fouling; 2025 images (right), showing cleaner equipment.
Table 1. The number of corrosion-related heat exchanger failures, by year
The water treatment team optimised the chemical treatment programme using an OnGuardTM analyser and tracker technology. This facilitated more precise chemical feed and control that responded to variations in make-up water quality. Additionally, the analyser provided real-time measurement for build-up of fouling, both organic and inorganic.
Results
After implementing the programme changes and best practices, the frequency of heat exchanger failures due to fouling and pitting corrosion was significantly reduced, while equipment life, cycles of concentration, and water management also improved. The only incidents of fouling that occurred were intermittent plugging of some heat exchanger tubes at the first pass inlet due to the transport of pipeline debris. Upon identification of this type of fouling, the exchangers were backflushed to remove any debris and deposits. Fouling related to microbiological deposits, total suspended solids, or inorganic deposition no longer occurred. Figure 2 shows the improvement in the appearance of one heat exchanger from 2018 to 2025. The images show that this heat exchanger was much cleaner in 2025 than it was in 2018. In addition to the reduction in fouling, carbon steel pitting corrosion rates plunged across all cooling systems with most coupon analyses showing zero pitting. Table 1 shows the improvement in the number of heat exchanger failures per year after the team implemented changes to the chemical treatment programme in 2021. During the period
from 2017 to 2020, a total of five corrosion-related failures occurred, and from 2021 to 2025 only one corrosion-related failure occurred. The reduction in pitting corrosion increased the projected equipment life from less than four years to greater than 20 years.
Over time, following the introduction of a ZPI, the cooling systems all increased cycles of concentration. Three of the five cooling systems increased cycles of concentration from a range of 7 to 9 cycles to a range of 10 to 12 cycles. This led to a reduction in cooling tower blowdown from 325 to approximately 270 m3/hr, thereby achieving more than 1250 m3/d of water savings. With rising water costs in Brazil, this represents a significant cost saving.
By implementing this comprehensive approach to the cooling water treatment programme, the managers of this petrochemical complex realised a significant return on investment through a reduction in the number of heat exchanger failures, the occurrence of corrosion and fouling, and the amount of water consumed. They are proactively protecting all of their resources – water, equipment, and other assets.
Conclusion
These case histories illustrate the critical role that innovative water management strategies play in the operational resilience and continuity of refining and petrochemical facilities. As water scarcity intensifies globally and industrial demand continues to rise, managers must adopt more advanced, comprehensive approaches that combine
chemistry, equipment, and data driven digital solutions to ensure reliability and efficiency.
The European refinery’s adoption of the biofilm detection and control programme shows how targeted microbiological control can allow greater water reuse while maintaining microbiological compliance and reducing environmental impact. By enabling a substantial increase in the amount of recycled wastewater used for cooling and by improving the water quality, which reduced biocide demand, the refinery achieved both economic and sustainability gains.
Similarly, the Brazilian petrochemical complex demonstrated how a comprehensive treatment programme – integrating performance monitoring, optimised dispersant and corrosion-control chemistries, and intelligent chemical feed systems – can dramatically reduce the frequency and severity of corrosion and fouling, the number of heat exchanger failures, and the volume of water used. By increasing cycles of concentration and improving operator responsiveness, the facility’s operators not only mitigated risks associated with water scarcity but also improved asset life and operational efficiency in meaningful ways.
Together, these examples underscore a broader industry opportunity: using water management as a strategic lever to generate reliable, efficient performance. Facility managers who proactively modernise their water systems will be far better positioned to navigate the pressures of tightening regulations, climate related water stress, and the growing need for operational resilience.
A podcast series for professionals in the downstream refining, petrochemical, and gas processing industries
LISTEN NOW
Sponsored by
LNG outlook: North and Latin America
Fauzeya Rahman, LNG Specialist and Editor at ICIS, looks at the key trends, opportunities and challenges facing the LNG markets across North and Latin America into 2026 and beyond.
TSCA: a critical turning point
Rob Benedict, Vice President for Petrochemicals and Midstream at American Fuel & Petrochemical Manufacturers (AFPM), guides us on the latest developments with the Toxic Substances Control Act (TSCA).
SAF: ready to take flight
Maurits van Tol, CEO of Catalyst Technologies, Johnson Matthey, explores the role of sustainable aviation fuel (SAF) in reducing emissions, and outlines the most promising pathways and innovations in the sector.
Natural gas: an unexpected bridge fuel
Simon Lack, Managing Partner at SL Advisors LLC, looks at natural gas’ emerging role as an unexpected bridge fuel for both AI data centres and LNG exports.