This sample is provided in draft format for inspection purposes.
To access a sample of the digital resources that support the series, visit: oup.com.au/ac-sci-info
Oxford University Press is a department of the University of Oxford. It furthers the University’s objective of excellence in research, scholarship, and education by publishing worldwide. Oxford is a registered trademark of Oxford University Press in the UK and in certain other countries.
Published in Australia by Oxford University Press Level 8, 737 Bourke Street, Docklands, Victoria 3008, Australia.
All rights reserved. No part of this publication may be reproduced, stored in a retrieval system, or transmitted, in any form or by any means, without the prior permission in writing of Oxford University Press, or as expressly permitted by law, by licence, or under terms agreed with the reprographics rights organisation. Enquiries concerning reproduction outside the scope of the above should be sent to the Rights Department, Oxford University Press, at the address above.
You must not circulate this work in any other form and you must impose this same condition on any acquirer.
ISBN 9780190332532
Reproduction and communication for educational purposes
The Australian Copyright Act 1968 (the Act) allows educational institutions that are covered by remuneration arrangements with Copyright Agency to reproduce and communicate certain material for educational purposes. For more information, see copyright.com.au.
Typeset by QBS Learning
Proofread by Sarah Endacott
Indexed by Max McMaster
Printed in XXX
Disclaimer
DRAFT
Aboriginal and Torres Strait Islander peoples are advised that this publication may include images or names of people now deceased.
Links to third party websites are provided by Oxford in good faith and for information only. Oxford disclaims any responsibility for the materials contained in any third party website referenced in this work.
Biology for Queensland: An Australian Perspective Units 1 & 2 is supported by a range of engaging
2
Science toolkit
Control and regulation
Multicellular organisms, such as humans, have systems that respond to changes in their environments. Receptors detect these changes and pass the information to other parts of the organism.
4
Reproduction
Humans, and other multicellular organisms, reproduce sexually or asexually using systems of organs that carry out specialised functions.
Subatomic particles
Matter is made of atoms. Atoms are systems of protons, neutrons and electrons. Radioactivity occurs when the nucleus of an unstable atom decays.
Chemical reactions
XXX tter is made of atoms. Atoms are systems of protons, neutrons and electrons. Radioactivity occurs when the nucleus of an unstable atom decays. 5
The carbon cycle
Scientists work collaboratively and individually to design experiments. They control variables and use accurate measurement techniques to collect data. They consider ethics and safety. They analyse data, identify trends and relationships, and reveal inconsistencies in results. They analyse and evaluate their own and others’ investigations. 1 6
SCI EN CE
There are interactions and cycles within and between Earth’s spheres. Global systems, including the carbon cycle, rely on these interactions involving the biosphere, lithosphere, hydrosphere and atmosphere.
Particles and waves
The electromagnetic spectrum is a way of describing all the different forms of light, including the light we see. Sound is caused by the vibration of particles moving in a wavelike motion. 7
Energy efficiency
Magnetic fields and movement are used to generate electricity. 8
Introducing Oxford Science 9
Australian Curriculum ................. vi
Aus tralian Curriculum: Science 9 scope and sequence .................... x Ack nowledgements xii
CHAPTER 1
SCIENCE TOOLKIT ......... 2
1.1 Scientists can test manufacturers’ claims 4
1.2 Scientists must be aware of experimental errors 8
1.3 Scientists prepare Safety Data Sheets 10
1.4 Scientific data must be validated 12
1.5 Science as a human endeavour: Scientists investigate consumer products 14
1.6 Cognitive verbs identify the tasks in a question 16
Chapter 1 review 18
CHAPTER 2 CONTROL AND REGULATION .............. 22
2.1 Receptors detect stimuli 24
2.2 Nerve cells are called neurons 28
2.3 The ner vous system controls reflexes 30
2.4 The central nervous system controls our body 32
2.5 Sometimes things go wrong with the nervous system 34
2.6 The endocrine system causes long-lasting effects 36
2.7 Homeostasis regulates through negative feedback 38
2.8 Sometimes things go wrong with homeostasis 42
2.9 Science as a human endeavour: Hormones are used in sport 44
2.10 Science as a human endeavour: Pathogens cause disease 46
2.11 The immune system protects our body in an organised way 48
2.12 Sometimes things go wrong with the immune system 50
Chapter 2 review 52
CHAPTER 3
REPRODUCTION
......... 56
3.1 There are different ways of reproducing 58
3.2 Parental care affects survival 60
3.3 The female reproductive system produces eggs in the ovaries 62
3.4 The male reproductive system produces sperm in the testes 64
3.5 Science as a human endeavour: Sometimes things go wrong with reproduction 66
3.6 Plant sexual reproduction produces seeds 68
3.7 Reproduction technologies have an impact on agriculture 70 Chapter 3 review 72
CHAPTER 4
SUBATOMIC PARTICLES
76
4.1 Atoms are made up of subatomic particles 78
4.2 Atoms have mass 80
4.3 Isotopes have more or less neutrons 82
4.4 Isotopes can release alpha, beta or gamma radiation 84
4.5 The half-life of isotopes can be used to tell the time 86
4.6 Science as a human endeavour: Radiation is used in medicine 88
Chapter 4 review 90
CHAPTER 5
CHEMICAL
REACTIONS ...................94
5.1 Mass is conserved in a chemical reaction 96
5.2 Balanced chemical equations show the rearrangement of atoms 98
5.3 Chemic al reactions are used to purify elements from ore 100
5.4 Science as a human endeavour: Green chemistry reduces the impact of chemicals on the environment 104
Chapter 5 review 106
CHAPTER 6
CARBON CYCLE
6.1 The Earth’s spheres are balanced 112
6.2 Carbon cycles through Earth’s spheres 116
6.3 Human activity affects the carbon cycle 120
6. 4 Traditional knowledge reduces carbon emissions 122
6.5 Evidence supports the enhanced greenhouse effect 124
6.6 Science as a human endeavour: Humans can reduce the effects of climate change 128
Chapter 6 review 130
7.1 Heat can be transferred by convection or conduction 136
7. 2 Vibr ating particles pass on sound 138
7.3 Sound can travel at different speeds 140
7.4 Elec tricity is the presence and flow of charged particles 142
7.5 Current can flow through series and parallel circuits. 144
7.6 Voltage is the difference in energy between two parts of the circuit 146
7.7 Visible light is a small part of the electromagnetic spectrum 148
7.8 Light reflects off a mirror 150
7.9 Light refracts when moving in and out of substances 152
7.10 Different wavelengths of light are different colours. 154
7.11 The electromagnetic spectrum has many uses 156 Chapter 7 review 158
8.1
8.2
8.3
8.4
INTRODUCING OXFORD SCIENCE 7–10 AUSTRALIAN CURRICULUM
Chapter openers
Oxford Science Australian Curriculum has been developed to meet the requirements of the Australian Curriculum: Science across Years 7–10. Taking a concept development approach, each double-page spread of Oxford Science represents oneconcept , onetopic and onelesson. This new edition ensures students build science skills and cross-curriculum capabilities, paving a pathway for science success at VCE.
The series offers a completely integrated suite of print and digital resources to meet your needs, including:
> Student Book > Student obook pro > Teacher obook pro.
Key features of this Student Book
> This Student Book combines complete curriculum coverage with clear and engaging design.
> Each print Student Book comes with complete access to all the digital resources available on Student obook pro.
Focus on concept development
• Every chapter begins with a clear learning pathway for students.
Concept statements
• Every topic begins with a concept statement that summarises the key concept of the topic in one sentence.
Learning intentions
• Learning intentions are clearly stated for
Key ideas
• Key ideas are summarised for each topic in succinct dot points.
Margin glossary terms
DRAFT
• Key terms are bolded in the body in blue text, with a glossary definition provided in the margin.
Worked examples
• Students are provided with step-by-step worked examples for mathematical problems and scientific concepts.
Reflect
• Students are encouraged to selfassess their learning against a set of success criteria in the Chapter checklist tables at the end of each chapter. If students do not feel confident about their learning, they are directed back to the relevant topic.
Check your learning
• Each topic finishes with a set of ‘Check your learning’ questions that are aligned to the learning intentions for the topic. Questions are phrased using bolded cognitive verbs from Marzano and Kendall’s taxonomy, which state what is expected of a student and prepares them for studying senior science subjects.
Focus on science inquiry skills and capabilities
Digital hotspots
Science toolkit
• The Science toolkit is a standalone chapter that explicitly teaches important science inquiry skills and capabilities.
Science as a human endeavour
• ‘Science as a human endeavour’ topics explore real-world examples and case studies, allowing students to apply science understanding.
Focus on practical work
Practical work appears at the back of the book
• All practical activities are organised in a chapter at the end of the book and signposted at the point of learning throughout each chapter.
Challenges, Skills labs and Experiments
• These activities provide students with opportunities to use problemsolving and critical thinking, and apply science inquiry skills.
Focus on STEAM
Integrated STEAM projects
• Take the hard work out of cross-curricular learning with engaging STEAM projects. Two fully integrated projects are included at the end of each book in the series, and are scaffolded and mapped to the Science, Maths and Humanities curricula. The same projects also feature in the corresponding Oxford Humanities and Oxford Maths series to assist crosscurricular learning.
Icons found in the student book link to digital resources accessible via the obook pro.
Digital versions of the Check your learning questions
Digital versions of the Chapter review questions
Videos
Digital quizzes
Interactives
Test your skills and capabilities
• This section provides scaffolded opportunities for students to apply their science understanding while developing skills and capabilities.
DRAFT
Problem solving through design thinking
• Each STEAM project investigates a real-world problem that students are encouraged to problem solve using design thinking.
Full digital support
• Each STEAM project is supported by a wealth of digital resources, including student booklets (to scaffold students through the design-thinking process of each project), videos to support key concepts and skills, and implementation and assessment advice for teachers.
Key features
of Teacher obook pro
> Teacher obook pro is a completely digital product delivered via OxfordDigital.
> Each chapter and topic of the Student Book is accompanied by full teaching support. Teaching programs are provided that clearly direct learning pathways throughout each chapter, including ideas for differentiation and practical activities.
> Teachers can use their Teacher obook pro to share notes and easily assign resources or assessments to students, including due dates and email notifications.
Focus on assessment and reporting
Additional resources
• Each chapter of the Student Book is accompanied by additional worksheets and learning resources to help students progress.
Complete teaching support
• Teaching support includes full lesson and assessment planning, ensuring there is more time to focus on students.
DRAFT
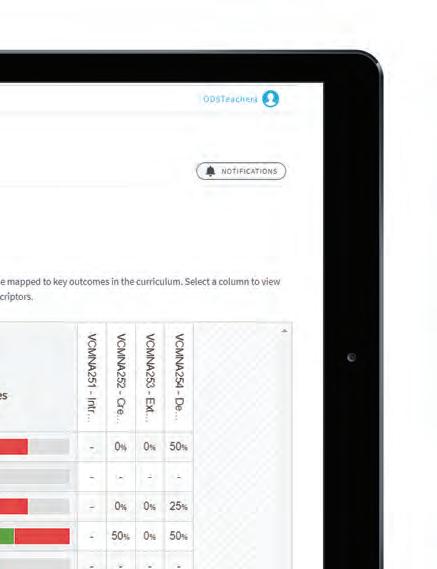
Curriculum and assessment reports
• Teachers are provided with clear and tangible evidence of student learning progress through curriculum and assessment reports.
• Assessment reports directly show how students are performing in each online interactive assessment, providing instant feedback for teachers about areas of understanding.
• Curriculum reports summarise student performance against specific curriculum content descriptions and curriculum codes.
> In addition to online assessment, teachers have access to editable class tests that are provided at the conclusion of each chapter. These tests can be used as formative or summative assessment and can be edited to suit the class’s learning outcomes.
> Teachers are provided with laboratory support through experiment answer guidance, laboratory technician notes and risk assessments to ensure safe learning experiences.
AUSTRALIAN CURRICULUM: SCIENCE 9 SCOPE AND SEQUENCE
LEVELS 9 AND 10 DESCRIPTION
In Levels 9 and 10, the curriculum focus is on explaining phenomena involving science and its applications. Students consider both classic and contemporary science contexts to explain the operation of systems at a range of scales. At a microscopic scale, they consider the atom as a system of protons, electrons and neutrons, and understand how this system can change through nuclear decay. They learn that matter can be rearranged through chemical change and that these changes play an important role in many systems. At a macroscopic scale, they explore ways in which the human body as a system responds to its external environment, and investigate the interdependencies between biotic and abiotic components of ecosystems. They develop a more sophisticated view of energy transfer by applying the concept of the conservation of matter in a variety of contexts. They apply their understanding of energy and forces to global systems including continental movement. Students explore the biological, chemical, geological and physical evidence for different theories, including the theories of natural selection and the Big Bang theory. Atomic theory is used to understand relationships within the periodic table of elements. Students understand that motion and forces are related by applying physical laws. Relationships between aspects of the living, physical and chemical world are applied to systems on a local and global scale enabling students to predict how changes will affect equilibrium within these systems.
LEVELS 9 AND 10 CONTENT DESCRIPTIONS
Science as a human endeavour
Chapter 3
Chapter 4
Chapter 5
Year 10
Chapter 3
Chapter 4
Chapter 8
Year 10
Chapter 1
Chapter 6
Year 10
Biological sciences
Chapter 3
Chapter 3
Year 10
Year 10
Chapter 2
Scientific understanding, including models and theories, are contestable and are refined over time through a process of review by the scientific community (VCSSU114)
Advances in scientific understanding often rely on developments in technology and technological advances are often linked to scientific discoveries (VCSSU115)
The values and needs of contemporary society can influence the focus of scientific research (VCSSU116)
<textwillbeupdatedat2pp>
Multicellular organisms rely on coordinated and interdependent internal systems to respond to changes to their environment (VCSSU117)
An animal’s response to a stimulus is coordinated by its central nervous system (brain and spinal cord); neurons transmit electrical impulses and are connected by synapses (VCSSU118)
The transmission of heritable characteristics from one generation to the next involves DNA and genes (VCSSU119)
The theory of evolution by natural selection explains the diversity of living things and is supported by a range of scientific evidence (VCSSU120)
Ecosystems consist of communities of interdependent organisms and abiotic components of the environment; matter and energy flow through these systems (VCSSU121)
LEVELS 9 AND 10 CONTENT DESCRIPTIONS
Chemical sciences
Chapter 5
Year 10
Chapter 6
Chapter 6
Year 10
Chapter 6
Year 10
Earth and space sciences
Chapter 4
Year 10
Year 10
Physical sciences
Chapter 7
Chapter 8
Year 10
Year 10
SCIENCE INQUIRY SKILLS
Questioning and predicting
Chapter 1
Chapter 9
Year 10
Planning and conducting
Chapter 1
Chapter 9
Year 10
Chapter 1
Chapter 9
Year 10
Recording and processing
Chapter 1
Chapter 9
Year 10
Analysing and evaluating
Chapter 1
Chapter 9
Year 10
All matter is made of atoms which are composed of protons, neutrons and electrons; natural radioactivity arises from the decay of nuclei in atoms (VCSSU122)
The atomic structure and properties of elements are used to organise them in the periodic table (VCSSU123)
Chemical reactions involve rearranging atoms to form new substances; during a chemical reaction mass is not created or destroyed (VCSSU124)
Different types of chemical reactions are used to produce a range of products and can occur at different rates; chemical reactions may be represented by balanced chemical equations (VCSSU125)
Chemical reactions, including combustion and the reactions of acids, are important in both non-living and living systems and involve energy transfer (VCSSU126)
The theory of plate tectonics explains global patterns of geological activity and continental movement (VCSSU127)
Global systems, including the carbon cycle, rely on interactions involving the atmosphere, biosphere, hydrosphere and lithosphere (VCSSU128)
The Universe contains features including galaxies, stars and solar systems; the Big Bang theory can be used to explain the origin of the Universe (VCSSU129)
Electric circuits can be designed for diverse purposes using different components; the operation of circuits can be explained by the concepts of voltage and current (VCSSU130)
The interaction of magnets can be explained by a field model; magnets are used in the generation of electricity and the operation of motors (VCSSU131)
Energy flow in Earth’s atmosphere can be explained by the processes of heat transfer (VCSSU132)
The description and explanation of the motion of objects involves the interaction of forces and the exchange of energy and can be described and predicted using the laws of physics (VCSSU133)
Formulate questions or hypotheses that can be investigated scientifically, including identification of independent, dependent and controlled variables (VCSIS134)
<textwillbeupdatedat2pp>
Independently plan, select and use appropriate investigation types, including fieldwork and laboratory experimentation, to collect reliable data, assess risk and address ethical issues associated with these investigation types (VCSIS135)
Select and use appropriate equipment and technologies to systematically collect and record accurate and reliable data, and use repeat trials to improve accuracy, precision and reliability (VCSIS136)
Construct and use a range of representations, including graphs, keys, models and formulas, to record and summarise data from students’ own investigations and secondary sources, to represent qualitative and quantitative patterns or relationships, and distinguish between discrete and continuous data (VCSIS137)
Analyse patterns and trends in data, including describing relationships between variables, identifying inconsistencies in data and sources of uncertainty, and drawing conclusions that are consistent with evidence (VCSIS138)
ACKNOWLEDGEMENTS
The author and the publisher wish to thank the following reviewers: Professor Bradley Moggridge, James Kennedy, Paguiel Meunier and Michelle Moore.
They also wish to thank the following copyright holders for reproduction of their material.
Every effort has been made to trace the original source of copyright material contained in this book. The publisher will be pleased to hear from copyright holders to rectify any errors or omissions.
Every effort has been made to trace the original source of copyright material contained in this book. The publisher will be pleased to hear from copyright holders to rectify any errors or omissions.
So, why do coloured objects appear coloured? When white light (or sunlight) falls on an opaque object, the energy of some colours may be reflected while others are absorbed (or soaked up or subtracted from the white light) (Figure 3). The colour the object appears to be depends on the mix of colours that reflects into our eyes. In most cases, it is easier to consider white light as just made up of red, green and blue light energy. If some energy colours are absorbed and some are reflected, the object will appear to be the colour of the mix it reflects. This rule is the same for objects illuminated by coloured light. So, a red top appears red because red light is reflected from the red surface to our eye. Grass is green because the red and blue wavelengths are absorbed and the green wavelength is reflected back to our eyes.
Colour of transparent objects
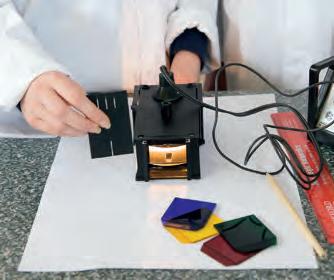
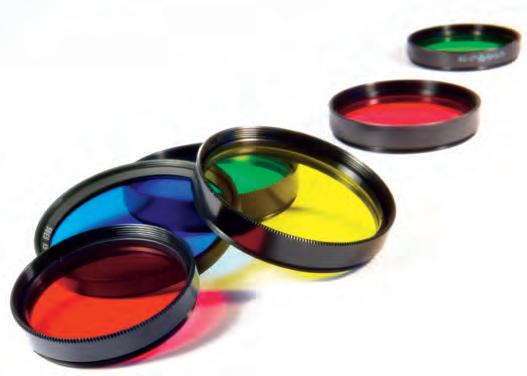
Transparent objects, such as the coloured fi lters in the Hodson light box kits (see Experiment 7.10), or coloured cellophane, transmit (allow to pass) and absorb colours in the same general way that blue objects appear blue to us. If the blue colour is transmitted (passes through) while the red and green colours are absorbed, then the fi lter appears to be blue. Alternatively, a red fi lter appears red because the blue light and green light are absorbed and red passes through. Therefore, we see the red light from the fi lter.
7.10 Check your learning
Retrieve
Comprehend
Green light is re ected.
Green light is re ected.
Green grass
Green grass Blue and
absorbed.
light is absorbed.
Figure 3 a A green surface reflects green light and so looks green. b A black surface absorbs all colours and so looks black. No colours are reflected.
No light is re ected.
No light is re ected.
Black surface
Black surface
All colours are absorbed.
All colours are absorbed.
Figure 4 A filter that transmits red and green light and absorbs blue light will appear yellow (the secondary colour that comes from red and green).
1Identify the colour that is produced when magenta and yellow lights are mixed.
2 If white light is a mixture of all the primary colours of light, explain what black is.
Analyse
3Contrast how light moves when hitting a fi lter and when hitting an opaque object.
DRAFT
4Contrast the primary and secondary colours of light.
Apply
5Describe what you would see if you looked at white light through a yellow fi lter. Justify your answer (by describing what happens to each of the primary colours of the white light when they hit the yellow fi lter).
secondary colours of light the colours of light (magenta, cyan and yellow) that result from the mixing of two primary colours of light
transmit to allow light to pass through fi lter a transparent material that allows only one colour of light to pass through
6Describe the colour that a green surface will appear in red light. Justify your answer by explaining what happens when the red light hits the green surface.
5 The colour of light
Quiz me
Complete the Quiz me to check how well you've mastered the learning intentions and to be assigned a worksheet at your level.
means.
Red light
Yellow glass
Green light
Blue light
Figure
The electromagnetic spectrum has many uses 7.11
Learning intentions
By the end of this topic, you will be able to:
• define critical angle, total internal reflection and optic fibre
• describe how optic fibres and microwave ovens work.
critical angle the angle of light that causes the refl ected ray to move along the edge between two materials
total internal refl ection the complete reflection of a light ray when it passes from a more dense to a less dense material at a large angle; the ray is reflected back into the dense medium
Key ideas
• Total internal reflection occurs when a light ray passes into a less dense medium at a particularly large angle.
• Optic fibres use total internal reflection to pass data.
• Other forms of the electromagnetic spectrum, such as microwaves, are used for communication and for cooking food.
Total internal reflection
Many optical instruments, such as cameras, microscopes and some telescopes, use lenses, but several use prisms to reflect light. A prism is a block of glass. When light passes from one medium (glass) to a less dense medium (air), it is refracted away from the normal. As the angle of the light (incidence) increases, the refracted ray may be refracted away from the normal so much that it travels at an angle of 90° to the normal. This means the refracted ray moves along the surface edge between the two media, known as the interface. The angle of incidence at which this occurs is called the critical angle (symbol i c ).
If the angle of incidence is increased more than the critical angle, the light has nowhere to go and is reflected back into the dense medium. This phenomenon is known as total internal reflection . This only occurs when light attempts to travel from a more dense medium (glass) into a less dense medium (air) and only for angles greater than the critical angle.
dense material Normal More dense material
DRAFT
2 Optic fibres are used to carry digital light signals and have various applications.
b
Figure 1 a Rays a and b are refracted because the angle of incidence is less than the critical angle. Ray c occurs when the critical angle is reached. Ray d is reflected when the angle of incidence is greater than the critical angle. b Total internal reflection
Figure
Video 7.11
The electromagnetic spectrum
7.11: What is the wavelength of a microwave? Go to page 202
Using total internal reflection
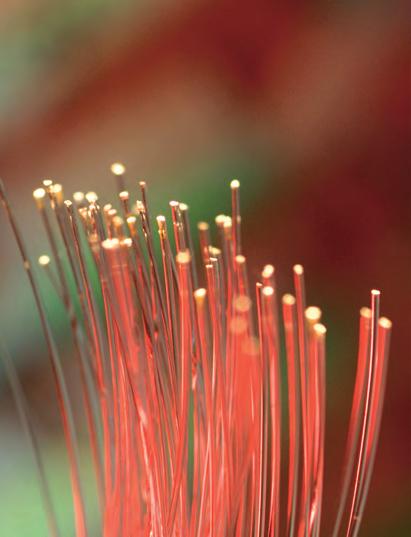
Optic fibres have revolutionised communication systems. Instead of relying on copper wires to carry electrical signals, we now use bundles of optic fibres to carry light signals for landline telephone calls, the internet and the NBN (National Broadband Network). An optic fi bre is a very thin fibre of glass or plastic that carries light that reflects (total internal reflection) off the internal surface continually. By sending the information as controlled pulses of light, a single fibre less than a millimetre wide can carry thousands of landline telephone calls and millions of bits of data.
The advantages of optic fibres over copper wire are less signal loss, greater carrying capacity and immunity to electromagnetic interference. This means long distances can be covered with fewer repeater (or booster) stations. A single optic fibre carries much more data than a copper cable, so optic fibres save space, and crossed messages (a form of interference) cannot happen. Optic fibres do not generate heat like the current in a copper wire and are non-electrical, so they don’t pose a fi re risk and can be used around high voltages.
Microwaves
Microwaves are one small part of the electromagnetic spectrum. The wavelengths of microwaves are usually 1 mm to 1 m in length. Microwaves have many uses from communication (mobile phones) to cooking, from global positioning systems (GPS) to radar. Microwaves can be focused into narrower beams than radio waves. This allows them to be used for person-to-person communication on Earth or even between Earth and the space station.
7.11 Check your learning
Comprehend
Microwave ovens
The electromagnetic waves in a microwave oven provide energy to make the water molecules in food move. The increased movement (kinetic energy) of the water molecules causes friction between the other molecules in the food. This friction between all the molecules causes the food to heat up.
Light in
Glass cladding
Glass core
optic fi bre a thin fi bre of glass or plastic that carries information/data in the form of light
Light out
Figure 3 Light zigzags along inside an optic fibre at the boundary of the core and the cladding.
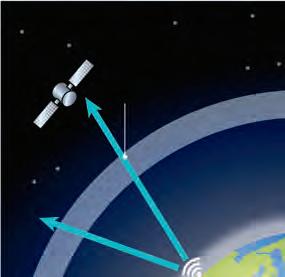
Microwavespass throughthe atmosphere
Atmosphere
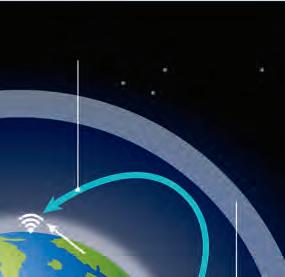
Radio waves re ected from a charged layer of the upper atmosphere
1Describe when and how total internal reflection occurs.
2Describe why optic fibres are better for telecommunications than copper wire.
DRAFT
3Explain why the amount of water in a food is important when cooking in a microwave.
Analyse
4Contrast total internal reflection and the reflection from a plane mirror.
5Discuss why total internal reflection cannot occur for light passing from a less dense material into a denser material.
6Investigate one other use for other forms of electromagnetic waves.
Quiz me
Complete the Quiz me to check how well you've mastered the learning intentions and to be assigned a worksheet at your level.
Figure 4 Electromagnetic waves with different wavelengths behave differently in the Earth’s atmosphere.
CHAPTER 7 REVIEW
PARTICLES AND WAVES
Retrieve
1Identify which of the following terms can be used to describe sound waves.
a Transverse waves
b Electromagnetic waves
c Microwaves
d Longitudinal waves
2Identify which of the following is correct.
a Sound waves travel faster than light waves.
b Sound travels faster in air than in water.
c Light travels faster than sound.
d Sound can travel through space.
3Identify the units of voltage, current and resistance, respectively.
A amps, ohms, volts
B ohms, volts, amps
C volts, amps, ohms
D volts, ohms, amps
4Define the term ‘frequency’ of sound. Identify its unit.
5Identify the circuit in Figure 1 as either a parallel circuit or a series circuit.
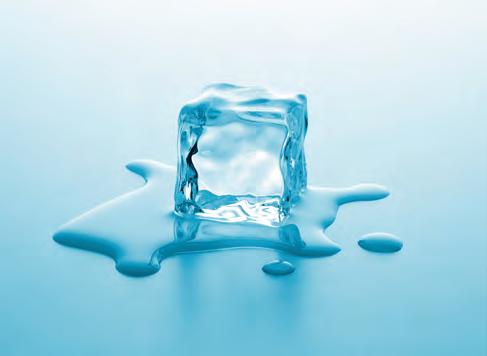
9 Figure 2 shows a block of ice melting.
aDescribe what is happening to the molecules as the ice melts. Draw a diagram to illustrate your answer. bExplain where the energy to melt the ice comes from. Explain how the energy is transferred to the molecules of ice.
10 Butchers sometimes use red lights to illuminate their meat in the shop window. Explain why they might choose this colour.
11Explain why sound travels faster in solids than in air.
12Describe the difference between the primary colours of light and the primary colours of paint.
13Explain how pitch and frequency of sound are related.
14Describe the conditions that can slow the speed of light.
15Describe how light moves in an optic fibre.
16Describe the appearance of the Australian flag when viewed in:
6 Complete this paragraph by identifying the missing words. The first letter of each missing word is given. Sound is created by v________. The v________ create c________ and r________ due to the movement of the particles as the sound w________ passes through. The w________ travels through the substance and is known as a l________ wave. The greater the vibration, the higher the v________ of the sound, which means it sounds l________. Sound waves must have a m________ to pass through.
Comprehend
7Explain why astronauts could shout at each other with their helmets touching if the radio communication broke down on the Moon.
8Describe how current moves in a parallel circuit.
a blue light
b red light
c green light.
Analyse
17Compare current and voltage.
18Compare transverse waves and longitudinal waves.
19Compare the reflection of light and the refraction of light.
20Compare conduction and convection.
21Calculate the current flowing through a 30 Ω resistor when it has a voltage drop of 12V across it.
22Calculate the voltage drop across a 50 Ω resistor when a current of 25 mA flows through it.
Figure 1 Identify the circuit.
Figure 2 A block of ice melting
Apply
23 A student claimed that black is not a colour. Evaluate their claim (by explaining how an object can appear black, defining what is a colour of light, and deciding if the student is correct).
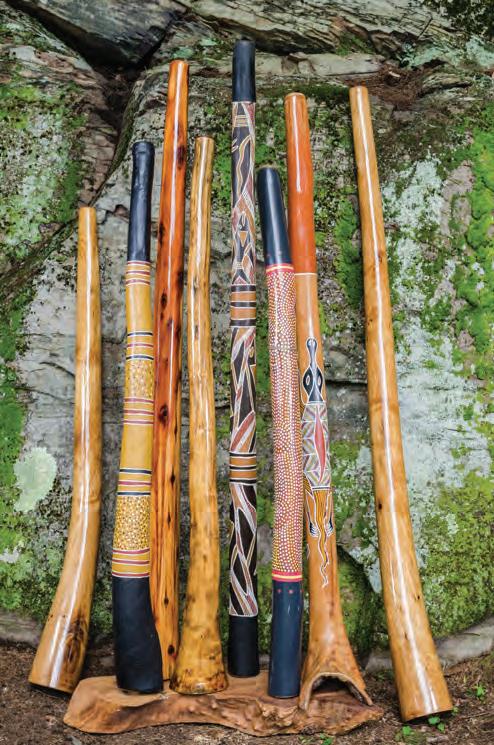
24 First Nations peoples use the didgeridoo for many important ceremonies. Discuss why longer didgeridoos produce sounds that are lower in pitch than short didgeridoos. (HINT: Consider the length of the sound waves produced by each didgeridoo.)
25Discuss, in terms of kinetic energy of par ticles, why:
a convection can only occur in liquids and gases and not sol ids
b when energy transfers by convection or conduction, the substance through which the energy transfers is also heated
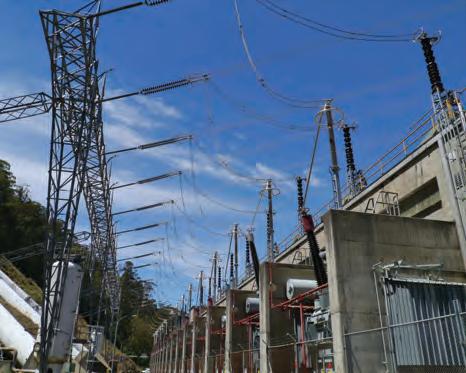
26 Power lines carry electricity from power stations to cities and towns. They experience a voltage loss due to the high resistance along the lines according to Ohm’s law. Propose how the quantities of I and R could be changed to minimise this voltage loss due to resistance. (HINT: Consider how to decrease the resistance.)
DRAFT
c good t hermal insulators are usually solids
d neit her convection nor conduction is a way of transferring energy through a vacuum.
Critical and creative thinking
27 Table 1 shows the speed of sound at different temperatures.
Table 1 The speed of sound at different temperatures Air temperature (°C)Speed of sound (m/s)
a Using graph paper, create a graph of the speed of sound (vertical axis) at various air temperatures (horizontal axis). Start the scale at 320 m/s on t he vertical axis.
bDescribe what happens to the speed of sound as the temperature increases.
c Use your graph to identify the speed of sound at 5°C.
d Use your graph to identify the temperature of the air if the speed of sound is 351 m/s.
28 Astronauts in space can still see each other even if they cannot hear each other.
a Use th is information to compare how light and sound travel.
bDetermine what this tells us about the ability of light energy to travel through outer space.
Figure 3 Didgeridoos of different lengths
Figure 4 Power lines carry electricity from this power station to towns and cities.
29Investigate the differences and similarities between audible sound, ultrasound and infrasound. Display your answer using a Venn diagram.
30 Use your understanding of current and voltage to create a model of the flow of electricity through a circuit. You might use people or even an animation as your model.
Research
31 Choose one of the following topics for a research project. A few guiding questions have been provided, but you should add more questions that you wish to investigate. Present your report in a format of your own choosing, but one component of your report must include a demonstration of sound (for example, if you make an instrument, it needs to be played). In a multimedia presentation, sound must be part of the presentation. If you interview someone as part of your research, you must present a taped recording of your interview along with your report.
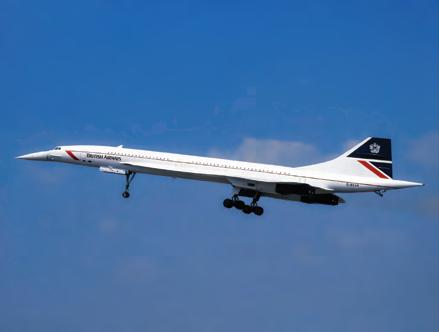
» Supersonic planes
Identify what ‘supersonic sound’ means.
» Cont rast a supersonic jet and a normal jet aircraft.
» Describe one of the problems with supersonic planes.
» Desc ribe why the Concorde was removed from air travel service.
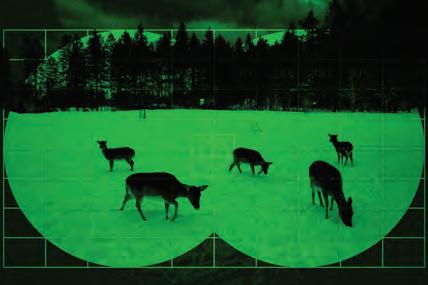
» Night vision goggles
Night vision goggles allow soldiers to see at night and spot the enemy before they are spotted themselves. They give an army a tactical advantage.
» Desc ribe how the goggles work.
» Identify the limitations of these goggles (i.e. will they work in a totally dark environment? Do they have any disadvantages to the soldiers operating them?)
DRAFT
Figure 5 The Concorde has been removed from air travel service.
Figure 6 View of deer and forest through night vision goggles
Chapter checklist
Now that you have completed this chapter, reflect on your ability to do the following. I can do this. I cannot do this yet.
• Explain how heat energy is transferred by conduction and convection in terms of the motion of particles.
• Describe the motion of molecules in a longitudinal wave.
• Explain why sound does not travel through space.
• Describe how the transmission of sound can be affected by the density of the medium it travels through.
• Describe the difference between static electricity and electric current.
• Identify the key components of an electric circuit.
• Describe the differences in arrangement of series and parallel circuits.
• Measure current using an ammeter.
• Describe how voltage is shared in series circuits and in parallel circuits.
• Measure voltage using a voltmeter.
• List the classes of electromagnetic radiation and their average wavelengths.
• Explain how light behaves as a wave and how it behaves as a particle.
• Describe the characteristics of a virtual image.
• Demonstrate appropriate use of a Hodson light box.
• Describe the refraction of light through a convex and concave lens.
• Explain the difference between focus and virtual focus.
• Describe how we see the colour of opaque and transparent objects.
• Explain how the primary colours of light can generate secondary colours of light.
• Define critical angle, total internal reflection and optic fibre.
• Describe how optic fibres and microwave ovens work.
Check your Student obook pro for these digital resources and more:
Play a Quizlet game to test your knowledge. Chapter quiz
Test your understanding of this chapter with the chapter review quiz.
Go back to Topic 7.1 ‘Heat can be transferred by convection or conduction’.
Page XXX
Go back to Topic 7.2 ‘Vibrating particles pass on sound’.
Page XXX
Go back to Topic 7.3 ‘Sound can travel at different speeds’.
Page XXX
Go back to Topic 7.4 ‘Electricity is the presence and flow of charged particles’.
Page XXX
Go back to Topic 7.5 ‘Current can flow through series and parallel circuits’.
Page XXX
Go back to Topic 7.6 ‘Voltage is the difference in energy between two parts of the circuit’.
Page XXX
Go back to Topic 7.7 ‘Visible light is a small part of the electromagnetic spectrum’.
Page XXX
Go back to Topic 7.8 ‘Light reflects off a mirror’.
Page XXX
Go back to Topic 7.9 ‘Light refracts when moving in and out of substances’.
Page XXX
Go back to Topic 7.10 ‘Different wavelengths of light are different colours’.
Page XXX
Go back to Topic 7.11 ‘The electromagnetic spectrum has many uses’.
Page XXX
Check your Teacher obook pro for these digital resources and more:
Launch a live team or individual quiz for your students on key concepts in this chapter.
CHAPTER
CHAPTER ENERGY EFFICIENCY
8.1
8.2
8.3
8.4
Energy cannot be created or destroyed
> Explain the law of conservation of energy.
> Describe the relationship between waste energy and the energy efficiency of a device.
> Use the efficiency formula to calculate unknown values.
Sankey diagrams can represent energy efficiency
> Use Sankey diagrams to show energy inputs, changes and outputs.
> Interpret Sankey diagrams.
Energy efficiency can reduce energy consumption
> Describe examples of energyefficient practices used by First Nations peoples.
> Describe examples of features in buildings that improve energy efficiency.
What if?
Bouncing ball
What you need:
Basketball or tennis ball, tape measure What to do:
1 Drop the ball.
2 Notice the volume of the sound the ball makes when it hits the ground.
Athletes need to be energy efficient
> Identify the energy transfers and transformations involved in archery and pole vaulting.
> Explain how becoming more energy efficient can improve performance in a sport.
3 Measure by how high the ball bounces. What if?
» What if the ball were dropped from a greater height? Would it bounce higher? Would the sound be louder?
» What if the ball were bounced instead of dropped?
» What if the ball were bounced with greater force?
8.1 Energy cannot be created or destroyed
Learning intentions
By the end of this topic, you will be able to:
• explain the law of conservation of energy
• describe the relationship between waste energy and the energy efficiency of a device
• use the efficiency formula to calculate unknown values.
energy efficiency
a measure of the amount of useful energy transformed in an energy transformation process; usually expressed as a percentage of the input energy (e.g. 90 per cent efficiency is very good)
law of conservation of energy
a scientific rule that states that the total energy in a system is always constant and cannot be created or destroyed
Key ideas
• The law of conservation of energy states that energy cannot be created or destroyed.
• When energy is transformed, waste energy is produced.
• Efficient energy transformations produce less waste energy.
Energy cannot be created or destroyed
People have been fascinated with energy for thousands of years, from the heat energy released in the earliest human-generated fires, to the energy that allows us to reach the Moon and beyond. In the previous chapter, you examined the different models of heat, sound, electricity and light energy. There is one law that is consistent across all forms of energy: energy cannot be created or destroyed.
Law of conservation of energy
When energy is transformed or transferred, the amount of energy that goes in must always be the same as the energy that goes out. The total energy remains constant, even if the type of energy changes – what goes in must come out!
Energy efficiency is a calculation of the percentage of useful energy transformed.
Efficiency = Useful energy output
Energy input × 100
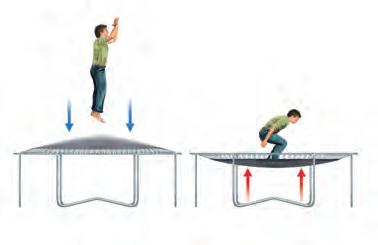
Take the trampoline example in Figure 1. The input energy was 500 units and the useful output energy was 400 units. This means that the trampoline is 400 ÷ 500 × 100 = 80% efficient.
This is considered the law of conservation of energy. No energy can be created or destroyed. The energy at the end must be equal to the energy present at the beginning. When you lift an object up in the air, you add gravitational potential energy. This energy did not just appear. The kinetic energy of your hand was conserved and transformed into the gravitational energy of the object. When the object is dropped, the energy is not destroyed. The gravitational energy is once again transformed into kinetic energy as it falls.
Energy efficiency
If a device like a trampoline transforms most of its input energy into the most useful output energy, then it is considered to be a very energy-efficient device. The less ‘wasted’ energy, the more energy-efficient the device.
500 units elastic energy
400 units gravitational potential energy
Figure 1 Five hundred units of energy are stored in the springs of the trampoline. At the highest point, the jumper has 400 units of gravitational potential energy. Where have the 100 ‘missing’ units gone?
Most energy transformations for everyday appliances aren't as efficient. Scientists are constantly trying to design the best appliances possible with the highest efficiency ratings. This would make them better for the environment and cost less to power. Do you and your family always buy the most efficient appliances? Are you familiar with the star ratings on appliances? More stars mean that the appliance is more energy efficient. Not only is it good to know that less energy is being wasted, but it also means that when you pay your electricity and gas bills you are paying for energy that is being used rather than for energy that is being wasted.
Worked example 8.1 shows how to calculate energy efficiency.
Worked example 8.1: Calculating energy efficiency
Todd held a tennis ball 1.5 m above the concrete before letting it fall. The ball hit the concrete before bouncing to 90 cm above the ground.
a Calculate the energy efficiency of the tennis ball.
b Calculate the waste energy as the tennis ball bounced.
Solution
a Input gravitational energy comes from the ball at 1.5 m (150 cm) above the ground.
Useful output gravitational energy is shown by the ball being 90 cm above the ground.
Efficiency = Useful energy output Energy input × 100 = 90 150 × 100 = 60%
The tennis ball had an energy efficiency of 60%.
b The ball is 60% efficient.
Waste energy = Energy input − Useful output energy = 100% − 60% = 40%
Therefore 40% of the energy is transformed into waste energy.
8.1 Check your learning
Retrieve
1Recall the law of conservation of energy.
2Define ‘energy efficiency’.
Comprehend
3 The Sun provides heat and light energy to our planet every day. Some of this energy becomes waste energy. Describe where most of the useful energy goes.
Analyse
4aExplain why a rubber band that had 10 units of elastic
Heat and sound waste energy
If no system is 100 per cent efficient, but the energy cannot be destroyed, then where does the energy go? In most cases, the energy is transformed into heat and sound energy. Think what happens when you drop a ball on the ground. The ball starts with gravitational potential energy, which is transformed into kinetic energy when you drop it. When the ball hits the ground it makes a noise. The larger the noise, the more sound energy it generates. If you bounce a ball many times in a row, you might feel the ball warm up. Heat energy is generated. Both the heat and sound energy dissipate into the air. They are not lost or destroyed. We cannot reuse them. They are by-products of the main energy transformation.
energy cannot produce 12 units of kinetic energy.
b For the rubber band in part a , calculate its percentage efficiency if 7 units of kinetic energy were produced. Describe where the remaining 3 units of energy have gone.
5Identify and describe the by-product energy transformations for a car.
Apply
6 A student claimed energy was lost when they bounced a ball.
Evaluate the student’s statement by: adescribing the law of conservation of energy bdescribing how this law applies to the student’s statement cdeciding if the statement is correct.
Quiz me
Complete the Quiz me to check how well you've mastered the learning intentions and to be assigned a worksheet at your level.
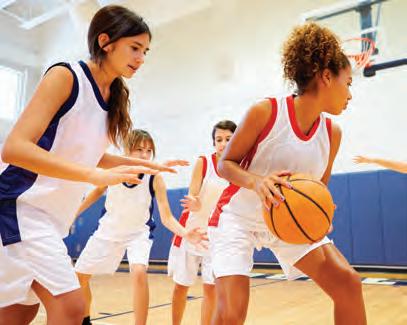
Figure 2 When you drop a basketball on the ground, gravitational potential energy is transformed into kinetic energy.
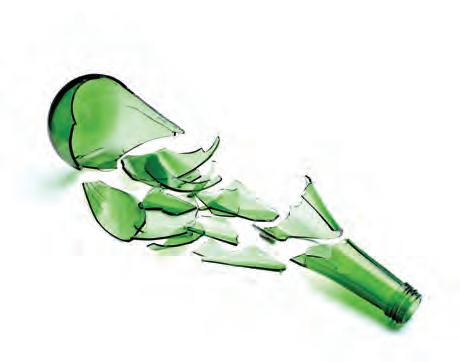
Figure 3 Dropping a glass bottle onto the ground generates and releases sounds energy, producing a large shattering noise.
8.2 Sankey diagrams can represent energy efficiency
Learning intentions
By the end of this topic, you will be able to:
• use Sankey diagrams to show energy inputs, changes and outputs
• interpret Sankey diagrams.
Key ideas
• The conservation of energy can be represented in a Sankey diagram.
Drawing energy efficiency
A hair dryer has two basic components: a fan and a heating element. When plugged in and switched on, the fan motor spins and the heating element heats up. So, a hair dryer converts electrical energy into thermal (heat) energy and kinetic energy. The air blown by the fan is directed over the heating element, passing the heat energy to the air, which flows out of the hair dryer. Some hair dryers have different speed and heat settings that control the amount of electrical energy flowing to each part of the device. This process can be represented using a Sankey diagram.
Sankey diagrams
A Sankey diagram is a type of flow diagram. You learnt about flow diagrams in year 8. Sankey diagrams are used to represent the efficiency of energy transfers and transformations. Each Sankey diagram has a series of lines of different widths. The widths of the lines represent the amount of energy that flows in and out of a system. Let’s look at the transfer and transformation of energy in toasters. Toasters use heating elements to convert electrical energy into thermal energy. Heating elements are made of wires that heat up without melting when electricity flows through them. These wires are not good conductors of electricity. If the wires resist the flow of charged particles and make it more difficult to move, then more electrical energy is transformed into thermal energy. The thermal energy is then passed to the air, which then passes the heat to the bread, toasting it. This transfer of energy can be represented in a Sankey diagram (Figure 1).
Drawing a Sankey diagram
Useful energy output (to the right)
Energy
Width represents theamount
Waste energy (vertically up or down)
Sankey diagrams have three main parts, the input energy, the waste energy and the output energy. The input energy is shown at the start of the arrow on the left-hand side of the diagram. The useful output energy is shown with an arrowhead travelling straight on to the righthand side. The waste energy is usually shown by another arrowhead travelling either up or down on the diagram. Sankey diagrams are usually drawn on graph paper so that the width of the arrow can accurately represent the amount of energy (Figure 2).
Sankey diagrams can also be used to represent more complex energy transitions.
Worked example 8.2 shows the process of drawing a Sankey diagram.
Figure 1 A Sankey diagram of energy transfer in a toaster
Electrical energy put in
The toaster gets hot, Useful work Heating the surroundings turning the bread into toast.
Figure 2 Key steps for drawing a Sankey diagram
input (from the left)
Worked example 8.2: Drawing a Sankey diagram
A kettle has an input of 800 J of electrical energy. 600 J of thermal energy is used to heat the water while 200 J of thermal energy heats the surrounding air. Draw a Sankey diagram to represent this energy transfer.
Solution
Before starting your diagram, you will need to decide the scale you will use on graph paper. It is usually easiest to have 1 square being equal to a simple number. In this case 1 square = 100 joules.
The input energy is 800 J (8 squares). Colour in 8 squares down the graph paper. This can be made as wide as you need (leaving room for the waste energy later). Add a label to show the input energy.
The waste energy (heating of the air surroundings) is 200 J. This means a line 2 squares wide needs to extend down. Add an arrowhead and label.
The useful thermal energy that heats the water is 600 J. Extend six coloured squares to a fi nal output arrow. Add a label.
8.2 Check your learning
Retrieve
1Identify the three key parts of a Sankey diagram.
Comprehend
2 Use a Sankey diagram to represent the energy transfers and transformations ofa rubber band that starts with 10 units of elastic energy and produces 6 units of kinetic energy, 3 units of waste heat and 1 unit of waste sound.
Analyse
DRAFT
3 The Sun provides 400 J of light energy to a plant. The plant uses the light to store 100 J of chemical energy. Calculate the amount of waste energy from this process.
This is now a Sankey diagram of the energy input and output of the kettle.
4 A student claimed a fan heater was inefficient due to energy lost as sound.
Figure 3 Sankey diagram for a
aExplain why thermal energy and kinetic energy is considered ‘useful’ in a fan heater.
b Use the Law of Conservation of Energy to explain why sound energy is not ‘lost’.
c Use the Sankey diagram to calculate the amount of sound energy generated.
5Calculate the amount of electrical energy required by the television in the Sankey diagram below.
Figure 4 Sankey diagram for a television
Quiz me
Complete the Quiz me to check how well you've mastered the learning intentions and to be assigned a worksheet at your level.
8.3 Energy efficiency can reduce energy consumption
Learning intentions
By the end of this topic, you will be able to:
• describe examples of energy-efficient practices used by First Nations peoples
• describe examples of features in buildings that improve energy efficiency.
Key ideas
• Understanding how waste energy is formed allows it to be minimised.
• Waste energy can be useful.
• Insulation prevents the transfer of thermal (heat) energy.
• Knowledge and understanding of energy transformations is not limited to scientists.
Useful waste energy
Most energy transformations can result in thermal waste energy. For thousands of years, First Nations peoples have used their understanding of the way energy is transferred and transformed to develop energy efficient ways to generate heat and to cook food using this thermal waste energy.
Generating fire
The ability to generate fi re is a skill used across many First Nations cultures. The fi re drill method is an example of using what may be considered waste energy to cook or to stay warm. It involves pushing the blunt end of a long, thin drill stick into the fl at surface of wood. As the drill stick is rubbed between the hands, the kinetic energy causes it to twist into
the fl at wood. The friction between the two pieces of wood produces thermal waste energy in the fl at wood. Eventually the wood becomes so hot that a combustion reaction is started.
Cooking food
DRAFT
Figure 1 Recreation of a traditional ground oven
One role of archaeologists is to develop an understanding of traditional methods used by First Nations peoples to cook food. With the permission of the Barengi Gadjin Land Council Aboriginal Corporation which represents the Traditional Owners of the Jadawadjali language group in Western Victoria, archaeologists set out to recreate a traditional ground oven. They dug a large pit, 25 cm deep in the earth lined the base of the pit with spheres made of clay and sand. On top of the spheres, a fi re was slowly built up until it burnt strongly for 1 hour (Figures 1a-e). When the fi re died down to glowing coal, half the coals and spheres were removed (Figure 1f). Wet reeds were placed on top of the remaining coals and clayey spheres (Figure 1g) before the edible roots of Microseris scapigera (yam daisy) were placed on top of reeds. The remaining hot coals and spheres (Figure 1h) were placed on top of the roots before being covered with large sheets of stringy bark (Figure 1i) and sand (Figure 1j). The food was cooked overnight. This process of using the reeds, stringy bark and sand to insulate the heat with the roots reduced the loss of heat and increased the efficiency of the ground oven.
Heating and cooling your house
You probably use electricity or gas to run heating or cooling systems at home. In a hot environment, energy is needed to remove the heat from inside your home, allowing it to cool down. The warm air inside the house is moved
8.3: Design an energy-efficient house
over cool pipes in an air conditioner. The thermal energy of the house air is passed to the refrigerant inside the pipes and is then carried outside the house. If the house is well designed, thermal energy remains outside and the house stays cool.
Home design features
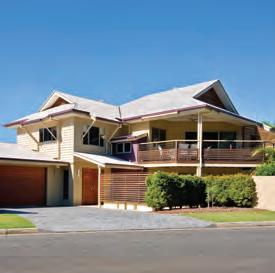
Architects design homes to help control the flow of thermal energy. They can add a variety of features that help limit the amount of heating or cooling your house needs.
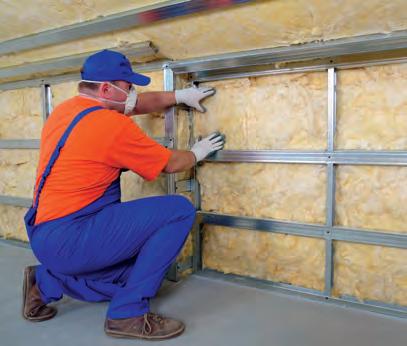
Insulation
Lining the inside of the walls, floors and roof of your house can ensure that heat is not transferred between the outside air and the inside of the house. This keeps the heat inside on a cold day and outside on a hot day.
Window awnings
One of the main places heat is transferred is through windows. On a hot day, light and heat from the Sun can easily penetrate a window. This transfers heat into the house. An awning on a window can limit this. Limiting the number of windows facing the Sun can also help to prevent the heat being transferred into the house.
Verandas
Energy ratings
Most modern appliances such as air conditioners, heaters and televisions have an energy star rating. These ratings are shown on a label and indicate the amount of energy consumed with average use. The star rating indicates the efficiency of the appliance and is determined by the amount of energy used and the size of the appliance. A large television will be less efficient than a small television.
8.3 Check your learning
Comprehend
3 A veranda prevents heat from being transferred from the Sun to the walls of a house.
1Summarise how architects use their knowledge of energy efficiency to minimise the energy used in a house.
2Represent as a Sankey diagram the fi re drill method (with an input energy of 16 J, kinetic energy of 10 J, thermal energy of 6 J) used by First Nations peoples.
3Summarise how architects use their knowledge of energy efficiency to minimise the energy used in a house.
DRAFT
Verandas work much like awnings, but also prevent heat and light from the Sun from shining on walls. This prevents heat from being transferred to the walls, and then to the air inside.
4Draw flow diagrams for the energy transformation process that happens in your house for: a heating during winter b cooling during summer.
5Describe how window awnings and verandas keep a house cool in summer.
Apply
6a A hair dryer transforms electrical energy into thermal energy. Describe how the hair dryer generates thermal energy. bPredict what would happen if the hair dryer used materials that were good conductors.
7 The temperature inside and outside a house was measured over 24 hours and displayed in Figure 4. Determine from the graph whether the house was insulated. Justify your answer (by using numbers from the graph as evidence).
Figure 4 A graph showing the temperature inside and outside a house
Quiz me
Complete the Quiz me to check how well you've mastered the learning intentions and to be assigned a worksheet at your level.
Figure 2 Insulation prevents heat energy being transferred between the inside and the outside of the house.
Figure
8.4 Athletes need to be energy efficient
Learning intentions
By the end of this topic, you will be able to:
• identify the energy transfers and transformations involved in archery and pole vaulting
• explain how becoming more energy efficient can improve performance in a sport.
Key ideas
• Archery involves energy being transferred from the archer to the string, to the kinetic energy of an arrow.
• Pole vaulting involves energy being transferred into and out of an elastic pole.
Efficiency in sport
An understanding of energy efficiency can improve our understanding of the world around us. From reducing the amount of energy lost in archery, to increasing the energy efficiency of the poles used in pole vaulting, understanding how to reduce waste energy can improve athletic performance.
Archery
Archery is a sport that involves using a bow to shoot an arrow at a target. There are three places for energy transfer to occur in the shooting of an arrow. The first energy transformations involve the chemical energy in the archer’s arm being transferred to kinetic energy as the fingers pull back the string on the bow. The kinetic energy is immediately transferred to elastic potential energy in the stretched string. For this to be efficient, the string must be evenly stretched. Waste energy is generated as heat in the arm and the string. When the fingers let go of the stretched string, the elastic potential energy is transferred and transformed into kinetic energy in the arrow. This process produces heat and sound from the string bouncing back to its original position and heat and sound from the friction of the arrow moving through the air (Figure 1).
Studies of energy efficiency in archery have found that as the weight of the arrow increases, the bow becomes more efficient (Figure 2). This means less heat and sound is produced when the archer shoots a heavier arrow.
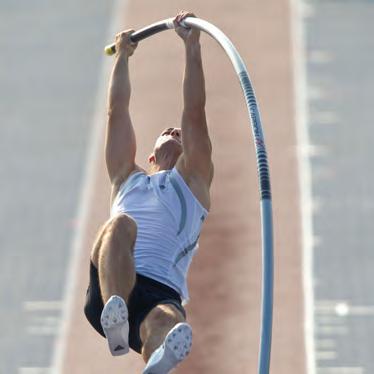
Pole vaulting
Pole vaulting is a unique sport that requires the athlete to have a solid understanding of energy efficiency. Many observers of the sport make the mistake of thinking that the vaulting athlete needs to have strong upper body strength to ‘pull’ themselves over the bar. Although athletes in this sport do require arm strength to carry the pole and leg strength to increase kinetic energy in the run up, the key to being a good pole vaulter is to understand the importance of efficient energy transfer and transformation in
pole.
Figure 1 A Sankey diagram of energy transfer and transformation in archery
Figure 2 As the arrow weight increases, the bow becomes more efficient.
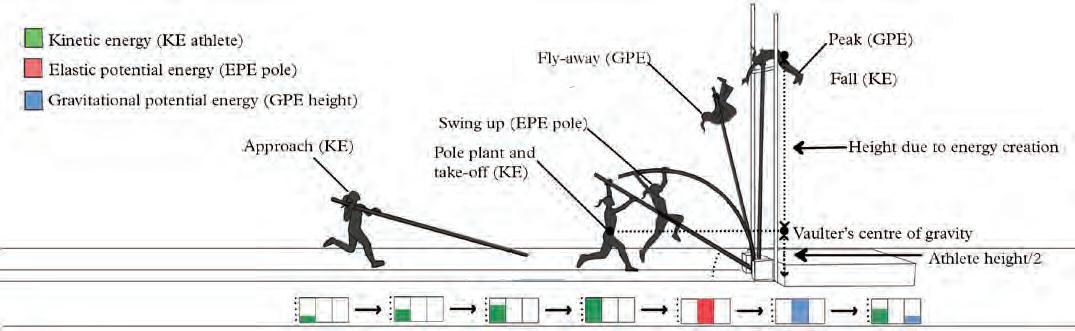
In the run up, the athlete needs to rapidly increase their speed. This generates kinetic energy (from the chemical energy in their bodies). At the end of the run, the athlete plants their pole at the base of the bar. The kinetic energy of the run up is transferred into the pole, causing it to bend and store energy as elastic potential energy. Like most energy transfers, waste heat energy is generated. The elastic energy is released as the pole straightens, transferring back to the athlete, and transforming into gravitational potential energy as the athlete rises into the air. As the athlete reaches full height (peak gravitational energy), the athlete lets go of the pole and moves over the bar and falls to the mat below. The athlete able to jump the highest bar without knocking it off will win the competition. This process is shown in Figures 3 and 4.
The pole is the main point of energy transfer and transformation. The efficiency of energy transfer from the athlete to the pole, and from the pole back to the athlete, is the key to a successful jump. Early poles were made of wood with elastic properties. In the 1850s wood from ash or hickory trees was used for the poles. Seven years later, athletes started using bamboo poles as they were able to store more elastic energy. In the 1940s steel poles were trialled before flexible fibreglass was used. Most modern pole vaulters have added carbon fibre to the fibreglass to increase the flexibility and a fast recoil. This transfers more of the elastic energy stored in the pole to the vaulter.
8.4 Check your learning
Retrieve
1Identify two types of energy involved in archery.
Comprehend
2Draw flow diagrams for the energy transformation process that occurs in: a archery b pole vaulting.
3Represent the energy transfer in pole vaulting with a Sankey diagram.
Apply
DRAFT
4Propose why a moving arrow would generate thermal heat energy.
5 There are two types of bows that are used in competition archery in the Paralympic events. The recurve bow has limbs that curve away from the archer. The compound bow is less flexible and uses pullies and cables to store the elastic potential energy. Both bows are effective in shooting arrows, but the recurve bow produces more sound when the arrow is released. Use this description to identify which bow is more efficient. Justify your decision.
Complete the Quiz me to check how well you've mastered the learning intentions and to be assigned a worksheet at your level.
Figure 4 Pole vaulting involves the transfer of energy in and out of the pole.
Figure 3 Pole vaulting involves an athlete using a pole to jump 5–6 m over a bar.
Quiz me
CHAPTER 8 REVIEW
ENERGY EFFICIENCY
Retrieve
1Identify the equation used to calculate energy efficiency.
A Efficiency = Useful energy input
Energy output
B Efficiency = Useful energy output
Energy input
C Efficiency = Useful energy input
Energy output × 100
D Efficiency = Useful energy output
Energy input × 100
2Identify the amount of thermal energy produced by the electric motor in Figure 1.
A 14 J
B 36 J
C 50 J
D 86 J Electrical energy 50J
Mechanical work 36J
Thermal energy ?J
Figure 1 Sankey diagram showing energy produced by an electric motor
3Recall how insulation can help to make a house more energy efficient in summer.
A It captures light energy to power the house.
B It stops heat getting in through the windows.
C It deflects light energy away from the house.
D It helps to keep heat out of the house during the day.
4Recall what the stars on the energy rating of an appliance represent.
Comprehend
5 Use numbers in an example of your own to explain the law of conservation of energy.
6 Use numbers in an example of your own to explain energy efficiency.
8Explain what is meant by ‘waste energy’.
9Describe two different ways electrical energy can be generated.
Analyse
10Classify the following as either true or false. Rewrite any false statements to make them true.
a Archery bows only hold stored energy when they are stretched.
b When an object is thrown up in the air, it gains gravitational potential energy.
c Thermal energy is a type of potential energy.
d Energy can be transferred with 100% efficiency.
11Analyse each of the following situations and identify the main form of energy in each.
a A ground oven used for cooking.
b A stretched archery bow.
c The Sun heating the walls of a house.
d An arrow flying through the air.
DRAFT
7Explain why a ball that rebounds high is considered more efficient than a ball that does not rebound at all.
12 For each of following, consider the energy transformation and identify a device that performs that transformation.
a electrical energy into light energy
b elastic energy into kinetic energy
c electrical energy into sound energy
d gravitational energy into electrical energy
e kinetic energy into electrical energy
13Compare the energy efficiency of a bamboo pole vault and a carbon fibre/fibreglass pole vault.
14Compare the effectiveness of a veranda and window awnings in increasing the energy efficiency of an uninsulated house in summer.
15aCalculate the percentage efficiency of a device if it transforms:
i 20 units of input energy into 12 units of useful output energy
ii 600 units of input energy into 500 units of useful output energy.
b For (i) and (ii) from question 15a, explain what happened to the other energy (i.e. 8 units in (i) and 100 units in (ii).
16 A large wind turbine is able to transform 2500 J of mechanical energy into 2000 J of electrical energy.
aCalculate the amount of thermal waste energy produced each second.
bCalculate the efficiency of the wind turbine.
17 Figure 2 illustrates the generation of electrical energy from coal. Use the Sankey diagram to calculate the energy efficiency of this process.
Apply
Critical and creative thinking
19Evaluate the energy efficiency of the light globes in Figure 4 (by calculating the efficiency of the light being produced, comparing the amount of waste energy produced and deciding which type of globe you would recommend in your house).
Figure 2 Generation of electrical energy
18Identify which of the three lights in Figure 3 is most energy efficient. Use calculations.
20Evaluate the efficiency of a ground oven (by describing how a ground oven cooks food, describing the advantages and disadvantages of a ground oven, comparing a ground oven to the oven in your kitchen, describing when using a ground oven would be more efficient than a kitchen oven).
21Determine the main source of electrical energy generation in your area. Describe how that energy is generated.
22 The perpetual motion machine is a hypothetical machine that could keep working forever without any energy source. Use the law of conservation of energy to discuss why this machine would be impossible.
Social and ethical thinking
23 A mobile phone charger that is switched on at the power point is constantly using energy, even when no phone is placed on it to be charged. Evaluate the ethics of maintaining this energy use when your phone is fully charged (by describing the advantages and disadvantages of leaving the phone charger on, deciding whether you are using an ‘ends justify the means’ consequentialism approach or a ‘rules-based’ deontology approach, and deciding whether the phone charger should be left on).
Figure 3 Sankey diagrams showing energy efficiency of three lights
Figure 4 Energy efficiency of two light globes
Research
24 Choose one of the following topics for a research project. A few guiding questions have been provided for you, but you should add more questions that you want to investigate. Present your research in a format of your own choosing, giving careful consideration to the information you are presenting.
»
Energy efficient transportation
Many forms of transport currently rely on the production and use of fossil fuels. A vehicle that is not energy efficient will need to use more fossil fuel to travel than an energy efficient vehicle.
» Identify the types of waste energy that would be produced in travel.
» Desc ribe how this waste energy is generated.
» Expl ain how the amount of waste energy can be minimised in the design of energy efficient vehicles.
» Electricity generation
Each time energy is transferred or transformed, waste energy is produced.
» Desc ribe two ways electrical energy is generated (nuclear, hydroelectrical, gas, solar and wind).
» For each process, compare the waste energy that is generated each time the energy is transferred and transformed.
» Use the comparison to identify and justify which process of electricity generation is most efficient.
» Energy-efficient housing
In previous societies, energy efficiency was important because people had limited access to different types of energy supply and their applications compared to today.
» Rese arch how civilisations in tropical areas designed their homes to keep them cool and damp free.
DRAFT
» Desc ribe three types of energy-efficient practices that humans have used through the ages.
» Identify what is meant by a ‘passive house’.
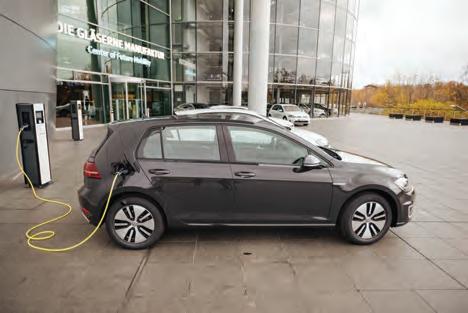
Figure 5 Electric cars use less energy than conventional cars.
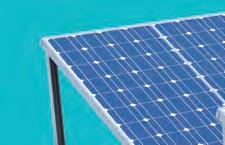
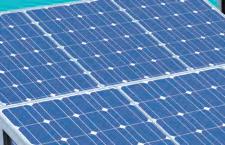
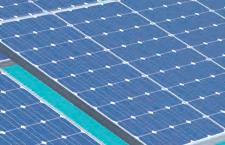
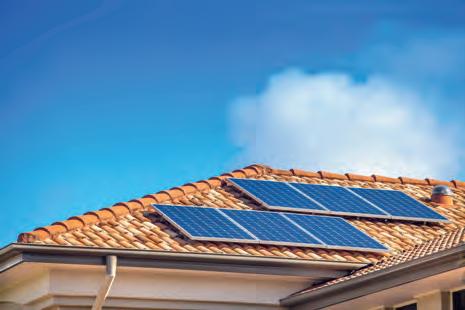
Figure 6 Solar panels on houses improve energy efficiency.
Chapter checklist
Now that you have completed this chapter, reflect on your ability to do the following. I can do this. I cannot do this yet.
• Explain the law of conservation of energy.
• Describe the relationship between waste energy and the energy efficiency of a device.
• Use the efficiency formula to calculate unknown values.
• Use Sankey diagrams to show energy inputs, changes and outputs.
• Interpret Sankey diagrams.
• Describe examples of energy-efficient practices used by First Nations peoples.
• Describe examples of features in buildings that improve energy efficiency.
• Identify the energy transfers and transformations involved in archery and pole vaulting.
• Explain how becoming more energy efficient can improve performance in a sport.
Go back to Topic 8.1 ‘Energy cannot be created or destroyed’.
Page xxx
Go back to Topic 8.2 ‘Sankey diagrams can represent energy efficiency’.
Page xxx
Go back to Topic 8.3 ‘Energy efficiency can reduce energy consumption’.
Page xxx
Go back to Topic 8.4 ‘Athletes need to be energy efficient’.
Page xxx
DRAFT
Launch a live team or individual quiz for your students on key concepts in this chapter.
Check your Teacher obook pro for these digital resources and more:
Check your Student obook pro for these digital resources and more:
Play a Quizlet game to test your knowledge.
Chapter quiz
Test your understanding of this chapter with the chapter review quiz.
9 EXPERIMENTS CHAPTER
SCIENCE LAB RULES
Being safe in the lab is essential to prevent you and others from getting hurt.
Whenever you are in the lab, you must always follow the rules below.
DO:
» wear a l ab coat for practical work
» keep your workbooks and paper away from heating equipment, chemicals and flames
» tie long hair back whenever you do an experiment
» wear s afety glasses while mixing or heating substances
» tell your teacher immediately if you cut or burn yourself
» tell your teacher immediately if you break any glassware or spill chemicals
» wash your hands after any experiments
» listen to and follow the teacher’s instructions
» wear gloves when your teacher instructs you to.
DON’T:
» run in a laboratory
» push others or behave roughly in a laboratory
» eat in a l aboratory
» drink from glassware or laboratory taps
» look down into a container or point it at a neighbour when heating or mixing chemicals
» smell gases or mixtures of chemicals directly; instead, waft them near your nose and only when instructed
» mix chemicals at random
» put matches, paper or other substances down the sink
» carr y large bottles by the neck
» enter a preparation room without your teacher’s permission.
What if the absorbency of different paper towels was compared? 1.1 EXPERIMENT
Aim
To measure and compare the absorbency of different brands of paper towel, which vary in their cost per square centimetre.
Materials
> 5 different brands of paper towel (one must be a home brand)
> Small beaker of water with a dropper
Method
> 250 mL beaker
> 100 mL measuring c ylinder
> Scissors
> Ruler and pencil
> Calculator
> Stopwatch
1 Cut a 20 cm × 20 cm square from one sheet of each brand of paper towel.
2 Record the brand, price, number of sheets and the dimensions of each sheet in centimetres.
3 Fill the measuring cylinder with water to the 100 mL mark, using the dropper for the last 2–3 mL. Ensure that your eyes are level with the scale, to avoid parallax error.
4 Immerse the square of paper towel in water for 10 seconds. Use the stopwatch for timing. Hold the paper towel above the measuring cylinder, without squeezing the towel, for another 10 seconds, then remove it and place it in the large beaker.
5 Record the level of water left in the measur ing cylinder and, hence, the volume of water absorbed by the paper towel in 10 seconds.
6 Repeat steps 1–5 for two other sheets of the same brand of paper towel.
Inquiry
What if the absorbency of more expensive paper towels was compared to home brand paper towels?
Answer the following questions with regard to your inquiry question.
> Identify the brands of paper towel that you will test.
> Write a hypothesis (If … then … because …) for your inquir y.
> Identify the (independent) variable that you will change from the first method.
> Identify the (dependent) variable that you will measure and/or observe.
> Identify two variables that you will need to control to ensure a valid test. Describe how you will control these variables.
> Identify the materials you will need for your experiment.
> In your logbook, write down the method you will use to complete your investigation.
> Draw a table to record your results.
> Show your teacher your planning for approval before starting your experiment.
Results
> Calculate the total surface area and the cost per square centimetre for each paper towel, and record your results in the table.
> The total surface area of the paper towel roll is calculated as follows:
A = l × w × number of sheets of paper towel
> The cost of paper towel per square centimetre is calculated as follows:
Cost of paper towel = cost of roll total area of roll
> Calculate the average volume of water absorbed per 20 cm square and record your results in the table.
> The average volume of water absorbed per 20 cm square is calculated as follows:
Average volume of water = volume 1 + volume 2 + volume 3 3
> Draw a bar graph to show the average volume of water absorbed for each brand.
> In your graph, place the brands in order from least expensive to most expensive. On each bar, state the price per square centimetre of that brand.
Discussion
1 State the reasons for the following.
a Three readings were taken each time and then averaged.
b The same-sized square was used each time.
c The cost of the paper towel per square centimetre was calculated and used instead of the total cost of the roll.
d Each square of paper towel was allowed to drip for precisely 10 seconds before removing it from the water.
2 Compare the absorbency of the different brands to the predictions you made in your hypothesis.
3 Evaluate the validity (by identifying any variables that might not have been controlled) and reliability (by describing whether you or other scientists will achieve the same results) of this experiment.
4 Identify the limitations of these results (by describing how testing with other solutions may achieve different absorbency).
Conclusion
From your graph, identify any apparent relationship between the cost of the paper towel per square centimetre and its absorbency. Provide evidence (by mentioning values) from your results to support your answer.
2.1 Testing your senses CHALLENGE
Aim
To determine how skin temperature and touch sensors respond to stimuli.
PART A: TEMPERATURE RECEPTORS
What you need:
Very warm water, room temperature water, warm water (no hotter than 50ºC; use the thermometer to check), ice cubes, 3 ice cream containers, thermometer, timer
What to do:
1 Half-fill one container with cold water and add the ice cubes.
2 Half-fill the second container with room temperature water.
3 Half-fill the last container with very warm water.
4 Place one hand in the iced water and the other in the ver y warm water for 2 minutes.
5 Remove your hands from the iced and very warm water and place them (at the same time) in the room temperature water.
PART B: TOUCH RECEPTORS
What you need:
2 toothpicks, ruler, modelling clay, blindfold
What to do:
1 Work in pairs. One person puts on the blindfold.
2 Place the toothpicks 50 mm apart in the modelling clay.
3 Pick up the modelling clay and place the pointed ends of the toothpicks gently on the blindfolded person’s finger Ask them whether they feel one or two points.
4 If two points are felt, move the toothpicks closer together and repeat step 3.
5 Repeat steps 3 and 4 until the blindfolded person reports ‘one point’ for the first time.
Questions
1 Identify the stimulus experienced by the hand in ver y warm water.
2 Contrast the information provided by the temperature sensors in the hand when it moved from: a the iced water to the room temperature water b the very warm water to the room temperature water.
3 Evaluate the effectiveness of the temperature receptors on the skin of your hand (by comparing the messages sent to the brain by both hands and deciding whether the temperature receptors provide an accurate measure of the water temperature).
4 Explain why scientists use a thermometer rather than their hands to test the temperature of solutions.
6 Record the distance between the two pointed ends of the toothpicks in a table.
7 Repeat this procedure for the palm of the hand, back of the hand and forearm.
Questions
1 Contrast the ‘two point’ distances on different areas of the skin.
2 Identify the part of the body that was able to detect the closest toothpicks
3 Identify which skin areas have the most touch receptors. Justify your answer (by describing how touch receptors work, describing how a receptor might mistake two toothpick points for a single touch, and using your answers to questions 1 and 2 to decide which area of skin has the most touch receptors).
2.2 Pipe cleaner neurons CHALLENGE
Aim
To model a neuron.
What you need:
5 different-coloured pipe cleaners representing different parts of the neuron (cell body, axon, dendrites, myelin sheath, synaptic terminal), A3 or A4 paper, sticky tape, red felt-tipped pen
What to do:
1 Roll a pipe cleaner into a ball to represent the cell body.
2 Attach another pipe cleaner to the cell body by pushing it through the ball so that there are two halves sticking out. Twist the two halves together into a single long axon.
3 Push another pipe cleaner through the cell body on the side opposite the axon to make a dendrite. This can be shor ter than the axon and you can twist more pipe cleaners to make more dendrites.
4 Wrap a pipe cleaner along the length of the axon to form the myelin sheath.
5 Wrap another pipe cleaner on the end of the axon to make the synaptic terminal.
6 Tape your finished pipe cleaner neuron onto a piece of A3 or A4 paper and label the parts.
7 Mark the path of the nerve impulse, from start to finish, along the neuron.
Questions
1 Describe the role of a neuron.
2 Describe the role of the myelin sheath.
3 Explain how the message moves from one neuron to another via the synapse.
Figure 1 Use pipe cleaners to model a neuron.
2.3A Testing reflexes CHALLENGE
Aim
To test the pupil reflex.
What to do:
1 Look at the pupils (the black spots in the middle of the eyes) in the eyes of a classmate. Note the size of the pupils.
2 As a class, dim the lights in the room. After a few minutes, look at your classmate’s eyes and note the size of the pupils.
> How big are the pupils?
3 Turn the lights back on. Check the size of your classmate’s pupils again.
> How big are the pupils this time?
Questions
1 Describe how the pupils of the eyes changed when: a the room was dimmed b the lights were turned back on.
2 Describe the role of the pupil in the eye.
3 Describe an advantage of the change in pupil size when moving in and out of dark space.
4 With a partner, design an experiment to test another reflex. Write an aim and a reproducible method for your experiment.
Figure 1 Which pupil is in low light and which is in bright light?
How fast is the nervous system?
What you need:
Metre ruler, blindfold
What to do:
1 Work in pairs. Student 1 holds the ruler between their thumb and forefinger so that the ruler hangs with the zero mark at the bottom. Student 2 waits with their thumb and forefinger at the bottom of the ruler, level with the zero mark.
2 Student 1 drops the ruler without warning. Student 2 catches the ruler as fast as they can between their thumb and forefinger.
3 Record the number of centimetres the ruler has dropped, by looking at the location of Student 2’s thumb and forefinger on the ruler (Figure 1a).
4 Repeat until you have 10 results for each student.
5 Work out the average reaction distance for each student.
6 Measure the approximate distance the messages must have travelled if they travelled from your eye to your brain to your fingers.
7 Try the experiment using touch only. Blindfold Student 2. When Student 1 drops the ruler, they tap Student 2 on the head. Does this make a difference to the reaction distance?
8 Try the experiment using hearing only. Blindfold Student 2 (Figure 1b). When Student 1 drops the ruler, they say ‘now’. Does this make a difference to the reaction distance?
Questions
1 Contrast the results of the three experiments (no blindfold, blindfold and tap, blindfold and voice) to determine which experiment had the fastest results.
2 Evaluate the reliability of your results (by describing whether all the variables were controlled, explaining possible errors that need to be improved, and deciding whether anyone who repeated the experiment would obtain the same results).
2.4 Sheep brain dissection SKILLS LAB
CAUTION! Wear your lab coat, safety glasses and plastic gloves. Be careful with the scalpel because it is likely to be very sharp. Cut away from your hands and other people.
1 Examine the outside of the brain. Set the brain down so that the flatter side, with the white spinal cord at one end, rests on the board (Figure 1). Using the different-coloured pins, identify the two hemispheres, the four lobes of the brain, the spinal cord, the cerebellum and the cerebrum. Draw a diagram (in pencil) or take a photo that displays the different sections of the brain. Check this with your teacher before continuing.
2 Remove the pins and turn the brain over (Figure 2). Identify the medulla and the pons. Draw a diagram or take a photo that displays these parts of the brain.
3 Place the brain with the curved top side of the cerebrum facing up. Use a scalpel to slice through the brain along the centre line, starting at the cerebrum and going down through the cerebellum, spinal cord, medulla and pons (Figure 3). Separate the two hemispheres of the brain (Figure 4). Draw a diagram or take a photo that displays these parts of the brain.
DRAFT
4 Cut one of the hemispheres in half lengthwise. Record what you see.
5 If a microscope is available, slice a very thin section of the cerebrum and put it on a slide, covering it with a drop of water and a cover slip. Draw a diagram of what you observe at low and high magnifications. Follow the same procedure with a section of the cerebellum, and then compare the two sections of the brain.
Questions
1 Describe the texture of the brain (smooth, rough, slippery, waxy, tacky, flimsy, chalky, hard, soft, granular, rubbery).
2 Compare the structure of the sheep’s brain and what you know about a human brain.
3 Contrast the cognitive functions (ability to think and reason) of a sheep and a human. Describe how these differences could be reflected in the structure of the brain.
Figure 1 Step 1
Figure 3 Step 3: slice along the brain.
Figure 4 Step 3: separate the two hemispheres.
Figure 2 Step 2
2.6 Glands and organs of the endocrine system CHALLENGE
Aim
To identify the path of a hormone from its gland to the target organ.
What you need:
Large sheet of butcher’s paper, felt-tipped pen, sticky tape
What to do:
1 Working in pairs, draw an outline of your partner’s body on the paper.
2 With your partner, draw in the glands and organs of the endocrine system. Using the information in Table 1 (page XX), annotate each gland with a brief description, in your own words, of what it is responsible for.
3 Use colour coding and arrows to show the path of the hormone(s) produced by each gland to its target organ.
Questions
Choose one gland or organ to research.
1 Identify the main hormone the gland secretes.
2 Describe how the hormone affects the target cells in the target organ.
3 Describe one disorder that results from a malfunction of this organ or gland.
DRAFT
Figure 1 The organs of the endocrine system.
2.7 Experiencing homeostasis EXPERIMENT
Aim
To demonstrate how homeostasis maintains control of the heart rate during and after exercise.
Materials
> Stopwatch
> Heart rate monitor (optional)
Method
1 While sitting down, find your pulse and count the number of times your heart beats in 15 seconds.
2 Multiply this number by 4 to determine the number of beats every minute.
3 Measure your respiration rate by counting the number of breaths you take in 1 minute.
4 Do repeated step-ups or star jumps for 2 minutes. (Make sure you are wearing appropriate shoes.)
5 Measure your heart rate and respiration rate immediately after stopping exercise.
6 Measure your heart and respiration rate every 2 minutes for 10 minutes.
Results
1 Record the data in a table.
2 Draw a line graph showing how your heart rate varied after exercise.
3 Draw a line graph showing how your respiration rate varied after exercise.
Discussion
1 Describe how your breathing rate changed during and in the 10 minutes after exercise.
2 Explain why your heart rate increased during exercise.
3 Describe what happened to your hear t rate during the 10 minutes after exercise.
4 Use the concept of homeostasis to explain why your heart rate was different before, during and after exercise.
Conclusion
Describe how homeostasis ensures that our muscles get enough nutrients and remove wastes during exercise.
Figure 1 Heart rate monitor on a smart watch
2.10A Investigating pathogens
Pathogens are organisms that cause disease.
Aim
To investigate a disease-causing pathogen.
What you need:
A selection of research resources, such as books, medical dictionaries, journals and computers
What to do:
1 Working in small teams, brainstorm for 3 minutes and prepare a list of as many pathogen-caused diseases as you can.
2 You now have 2 minutes to predict the type of organism that causes each of the diseases in your list. Next to each disease, write one of the following words as your prediction: worm, fungus, protozoan, bacterium, virus.
3 Spend a minute discussing how your team can use your resources to confirm or refute your prediction. You must use at least two different types of valid reliable resources.
4 You now have 10 minutes to research the list of diseases to confirm which group of organisms causes each disease.
Questions
1 Describe the types of resources that you used in your research. Describe two types of resources that you avoided and why you avoided them.
2 Draw a bar graph showing the number of diseases you listed for each type of organism.
3 Identify the organism that occurred most frequently (the mode) on your list. Describe why you might be more familiar with the causes of some types of disease.
DRAFT
Figure 1 Books can be used to conduct research on disease.
2.10B Investigating germ theory EXPERIMENT
CAUTION! Do not open the tape seals.
Aim
To determine what factors affect the growth of airborne microbes.
Materials
> Agar plates
> Various disinfectants
> Incubator
Method
> Sticky tape or paraffin film
> Permanent marker
> Timer
1 Open the lid of one agar plate and leave it sitting on the bench for 15 minutes
2 Place the lid on the top and seal the agar plate with sticky tape. Write the label ‘Open bench’ around the edges underneath the plate, so that it does not obstruct the view of the agar.
3 Leave another agar plate unopened. Seal it with sticky tape. Label the plate ‘Control’.
4 Incubate the agar plates at 35–37°C for approximately 3 days.
5 Do not open the plates! Examine the closed plates for any g rowth.
Inquiry
What if the first agar plate was sprayed with a disinfectant before being incubated?
Answer the following questions with regard to your inquiry question.
> Write a hypothesis (If … then … because …) for your inquir y.
> Identify the (independent) variable that you will change from the first method.
> Identify the (dependent) variable that you will measure and/or observe.
> Identify two variables you will need to control to ensure a valid test. Describe how you will control these variables.
> Identify the materials you will need for your experiment.
> In your logbook, write down the method you will use to complete your investigation.
> Draw up a table to record your results.
> Show your teacher your planning for approval before starting your experiment.
Results
Record all your results. You could take photos showing the microbe growth on the agar plates.
Discussion
1 Define the term ‘bacterial colony’.
2 Describe how a bacterial colony forms on an agar plate.
3 Explain why colonies are different colours and sizes.
4 Compare the colour and size (diameter) of the different colonies that grew on each plate.
5 Explain why you left one agar plate unopened.
6 Evaluate whether your results suppor t germ theory (by explaining germ theory, comparing your results to germ theory, and deciding whether your results support germ theory).
7 Evaluate whether your results suppor t your hypothesis (by describing your results in 1–2 sentences, comparing your results to your hypothesis, and deciding whether your hypothesis was supported).
Conclusion
Describe the factors that affect the growth of microbes.
2.11
Aim
Modelling infection and vaccination CHALLENGE
To model how a disease can spread in a group.
What you need:
1 M sodium hydroxide, 0.1 M hydrochloric acid, water, phenolphthalein indicator, plastic cups, pipette, felt-tipped pen
What to do:
1 Half-fill a plastic cup with water and label it with your name.
2 All students place their cups on one table.
3 Students turn their back while the teacher adds 2 mL of sodium hydroxide to one cup. This represents a student having an infection.
4 Students then collect their cups and use the pipettes to exchange 3 mL of water with three other students. This is equivalent to shaking hands. Record who you ‘shook hands’ with in a table like the one below. Person 1 Person 2 Person 3
5 Add a few drops of phenolphthalein indicator to each cup, to determine who caught the disease.
6 Use the information recorded in the table to determine who the or iginal source of the infection was.
7 Repeat steps 1–5, this time choosing whether or not to become ‘vaccinated’. Vaccination is done by adding 2 mL of hydrochloric acid to your cup of water. Redraw the table to record who you shook hands with after some people were vaccinated.
8 Repeat this activity, increasing the number of people vaccinated.
Questions
1 Identify the number of people who became infected when no one had been vaccinated.
2 Identify the number of people who became infected when a few people had been vaccinated.
3 Identify the number of people who became infected when more people had been vaccinated.
4 Explain why vaccination affected the number of people who became infected.
5 Describe a real-life example of how vaccination can protect vulnerable members of the community.
3.1 Vegetative propagation EXPERIMENT
Aim
To produce a new plant using vegetative propagation.
Materials
> 2 × 500 mL beakers
> Distilled water
> Scissors
Method
> Geranium plant
> Flowerpots with potting mix
1 Fill the beakers 3/4 full with distilled water
2 Use the scissors to cut four healthy stems with 1–2 healthy leaves on each from the same plant.
3 Place the cut ends of the stems into the distilled water.
4 Observe the cut ends of the stems for 2–3 weeks
5 Transfer the cuttings to the flower pots.
6 Water the plants regularly and observe their growth.
Results
Record your observations in a logbook. Take photos of any changes in growth.
Discussion
1 Identify this form of reproduction as sexual or asexual. Use evidence from your exper iment to justify your answer.
2 Compare the genetic material in the parent plant to that of the new (daughter) plants.
3 Identify if the parent and daughter plants will be identical in shape and size. Justify your answer by describing the factors that affect plant growth.
4 A student claimed that they were making plant clones. Define the term ‘clones’. Use your definition to evaluate if the student’s claim is correct.
Conclusion
Describe what you know about vegetative propagation.
3.5 Working with the RSPCA CHALLENGE
The RSPCA is a community-based charity, well known in Australia for its work with and for animals. Unlike humans, animals do not have a voice and so they cannot ask for help. The RSPCA is one of the best ‘voices’ for animals and their rights. One of the RSPCA’s biggest campaigns focuses on the importance of desexing pets, particuarly cats. Every year, approximately 60 000 cats are brought in to the RSPCA; of these, over half have to be put down.
Aim
To create a mathematical model (or diagram) demonstrating how many cats can be produced from two fertile cats.
What to do:
The growth modelled in this task is exponential, meaning that when the two cats reach 6 months of age they can start to breed and, after 60 days, will have a litter of four kittens, after 6 months these four kittens will also be able to have kittens themselves and so on.
Cats can start the breeding cycle almost straight after having kittens, which means, on average, cats can have three litters of kittens a year.
Include a graph that shows the growth of numbers of cats against time.
Questions
1 Explain what desexing is and why it is important.
2 Based on your calculations, identify how many cats were produced after 4 years.
3 Describe how desexing the first mating pair would change your calculations.
4 Identify two other factors that could affect the number of cats in your calculations.
6 Explain why the RSPCA takes in so many more cats than dogs
Figure 1 Desexing cats can have an impact on the number of unwanted kittens.
3.6 Flower dissection EXPERIMENT
Aim
To examine the main parts of a flower.
Materials
> Newspaper
> A flower (you can dissect any type of flower available; lilies and fuchsias are a good choice)
> Scalpel blade or sharp knife
> Hand lens
Method
1 Place the newspaper on the bench.
2 Cut the flower off the stalk.
3 Observe the flower. Identify the main parts of the flower from Figure 1.
4 Draw a labelled diagram of the flower.
5 Gently remove the sepals and petals.
6 Look for the stamens with anthers at the top. The anthers hold the pollen. You should be able to dust some pollen onto your finger.
7 Cut off the male parts at the bottom of the petal.
8 Observe the female part of the flower. It has the stigma at the top and the ovary at the bottom.
9 Cut the ovary lengthwise. In it you will see tiny white scales, which are the ovules. When the ova inside the ovules are fertilised by the pollen, they will grow to become seeds and the ovary will grow to become the fruit.
10 Draw a labelled diagram of the ovary.
11 Clean up your bench by wrapping the flower in the newspaper. Wash your hands.
Results
Draw labelled diagrams of the male and female parts of the flower.
Discussion
1 Identify the colour of the filament (the stem of the stamen).
2 Describe how easy it was to clean the pollen from your fingers. Explain the advantage of a plant having sticky pollen.
3 Explain how the male and female parts were arranged to encourage pollination.
4 Identify if your flower is more likely to be self-pollinated or cross-pollinated. Justify your answer (using your observations to explain how the plant would be pollinated).
5 Identify if pollination is more likely to be by wind, water or animals. Justify your answer.
Conclusion
Explain what you know about the parts of a flower.
Petals
Anther
Stigma
Style
Carpel
Ovary
Ovum
Stamen
Filament
Sepals
Figure 1 The structure of a flower
How can you tell what is inside?
This kind of investigation uses ‘indirect evidence’. It has been used by many scientists when trying to work out what is inside the atom.
Aim
To use indirect evidence to generate a hypothesis.
1 Form two teams (A and B) of three students to work with each other.
2 Team A places one item in each of the small boxes. The boxes are then closed.
3 Team B plans a way of determining what is inside each of the boxes without opening or touching them. They can use any equipment that is available in the science laboratory. The team writes the steps of the method in their logbooks.
4 Team B then follows the method to touch and examine the boxes, still without opening them.
5 Repeat the process, with Team B preparing a box and Team A determining what is inside the box.
Questions
1 Contrast ‘direct evidence’ and ‘indirect evidence’.
2 Describe the senses that team B used to identify what was inside the box.
CHALLENGE
3 Describe how scientists might have used indirect evidence to model what is inside an atom.
4 Identify at least one other field of scientific investigation in which scientists would have to use indirect evidence to develop their theories.
Figure 1 How can you determine what is in the box?
4.1B
Aim
Rutherford model of the atom CHALLENGE
CAUTION! Do not eat the popcorn used in the experiment.
To model Rutherford’s experiment that determined the structure of an atom.
1 Tie the string securely around the matchbox and suspend it in the middle of the hula hoop.
2 One person holds the hula hoop so that it and the matchbox are hanging vertically, facing a second person.
3 The second person stands 1–2 m away and throws one piece of popcorn at a time at the hula hoop. Repeat 10 times.
4 Record how many kernels of popcorn go through the hoop and how many bounce off the matchbox.
Questions
1 The hula hoop represents a gold atom in Rutherford’s experiment. Identify what the matchbox represents.
2 Identify the number of popcorn pieces that bounced off the matchbox.
3 Explain how your model of Rutherford’s experiment provides supporting evidence for the Rutherford model of the atom.
Figure 1 What does popcorn represent in this experiment?
Calculating relative atomic mass CHALLENGE
Your bag contains a sample of a new element called ‘legumium’ (symbol Lg). The atomic number of legumium is 4. There are three isotopes of this element. The smallest isotope is 4Lg. The next in size is 5 Lg, which has an atomic mass of 5. The largest of the isotopes is 6 Lg, which has an atomic mass of 6. Your role is to determine the relative atomic mass of the element and its isotopes.
Aim
To model using the relative atomic mass of an element and its isotopes.
What you need:
1 bag of ‘isotope sample’ containing 8 large dried lima beans, 11 baby lima beans and 15 black-eyed peas, scales
What to do:
1 Record the total number of isotopes in your sample.
2 Record the number of each of the isotopes in your sample.
3 Weigh each legumium isotope and record the mass in an appropriate table.
4 Use the equation below to determine the relative atomic mass of legumium. Average atomic mass Lg = (number of 4 Lg × mass 4 Lg) + (number of 5Lg × mass 5Lg) + (number of 6 Lg × mass 6 Lg) total number of isotopes
Questions
1 For each legumium isotope, show its mass, atomic number and symbol.
2 Identify the number of protons, neutrons and electrons in each isotope.
3 According to your sample, explain which legumium isotope is most common in nature.
Figure 1 The dried lima bean isotope of legumium.
4.4 Modelling radioactive decay CHALLENGE
This activity illustrates the idea of exponential decay and half-life. Counters represent the nuclei.
1 Draw up a table like the one below, to record your results.
Number of shakes Number of undecayed ‘atoms’ Trial 1Trial 2Trial 3
0 (start)
1 2
2 Draw an M on one side of each counter.
3 Count the total number of counters that you have, record this number and place them in the plastic cup.
4 Shake the cup and tip all the counters onto the paper.
5 Those that have the ‘M’ facing upwards represent atoms that have decayed. Move these to a ‘discard’ pile.
6 Count the remaining ‘nuclei’ and record this number.
7 Place the remaining nuclei back into the cup, shake them and tip them out again.
8 Move the decayed nuclei to the discard pile and count those remaining. Record the number.
9 Continue until you have three or fewer nuclei.
10 Repeat the whole process two more times.
11 Draw a set of axes with the number of atoms remaining (vertical axis) and the number of shakes (horizontal axis). Plot points and draw a line of best fit through the points for each of the three trials.
Questions
1 The atomic nuclei were represented by counters. Describe how the half-life of the decay process was represented.
2 Contrast the shapes of the curves drawn for each tr ial.
3 Explain how the overall shape of the cur ves would or would not change if you started with more atomic nuclei.
4 In this experiment, you would eventually end up with no ‘undecayed’ counters. Evaluate whether this would be the case with a real radionuclide (by describing how atoms randomly decay in real life, comparing this to the counter demonstration and deciding whether every atom of a real radionuclide would become stable).
Aim
Comparing mass before and after a chemical reaction EXPERIMENT
To determine if mass is conserved in a chemical reaction.
Materials
> Sodium bicarbonate > Vinegar
PART A
Method
Balloon
Balance
Results
1 Copy the results table for Part A to record your results.
2 Weigh 2.0 g of sodium bicarbonate onto a watch glass
3 Add 20 mL of vinegar to a flask.
4 Ensure the balance is reading zero. Weigh the vinegar and flask. Record this mass (M1).
5 Predict whether the mass of the flask and vinegar after the reaction with the sodium bicarbonate will be more, the same or less than the initial mass.
6 Add 2 g of sodium bicarbonate (M2) to the flask containing the vinegar and swirl until the bubbling stops.
7 Weigh the flask after the reaction has stopped. Record the final mass (M3).
Figure 1 Sodium bicarbonate
Table 1 Results table
PART B
Method
1 Copy the results table for Part B to record your results.
2 Weigh 2.0 g of sodium bicarbonate onto a watch glass.
3 Add 20 mL of vinegar to a flask.
4 Ensure the balance is reading zero. Weigh the vinegar, flask and a balloon. Record this mass (M1).
5 Predict whether the mass of the flask, vinegar and balloon after the reaction with the sodium bicarbonate will be more, the same or less than the initial mass
6 Add 2 g of sodium bicarbonate (M2) to the balloon and carefully stretch the opening of the balloon over the neck of the flask so that the sodium bicarbonate does not spill.
7 Hold the end of the balloon directly over the top of the flask so that the sodium bicarbonate spills into the vinegar (keeping the contents sealed).
8 Weigh the flask, with the balloon still attached, after the reaction has stopped. Record the final mass (M3).
Results
Table 2 Results table
Mass of flask, vinegar and balloon ( M1)
Mass of sodium bicarbonate ( M2 )
Total mass before reaction ( M1 + M2 )
Mass after reaction ( M3)
Discussion
1 Compare the initial and final masses for each part of the experiment.
2 Compare the results with your prediction.
3 Identify the gas that was produced.
4 Describe the purpose of sealing the flask with the balloon.
5 Describe the purpose of the control for this experiment.
6 Identify a possible error for this experiment. Descr ibe how this error could be minimised.
Conclusion
Compare the results of this reaction to the law of conservation of mass.
Figure 2 Hold the end of the balloon directly over the top of the flask.
5.2 Modelling chemical equations CHALLENGE
Aim
To model the rearrangement of atoms in a chemical reaction.
What you need:
Paper bags, model atom kit (or laminated squares labelled oxygen (O-blue) atom, carbon (C-black) atom, hydrogen (H-white) atom), felt-tipped pen
PART A
What to do:
1 Each paper bag represents a molecule. Create a molecule of oxygen (O2) by placing two oxygen ‘atoms’ in a paper bag. Write ‘O2’ on the bag.
2 Use two paper bags and four model hydrogen atoms to create two molecules of hydrogen (H2). You have now created the reactants in the chemical reaction:
2H2 + O2 2H2O
3 Label the two remaining paper bags ‘H2O’. Take the model atoms out of the reactant bags and place them in the product H2O bags. Are there enough atoms to fill the H2O bags?
PART B
What to do:
1 Use new bags and the model atoms to create two molecules of methane (CH4).
2 Identify the number of oxygen molecules (O2) that you would need to turn these methane molecules into carbon dioxide (CO2) and water (H2O). Use the bags and model atoms to check your prediction.
Discussion
1 Explain why there needed to be more molecules/bags of hydrogen than oxygen.
2 Describe what would happen if one more molecule of oxygen was added to the reaction.
3 Compare this model reaction to the law of conservation of mass.
DRAFT
Discussion
1 Identify the number of oxygen molecules you needed to balance this equation.
2 Identify the number of carbon dioxide and water molecules you were able to create with two methane molecules.
3 Write the word equation for this reaction.
4 Write the balanced chemical equation for this reaction.
Figure 1 Use paper bags to represent molecules.
Aim
To examine how froth flotation can be used to concentrate metal minerals.
What you need:
4 test tubes, test-tube rack, 4 test-tube stoppers, sample of crushed quartz, galena, distilled water, xanthate solution (collector), detergent
What to do:
1 Add 5 cm of distilled water to test tube 1.
2 Add a stopper to the top of the test tube and shake. Record your observations.
3 Add 10 drops of xanthate solution and 10 drops of detergent to the test tube.
4 Add a stopper to the top of the test tube and shake. Record your observations.
5 Repeat steps 1–4 with distilled water and cr ushed quartz samples.
6 Repeat steps 1–4 with distilled water and galena.
7 Repeat steps 1–4 with crushed quartz and galena.
Results
Table 1 Results table
Test
1
2
3
Distilled water
Distilled water + xanthate
Distilled water + xanthate + detergent
Distilled water + quartz
Distilled water + quartz + xanthate
Distilled water + quartz + xanthate + detergent
Distilled water + galena
Distilled water + galena + xanthate
Distilled water + galena + xanthate + detergent
4
Distilled water + crushed quartz + galena
Distilled water + crushed quartz + galena + xanthate
2 Describethe effect of the collector xanthate on the mixture.
3 Describe how this process could be used to concentrate the mineral in mining.
Aim
Electrolysis of copper sulfate EXPERIMENT
To use electricity to produce copper metal from copper(II) sulfate through electrolysis.
Materials
> Copper(II) sulfate
> 100 mL beaker
> Stirring rod
> Spatula
> DC power supply
> 12V globe and globe holder
> Wires with alligator clips
> 2 carbon rods
> Gloves and safety glasses 5.3B
Method
1 Add one spatula of the copper(II) sulfate to the beaker and half-fill it with water.
2 Stir until the crystals are all dissolved.
3 Set the power supply to a maximum of 6V and connect the circuit as shown in Figure 1.
4 Touch the carbon rods together to check the circuit works and then place the carbon rods in the beaker with a 1 cm gap between them.
5 Hold the rods in place for 30 seconds and observe any changes that occur.
6 Turn off the power supply.
Results
Record your observations in an appropriate format.
Discussion
1 Describe the evidence that copper was formed in the reaction.
2 Consider the structure of the copper sulfate when describing the:
> role of the electricity
> reason that the copper was only found on one of the carbon electrodes.
3 Evaluate if a usable amount of copper could be produced this way (by describing the amount of energy used and the amount of copper produced in the time and deciding if it would make an effective business model). If not, describe the changes that would need to be made to the set-up to produce more copper.
Conclusion
Describe what you know about electrolysis.
DRAFT
Figure 1 Connect the circuit.
Figure 2 Copper sulfate
6.2 Modelling a carbon sink CHALLENGE
CAUTION: Dry ice is frozen carbon dioxide (–79°C). Do not touch the dry ice with your fingers or metal objects. Use wooden or plastic tongs. Do not seal dry ice in any container as the gas expands rapidly.
This activity may be demonstrated by your teacher.
Aim
To model the effects of a carbon sink.
What you need:
Dry ice, 100 mL water, universal indicator, 200 mL bea ker, piece of netting, watch glass that covers the top of the beaker, sticky tape, wooden or plastic tongs
What to do:
1 Place the water in the beaker.
2 Add 5 drops of universal indicator to the water.
3 Place the netting over the top of the beaker and push down the centre slightly. This will provide a pouch to suspend the dry ice above the water. Use sticky tape to hold the netting in place.
4 Place a piece of dry ice in the netting and place the watch glass over the top of the beaker.
5 Observe any colour changes in the water.
Discussion
1 Describe what happened to the solid dry ice when it was sitting in the netting.
2 Describe any changes you noticed in the water and universal indicator.
3 Identify the final pH of the water.
4 Provide an explanation for the changes you noticed.
5 Define the term ‘carbon sink’.
6 Describe how you could use this demonstration to explain the consequences of increased carbon dioxide levels in the atmosphere.
Figure 1 Dry ice is frozen carbon dioxide.
6.3 Combustion and candles CHALLENGE
Aim
To investigate the combustion reaction in a lit candle.
What you need:
Tealight candle, beaker large enough to fit over candle, matches
What to do:
1 Light the tea candle with a match.
2 Place the beaker over the candle and observe what happens.
Questions
1 Identify the fuel for the chemical reaction occurring with the candle.
2 Explain why the candle goes out shortly after being covered with the beaker.
3 Describe the moisture on the inside of the beaker. Identify the source of this water.
4 Write a word equation for the combustion of the candle wax.
DRAFT
Figure 1 Use a tea light and beaker to investigate combustion.
6.5
Aim
What factors affect a greenhouse? EXPERIMENT
To determine which surfaces of the Earth absorb energy and radiate it as heat and so are likely to contribute most to the warming of the atmosphere.
Materials
> 3 cups of dark soil
> 3 cups of white sand or perlite
> White paint and brush
> Water
> 6 identical clear, empty 600 mL soft-drink bottles with labels removed
> 6 one-hole rubber stoppers with thermometers inserted that fit securely into the bottle top or
Method
data-logging equipment using long steel temperature probes with Blu Tack to secure the probe in place
> Sunlight or portable reflector lamp with 150W floodlight bulb
> Funnel
> Stopwatch
> Marker pen
> Stand to support the lamp set-up (retort stand and clamps)
1 Work as a group and label the bottles A, B, C, D, E and F. Paint the upper one-third of bottles B, D and F white to represent cloud cover.
2 Use a funnel to fill the base of bottles A and B with dark soil, bottles C and D with white sand or perlite, and bottles E and F with room-temperature water. Ensure that you use the same depth (5–7 cm) in each bottle.
3 Put the thermometers inserted in the r ubber stoppers into the bottle tops. Ensure that the bulbs are just above the top of the dirt, sand/perlite and water. If the bulbs are below the base, they may record the heat absorbed directly by the soil or water, which will affect your data. You want to measure the temperature of the air (atmospheric). If using a data-logger temperature probe, secure and seal into the top of the bottle with Blu Tack.
4 Record the initial baseline atmospheric temperature of each bottle in a table.
5 If it is a sunny day, take your bottles outside. Alternatively, set up the 150W light source on a stand facing down. Place the bottles underneath the light source approximately 15 cm away from the lamp. It is important that all bottles receive equal light. Depending on your light source, you may be only able to do two bottles at a time. If this is the case, ensure the two bottles have the same base; for example, dirt.
6 Record in an appropriate table, the temperatures of each bottle every 2 minutes for at least 20 minutes. Calculate the mean temperature of each bottle filling and record it in the table.
Results
Predict which bottle will reach the highest temperature and justify your prediction.
Draw a graph of time (in minutes) against the mean bottle temperature to record your observations.
Discussion
1 Use the graph to compare the rate of increasing temperature for the different bottles.
2 Identify which bottled environment: a produced the lowest temperature b would lead to the least heating of the atmosphere.
3 Explain the temperature difference between the dark soil and the white sand/perlite.
4 Explain the temperature difference between the water and the white sand/perlite.
5 Explain how this experiment demonstrates the effect of the oceans and dark and light surfaces on air temperature.
6 If the deserts are increasing and ice is melting, exposing dark soil, describe the expected effects this will have on atmospheric temperature.
7 Explain why each bottle filling was duplicated in this exper iment.
Conclusion
Summarise your key findings from this experiment.
Figure 1 Water absorbs heat.
6.6 Measuring carbon farming CHALLENGE
The key to measuring the amount of carbon stored in a tree is the size of the tree. Bigger trees are usually older and have therefore had more time to photosynthesise (capture carbon dioxide from the atmosphere). The size of the tree can be determined by the girth (circumference) of the tree at chest height (1.3 m above the ground)
Aim
To determine the amount of carbon stored in a tree.
What you need:
Calculator, tape measure
What to do:
1 Identify a tree in the grounds of your school.
2 Use a tape measure to measure the circumference of the tree at 1.3 m above the ground. Repeat this measurement two more times.
3 Calculate the mean girth of the tree.
4 Use Table 1 to determine the dr y weight of the tree.
Table 1
5 Half the dry weight of a tree is carbon. Divide the mean dr y weight of the tree by 2.
6 Record the amount of carbon stored in the tree you measured.
Questions
1 Identify the name of the process used by the plant to extract carbon dioxide from the atmosphere.
2 Describe reactants and products in the chemical reaction you named in the previous question.
3 Calculate the amount of carbon dioxide that was absorbed by the tree to create this store by multiplying the amount of carbon stored by 3.67.
4 Describe what would happen to the carbon stored in the tree if it was chopped up for firewood.
5 Describe what would happen to the carbon stored in the tree if it was turned into furniture or used to build a house.
Aim
Investigating heating by convection EXPERIMENT
To investigate heating water by convection.
Materials
> Water
> Potassium permanganate crystals (or a few drops of food colouring)
Method
> Bunsen burner
> Tripod
> Heatproof mat
> 600 mL beaker
> Dropper or pipette
1 Set up the experiment as shown in Figure 1.
2 Fill the beaker with water. Put individual crystals of potassium permanganate on the bottom of the beaker, at the edge. Alternatively, add a drop of food colouring to the bottom of the full beaker using a dropper or pipette.
3 Heat the water gently over the Bunsen burner and observe the movement of the crystals. (If possible, use a small flame and no heatproof mat between the Bunsen burner and the beaker – you can do this with Pyrex beakers.)
4 Note the path that the coloured water takes from the burner to the top of the water and back down again.
Results
Draw a labelled diagram showing the movement of the coloured water.
Figure 1 Experimental set-up
Discussion
1 Define the term ‘convection’.
2 Define the term ‘conduction’.
4 Describe the movement of the coloured water.
5 Use the terms conduction and convection to explain how the movement of water particles changes as they are heated.
6 Use the movement of the particles in the water to explain the movement of the coloured water.
7 Plan an experiment to test the scientific question ‘What if?’
Conclusion
Describe what you know about heating water by convection.
7.1B Testing insulating materials EXPERIMENT
Different materials have different thermal properties. The ability of a material to resist the transfer of thermal energy is called the R-value of the insulation. The higher the R-value, the more it is able to resist the flow of thermal kinetic energy and the better an insulator it will be.
Aim
To test the insulating properties of different materials.
Materials
> 5 × 50 mL beakers
> 5 ice cubes (approximately the same size from ice trays)
> Stopwatch
> Low temperature hot plate
> Scales
Method
> A variety of different mater ials with insulating properties (newspaper, tissues, newspaper, cotton balls, Styrofoam, aluminium foil, petroleum jelly, Cheetos, etc.)
1 Write a hypothesis identifying which materials will have the highest R-value.
2 Select 4 materials to test.
3 Add 2 cm of each material to the bottom of an individual beaker. Leave the fifth beaker without any material in the base.
4 Turn the hot plate on a low temperature. Place each beaker on the hot plate so that they are exposed to the same amount of thermal energy.
5 Weigh and record the mass of each ice cube.
6 Place a single ice cube in the centre (on top of the materials) of each beaker.
7 Leave the ice cubes exposed to the thermal energy for 20 minutes.
8 Weigh the final mass of each melted ice cube.
9 Calculate the change in mass of each ice cube.
Results
Draw a table to record the initial mass, final mass and change in mass of each ice cube.
Discussion
1 Define the phrase ‘thermal insulator’.
2 Describe how the thermal energy of the hot plate was transferred to the ice.
3 Describe how the thermal energy affected the water particles in the ice.
4 Identify the material that had the: a highest thermal insulating property b lowest thermal insulating property.
5 Design a valid experiment that would investigate the question ‘What if the amount of thermal insulator was doubled?’
Conclusion
Describe what you know about the insulating properties of the different materials used in this experiment.
7.2 Modelling sound waves
Aim
To explore sound waves and frequencies.
What you need:
Slinky spring, pipe cleaner
What to do:
1 Twist a pipe cleaner around a single curl in the slinky spring so that the rest of the spr ing can move easily.
2 Two people slowly stretch the spr ing out along the floor – slightly beyond its normal length. Allow the spring’s movement to become still.
3 One person pushes their end of the spring firmly forwards, towards the other person, and then returns it to the rest position. This will create areas where the coils are pushed together (compressions) and areas where the coils are stretched out (rarefactions). These areas will travel along the spring to the other end. The person at the other end needs to hold the spring firmly and still.
4 Try to make the wave have more or less energy by pushing the end faster, while keeping the length of the wave the same. This is the same as making a sound louder. Pushing less models a softer sound.
5 Try to change the frequency (number of waves per second) of your wave. Try to create 4 waves per second (a higher frequency) and 0.5 waves per second (a lower frequency).
6 Draw labelled diagrams of the waves you created, carefully indicating how the waves show that different frequencies have been achieved.
Questions
1 Describe how far the pipe cleaner moved as the wave moved along the spr ing.
2 Describe what happened when the wave reached the other end of the spring.
3 Compare the model wave bouncing back from a hard surface to an echo
4 Describe how the model can be used to represent higher frequency sound waves.
5 Explain how the distance between the compressions is affected in lower frequency waves.
Figure 1 Experimental set-up
7.3A The speed of sound CHALLENGE
Aim
To explore the speed of sound on the school oval. (This is a whole class activity.)
What you need:
Tape measure or trundle wheel, stopwatches, ‘slap sticks’ (or two large sticks that make a sound when hit together)
What to do:
1 On the school oval, measure a distance of 100–200 metres
2 One person takes the slap sticks to the far end of the measured distance. When everyone is ready, slap the sticks together to make a noise.
3 The rest of the class should start their stopwatches when they see the sticks hit together and stop them when they hear the ‘slap’.
4 Repeat this measurement five times.
5 Record your measurements in a table.
Questions
1 Explain why you need to repeat this measurement many times.
2 Calculate the average amount of time it took for sound to travel the measured distance.
3 Use the formula:
Speed = distance travelled (m) time (s) to calculate the approximate speed of sound.
4 Compare your measurement to the accepted value of 340 m/s. Explain any differences between the two measurements.
DRAFT
Figure 1 Use a stop watch to measure the speed of sound.
Aim
To identify whether sound will travel faster in gas or liquid.
What you need:
Large set of dominoes, metre ruler
What to do:
1 Set up two rows of dominoes 1 metre long on the floor (Figure 1). One set of dominoes should be spaced far apar t from each other (but still close enough to knock each other over) while the second set of dominoes are much closer together.
2 Use the metre ruler to knock over the fir st domino of each row at the same time.
Questions
1 Identify which row of falling dominoes reached the finish line first. Explain a possible reason for this result.
2 Compare the space between the dominoes in rows 1 and 2 to the space between the par ticles of liquids and gases.
3 Use the evidence from your model to identify whether sound will travel faster in gas or liquid
Row 1 1 metre Row 2
Figure 1 Experimental set-up
7.4A Demonstrating electrostatics
Aim
To model and explain electrostatic electricity.
What you need:
Plastic comb, woollen cloth, Rice Bubbles, large plastic bag with tie, plastic rod or pen, small pieces of paper, balloons, balloon pump, felt-tipped pens, string, tape
PART A
What to do:
1 Place some of the Rice Bubbles in the plastic bag. Blow air into the bag and seal it with the tie.
2 Rub the woollen cloth over both the plastic bag and the comb.
PART B
1 On a piece of paper, draw four positive and four negative charges. Show what happens to these charges when the positively charged woollen cloth is brought close to them.
PART C
1 Using the balloon pump, blow up a balloon and carefully draw a face on it.
2 Tie the balloon onto a string and suspend it from a doorway or ceiling using tape, so that it is level with your head.
3 Rub the balloon face with the woollen cloth and walk towards it.
4 Record what happens.
> Identify the distance from the ‘balloon face’ you have to be before it is attracted to you.
> Describe what happens if you put a piece of paper between you and the balloon.
5 Blow up another balloon and draw a face on it.
> Describe what happens when you bring it close to your suspended balloon.
3 Bring the plastic bag and comb together.
4 Record what happens.
5 Explain your observations, using the idea of electrostatic charge.
2 Explain why the paper is attracted to the plastic rod or pen by discussing the movement of charges.
Questions
1 Describe your observations in Part A using the terms ‘like charges’, ‘unlike charges’ and ‘neutral or no charge’.
2 Describe your observations in Part B using the terms ‘like charges’, ‘unlike charges’ and ‘neutral or no charge’.
3 Describe your observations in Part C using the terms ‘like charges’, ‘unlike charges’ and ‘neutral or no charge’.
DRAFT
Figure 1 Can you explain the attraction of the balloon?
Aim
Separating charges with a van de Graaff generator
To use a van de Graff generator to demonstrate electrostatic electricity.
What you need:
Paper streamers, van de Graff generator, smaller sphere connected to discharge wand, small pieces of paper, aluminium plates, paper cup with Rice Bubbles
What to do:
1 Observe what happens to objects that have been charged by a van de Graaff generator. Record your observations in a table.
2 Your teacher may demonstrate any of the following:
a a smaller sphere held near a larger sphere b paper streamers attached to the top
c paper streamers held nearby d long dry hair nearby e small pieces of paper thrown on top f aluminium plates placed on top g paper cup with Rice Bubbles inside.
Questions
1 Describe the three rules of electrostatic charges.
2 Explain what happens in each example, using your knowledge of electrostatic charge.
DRAFT
Figure 1 What happens to paper streamers?
7.5 Making series and parallel circuits CHALLENGE
Aim
To compare the current in series and parallel circuits.
What you need:
2 × 1.2 V globes and holders, 1.5 V battery and holder, 8 connecting wires (with banana plugs or alligator clips), switch, ammeter or multimeter
What to do:
1 Construct four circuits, placing the switch so that it controls:
a both globes, with both either on or off at the same time
b one globe only, with the other on all the time
c the other globe only, with the first globe on all the time
d both globes, with one globe on when the other is off and vice-versa.
Complete step 2 before you disconnect each circuit.
2 Draw the circuit diagram to show where the switch was placed in each circuit.
3 Connect an ammeter at different places in each circuit and measure the current at each point.
Questions
1 Describe the effect of changing the location of the switch in a simple circuit.
2 Define the term ‘current’.
3 Describe how an ammeter should be connected to measure the current in a circuit.
4 Describe how the current did or did not change when the ammeter’s location was changed.
Figure 1 How many ways can you connect multiple globes in a circuit?
7.6A Using Ohm’s law to find resistance SKILLS LAB
Aim
To use Ohm’s law to determine current, voltage and resistance.
Example
Find the value of a resistor that has a voltage drop of 6 V across it when a current of 50 mA flows through it.
1 Check the units: 6 V is in volts and so can be used unchanged. You will need to convert 50 mA (milliamps) to amps. The prefix ‘milli’ means 0.001 (or × 10–3), so 50 mA = 50 × 0.001 or 0.05 A.
2 Use the Ohm’s law triangle to find the cor rect formula. You want to find resistance, so use your fingertip to cover the R – the other two letters show you the formula to use (Figure 1).
The V is over the I, so use: R = V I
Figure 1 Using the Ohm’s law triangle
3 Substitute the numbers for V and I: R = 6 0.05
4 Do the calculation: 6 ÷ 0.05 = 120 Ω.
Your turn
This law can also be used to work out the voltage or the current.
1 Calculate the voltage drop across a resistor with a value of 180 Ω and a current of 50 mA. (Remember to cover V in the Ohm’s law triangle to get the correct formula for R and I. If the letters are next to each other, multiply them.)
2 If a 12 V battery is placed in a circuit with a 470 Ω resistor, calculate the current that will flow through the circuit.
3 If the current of a circuit with a 12 V battery is 0.004 A, calculate the resistance of the circuit.
7.6B Understanding resistor colour codes
Aim
To use the coloured banding of a resistor to determine its value.
What you need:
A selection of coloured resistors
What to do:
Carbon resistors typically have four colour-coded bands on their case (Figure 1). These bands are part of a code that allows you to work out their approximate value and tolerance. The fourth band is the tolerance band, which indicates the amount that the resistance may vary by (the relative accuracy of the resistor). Gold means 5 per cent tolerance, silver means 10 per cent tolerance, and no fourth band means 20 per cent tolerance. The lower the percentage tolerance, the more accurate (or closer to the true value) the resistor is.
1
To read the three other bands, put the tolerance band on the right and start at the other end. The first two bands form a two-digit number according to their colour (see Table 1). The third band tells you how many zeros to put after the number.
Table 1 Resistor colour codes
SKILLS LAB
Look at the resistor in Figure 2. What does its code mean?
1 The tolerance band is gold, so the resistor has 5 per cent tolerance.
2 The first band is blue, so it has a value of 6.
3 The second band is red, so it has a value of 2. The number is now 62.
4 The third band is also red, so this means 2 zeros need to be added to the number. The number is now 6200.
5 Resistor values are always coded in ohms, so the value of this resistor is 6200 ohms or 6.2 kilo-ohms.
DRAFT
Figure 2 Calculate the value of this resistor.
Collect a resistor from your teacher and use the coloured bands to determine its value.
Discussion
1 Define the electrical term ‘resistance’.
2 Explain why different resistors may need to be used in different circuits.
3 Explain what is meant by the term ‘tolerance’.
Figure
A resistor with colour-coded bands
7.6C Investigating Ohm’s law EXPERIMENT
Aim
To investigate the voltage drop across and the current flow through a resistor, and to calculate an average value of the resistance.
Materials
> 2–12 V power supply
> Ammeter
> Voltmeter
> 10 Ω resistor
Method
> 3 other resistors with masking tape over their coloured bands
> Connecting wires
1 Identify the 10 Ω resistor. It should be colour-coded brown, black, black.
2 Connect the circuit as shown in Figure 1. Use the DC terminals of the power supply and start with the dial on 2 V.
3 Switch on the power supply, take the readings on the ammeter and voltmeter, and switch the power off again straight away (so you don’t overheat the resistor).
4 Change the dial on the power supply to 4 V and repeat step 3. Then change the dial to 6 V and repeat.
5 Record your results in Table 1.
Table 1 Experiment results
Resistor Voltage (V) Current (mA)Volts ÷ amps
6 Repeat the experiment for the other three resistors, without reading their coloured bands.
7 Complete the results table for each of the three masked resistors and calculate their resistance.
8 Remove the masking tape and determine the resistance values from the coloured bands of the resistors.
Results
Include your results table.
Discussion
1 From your results table, identify what the values in the last column calculate.
2 For the three masked resistors, compare the accuracy of the values you obtained to the values indicated by their coloured bands.
3 Use the formula below to calculate the difference (er ror) between the two values as a percentage of the marked value.
% error = marked value – average calculated value × 100 marked value
4 Identify which value – the one obtained by reading the coloured bands or the one obtained from your calculations – provides the most useful measure of a resistor’s resistance. Justify your answer (by explaining how each value is obtained, describing which value is most relevant to use in a circuit and deciding which value provides the most useful measure).
Conclusion
Describe what you know about Ohm’s law.
Figure 1 Circuit set-up
7.7 Modelling light waves CHALLENGE
Aim
To model and explore light waves.
What you need:
Slinky spring, clear space on the floor
What to do:
1 Two people hold the spring, one at each end. On the floor, slowly stretch the spring out slightly beyond its normal length. One person flicks their end of the spring firmly to one side. This will create a sideways ‘pulse’ in the spring. The other person needs to hold the spring firmly and still. The pulse will travel along the spring to the other end (Figure 1).
2 Continue flicking the spring to create a continuous transverse wave. Identify the peaks and troughs of the wave.
3 Make the wave have more or less energy by changing how hard you flick the end. Try to keep the speed of the wave the same.
4 Increase the number of waves per second. You have just modelled a wave of higher frequency.
5 Try to reduce the number of waves. This model represents a lower frequency wave.
6 Draw labelled diagrams of a high frequency wave and a low frequency wave. Identify the wavelength in each diagram.
Questions
1 Describe how you modelled higher frequencies with your model light waves.
2 Explain how increasing the frequency affects the distance between the peaks of the wave (wavelength).
3 Identify another example of a transverse wave that exists in the real world.
Figure 1 Flicking the slinky creates a pulse.
7.8A Using a Hodson light box SKILLS LAB
Aim
To learn how to use a Hodson light box.
What
you need:
A Hodson light box, sheet of white A4 paper, pencil, ruler
What to do:
1 Place the light box on a piece of white A4 paper.
2 Plug the light box into either the AC or DC sockets of a power supply. The voltage dial controls the brightness of the light globe.
3 Slide a slot former into the opposite end of the light box to where the mirror flaps are. Usually a single-slot or a threeslot former is used.
4 Aim the light ray at the target, in this case a plane mir ror.
5 Use a sharp pencil to mark the incident and reflected rays with dots.
DRAFT
6 Remove the light box and join the dots with thin, straight pencil lines.
Figure 1
Figure 2
Figure 3
Figure 4
Figure 5
Figure 6
Aim
Reflection from plane mirrors EXPERIMENT
To investigate the law of reflection: the angle of incidence equals the angle of reflection.
Materials
> Hodson light box kit
> Power supply
> Sheet of white A4 paper
> Plane mirror from light box kit
Method
> Blu Tack
> Ruler
> Pencil
> Protractor
1 Rule a straight line in pencil centrally across the width of the A4 paper. The mirror surface will be placed along this line.
2 Use the protractor to construct a normal line at 90° in the centre of the fir st line.
3 Position the back edge of the plane mirror along the first pencil line. Keep it in place with Blu Tack.
4 Set up the Hodson light box, darken the room and aim a single incident ray at the centre of the mirror where the normal begins. Mark the position of the incident and reflected rays with pencil dots.
5 Move the light box to a different angle and aim another incident ray so that it hits the mirror at the same place as it did the first time. Mark the incidence and reflection rays by drawing arrows. Label the lines A.
6 Repeat step 5 until five sets of lines are obtained. Label each set of lines B, C, D, etc.
Results
1 Remove the light box and rule lines to show the straight path of the incident and reflected rays
2 Carefully use the protractor to measure the five angles of incidence and the five angles of reflection for each set of lines A, B, C, etc.
3 Move the protractor so that the 0° of the protractor is along the normal. Read the angle between the normal and each incident ray, and between the normal and reflected rays.
4 Record your results in a suitable table.
Discussion
1 Explain why the back edge and not the front edge of the plane mirror should be lined up on the pencil line.
2 Compare your angles of incidence to your angles of reflection. Explain how they support the law of reflection.
3 List two possible sources of error in this experiment.
4 Describe what happened when you directed the light at right angles to the mirror.
5 Explain whether the law of reflection is still obeyed if the angle of incidence is 0°.
6 List at least 3 examples where you have observed the law of reflection in action.
Conclusion
Describe what you know about the relationship between the angle of incidence and the angle of reflection.
Aim
To discover the level of difficulty involved in using mirror reflection.
What you need:
Large plane mirror, logbook/workbook, pencil Figure 1
What to do:
1 Hold a large plane mirror in front of your page in your logbook and try to write your name so that it is legible in the mirror. Practise with other words until you get good at this.
2 In some countries, ambulances have their name spelt backwards so drivers can see it in their rear-view mirror. See if you can work out how to write the word ‘ambulance’ backwards in capital letters so it would read correctly when viewed this way. Have a friend hold the word up behind you and hold the mirror up in front of your eyes.
3 Draw a short maze, then attempt to guide your pen through the maze by only looking in the mirror. A friend could cover the real maze so you are not tempted to look. Just look in the mirror.
Questions
1 Contrast the level of difficulty in the three activities.
2 Describe how practice will change the level of difficulty of these tasks.
1 Place an object, such as a pen tip, close to the convex mirror and observe the image. Try to describe the nature of the image.
> Upright or inver ted (upside down)?
> Larger (magnified) or smaller (reduced) than the object?
> Real (capable of being captured on a screen or piece of paper) or virtual?
2 Move the object further from the mir ror and repeat your observations.
3 Repeat step 1 with a concave mir ror. It is possible to form a real image with a concave mirror and there is more variation in the nature of the image as the object is moved further from the mirror.
4 Summarise your findings in a table that compares the two types of mirrors.
5 Use the Hodson light box kit to investigate curved mirrors. There should be a convex and concave mirror in the kit. Use the three-slot former in the kit to draw diagrams of the incident and reflect rays for both types of curved mirrors.
Discussion
1 Identify the mirror that converges (brings together) the rays.
2 Identify the mirror that diverges (spreads apar t) the light rays.
3 Describe how your appearance would change if you viewed your image in concave and convex mirrors.
4 Describe how a shop uses mirror s to make their clothes and clients look thinner.
Figure 1 The type of curve on a mirror affects its behaviour.
Aim
Bending of light EXPERIMENT
To investigate the path of light rays during the process of refraction.
Materials
> Hodson light box kit
> Power supply
> Sheet of white A4 paper
> Perspex block from light box kit
Method
> Blu Tack
> Ruler
> Pencil
> Protractor
1 Place the Perspex block in the centre of the A4 paper Trace around the outside of the Perspex block with your pencil.
2 Remove the block and use the protractor to construct a normal at 90° to one of the long sides of the block.
3 Position the block on the paper again. Keep it in place with a thin amount of Blu Tack.
4 Set up the Hodson light box, darken the room and aim a single incident ray at the face of the block at the normal line. Draw the incidence and reflection ray using arrows to identify each.
5 Move the light box so that the ray is aimed at the face of the block at an angle of approximately 45°. Mark the position of the incident ray and the ray that exits the block on the other side with pencil dots. Ignore any reflected rays at this time.
6 Remove the block and turn off the light box. Use a ruler to draw the straight rays that you identified.
Results
1 Join the end of the incident ray to where it exits the block on the other side. Construct a normal to the face of the block where the ray exits.
2 Use the protractor to measure the four angles on your diagram. Line up the 0° line of the protractor along the normal each time and read the angles between the normal and incident rays and between the normal and the refracted rays. Record your results in two tables for refraction from air to Perspex and refraction from Perspex to air.
Discussion
1 Explain your observation when the incident light travelled along the normal.
2 Compare your angles of incidence to your angles of refraction as the light entered the Per spex block. Explain your observation.
3 Compare the size of the angle at which the light hit the glass block with the angle at which it leaves.
4 Identify which medium is most dense (air or the Perspex block).
5 Describe how the light ray moved (towards or away from the normal) as it moved into the Perspex block, and as it left the Perspex block.
6 Compare your results to the expected refraction of light.
7 Identify two possible sources of error in this experiment.
Conclusion
Describe what you know about the path of light rays during the process of refraction.
7.9B Creating images with convex lenses
Aim
To investigate the behaviour of a convex lens and the nature of the image produced at different object–lens distances.
Materials
> Hodson light box kit
> Candle
> Matches
> Convex lens
Method
> Lens holder
> Rulers (30 cm, 1 m)
> White paper screen
> Blu Tack
1 Determine the focal length of the lens by placing the lens on a piece of paper and shining three rays of light through it so the light converges into a single focal point. Measure the distance from the centre of the lens to the focal point. This is the focal length f. Double the focal length. This is called 2f
2 Light the candle. Mount the lens in the lens holder and check to see if the centre of the lens is in line with the candle flame. If not, raise it to the cor rect height.
3 Darken the room and position the lens at a distance of more than twice the focal length from the candle flame (the object). Try to capture an image on the paper screen by moving the screen slowly until a focused image of the candle is formed. Describe the size of the image compared to the object (magnified, same size or reduced), the type of image (real or virtual) and the orientation of the image (inverted or upright).
Table 1
4 Move the lens closer to the candle so that the object–lens distance is between f and 2f. Repeat your observations.
5 Repeat for the other lens positions in the results table. In some cases, the image may not form on the screen. Instead, it can be found by looking into the lens towards the candle flame. This will be a virtual image. In one case, there may be no image – real or virtual.
Results
Complete Table 1.
Discussion
1 Describe when the lens produced a real image and when it produced a virtual image.
2 Explain any other observations you made or ask your teacher about them.
3 Compare your results with those of other members of the class.
4 Identify one way you could improve your method to produce more reliable results.
Conclusion
Describe what you know about the behaviour of a convex lens and the images it produces.
Aim
What colour is it? EXPERIMENT
To investigate the addition of coloured light and explore the behaviour of coloured filters.
Materials
> Hodson light box kit
> Power supply
> Sheet of white paper
Method
1 Connect the light box to a power supply and place it on the sheet of paper
2 Place the three primary filters (red, green and blue) in each of the three separate slotted sections in the light box. Adjust the mirror flaps so that the colours can overlap on the paper. Change the combination of filters and copy and complete Table 1.
Table 1
Addition of primary colours Colour produced
Red + green + blue
Red + blue
Green + blue
Red + green
3 Replace one of the primary filters with the secondar y filters (yellow, cyan and magenta) and copy and complete Table 2.
Table 2
Addition of colours
Yellow (side slot) + blue (front slot)
Magenta (side slot) + green (front slot)
Cyan (side slot) + red (front slot)
Colour produced
4 Switch off the light box and remove the filter s. Select a red, green, blue and yellow oblique surface from the light box kit. Hold each of the coloured surfaces against the back of each primary filter. Record in Table 3 the colour that each surface appears.
Table 3
Surface colour Colour surface appears when viewed through a: Red filter Green filterBlue filter
Discussion
1 Identify the combinations of colours that produce white light.
2 Describe any patterns you observed in each of the tables. Explain the patterns you observed.
3 Identify one possible source of error in the experiment.
4 Describe the difficulties you had, and how you overcame them.
Conclusion
Describe what you know about what happens when coloured lights are added to each other.
Red Green Blue Yellow
Figure 1 Coloured filters
What is the wavelength of a microwave? EXPERIMENT
CAUTION! Some students might have egg allergies.
Aim
To determine the wavelength of a microwave.
Materials
> Microwave oven with the turntable removed
> Large flat plate at least 20 cm in diameter (safe for use in a microwave)
> Oven mitts
> Egg white
> Ruler
> Black cardboard
A microwave oven uses electromagnetic waves to heat food. These waves move through the cooking area in a set fashion. All microwave ovens have turntables to rotate food so that it cooks evenly. This is because of the wavelike motion of the energy. Without the turntable, the energy is focused in fi xed parts of the oven.
You can use this to determine the wavelength of the microwaves in your microwave oven.
Method
1 Crack the egg and separate the egg white from the egg yolk.
2 Spread the egg white evenly over the black cardboard.
3 Place the cardboard on the plate in the oven and turn on for 15–30 seconds (depending on the power of the microwave). The egg should start cooking in stripes/patches.
4 Remove the plate from the microwave and identify the centre of the cooked stripes/patches. Measure the distance between two of the cooked patches.
5 Repeat this experiment several times and determine an average distance between the cooked egg white.
Results
1 Record all your observations in a table.
2 Multiply the average distance between the cooked egg white by 2 to determine the length of a full wavelength.
Discussion
1 Identify the wavelength of the microwaves in your microwave oven.
2 Describe any difficulty you had when determining the centre of the cooked portion of egg. Calculate the error margin of your calculation (± the width of the cooked egg bands).
3 Explain why you needed to repeat your experiment several times.
Conclusion
Explain what you know about the wavelength of microwaves.
Figure 1 A microwave oven uses electromagnetic waves to heat food.
Figure 2 A microwave oven with the rotating platter removed and drive mechanism removed.
Figure 3 Using the cooked portions of the egg white to measure the distance between ‘hot spots’ in the microwave oven.
8.3 Design an energy-efficient house CHALLENGE
Design brief
Design and build two identical houses out of cardboard or wood. Add a feature to one of the houses that will make it more efficient in staying cool. Test your design feature by exposing both houses to an energy source (a strong light) and determine the rate of temperature increase for each house.
Criteria restrictions
> Only one feature may be added to the second house.
> The feature must represent a design feature that is currently available to homeowners.
> The feature must be proportionate in size to the house.
Questioning and predicting
> Identify the feature you will add.
> Identify the materials you will use.
> Use your knowledge of heat energy to explain why your added feature will keep the house cool.
Planning and conducting
> Explain how you will measure the temperature of the two houses.
> Describe how long you will expose the houses to the energy source.
Processing, analysing and evaluating
1 Describe the rate of temperature increase in both houses.
2 Describe how efficient your feature was at preventing the transfer of thermal energy.
3 Describe the limitations of your design (when it will not prevent thermal transfer).
4 Describe how you could create a large-scale version of your design for a real house.
5 Describe how you would modify your device if you were doing this experiment again.
Communicating
Present the various stages of your investigation in a formal experimental report.
Figure 1 General setup of experiment
[STEAM project 1] How can we use sustainable farming practices so that no one goes hungry in the future?
The United Nations ranks food shortages and hunger among the most serious issues affecting humankind. It predicts that more than 840 million people will be hungry by 2030. Even in a high-income country such as Australia, 5 per cent of the population are unable to access enough nutritious food. The experience of having inadequate access to food, or having an inadequate supply of food, is known as food insecurity. Food insecurity is linked to poor general health, higher rates of some cancers and higher mortality.
Rapid climate change is increasing threats to Australia’s and the world’s food security. Changes in the amount of rainfall, longer droughts and an increase in the number of extreme weather events are expected to disrupt the amount and quality of food that Australia can produce. A hotter climate is expected to cause stress in livestock animals such as chickens, sheep and cattle, and to increase the amount of water needed for crop irrigation.
Sustainable farming
Sustainable farming practices use methods that balance the needs of all members of the community. This means that new and old technologies are used to make sure that food production is:
• economically viable – if farmers cannot make enough money to survive, then the farming practice is not sustainable
• socially supportive – if the lifestyle of the farming community is not supported, then people will not want to live in the area
Your task
Increase the growing capacity (productivity) of a 1 hectare (100 m × 100 m) plot of land by designing a vertical garden that won’t damage the local environment.
• ecologically sound – if the local environment is not supported, then the land will be unable to support food production. Sustainable farming also works to maintain the diversity of the local wildlife.
Sustainable farming uses technology to increase the production of fresh, nutritious food while minimising the impact on the local environment.
Figure 2 Drought impacts Australia’s production of important crops, such as wheat.
Figure 1 Vertical farming allows people to grow more food in a smaller space.
HUMANITIES
In Geography this year, you will learn about food security around the world and food production in Australia. You will investigate the factors that influence crop yield (such as soil moisture) and how food production can alter a biome. In Economics and Business, you will study the agricultural resources (such as wheat) that form a large part of Australia’s trade economy.
To complete this task successfully, you will need to investigate the environmental constraints on agricultural production in Australia, such as climate and distribution of water resources. You will also need to understand the extent to which agricultural innovations have overcome these constraints.
You will find more information on this in Chapter 3 ‘Food security’, Chapter 2 ‘Biomes’ and Chapter 14 ‘Understanding the economy’ of Oxford Humanities and Social Sciences 9 Australian Curriculum.
MATHS
In Maths this year, you will build on your knowledge of measurement and geometry to determine areas and volumes of more complicated shapes. You will study right-angled triangles using Pythagoras’ theorem and trigonometry. You will also extend your skills in collecting, representing and investigating data.
DRAFT
To complete this task successfully, you will need to perform calculations involving angles, lengths and areas of two-dimensional and three-dimensional shapes. You will need to apply your understanding of scale factors to build a prototype of your designed product. To consider the situation at local, national and international scales, you will need skills in dealing with ratios and proportions. You may also find it helpful to use scientific notation for very large or very small numbers.
You will find help for applying these maths skills in Chapter 5 ‘Measurement’, Chapter 6 ‘Geometry’, and section 1E ‘Scientific notation’ of Oxford Maths 9 Australian Curriculum .
SCIENCE
In Science this year, you will learn about the carbon cycle and the ways human activity can disrupt it. You will also consider the consequences of disruption, including the enhanced greenhouse effect.
To complete this task successfully, you will need to understand the factors required to keep a system, such as a vertical garden, alive. You may need to consider how these factors can be monitored and controlled automatically. You will also need to be familiar with the scientific method, and understand how to conduct a fair test.
You will find more information on this in Chapter 6 ‘The carbon cycle’ of Oxford Science 9 Australian Curriculum
[STEAM project 1] The design cycle
To successfully complete this task, you will need to complete each of the phases of the design cycle.
experiencing and why it is important. Use the following phrase as a guide:
‘How can we help (the group) to solve (the problem) so that (the reason)?’
Discover
When designing solutions to a problem, you need to know who you are helping and what they need. The people you are helping, those who will use your design, are called your end-users.
Consider the following questions to help you empathise with your end-users:
• Who am I designing for?
• What problems are they facing? Why are they facing them?
• What do they need? What do they not need?
• What does it feel like to face these problems?
To answer these questions, you may need to investigate using different resources, or even conduct interviews or surveys.
Determine the criteria
1 What is the total area of the 100 m × 100 m plot of land? (Remember to use the correct units.)
2 If the plants are planted 25 cm apart in a 100 m row, and the rows are placed 1 m apart, how many plants could be planted in the plot of land? HINT: Draw the plot of land to make sure you reach maximum capacity.
3 What criteria will you use to measure the success of your solution or design? How will you measure how much the end-users have been helped?
Ideate
Before you start to design your vertical garden, you need to defi ne the criteria that you will use to test the success of your vertical garden in achieving your goal.
DRAFT
Define your version of the problem
Rewrite the problem so that you describe the group you are helping, the problem they are
Once you know who you’re designing for, and you know what the criteria are, it’s time to get creative!
As a group, brainstorm ways the problem can be solved. Remember that there are no bad ideas at this stage. One silly thought could lead to a genius innovation!
Once you have many possible solutions, it is time to sort them by possibility. Select three to five ideas that are possible. Research whether these ideas have already been produced by someone else. If they are already on the market, can you make a better version?
Build
Draw your top two vertical garden designs. Label each part of the designs. Include the materials that will be used for their construction.
Include in the designs:
a the total surface area available for plant growth b a description of how food production will be increased
c a description of how the design (inputs and waste) will impact the local ecosystem
d a description of how the workers will access all areas of the design to tend the plants
e at least one advantage and disadvantage of each design. Select one of the designs to take to the building and testing stage.
Build the prototype
You will need to build at least three versions of your vertical garden design prototype. The fi rst prototype garden will be tested for effectiveness. The second prototype will be used to survey the group you are helping. The third prototype will be used for the presentation. The prototype may be full size, or it may be a scale model (10 cm represents 1 m). Use the following questions as a guideline for your prototype:
• What materials will you use?
• What material will you use to represent the plants?
• How will you represent the height, width and angle of the finished prototype?
Test
Prototype 1
Use the scientific method to design an experiment that will test the effectiveness and strength of your fi rst vertical garden prototype. You will test the prototype more than once, to compare results, so you will need to control your variables between tests. What criteria will you use to determine the success of your prototype? Conduct your tests and record your results.
Prototype 2
If your prototype will be used to help market gardeners, then you will need to generate a survey to test whether the prototype is appropriate for their use. (How would they use it? Would they consider buying it?)
This helpful booklet will guide you step-by-step through the project.
What is the design cycle?
If your prototype will be used to help another group, or native plants and animals, you will need to consider how you could test the impact it will have. (Will the prototype affect normal behaviours? How will the prototype affect the soil or waterways?)
Prototype 3
Use the information you have obtained from testing the fi rst two versions to adapt your last prototype to be more effective and usable for the group you are helping. You may want to use the fi rst two prototypes to demonstrate how the design has been improved.
Communicate
Present your vertical garden design to the class as though you are trying to get your peers to invest in it. Describe the criteria and testing used to measure the effectiveness of your vertical garden design.
In your presentation, you will need to:
• explain why we need to be more efficient with food production
DRAFT
• describe the key features of your design and how they improve or solve the problem of food shortages
• show a labelled, to-scale diagram of your prototype
• describe how the ecosystem will be affected by the installation of the prototype
• explain the relevant scientific principles that support your designed solution (e.g. water cycle, photosynthesis, nitrogen/carbon cycle)
• quantify the increase in food production that your design allows; present calculations to justify your claim
• present a calculation for the estimated cost of producing a full-size model of your design
• explain the implications of your design at a state or national level, by comparing the benefits and costs.
This video will help you to better understand each phase of the design cycle. How to manage a project
This ‘how-to’ video will help you to manage your time throughout the design cycle.
How to define a problem
This ‘how-to’ video will help you to narrow your ideas down and define a specific problem.
[STEAM project 2] How can we harness technology so that we can live healthier lives?
A disorder or disease is a condition that affects the normal functioning of the body. Different disorders and diseases can affect many parts of the body. They can be caused by infectious agents such as bacteria or viruses that spread from person to person. Some disorders or diseases are inherited. Environmental factors (such as pollution or diet) can also have an impact on the development of disorders or diseases.
Heart disease, a non-infectious disease, is the leading cause of death globally. Mental health disorders, such as depression, bipolar disorder and dementia, also affect many people around the world.
Disorders and disease affect both highincome and low-income countries, but there are large differences in the ability of different healthcare systems to provide adequate care for people. The need for low-cost health care has led many researchers to investigate how technology can be used to help people live healthier lives.
Prevention of disorders and disease
There are many disorders and diseases that can be prevented through simple, low-cost interventions. Below are a few examples.
• Wearing a helmet or a seat belt has been shown to decrease the risk of brain injury from a road accident. In Vietnam, when wearing a helmet was made mandatory for motorcycle riders, it resulted in a 16 per cent decrease in head injuries.
• The use of mosquito nets can help to prevent malaria, a disease that can lead to life-long neurological impairment, such as epilepsy in children if they have a severe infection.
Your task
Develop a strategy to help prevent a disorder or disease within a
infectious disease.
• Providing vaccinations for viruses such as polio and meningitis can also prevent neurological conditions.
• Promoting a healthy lifestyle and educating the population about the importance of diet can reduce the prevalence of stroke. In Japan, campaigns and treatment for high blood
Figure 1 During the 1918 flu pandemic (sometimes called the Spanish flu), an estimated 500 million people, or a third of the world’s population, were infected with the virus
chosen at-risk group.
Figure 2 Healthcare workers wear personal protective equipment (PPE) to prevent the spread of
HUMANITIES
In Economics and Business this year, you will learn about how health services are provided in Australia. In Geography, you will study how people are interconnected through travel, technology and trade. These connections affect where and how people access the services they need. In History, you will examine the experiences of different groups during the Industrial Revolution, and the reforms made to improve living standards.
To complete this task successfully, you will need to research the demographics of your local area, and the location and accessibility of health services. You should also consider the economic performance of your area to determine what type of preventative strategy would be most successful for your at-risk group.
You will find more information on this in Chapter 14 ‘Understanding the economy’, Chapter 4 ‘An interconnected world’ and Chapter 9 ‘The Industrial Revolution and the movement of peoples’ of Oxford Humanities and Social Sciences 9 Australian Curriculum.
MATHS
In Maths this year, you will extend your skills in representing and interpreting data. You will consider media reports that use statistics and collect secondary data to investigate social issues. You will relate real-world data to probabilities of events, and compare data sets using summary statistics and different graphical displays. You will evaluate and represent data, both with and without digital technology.
DRAFT
pressure have reduced the rate of strokes by 70 per cent.
• Personal protective equipment (PPE) is used to protect people from catching infectious diseases, such as Covid-19.
To complete this task successfully, you will need to find data to quantify the problem, work out how much your strategy will cost, and calculate a quantitative, evidence-based estimate of the possible benefits of your strategy. You will need skills in dealing with ratios, proportions and percentages to consider the situation at local, national and international scales.
You will find help for applying these maths skills in Chapter 7 ‘Statistics’ of Oxford Maths 9 Australian Curriculum
SCIENCE
In Science this year, you will learn about how the body coordinates and regulates its internal systems so that it can respond to changes. When things change in the environment (such as the emergence of a diseasecausing agent), or a part of the body fails, the normal functioning of the body is interrupted. The body needs to respond and attempt to return to a normal homeostatic state before permanent damage is caused.
To complete this task successfully, you will need to identify how the body’s systems work together to maintain a functioning body. You should consider the type of disorder or disease that you will be fighting, and how it may cause changes in the body’s normal function and response mechanisms.
You will find more information on this in Chapter 2 ‘Control and regulation’ of Oxford Science 9 Australian Curriculum
[STEAM project 2] The design cycle
To successfully complete this task, you will need to complete each of the phases of the design cycle.
Define your version of the problem
Discover
When designing solutions to a problem, you need to know who you are helping and what they need. The people you are helping, who will use your design, are called your end-users.
Consider the following questions to help you empathise with your end-users:
• Who am I designing for? Is it the people directly affected by the disorder or disease, or do their families and carers need support too?
• What problems are they facing? Why are they facing them?
• What do they need? What do they not need?
• What does it feel like to face these problems? What words would you use to describe these feelings?
To answer these questions, you may need to investigate using different resources, or even conduct interviews or surveys.
Define
Before you start to design your solution to the problem, you need to defi ne the parameters you are working towards.
Rewrite the problem so that you describe the group you are helping, the problem they are experiencing and why it is important. Use the following phrase as a guide.
‘How can we help (the group) to solve (the problem) so that (the reason)?’
Determine the criteria
1 Describe the type of life that the people you are helping lived before their lives were affected by the disorder or disease.
2 Describe how the people affected by the disease have needed to change their lives to cope with the effects of the disorder or disease.
3 Describe how you will know that you have made their lives better as a result of your prototype strategy.
Ideate
Once you know who you’re designing for, and you know what the criteria are, it’s time to get creative!
Outline the criteria or requirements your design must fulfi l (i.e. usability, accessibility, cost).
Brainstorm at least one idea per person that fulfi ls the criteria.
Remember that there are no bad ideas at this stage. One silly thought could lead to a genius innovation!
Build
Each group member should draw an individually designed solution. Label each part of the design. Include the material that will be used for its construction.
Include in the individual designs: a a detailed diagram of the design b a description of why it is needed by the individual or group
c a description of any similar designs that are already available to buy
d an outline of why your idea or design is better than others that can be purchased. Present your design to your group.
Build the prototype
Choose one design and build two or three prototypes. Use the following questions as a guideline for your prototype.
• What materials or technology will you need to build or represent your prototype design?
• What skills will you need to construct your prototype design?
• How will you make sure your prototype design is able to be used by the people who need it?
• How will you describe the way the prototype design will work?
Test
Prototype 1
Use the scientific method to design an experiment that will test the effectiveness and strength of your fi rst prototype. You will test the prototype more than once, to compare results, so you will need to control your variables between tests.
What criteria will you use to determine the success of your prototype?
Conduct your tests and record your results in an appropriate table.
Prototype 2
If your prototype will be used to help individuals with the disorder or disease, then you will need to generate a
survey to test whether the prototype is appropriate for their use. (How would they use it? Would it make their life easier or harder? Would they consider buying it? How much would they be willing to pay to access the design?)
Prototype 3
Your last prototype should be adapted using the information gathered from testing the fi rst two versions to make it more effective and usable for the group you are helping. You may want to use the fi rst two prototypes as a demonstration of how the design has been improved over time.
Communicate
Present your design to the class as though you are trying to get your peers to invest in your design.
In your presentation, you will need to:
• outline the relevant disorder or disease and how it affects individuals, as well as society as a whole
• create a working model, or a detailed series of diagrams, with a description of how it will be used by an individual and group
• explain how you changed your design as a result of testing or feedback
• describe how the design will improve the life of an individual or group
• describe how many people need or will use the design
• describe how individuals will be able to access the design (will they need to purchase it or will it be publicly funded?)
• describe how the design will improve an individual’s ability to contribute to society as a whole.
Check your Student obook pro for the following digital resources to help you with this STEAM project:
Student guidebook
This helpful booklet will guide you step-by-step through the project.
DRAFT
What is the design cycle?
This video will help you to better understand each phase of the design cycle.
How to manage a project
This ‘how-to’ video will help you to manage your time throughout the design cycle.
Check your Teacher obook pro for these digital resources and more:
Implementation advice Find curriculum links and advice for this project.
Assessment resources Find information about assessment for this project.
How to define a problem
This ‘how-to’ video will help you to narrow your ideas down and define a specific problem.
GL OS SA RY
Aaccuracy
how carefully, correctly and consistently data has been measured or processed; in science, how close a measured value is to the true value
aerobic cellular respiration
a chemical reaction between glucose and oxygen to produce carbon dioxide, water and energy
allergy
an overreaction by the immune system in response to pollen, dust or other nonpathogens
alpha particle
a radioactive particle containing two protons and two neutrons; can be stopped by a piece of paper
amplitude the distance a particle in a wave moves, from its position of rest
anaphylaxis
a life-threatening overreaction by the immune system to a normally harmless substance
angle of incidence
the angle between a reflected ray and the normal (a line drawn at right angles to a reflective surface)
angle of reflection
the angle between a reflected ray and the normal (a line drawn at right angles to a reflective surface)
angle of refraction
the angle between a refracted ray and the normal (a line drawn at right angles to a refractive surface)
anther
the end part of a stamen (male part of a flower); contains pollen
antibody
a molecule produced by B cells that binds to a specific pathogen
atmosphere the layer of gases surrounding the Earth atomic theory the theory that all matter is made up of atoms
autonomic nervous system the part of the nervous system that controls involuntary actions such as heartbeat, breathing and digestion
axon
the part of a neuron (nerve cell) that carries an electrical message away from the cell body to the synapse
B
B cell
an immune system cell that produces antibodies in response to pathogens
beta particle
a radioactive particle (high-speed electron or positron) with little mass; can be stopped by aluminium or tin foil
binary fission
a form of asexual reproduction used by bacteria; the splitting of a parent cell into two equal daughter cells
biodegradable describes an object or a substance that can be broken down by bacteria, fungi or other living organisms
biodiversity the variety of life; the different plants, animals and micro-organisms and the ecosystems they live in biosphere
a layer around the Earth's surface that supports life; consists of the atmosphere, hydrosphere and lithosphere
C
carbon dating
a method of estimating the age of organic material, by comparing the amount of carbon-14 in the material with the amount in the atmosphere, knowing the rate at which carbon-14 decays over time
carbon sink
any feature of the environment that absorbs and/or stores carbon
carbon tax
a tax levied on the carbon content of fuels used by businesses or homes
carbon trading scheme
the process of allocating a set limit of carbon credits to businesses, which can then trade the credits carpel carpel
the female productive organ of a flower; includes the stigma, style and ovary
cell body the main part of a cell that contains the nucleus/genetic material
cellular respiration chemical reaction that transfers energy to cells
central nervous system the brain and spinal cord cervix the narrow neck connecting the uterus and the vagina
circular economy an economic system where materials are reused and recycled rather than used and disposed of
cognition mental processes that are involved in acquiring, storing and manipulating and retrieving information
cognitive verb a doing word that requires you to perform a specific thinking task
combustion reaction a reaction between a fuel and oxygen that produces heat, carbon dioxide and water
compression part of a sound wave where air particles are forced close together
concave refers to a lens or mirror that is thinner in the centre than at the ends
conduction the transfer of thermal energy from hot objects to cooler objects by direct contact with no movement of material
contraception a way of preventing pregnancy
convection the transfer of thermal energy by the movement of molecules in air or liquid from one place to another
convection current the current or flow of air or liquid that results from the transfer of thermal energy through convection
correlated when results in an experiment show that independent and dependent variables are related
critical angle the angle of light that causes the reflected ray to move along the edge between two materials
cross-pollination the exchange of pollen and ova between different plants of the same species
cryosphere the frozen water in the hydrosphere
cultural burning the practice of burning vegetation used by Traditional Custodians of Country to enhance the health of Country; informed by deep knowledge of and relationship to Country
D
dendrite the part of a neuron (nerve cell) that receives a message and sends it to the cell body
dependent variable a variable in an experiment that may change as a result of changes to the independent variable
desexing a method of permanently preventing reproduction dispersion the separation of white light into its different colours diverge (in relation to rays of light) to move away from each other
dry cell an object, such as a torch battery, that uses a chemical reaction to produce electrical energy
E
electrical circuit
a closed pathway that conducts electrons in the form of electrical energy
electrical insulator a material that does not allow the movement of charged particles electron
a negatively charged particle in the nucleus of an atom
electrostatic charge an electrical charge that is trapped in an object such as a balloon endocrine system a collection of glands that make and release hormones
endometrium the lining of the uterus energy efficiency a measure of the amount of useful energy transformed in an energy transformation process; usually expressed as a percentage of the input energy (e.g. 90 per cent efficiency is very good)
enhanced greenhouse effect an increase in carbon dioxide and other heat-capturing gases in the atmosphere, resulting in increased warming of the Earth epididymis a coiled tube behind the testes that carries sperm to the vas deferens
DRAFT
converge (in relation to rays of light) to come together at a single point
convex refers to a lens or mirror that is thicker in the centre than at the ends
electrical conductor a material through which charged particles are able to move
electrical energy the energy that results in the movement of elections through a conductor towards a positive charge
external fertilisation when the egg and sperm meet outside the bodies of the parents
extrapolation
estimating unknown values from trends in known data
F
fallopian tubes tubes that connect the ovaries to the uterus
fertilisation the process where two gametes (sex cells) fuse to produce a single cell filter
a transparent material that allows only one colour of light to pass through focal length the distance between the centre of a lens and the focus focus the point where rays of light cross
foetus
an unborn animal or human after the embryo stage; in humans this is after 8 weeks of development
fragmentation asexual reproduction that occurs when a new organism grows from a fragment of the parent frequency the number of waves that pass a point every second; measured in hertz fuel a substance that undergoes a chemical reaction producing large amounts of energy fuse a wire of high resistance; it will melt if too much current flows in the circuit
Ggamete
a sex cell; in humans, the sperm and egg cells gamma rays high-energy electromagnetic rays released as a part of radioactive decay; can be stopped by lead
gestation the length of time between fertilisation and birth
group a vertical list of elements in the periodic table that have characteristics in common
Hhalf-life the time it takes the radioactivity in a substance to decrease by half hermaphrodite an organism that has both male and female reproductive systems hertz the unit used to measure frequency homeostasis the process by which the body detects and responds to stimuli to ensure a stable internal state is maintained hormone a chemical messenger that travels through blood vessels to target cells hydrocarbon a molecule that contains only carbon and hydrogen atoms hydrosphere all the solid, liquid and gaseous waters on Earth that support life
hyperglycaemia when there are high levels of glucose in the blood which can occur when the body has too little insulin hypoglycaemia when there are low levels of glucose in the blood which can occur when the body has too much insulin hypothermia the condition of having an abnormal, potentially dangerous, low body temperature
Iimage
a likeness of an object that is produced as a result of light reflection or refraction immune able to fight an infection as a result of prior exposure
immune system a system of organs and structures that protect an organism against disease inbreeding breeding of animals that are related, increasing the chances of genetic abnormalities appearing
independent variable a variable (factor) that is changed in an experiment
insulator
a substance that prevents the movement of thermal or electrical energy
internal fertilisation when the sperm fertilises the egg inside the body of an organism interneuron
a nerve cell that links sensory and motor neurons; also known as a connector neuron
isotope
an atom of a particular element that has more or fewer neutrons in its nucleus than another atom of the same element
KK-strategist
organism living in stable environments who breed carefully
Llaw of conservation of energy a scientific rule that states that the total energy in a system is always constant and cannot be created or destroyed
lens
a curved piece of transparent material lithosphere the outermost later of Earth, consisting of the upper mantle and crust
longitudinal wave
a type of (sound) wave where the particles move in the direction of travel of the wave
Mmass number
a number that represents the total number of protons and neutrons in the centre of an atom
matter
anything that has space and volume; matter is made up of atoms
medium
a substance or material through which light can move
memory cell
an immune system cell produced in response to an infection; retains the memory of how to fight the pathogen menstruation
also known as a period; the process of the endometrial lining of the uterus breaking down and leaving the vagina
mineral
a naturally occuring element or compound
motor neuron
a nerve cell that carries a message from the central nervous system to a muscle cell
myelin sheath
a fatty layer that covers the axon of a nerve cell
Nnatural greenhouse effect the natural warming of the Earth due to water vapour and other gases being present in small amounts in the atmosphere and affecting the Earth's radiation balance
negative feedback mechanism
a regulatory loop in which the stimulus causes a response that acts in the opposite direction to whatever is being regulated
neuron a nerve cell
neurotransmitter
a chemical messenger that crosses the synapse between the axon of one neuron and the dendrite of another neuron
neutron a neutral (no charge) subatomic particle in the nucleus of an atom
normal (in relation to light) an imaginary line drawn at right angles to the surface of a reflective or refractive material nucleus 1. in biology: a membrane-bound structure in cells that contains most of the cell’s genetic material; 2. in chemistry: the centre of an atom, containing protons (positive charge) and neutrons (no charge)
Oocean acidification the production of carbonic acid in the ocean due to the absorption of carbon dioxide
oestrogen a reproductive hormone in females offspring an organism's young, or child opaque not allowing light to pass through
optic fibre a thin fibre of glass or plastic that carries information/data in the form of light ore
a rock that contains a high percentage of one type of mineral
ovary the female organ that produces eggs oviduct the tube through which eggs travel from the ovary
ovum the reproductive egg
Pparallel the positioning of loads (e.g. lights) in an electric circuit so they are connected to the battery separately; they are in parallel to each other
parthenogenesis asexual reproduction where a female fertilises her own eggs
pathogen a microbe that can cause disease period (in chemistry) a horizontal list of elements in the periodic table
periodic table
a table in which elements are listed in order of their atomic number, and grouped according to similar properties
peripheral nervous system all the neurons (nerve cells) that function outside the brain and spinal cord
permafrost permanently frozen ground
phagocyte
an immune system cell that surrounds, absorbs and destroys pathogens
photosynthesis a chemical process used by plants to make glucose and oxygen from carbon dioxide, sunlight and water
placenta the organ that connects the developing foetus to its mother
pollination fertilisation of gametes in plants
potential difference voltage; the difference in the electrical potential energy carried by charged particles at different points in a circuit
prostate gland
a walnut-sized structure surrounding the neck of the male bladder that blocks the flow of urine so sperm can move along the urethra
proton a positively charged subatomic particle in the nucleus of an atom
Rr-strategist
organisms living in unstable environments who breed rapidly
radioactive decay the conversion of a radioactive isotope into its stable form, releasing energy in the form of radiation
radionuclide
a radioactive isotope rarefaction
a reduction in density; refers to part of a sound wave where air particles are forced apart
DRAFT
ovulation the part of the menstrual cycle when an egg is released from the ovary
primary colours of light the three colours of light (red, blue and green), which can be mixed to create white light
product a substance obtained at the end of a chemical reaction; written on the right side of a chemical equation
reactant
a substance used at the beginning of a chemical reaction; written on the left side of a chemical equation
receptor a structure that detects a stimulus or change in the normal functioning of the body reflex
an involuntary movement in response to a stimulus
refracted ray
a ray of light that has bent as a result of speeding up or slowing down when it moves into a more or less dense medium
refraction the bending of light as a result of speeding up or slowing down when moving into a medium of different density
refractive index
a measure of the bending of light as it passes from one medium to another relative atomic mass the average mass of an element, including the mass and prevalence of its different isotopes
reproducible
the ability to repeat and replicate a test exactly
resistance a measure of how difficult it is for the charged particles in an electric circuit to move
rheumatoid arthritis an autoimmune disease in which the immune system attacks the joints of the body
Ssample size the number of subjects being tested or used in an experiment
scrotum
a sac-like structure that contains the testes
secondary colours of light the colours of light (magenta, cyan and yellow) that result from the mixing of two primary colours of light
self-pollination when both gametes come from the same plant
semiconductor
a material that conducts electrical energy in one form and insulates against electrical energy in another form
seminal vesicles
a pair of small pouch-like structures that provide a sugary fluid that assists sperm to travel along the vas deferens
sensory neuron a nerve cell that carries a message from a receptor to the central nervous system
series the positioning of loads (e.g. lights) side by side in an electric circuit so that the electrical energy passes through one load at a time
sexually dimorphic describes species in which the male and female organisms look structurally different
short circuit when electrical current flows along a different path from the one that was intended
somatic nervous system the part of the nervous system that controls the muscles attached to the skeletal system
spore
a tiny reproductive structure that, unlike a gamete, does not need to fuse with another cell to form a new organism stigma the male part of a plant, consisting of a filament supporting an anther stimulus any information that the body receives that causes it to respond
subatomic particles particles that are smaller than atoms
synapse a small gap between two neurons that must be crossed by neurotransmitters
TT cell
an immune system cell that recognises and kills pathogens
target cell
a cell that has a receptor that matches a specific hormone
tectonic plate
a large layer of solid rock that covers part of the surface of the Earth; movement of tectonic plates can cause earthquakes testis
the male reproductive organ that produces sperm (plural: testes)
testosterone
a male hormone involved in the reproductive system
thermal conductor a material that allows thermal energy to flow through
thermal insulator
a material that prevents or slows down the transfer of thermal energy
Thomson plum pudding model an early model of the atom in which the positively charged nucleus has negatively charged electrons scattered through it, like a plum pudding
transmit to allow light to pass through
transparent allowing all light to pass through, so objects can be seen clearly transverse wave
a type of (light) wave where the vibrations are at right angles to the direction of the wave
type 1 diabetes
an autoimmune disease in which the immune system attacks the insulinproducing cells in the pancreas
Uuncertainty
a quantitative measurement of variability in the data
uterus an organ in the female reproductive system; where the foetus develops
VDRAFT
total internal reflection the complete reflection of a light ray when it passes from a more dense to a less dense material at a large angle; the ray is reflected back into the dense medium
vaccination
an injection of an inactive or artificial pathogen that results in the individual becoming immune to a particular disease vagina
a female reproductive organ; a muscular tube connecting the outside of the female body to the cervix
valid
where a test investigates what it sets out to investigate
van de Graaff generator a machine that produces an electrostatic charge
vas deferens the tube through which sperm travel from the epididymis to the prostate variable something that can affect the outcome or results of an experiment
vegetative reproduction
a type of asexual reproduction where part of a plant breaks off, forming a new organism with no need for seeds or spores; similar to fragmentation
sonar
the detection of the location of objects through the use of soundwaves
translucent allowing light through, but diffusing the light so objects cannot be seen clearly
virtual focus the point at which a virtual image appears
virtual image an image that appears in a mirror; it cannot be captured on a screen visible spectrum the variety of colours of wavelengths of light that can be seen by the human eye voltage potential difference; the difference in the electrical potential energy carried by charged particles at different points in a circuit
Wwave length the distance between two crests or troughs of a wave wet cell an object, such as a car battery, that uses a chemical reaction to produce electrical energy white blood cell an immune system cell that destroys pathogens
Zzygote a fertilised egg
IN DE X
Aabiotic factors 18, 24, 175
Aboriginal and Torres Strait Islander peoples cool burning, firestick and cultural burning 42–3
farming practices 43
use of ecosystems 42
absorbency of paper towels 163
accuracy 4, 5, 164
mathematical 5–6
acid rain 124–5, 195
acidic oceans and coral carbonates 122–3
acidity 121
acids 120
concentration 121
how to tell if a substance is an acid 120, 192 neutralisation reactions 122
pH values 121
reacting with bases 122–3, 194
reacting with metal carbonates or bicarbonates 122
reacting with metals to produce hydrogen and a salt 124–5 strength 120, 121
adrenal glands 60–1
adrenalin 60, 61
aerobic respiration 34
afferent neurons 53 agriculture
food production and biodiversity 43
sustainable farming practices 208–11
AIDS (acquired immunodeficiency syndrome) 73
air, gas balance 19
airborne microbes, factors affecting growth 182
alcohol 34
algal blooms 41
alkaline solutions 120
alkalinity 121 alkalis 120 allergies 72
atomic numbers 100, 106, 107
atomic theory 96–7
atoms 96–7
Bohr’s model 102
electron configuration 102–3 and ions 104–5
mass 99, 100–1 mass number 100
ratio in a compound 96, 187 representing 100
Rutherford’s experiments 98–9
Rutherford’s model 99, 188 subatomic particles 98–9
Thomson’s model 98
ATP (adenosine triphosphate) 32, 34
Australia earthquake and tsunami risk 89 fuel use 128–9
natural disasters 174
Australian plants, adaptation to fire 39 autoimmune diseases 73
carbon dioxide level in 65 radionuclide ‘labelling’ 113 and water regulation 64 blood clotting 70 blood doping 66 blood glucose levels 73 regulation 63 Bohr, Niels emission spectra 103 model of the atom 102 bone scans 113 brain 56 cross-section 59 lobes of 56 and senses 49, 50, 51, 54
sheep’s brain dissection 179 breast milk 71 broken glass 3
brushes 150 building materials 124–5 Bunsen burner, lighting 162 bushfires 42 impact on ecosystems 39
Ccalcium, electron configuration 102 calcium carbonate 123 calicivirus 28 cancer cells 112 capture–recapture method 25, 168 carbon-12 107, 110 carbon-13 107 carbon-14 107, 108, 110, 111 carbon atom 97 carbon cycle 37 carbon dating 110–11 carbon dioxide 19 in the atmosphere 122, 123, 129 in cellular respiration 34 dissolving in the ocean 40, 122, 123 effect on starch production 172 from burning of fuels 40, 127 homeostatic control 65 as molecule 97 in photosynthesis 30, 31, 171 carbon isotopes 107 carbon monoxide 127 carbonic acid 120, 122, 124 careers, in radiation 112–13 carrots 31 carrying capacity 38 cations 105, 122 cell body 52 cellular respiration 19, 34, 65 general equation 34 and photosynthesis 35 central nervous system 56 cerebrum 56 charged particles 134, 135, 140, 141, 148 chemical bonds, breaking of 118 chemical reactions 118 combustion reactions 127, 128, 196 energy changes 118–19, 191 neutralisation reactions 122, 194 reaction of metals and non-metals with oxygen 126–7 reac tions of acids 122–5 chemical receptors 50 chemicals, Safety Data Sheets 8–9 chloride ion 104, 105 chlorine atom 104, 105 chlorophyll 31 chloroplasts 30, 31 choosing the right instrument 4 circuit diagrams 136–7 circuits see electric circuits cleaning equipment 2–3 climate change 41, 208 coal 128 cobalt-60 108, 109 cochlea 49
cold packs 119 collaboration 20 colliding tectonic plates 81 combustion reactions 127, 128, 196 commensalism 20, 21 community 18 relationship between organisms 20–3 commutators 150–1 competition 20, 22, 24, 167 for resources 40 compounds, ratio of atoms in 96, 187 concentrated acids 121 concentration of acids 121 conclusion 3 connector neurons 53 consumer products, investigating 12–13 consumer science case study 2 continent-to-continent collision 83 continental crust 79, 85 continental drift 78 continental shelves 78 convection 81 convection currents 79, 81, 184 converging boundaries 83–4, 186 cool burning 42–3 cooling and layers 185 coral bleaching 41 coral carbonates and acidic oceans 122–3 coral reef ecosystems 123 core 81, 186 correlated 3 correlation of data 11 corrosion 125 counting organisms 25, 168 Covid-19 vaccine 71 crust 80, 81, 186 current 136 altering in a circuit 142 calculating 139 direction 136 flow through series and parallel circuits 138–9 measuring 137 see also alternating current (AC); direct current (DC) cycles of matter 36–7
disease vectors 20 diseases 28 caused by pathogens 68–9 germ theory 68, 182 simple, low-cost interventions 212–15 disorders, prevention 212–15 dissection, sheep brain 179 diverging boundaries 84–5, 186 DNA, radiation effects 11 droughts 38–9, 209 drug testing in sport 67 dry cells 134 dynamos 152, 153
Eear wax 70 ears, and hearing 49 Earth
<Textforindextocomeat2pp>
DDalton, John, atomic theory 96–7 data correlation 11 working with 10–11 deaths 24, 28 decomposers 19, 36 Democritus 96 dendrites 52–3 dependent variable 3 derived units 6 design cycle 210–11, 214–15 diabetes 73 dilute acids 121 diodes 142 direct current (DC) 136, 150, 153 discussion 3
continental drift 78 look of a future Earth 90–1 plate tectonics 78–9, 82–3, 90–1 sea-floor spreading 79 structure 80–1, 186 tectonic plate boundaries 82–9, 186 tectonic plate movement 78, 79, 81 earthquakes 79, 80 in Australia 89 causing tsunamis 86, 87 ecosystems 18, 29 benefits of 18–19 biotic and abiotic factors affecting 18, 24, 175, 209 cli m ate change effects 41 cool burning 42–3 cycles of matter 36–7 dynamic balance 24 energy flow through 32–5 energy sources in 30–1 field trip 175 food webs 24, 26 historical use 42 human activity effects 40–1 human management 42–3 modern needs 43 natural events affecting 38–9 new species impact on 26–8, 169 effector muscles 54 effectors 62, 63 efferent neurons 53 electric charge 134 electric circuits 135, 136–7, 197–8 altering current and resistance 142–3 current 137, 138–9 resistance 141, 199–201 series and parallel 138, 139, 140, 198 short circuit 139, 199 voltage 140 wiring a house 203 electric current see current electric motors 150–1, 206 electrical conductors 135 electrical energy 134, 136 electrical insulators 135
electricity 134 generation using magnetic fields and movement 152–3, 207 and magnets used to produce movement 150–1 to create a magnetic field 148–9 electromagnetic fields, use in technology and medicine 154–5 electromagnetic induction 152 electromagnets 149 electron configurations 102 for electron shells of an atom 102 representation in shell diagrams 102 and valence shell 102–3 electron shells 102 evidence for 103 electrons 98, 99 arrangement in atoms 102–3 have a negative charge 104, 134 loss or gain 104–5 electrostatic charge 134, 196, 197 elements atomic masses 106, 107 atomic numbers 100, 106 conventional representation 100 emission spectra 103 isotopes 106–7 listed in order of atomic masses 106 periodic table 100–1, 106 properties according to number of electrons in the valence shell of an atom 102, 103 relative atomic masses 107, 190 symbols 100 emigration 24 emission spectra 103, 189 endangered species 41 endocrine system 60–1 organs, glands and hormones 60, 180 endothermic reactions 118–19, 191 energy absorption in exothermic reactions 118 and cellular respiration 34–5 glucose and ATP 34 movement along food chains 32, 173 and photosynthesis 30–1, 35 release in endothermic reactions 118–19 for work 33 energy changes in chemical reactions 118–19, 191 ene r gy flow through ecosystems 32–5 energy pyramids 32 energy sources in ecosystems 30–1 energy transformations 32, 33 enhanced greenhouse effect 37, 40–1 epicormic buds 39 epinephrine 60 Epipens 73 errors 4–5, 164 erythropoietin 66 for blood doping 66, 67 medical uses 67 ethanol 128 as a biofuel 128–9
ethics of biofuels 129 in sport 67 eutrophication 40 evaporation 36 exercise 34, 180 exothermic reactions 118, 126, 127, 191 experimental errors 4–5 experiments 159–207 extinction of organisms 39, 41 eyes, and sight 49
F
farming practices 43 sustainable 208–11 faults 82 fermentation 34 fever 70 field trip 175 ‘fight, flight or freeze’ response 60–1 first line of defence 70 flame tests 103, 189 Fleming, Alexander 69 floods, impact on ecosystems 38 Florey, Howard 69 food chains 123 carbon-14 in 110 movement of energy along 32, 173 food production 43 food security/insecurity 208, 209 food webs 24, 26, 40 forest ecosystems 19 fossil fern, found in southern continents 78, 183 fossil fuels 129 free radicals 112 frontal lobe 56 fuels 127 use of 128–9 fungi 19, 68 fuses 139
G
groups (periodic table) 100, 101, 103 guard cells 31
Hhabitats 18 half-life 109 calculating 109 of medical radionuclides 109 using to tell the time 110–11 Hawaiian Islands evidence of volcanic activity 88 formation 87–8 hay fever 72 hazardous chemicals, Safety Data Sheets 8–9 hearing 49, 178 heat energy 32, 118 heat packs 119 Helicobacter pylori 68 hibernation 41 high-altitude training 66 Himalayas 81
HIV (human immunodeficiency virus) 73 homeostasis 57, 213
<Textforindextocomeat2pp>
gamma rays (gamma radiation) 108, 109 Geiger counter 110 generators 150, 152–3, 207 germ theory 68, 182 global positioning satellites (GPS) 90 global warming 43 glossary 216–21 Glossopteris (fossil fern) 78 glucagon 60, 63 glucose in cellular respiration 34 from photosynthesis 30, 31 storage 31 use of energy from 32, 33 glycolysis 34 grasp reflex 55 grass pollen 72 greenhouse effect 40 greenhouse gas emissions 42, 43
blood glucose regulation 64 heart rate during and after exercise 180 oxygen and carbon dioxide 65 regulation through negative feedback 62–5 water regulation 64 hormones 60 at work 63 and homeostasis 63–5 and organs of the endocrine system 60, 61 use in sport 66–7 hot spots 87–8
human activity affecting ecosystems 40–1 human endocrine system 61
immune system 58, 70–1 first line of defence 70 second line of defence 70, 72 things can go wrong 72–3 third line of defence 70–1, 72 independent variable 3 indicators 120, 121, 193 indirect evidence 188
Indo-Australian Plate 81, 82, 89 infection, and vaccination modelling 183
inflammation 70, 72, 73 influenza vaccine 71 inhibition 22, 23 inner core 80, 81 insects 19, 37 insulators 135 insulin 60, 63, 73 interneurons 53, 54 introduced species, impact on ecosystems 26–9, 169 inva sive species 26–9, 41 ion charge, calculating 104–5 ionisation 104 ions 104 formation 104 negatively-charged 105 positively-charged 105 iron 126 iron oxide 126 irrigation 40, 43 isotopes 106–7 half-life 109, 110–11 and radioactive decay 108–9
J
joints of the body 73 joules 140
K
kidneys 60, 61, 66 Koch’s postulates 68
L
laboratory safety 160–2 lactic acid 34 land clearing 40 Lavoisier, Antoine 96 law of simple multiple proportions 96–7 leaves 31, 172 light-dependent resistors (LDRs) 143 light-emitting diodes (LEDs) 142, 202 light energy 30, 31 light receptors 49 lignotubers 39 like charges (electrostatics) 134 limestone 124 limiting resources 38 lithium atom mass number and atomic number 100 two-dimensional model 99 lithosphere 18, 79, 80 litmus paper 120 liver 63
MMacquarie Island rabbits 27 magma 79, 81 magnesium atom 104 magnesium ion 104
magnesium metal 124, 126 magnesium oxide 126 magnetic fields 148, 204 around a straight current-carrying wire 148 direction of (right-hand grip rule) 148, 149 direction wire moves (right-hand slap rule) 150 and movement to generate electricity 152–3 in solenoids 149 magnetic force 148, 205 magnetic resonance imaging (MRI) 154–5 magnets and electricity to produce movement 150–1
mantle 79, 80, 186 Marshall, Barry 68–9 mass numbers 100, 106 mathematical accuracy 5–6 Maths (subject), in STEAM projects 209, 213 mating 20 matter, made up of atoms 96–7 matter cycles in ecosystems 36–7 mean 10
measurements and units 6–7 median 11 medicine
electromagnetic field use 154–5 radiation use 109, 112–13 meditation 65 memory cells 71 meniscus 5
<Textforindextocomeat2pp>
metal bicarbonates, reaction with acids 122 metal carbonates, reaction with acids 122 metal etching 124 metal oxides 126 metals
rabbits biological control 28 for hunting 26–7 impact on local ecosystems 27 introduction to Australia 26 Macquarie Island 27 population control 27, 169 population growth 26, 169 radiation careers in 112–13 effects of 112 and medicine 112–13 see also nuclear radiation radioactive decay 108, 109, 110–11 modelling 190 radioactive half-life see half-life radionuclides (radioisotopes) 108 half-lives 109 use in medicine 109, 113 radiotherapy 112 reading error 4 receptors 48 detecting stimuli 48–51, 54 rectifiers 142 red blood cells 66, 67 red cabbage indicator 13, 121 reflexes (reflex action) 54–5, 177–8
<Textforindextocomeat2pp>
relationships between different species 20–3 between organisms 20 non-symbiotic 22–3 symbiotic 20–1 within a species 20 relative atomic mass 107, 190 relative measurement 100 remote controls 142, 202 resistance 141 altering in a circuit 143 calculating 141 Ohm’s law 141, 199, 201 resistors 141, 142, 201 colour codes 141, 200 responding to change 48 results 3 rheumatoid arthritis 73 Ribena 2 rift valleys 84, 91 rift zone 79 right-hand grip rule 148, 149 right-hand slap rule 150 ring of fire 82 roots 31 rounding off 5–6 rust 126 Rutherford, Ernest gold foil experiment 98–9 model of the atom 99, 188
S
safely smelling chemicals 162 Safety Data Sheets (SDS) 8–9 safety in the laboratory 160–2 salts 122, 124 sample size 3 scientific method 2–3 scientists investigating consumer products 12–13 testing manufacturers’ clams 2–3 Scotese, Christopher, Paleomap Project model 90, 91 sea-floor spreading 79 seasonal changes 38 second line of defence 70, 72 secondary consumers 32 semiconductors 135 sense organs 48–51, 176 sensory neurons 53, 54 series circuits 138, 139, 140, 198 sheep brain dissection 179 shell diagrams 102 sherbet 122, 194 short circuits 139, 199 SI system of unis 6 sight 49 significant figures 5–6 simple circuits 137, 197–8 skin 51, 70 slipped disc 58 smell 50
smoke detectors 108 sneezing reflex 55
sodium atom 105
sodium chloride 122
sodium hydroxide 120, 122 sodium ion 105 solenoids 149 solution 119 somatic nervous system 57 sound receptors 49 species relationships between different 20–3 relationships within 20 specific immune response 70–1 spills, cleaning up 161 spinal cord 54, 56 spinal damage 58 split ring commutator 150–1 sport drug testing 67 ethics in 67
high-altitude training 66 hormones in 66–7 sprinting 65 starch 31, 172 startle reflex 5
STEAM projects
sustainable farming practices 208–11 technology to help people live healthier lives 212–15 stems 31 stimulus and reflexes 54–5, 177–8 and response 48–51 stimulus–response model 54 stomach ulcers 68 stomata 31 strength of acids 120, 121 strong acids 120, 121 strong bases 120 subatomic particles 98–9 subduction 83, 84, 87 sulfuric acid 120, 124 Sun, light energy from 30, 31, 32 supercontinents 78, 84, 90, 91 sustainable farming practices (STEAM project) 208–11 sweating 62–3 symbiosis 20–1 symbols used in circuit diagrams 137, 142 sympathetic division 57 synapse 52, 53 synaptic terminals 52
tears 70 technology electromagnetic field use 154 to help people live healthier lives (STEAM project) 212–15 tectonic plates 78, 80, 81, 185 boundaries 82–5, 86–9, 186 as constructive or destructive 86–9 movement 78, 79, 81, 183 temperature control 50 temperature-dependent resistors 143 temperature receptors 62–3, 176 temporal lobe 56 termites, recycling carbon 37 testes 60, 61 thermal energy 119 thermistors 143 thick bark, as protection from fire 39 third line of defence 70–1, 72 Thomson’s plum pudding model of the atom 98 thyroid gland 60, 61 tongue 50 top consumer 32 touch 51, 178 touch receptors 51, 176 transformers 154 transforming boundaries 82–3, 186 transpiration 36 tree pollen 72 trophic levels 32 tsunamis caused by undersea earthquakes 86 caused by volcanoes 86–7 risk in Australia 89 tubers 31
Vvaccination 71, 183 vaccines 71 valence electrons 103 valence shell (of the atom) 102 and element’s properties 102–3 and formation of ions 104 van de Graaff generators 134, 135, 197 variables 3 vertebrae 58 vibrations 49 viruses 68, 69, 70 vaccines against 71
vitamin C content of Ribena 2 volcanic bubbles 187 volcanoes 80, 83, 84, 187 around Pacific Ocean 82 causing tsunamis 86–7 Hawaiian Islands 87–8 voltage 140 voltmeters 140
WWarren, Robin 68–9 waste energy 32 water 122 for photosynthesis 30, 31 water cycle 36–7 water filtration 19, 166 water molecule 96, 97 water regulation in the human body 64 weak acids 120, 121 weak bases 120 weeds 41 Wegener, Alfred 78 wet cells 134 wetland ecosystems 19 white blood cells 70 wireless charging devices 154, 155 wiring a house 203 word equations 122, 124, 126, 127 ‘work’ of living organisms 33