Mathematics and Statistics 2 for Aotearoa New Zealand
Name:
Rich task 5.2
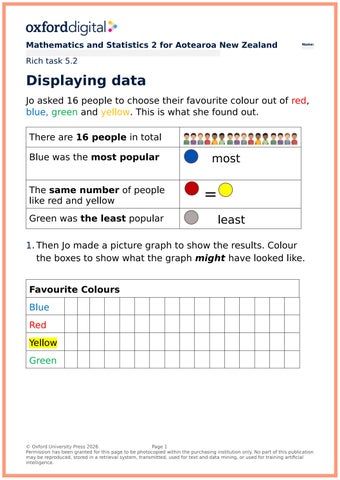
Displaying data Jo asked 16 people to choose their favourite colour out of red, blue, green and yellow. This is what she found out. There are 16 people in total Blue was the most popular The same number of people like red and yellow Green was the least popular
most
= least
1. Then Jo made a picture graph to show the results. Colour the boxes to show what the graph might have looked like. Favourite Colours Blue Red Yellow Green
© Oxford University Press 2026 Page 1 Permission has been granted for this page to be photocopied within the purchasing institution only. No part of this publication may be reproduced, stored in a retrieval system, transmitted, used for text and data mining, or used for training artificial intelligence.