
How many triangles? How many rectangles? How many hexagons?
1 Use tally marks to find how many: a triangles b rectangles c circles
1 Use the data to finish the picture graph.
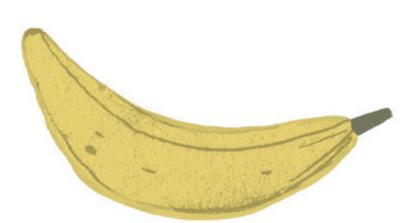
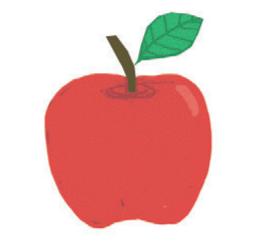

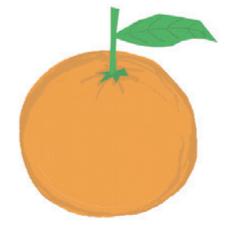
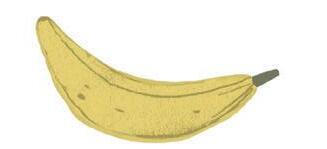
a Which fruit was the most popular?
b Which two fruits had the same number of votes?
Banana Apple Cherry Orange
Finish the dot plot.
Number of children
Sports that children play Sports
a What is the most popular sport?
b What is the least popular sport?
c What sport do 5 children play?
Deepen
1 Ask 10 people their favourite chip flavour.
a Record with ticks.
b Use the data to make a picture graph.