Key Insight
UNLOCKING FINANCIAL EMPOWERMENT AND INVESTMENT POTENTIAL FOR LOW - FEE PRIVATE SCHOOLS THROUGH THE SCHOOL LEADERSHIP ACADEMY (SLA )
August 2025

The School Leadership Academy (SLA), implemented by Opportunity EduFinance, equips school leaders in affordable non-state schools with the management, financial, and operational skills needed to sustainably manage and grow their schools. Through targeted training in budgeting, operations, financial record-keeping, and credit readiness, school leaders build capacity to make informed financial decisions, improve school operations, and access financial services. School leaders are also sensitized on the financial products and services available in the market, particularly those developed with Opportunity EduFinance technical assistance. As part of this effort, financial institutions are invited to the SLA workshops to create opportunities for direct engagement between borrowers and lenders.
This report presents insights captured from post-workshop and follow-up surveys with SLA workshop attendees, including 45% women. In total, the team carried out 7,406 school profile surveys administered before the workshop, 5,357 post-workshop surveys, and 2,805 follow-up surveys conducted three months after the workshop. All of the school leader respondents were from low-fee private schools, with 85% charging less than $100 per term, and 41% charging fees between $10-$30 per term.
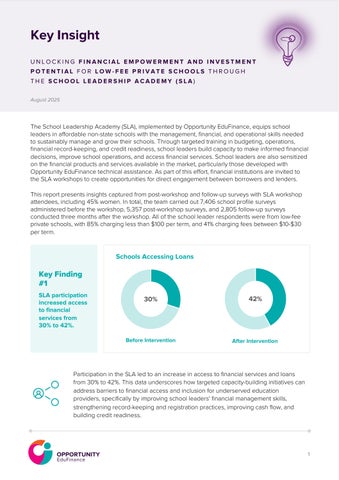
Schools Accessing Loans
Key Finding #1
SLA participation increased access to financial services from 30% to 42%.

Participation in the SLA led to an increase in access to financial services and loans from 30% to 42%. This data underscores how targeted capacity-building initiatives can address barriers to financial access and inclusion for underserved education providers, specifically by improving school leaders' financial management skills, strengthening record-keeping and registration practices, improving cash flow, and building credit readiness.
Key Finding #2
54% of loan recipients following the SLA workshop were first-time borrowers.
Based on follow-up surveys with SLA participants three months after the workshop, 54% of the schools that successfully received a loan after the workshop were first-time borrowers. Out of all schools that attended the SLA workshop (including those that did not receive a loan following the workshop), 24% of this total successfully received a loan for the first time. This is a key financial inclusion achievement, illustrating how the SLA workshop empowers school leaders with the necessary tools and confidence to engage conventional financial institutions even if they had never borrowed previously. The average loan size among first-time borrowers was $4,130, suggesting a modest yet significant infusion of capital to support institutional growth and development.
Key Finding #3
41% of school borrowers used loans for new classroom construction.

Most (41%) of school borrowers (including first-time borrowers and those that had borrowed previously) used the funds for new classroom construction, allowing schools to expand their enrollment capacity and reduce overcrowding in classrooms, a common challenge in underserved communities.




Additionally, a notable 26% of schools reported using their loans for “other” purposes, including minor infrastructure improvements (e.g., plastering classrooms, installing windows), purchasing food for the school, supporting school-based projects such as farming, and acquiring learning materials such as stationery or uniforms. These are short-term cash flow pressures rather than strategic, long-term investments. However, it also reflects the real and immediate needs many low-fee private schools face in underserved communities. For many school owners, addressing these gaps is essential to keeping the school operational and ensuring students’ basic learning conditions are met) Other prominent loan purposes included investment in computers (12%), school furniture/desks (11%), and WASH facilities (10%), reflecting a focus on enhancing the learning environment.
A smaller percentage of schools used higher loan amounts for land purchase ($21K average), school buses ($19K), and security infrastructure like fencing ($10K), indicating more strategic, long-term investments by a smaller subset of schools.
NewClassroom
What would you want to use the loan for, if approved?
Key Finding #4
Bank account ownership among SLA participants increased from 70% to 84% after the workshop.
Based on follow-up surveys, the percentage of SLA participants owning a bank account increased to 84% after the SLA workshop, compared to 70% before This growth suggests that the SLA workshop’s training in financial literacy and record-keeping empowered school leaders with the knowledge and confidence to engage with formal financial institutions and establish critical financial infrastructure.
Further, following the workshop, 73% of schools had registered their business names, a critical first step in formalizing operations and positioning themselves for loan eligibility. Additionally, 59% opened School Pay accounts to facilitate fee collection (measured only in markets where School Pay is available), and 49% implemented proper record-keeping methods. This points to a positive behaviour change in school financial practices following SLA workshops
In addition to concrete steps to improve their financial management, schools also reported taking steps to improve general management and operations following their participation in the SLA workshop.
What steps have been taken to improve bankability?
Over half of the schools (56%) improved parent engagement, a critical step towards enhancing school culture and community engagement, improving child learning, and possibly encouraging greater fee payment compliance among parents. Further, 46% of schools reported implementing better fee collection systems. Alongside parental engagement, the improved fee collection systems are a key step to address challenges with insufficient cash flow, leading to loan application rejection. A significant number of schools also focused on marketing and improving their learning environment (44% and 41%, respectively), strategies that can boost enrollment by attracting new parents, thus increasing schools’ revenue, cash flow, and loan eligibility.
What steps have been taken to improve school operations?
Invested in new collateral Other
Separated washrooms for girls and boys
Increase enrollment capacity via new classroom construction
Recruiting quality teachers
Improving on learner performance
Professional development for staff
Improving on teaching and learning resources
Hiring a financial consultant
Engaging in new income-generating activities
Preparing annual and termly school budgets
Improving the school environment (eg. renovation)
Efforts to advertise the school
Greater efforts for school fee collection
Putting in place proper record-keeping methods
Improving parent engagement
Key Finding #5
Appetite for borrowing among school leaders increased from 56% to 82% after the SLA training.

Do you plan to apply for a school improvement loan in the near future?
Following participation in the SLA training, school leaders’ plans to apply for a loan rose significantly from 56% before the training to 82% after. This shift suggests that the SLA not only enhanced participants' financial literacy and confidence but also demonstrated that school leaders saw the potential of school improvement loans to improve school quality; they were able to recognize borrowing as a strategic tool for improving infrastructure and sustainability.
Key Finding #6
Out of the total number of loan applications, 62.60% ($5,131,553.57) have been disbursed post-training.
The follow-up survey with SLA participants reveals a strong performance in loan uptake. Of the 1,106 loans applied for by school leaders (valued at $8,196,796.21), 664 loans (60.04%), have been disbursed, amounting to $5,131,553.57 (62.60%). This demonstrates strong loan uptake and approval rates. Additionally, 31.37% of total loans applied ($2,316,786.49 ), remain in process, highlighting a significant pipeline of applications that are still under review. The rejection rate is relatively low, at just 8.59% ($748,456.14) out of those who had received feedback on their application, indicating that the majority of applicants meet the eligibility criteria and comply with lender requirements
School Leadership Academy Loan Listing
$6,000,000
$5,000,000
$4,000,000
$3,000,000
$2,000,000
$1,000,000
$0
This reflects positively on the impact of the SLA training in preparing school leaders for financial engagement. With a majority of loans being disbursed, SLA training should emphasize effective financial management, budgeting, and repayment planning to ensure sustainable loan use and avoid defaults, as well as track how disbursed loans affect school operations, infrastructure, and learning outcomes.
However, among the small sample of those who experienced loan rejection, many cited key structural barriers including collateral limitations (18%), cash flow constraints (18%), and institutional weaknesses, such as missing documentation (16%) and lack of formal registration (9%). Further, 33% cited other reasons, including the loan application amount was too small / large, an insufficient student population, or the school’s distance from the nearest bank branch was too far, all of which remain significant reasons preventing non-state schools from meeting traditional banking requirements and successfully accessing credit, especially for first-time borrowers. By combining capacity-building for school leaders with similar support to financial institutions in designing reasonable loan eligibility criteria, even more schools can be empowered to secure capital, expand infrastructure, and deliver quality education in underserved communities.
Existing debt
Insufficient cashflow
Lack of collateral
Missing documents
Not registered
Other
When asked about future hypothetical loans, school leaders feel the most significant challenges in applying for loans would be insufficient cash flow (26%) and meeting collateral requirements (25%) 18% also mentioned a lack of knowledge about loan products and the application process would pose a challenge, while others mentioned possible challenges such as registration status (14%), lack of audited accounts (13%), and missing documentation (10%).
The data suggests the need for flexible and inclusive financial products that reduce reliance on traditional collateral and that account for seasonal cash flow realities, such as designing loan repayment schedules that align with the academic calendar.
Key Finding #7
66% of SLA schools reported that 10%–50% of their fees remain uncollected.
What is the percentage of fees not collected?
Less than 10
The majority of the SLA participating schools (66%) report that 10% to 50% of their school fees remain uncollected, a significant cash flow risk. About 11% of schools report very high rates of uncollected fees (above 50%), which poses a serious threat to their financial sustainability beyond loan repayment, as this impacts their ability to pay teachers on time, retain staff, and deliver quality education.
Nearly 42% of schools still collect fees through cash payments, despite the associated risks of mismanagement, theft, and lack of traceability. Direct Bank Deposit (26.9%) and Mobile Money (25.5%) together account for over half of all fee collection. Investments in digital literacy and infrastructure could help support more schools to transition to mobile collection methods. Only a small fraction of schools use SchoolPay (1.65%) or other digital money platforms (1.09%), suggesting limited adoption of fully digitized, automated fee collection systems.
Conclusion
With notable gains in bank account ownership, business registration, fee collection systems, and access to loans, especially among first-time borrowers, the School Leadership Academy has proven to have significant impacts on enhancing financial literacy and credit readiness.
While challenges such as collateral requirements, cash flow constraints, and documentation gaps persist, the high rate of successful loan acquisition highlights the SLA’s effectiveness in overcoming traditional barriers to finance.
What Further Support or Training Would be Useful?
When asked what further support is needed, many respondents asked for additional training in school management, teacher training, and business planning. Moving forward, many SLA participant schools will be given an opportunity to enroll in the EduQuality program to receive expanded training in these topics.
Other topics such as implementing and managing digital fee payment systems, strategic project planning and capital investment, school marketing, and stakeholder engagement, are also components of the three-year EduQuality program and will be critical to unlocking even greater capital for school improvement and empowering schools to deliver quality, inclusive education at scale.
Methodology
Purpose: The aim is to evaluate the impact of School Leadership Association (SLA) training on nonstate education providers' financial behavior, operational practices, and access to financial services across multiple countries.
Data Collection: Data was collected with both in-person surveys and phone surveys with participants from 151 total SLA workshops across 12 countries. Three surveys were administered in total: 7,406 paper-based school profile surveys administered before the workshop, 5,357 paper-based postworkshop surveys, and 2,805 follow-up surveys conducted via phone interviews three months after the workshop. Data from paper-based surveys was subsequently entered in a digital data collection application by Opportunity consultants.
Data Limitations: The data were collected from selected regions and focused specifically on low-cost schools participating in the SLA. As such findings are not representative of all private schools across the 12 countries, and should be interpreted with caution when considering generalizability.
School Fee Category Number of Schools by Country