Key Insight ACCESS TO FINANCE AND SCHOOL OUTCOMES
COMPARING ENROLLMENT, FINANCIAL PERFORMANCE, AND INFRASTRUCTURE AMONG SCHOOLS WITH AND WITHOUT SCHOOL IMPROVEMENT LOANS September 2026
Introduction and Background Opportunity International works with affordable non-state schools to strengthen their financial sustainability, leadership, teaching quality, and overall school improvement. It strengthens school leadership and management through EduQuality and the School Leadership Academy; supports teacher development and improved teaching practices through professional development, coaching, and feedback; helps schools assess their needs and develop improvement plans; promotes peer learning and collaboration through school clusters; uses data and evidence to improve school support, education quality, and financial products; and provides access to School Improvement Loans (SILs) to finance infrastructure, learning resources, teachers, and other school needs. Through SILs, EduFinance seeks to strengthen schools’ operational effectiveness, teaching and learning environments, and ultimately improve educational outcomes for learners. This Key Insight examines how access to SILs is associated with selected school outcomes, focusing on enrollment growth, financial performance, and infrastructure improvements. The analysis draws on School Profile survey data from 1,116 schools participating in the EduQuality programme, with data collected across two programme years. The analysis compared the same 1,116 schools across Year 1 and Year 2 to assess changes in key school outcomes. In addition, some analyses focused on a smaller subset of schools, including 66 schools that did not have an SIL in Year 1 but received a loan in Year 2. Because schools were not randomly assigned to receive SILs, the findings describe associations and do not establish that SILs caused the observed changes.
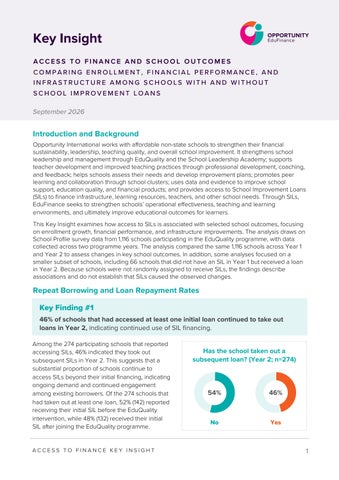
Repeat Borrowing and Loan Repayment Rates Key Finding #1 46% of schools that had accessed at least one initial loan continued to take out loans in Year 2, indicating continued use of SIL financing. Among the 274 participating schools that reported accessing SILs, 46% indicated they took out subsequent SILs in Year 2. This suggests that a substantial proportion of schools continue to access SILs beyond their initial financing, indicating ongoing demand and continued engagement among existing borrowers. Of the 274 schools that had taken out at least one loan, 52% (142) reported receiving their initial SIL before the EduQuality intervention, while 48% (132) received their initial SIL after joining the EduQuality programme.
ACCESS TO FINANCE KEY INSIGHT
Has the school taken out a subsequent loan? (Year 2; n=274)
54%
46%
No
Yes
1
Key Finding #2 First SIL repayment remained broadly stable, increasing slightly from 78% in Year 1 to 80% in Year 2, indicating consistently strong repayment performance. The repayment performance for the first SIL remained consistently stable over the two years. In Year 1, 78% of schools reported that they had fully repaid their initial loans, and 80% had fully repaid their initial SIL in Year 2. The absence of any decline in repayment performance indicates that schools maintained a stable capacity to meet their loan obligations. This reflects prudent financial management and supports the sustainability of SILs. Among schools that accessed a subsequent SIL in Year 2 (n=274), 64% of schools reported having fully paid off the loan, while 36% had not. The finding indicates that a substantial proportion of schools continued to engage with SIL financing and had completed repayment of their subsequent loans at the time of the survey. However, the 36% with loans not yet paid off represents a sizeable share and should be interpreted in relation to loan maturity and repayment schedules, since more recently disbursed loans may not yet be due for full repayment.
Has the first loan been paid off? 80%
78%
22%
20%
No
Have the subsequent loans been paid off? (Year 2; n=274)
36%
64%
No
Yes
Yes Year 1
Year 2
Key Finding #3 SIL financing is primarily used for school infrastructure and essential equipment, while general cash flow needs and purchase of assets represent a growing share of reported uses, indicating shifting school improvement priorities over time. The graph shows that SIL financing is primarily used for school infrastructure and essential equipment, with general cash-flow needs also becoming an important use. Schools are slightly more likely to use their first loan for classroom improvements, and more likely in Year 1, implying they may be looking to expand enrollment as a top priority (building more seats) when compared to other needs. In contrast, meeting general cash flow needs (such as teacher salaries, etc.) is much higher in year two and for subsequent loans. For first SILs, this increased from 6% to 14%, while for subsequent SILs it increased from 11% to 13%. Although cash-flow financing remains a smaller share of reported SIL uses than infrastructure and equipment, its increase warrants further investigation into whether schools are generating sufficient income from fees and other sources to cover their core operating costs. Lastly, the use of subsequent SILs for the purchase of other assets increased from 6% in Year 1 to 9% in Year 2.
ACCESS TO FINANCE KEY INSIGHT
2
What was the first loan primarily used towards? 2% 3%
Others
Year 2
Year 1
5% 6%
Purchasing_other_asset
14%
Meeting_general_cash_flow_needs
6%
Transportation_services_vehicles
1% 2%
Instructional_materials_ICT_materials
3% 3%
Instructional_materials_books_documents_pencils
3% 4% 5%
Infrastructure_add_on_separated_washrooms
5% 21% 24%
Infrastructure_improvement_basic_equipment 8% 10%
Infrastructure_improvement_outdoor_facilities_playground
37%
Infrastructure_improvement_classrooms_hallways
36% 1% 1%
Teacher_professional_development
What was/were these subsequent SIL used towards? Others
3% 2%
Year 2 9%
Purchasing_other_asset
6% 13% 11%
Meeting_general_cash_flow_needs Transportation_services_vehicles
2% 2%
Instructional_materials_ICT_materials
1% 2%
Instructional_materials_books_documents_pencils
6% 4%
Infrastructure_add_on_separated_washrooms
4% 5% 26% 29%
Infrastructure_improvement_basic_equipment 6%
Infrastructure_improvement_outdoor_facilities_playground
12% 28% 27%
Infrastructure_improvement_classrooms_hallways Teacher_professional_development
ACCESS TO FINANCE KEY INSIGHT
Year 1
0% 1%
3
Enrolment Growth and Teacher Recruitment Key Finding #4 Schools without SILs reported slightly higher enrolment growth than schools with SILs in both years. However, when comparing schools that did not have a loan in Year 1 to these same schools after receiving a loan in Year 2 (66 schools in total), the percentage of schools that increased their enrolment rose to 61% from 56% in Year 1. Schools without SILs reported higher levels of enrolment growth than schools with SILs in both years. In Year 1, 60% of schools without SILs reported increased enrolment compared with 58% of schools with SILs reporting the same, a 2-percentage-point difference. In Year 2, the difference widened; 64% of schools without SILs reported increased enrolment compared with 59% of schools with SILs, making a 5percentage-point difference. This suggests that access to SIL financing alone may not be sufficient to drive enrolment growth. The higher proportion of non-SIL schools reporting increased enrolment indicates that other factors may play an important role in influencing enrolment, including school quality, affordability, location, competition, school capacity and other forms of programme support.
Increased enrolment from previous year
60%
58%
Year 1 Without SIL
64%
59%
Year 2 With SIL
Among the 66 schools that moved from having no SIL in Year 1 to accessing an SIL in Year 2, the proportion reporting increased enrolment from the previous year rose from 56% to 61%, a 5 percentage-point increase. This change is more notable than the marginal increase observed among all schools with SILs and represents a potentially promising association between access to financing and enrolment growth. The increase in reported enrolment growth among newly financed schools suggests that access to SILs may support school expansion and the ability to attract additional learners.
Increased enrolment from previous year 61%
Year 2 - With SIL 39%
56%
Year 1 - Without SIL 44%
Yes
ACCESS TO FINANCE KEY INSIGHT
No
4
Key Finding #5 Schools with SILs recorded a larger rate of improvement in teacher recruitment, increasing from 43% to 52%, compared to an increase from 47% to 50% among schools without a loan. The percentage of schools reporting an increase in the number of teachers employed rose for both SIL and non-SIL schools. Consequently, SIL schools moved from 4 percentage points below non-SIL schools in Year 1 to 2 percentage points above them in Year 2. This pattern suggests an association between SIL access and increased teacher recruitment. However, schools without SILs continued to report slightly higher levels of teacher expansion overall, indicating that factors beyond access to finance also influence staffing decisions. When comparing schools that did not have a loan in Year 1 to these same schools after receiving a loan in Year 2 (66 schools in total), the percentage reporting an increase in teachers rose from 55% to 65%. These findings indicate a positive association between gaining access to a loan and teacher recruitment among newly financed schools. The results suggest that access to finance may support schools in expanding their teaching workforce. Increased number of teachers from previous year 47%
43%
50%
52%
Increased number of teachers from previous year 65%
Year 2 - With SIL
35% 55%
Year 1 - Without SIL Year 1 Without SIL
45%
Year 2 With SIL
Yes
No
Key Finding #6 Schools reporting operational cost reductions remained relatively stable, regardless of whether the school had received a loan. The proportion of SIL schools reporting reduced costs declined from 38% in Year 1 to 35% in Year 2, while the proportion of non-SIL schools reporting reduced costs increased from 36% in Year 1 to 38% in Year 2. In Year 1, 38% of schools with SILs reported reduced operational costs compared with 36% of schools without SILs, a 2-percentage-point difference; in Year 2, the pattern reversed, with 38% of schools without SILs reporting reduced costs compared with 35% of schools with SILs, a 3percentage-point difference. This suggests that SIL access did not translate into stronger costreduction performance in Year 2. This may be because schools receiving SIL financing may use the funds to improve their operations through investments in infrastructure, learning resources, staff, or other school improvements, which can increase operating costs in the short term. In addition, SIL borrowers have the added obligation of servicing and repaying their loans, which may increase their financial outflows compared with schools without SILs.
ACCESS TO FINANCE KEY INSIGHT
5
Reduced Operational Costs Compared to Previous Year
38%
36%
38%
Year 1
35%
Year 2
Without SIL-Yes
With SIL-Yes
Infrastructure Key Finding #7 SIL schools reported slightly higher rates of washroom expansion than non-SIL schools, increasing from 32% in Year 1 to 33% in Year 2, compared with 27% among schools without SILs in both years.
Schools with SILs consistently reported a slightly higher level of washroom expansion (32% in Year 1 and 33% in Year 2) than schools without SILs (27%) in both years. This is consistent with the earlier findings that washroom improvements are one of the uses of SIL financing. SILs may therefore be helping schools address important basic infrastructure needs that contribute to a more adequate and supportive learning environment.
Increased Washrooms from Year 1 to Year 2
27%
32%
Year 1 Without SIL - Increase
27%
33%
year 2 With SIL - Increase
Key Finding #8 When comparing schools that did not have a loan in Year 1 to the same schools after receiving a loan in Year 2 (66 schools in total), the percentage reporting that they had a library rose from 29% to 37%, indicating that schools may be using loans for this purpose. Among schools transitioning from not having an SIL in Year 1 to having an SIL in Year 2 (66 schools in total), the share of schools reporting that they had a library increased from 29% to 37%, while the proportion without libraries declined from 71% to 63%. These findings suggest that some schools possibly invested in library infrastructure after accessing SILs.
ACCESS TO FINANCE KEY INSIGHT
6
Does this school have a library? 37%
Year 2 - With SIL
63%
29%
Year 1 - Without SIL
71%
Yes
No
Key Finding #9 Science laboratory availability increased slightly among SIL schools from 17% in Year 1 to 19% in Year 2, while remaining unchanged at 17% among non-SIL schools. Science laboratory availability was low in both groups, with only 17% of schools reporting a science lab in Year 1. By Year 2, SIL schools increased slightly to 19%, while non-SIL schools remained at 17%. Although the improvement is modest, the 2-percentage-point increase represents 16 SIL schools that moved from having no laboratory in Year 1 to having one in Year 2. The finding suggests a potential contribution of SILs to improving specialized learning infrastructure, but the overall level remains low. This indicates that science laboratory infrastructure remains an area requiring further investment
Does the school have a science lab?
17%
17%
Year 1
17%
19%
Year 2 Without SIL-Yes With SIL-Yes
Methodology Purpose: To generate descriptive evidence on how access to SILs is associated with financial performance, enrollment growth, and infrastructure improvements, thereby informing future financing strategies for affordable non-state schools. Design: This analysis used a quantitative, non-experimental observational comparative design using program monitoring data from the same 1,116 schools observed over two programme years. Data was obtained from the Opportunity International school profile survey tool administered to 1,116 affordable non-state schools. The data were compiled into a centralized database, cleaned, validated, and analyzed. The sample comprised schools that accessed School Improvement Loans (SILs) and schools that did not. Schools were compared by reported loan status across selected indicators, including enrollment, financial performance, and infrastructure. A transition cohort of 66 schools that did not have SIL in Year 1 but had received one by Year 2 was examined for selected outcomes.
ACCESS TO FINANCE KEY INSIGHT
7
Data Limitations: This study uses programme monitoring data collected through the School Profile survey for operational and monitoring purposes and was not specifically designed to estimate the causal effects of SILs. Schools were not randomly assigned to receive SILs, and schools that accessed loans may differ systematically from those that did not; therefore, differences in outcomes between SIL and non-SIL schools may reflect factors beyond access to finance. Although the analysis follows the same 1,116 schools across two programme years, schools may change their SIL status between years, meaning that the overall comparison does not necessarily represent fixed borrower and non-borrower groups. The 66-school transition cohort provides a useful before-and-after comparison, but changes may also reflect broader time trends, school-level characteristics or other programme support. The two-year timeframe also limits assessment of the longer-term effects of access to finance. In addition, several outcomes are based on binary selfreported measures, such as whether enrolment, teacher numbers, or infrastructure increased, which indicate the direction of change but do not capture its magnitude, quality, adequacy, or sustainability. Accordingly, the findings should be treated as descriptive associations rather than causal estimates.
% Schools in Data Sample by Country Zambia
15% (172 schools)
Uganda Rwanda Nigeria
34% (376 schools) 5% (53 schools) 10% (107 schools)
Guatemala
3% (36 schools)
Ghana
4% (40 schools)
Dominican Republic Democratic Republic of the Congo
9% (95 schools) 21% (237 schools)
ADDRESS Level 18, 100 Bishopsgate London EC2M 1GT Visit us at edufinance.org © 2026 Opportunity International Education Finance functions under its US and UK affiliates. Opportunity International United Kingdom is registered as a charity in England and Wales (1107713) and in Scotland (SCO39692). Opportunity AInternational C C E S S United T O States F I N AisNa C E KE Y INSIGHT 501(c)3 nonprofit.
8