2025 Impact Report

Page 1


Impact Report

Last Mile, Lasting Impact

A MESSAGE FROM OUR CEO

What does it take to end extreme poverty at the last mile?

It takes opportunity rooted in local economies, hardworking families determined to build better futures, and institutions willing to invest in their potential.

For families living at the last mile, that opportunity feels out of reach. We have seen that families do not lack drive, talent, or ambition. What they too often lack is access: to capital, training, and support that turn hard work into progress.

Across rural communities, informal markets, and underserved regions, we work to expand opportunity for people living at the bottom of the economic pyramid: farmers, entrepreneurs, mothers seeking a better life for their families.

Unlocking that progress requires focusing on both the last and first mile. At the last mile, we equip families with skills, tools, and support they need to build resilient livelihoods. At the first mile, we collaborate with financial institutions to develop products and strategies that invest in pathways to prosperity.

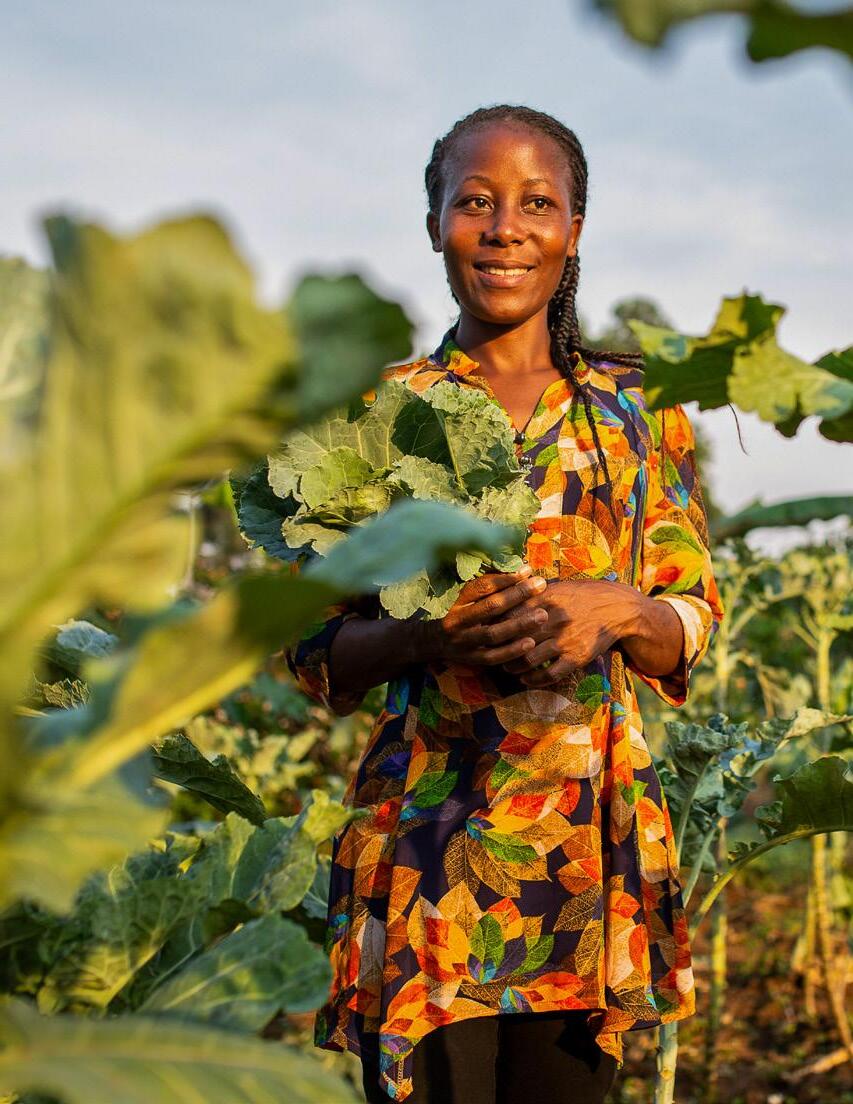
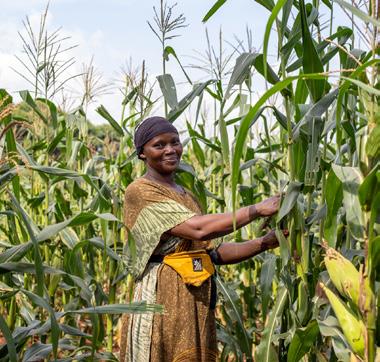
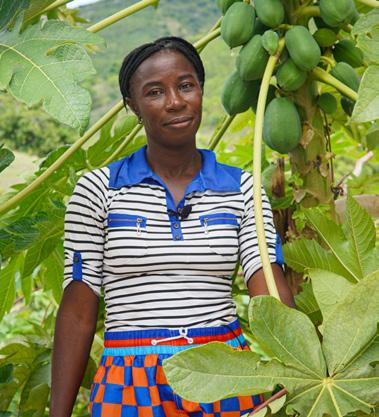
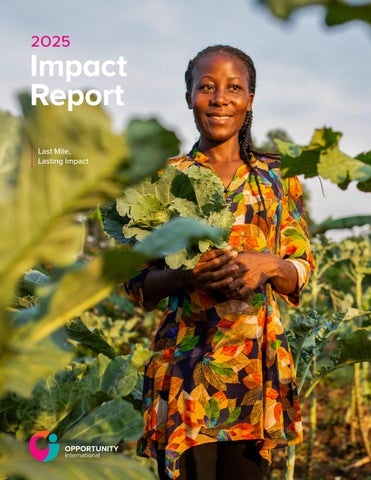
For entrepreneurs like Ruth, the farmer on the cover, that transformation takes shape day by day. We see it in the practices that build strength—better farm management, high-quality seeds, and protection against weather shocks. We also measure the longer-term harvest: livelihoods that endure, food on the table, children staying in school, and stronger communities.

In 2025, we mobilized $1.9 billion in capital, reached 5 million school children, and supported 574,776 farmers. The work is steady and demanding, like the daily work our families do, season after season. Each day, we travel to the last mile of our own Jericho Road, reaching brothers and sisters yearning for an opportunity for lasting change.

Sincerely,

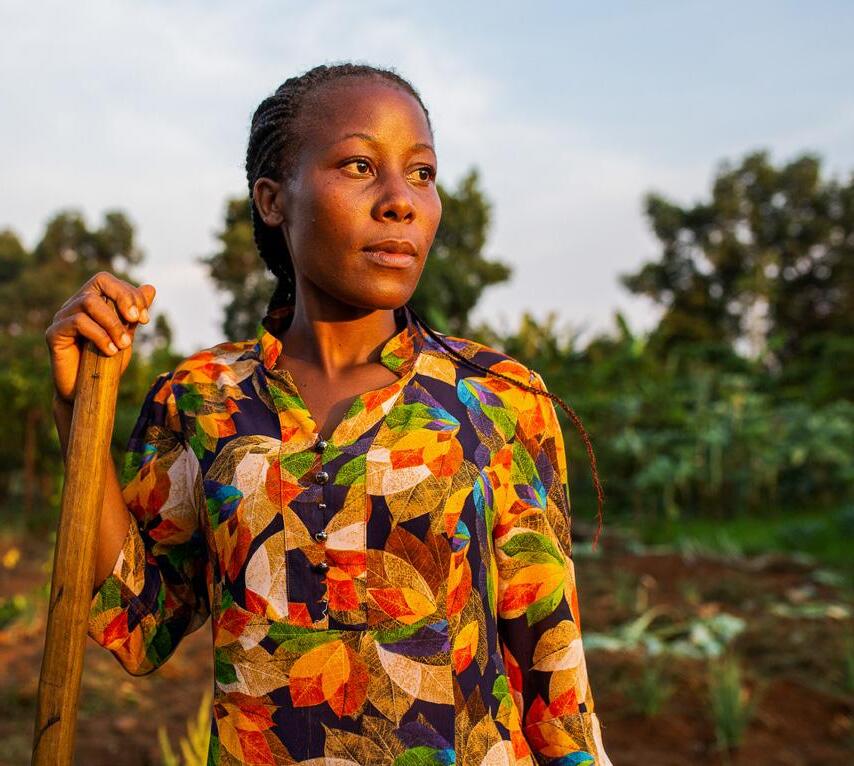
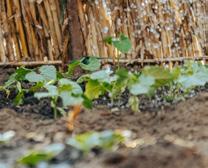
Ruth is a Ugandan single mother, farmer, and chairperson of her savings group. Thanks to Ruth’s perseverance and the support of Opportunity International, she learned business and financial skills and started growing vegetables. She even planted kale in a demonstration garden which provides her with income and serves as a teaching tool for her community. Now a successful businesswoman, she mentors young women as they build independence.

$1.9B

2025 at a Glance

Total Capital Released to sustainably serve the financial needs of our clients

16.7M Unique Clients

$31.9B

Total Capital Released with partners since 1971 148 Financial Institution Partners

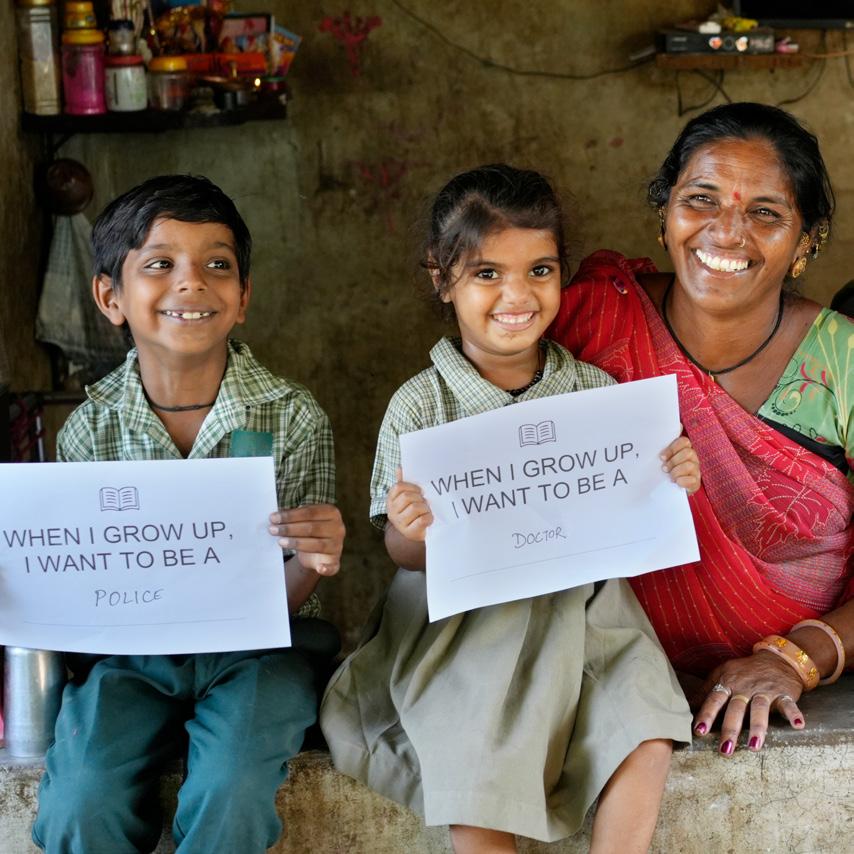
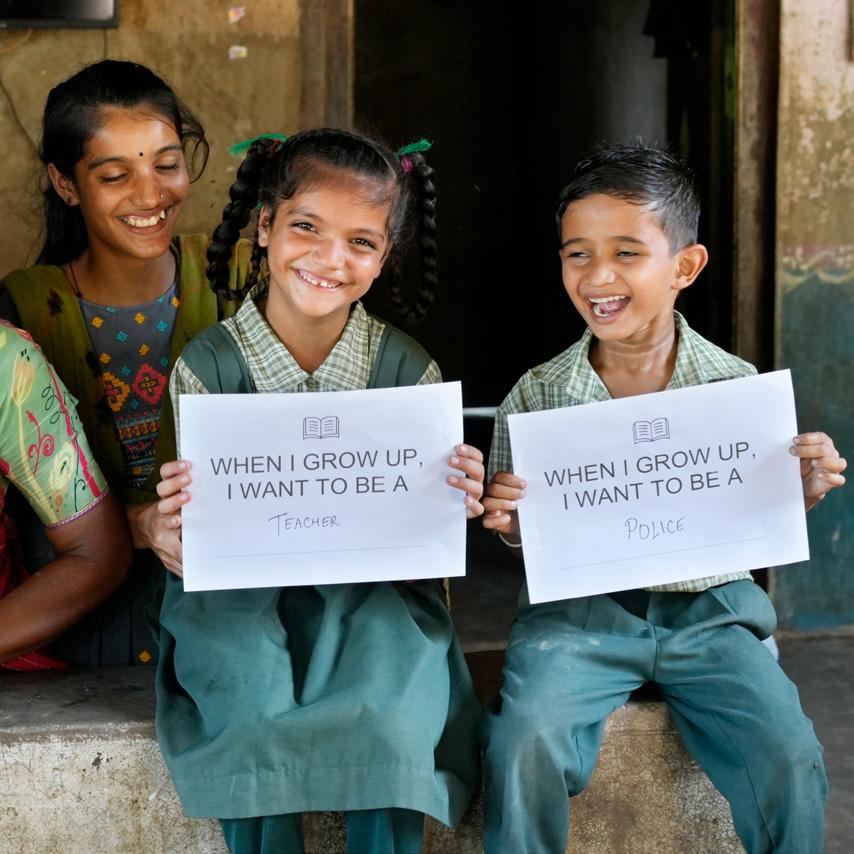
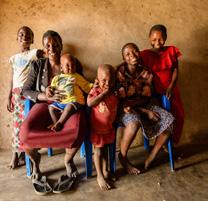
Bhikhiben, a mother, entrepreneur, and farmer in India whose transformation began with a small loan, pictured here with her children.

11 UN Sustainable  Development Goals addressed

DEMOCRATIC REPUBLIC OF THE CONGO

Where We Work

Opportunity International’s global network works in 28 countries—including 12 of the countries with the highest number of people living in extreme poverty, where we partner with experienced in-country staff to enable people living in poverty to build sustainable livelihoods.

ZAMBIA*
SERBIA
INDONESIA
PHILIPPINES

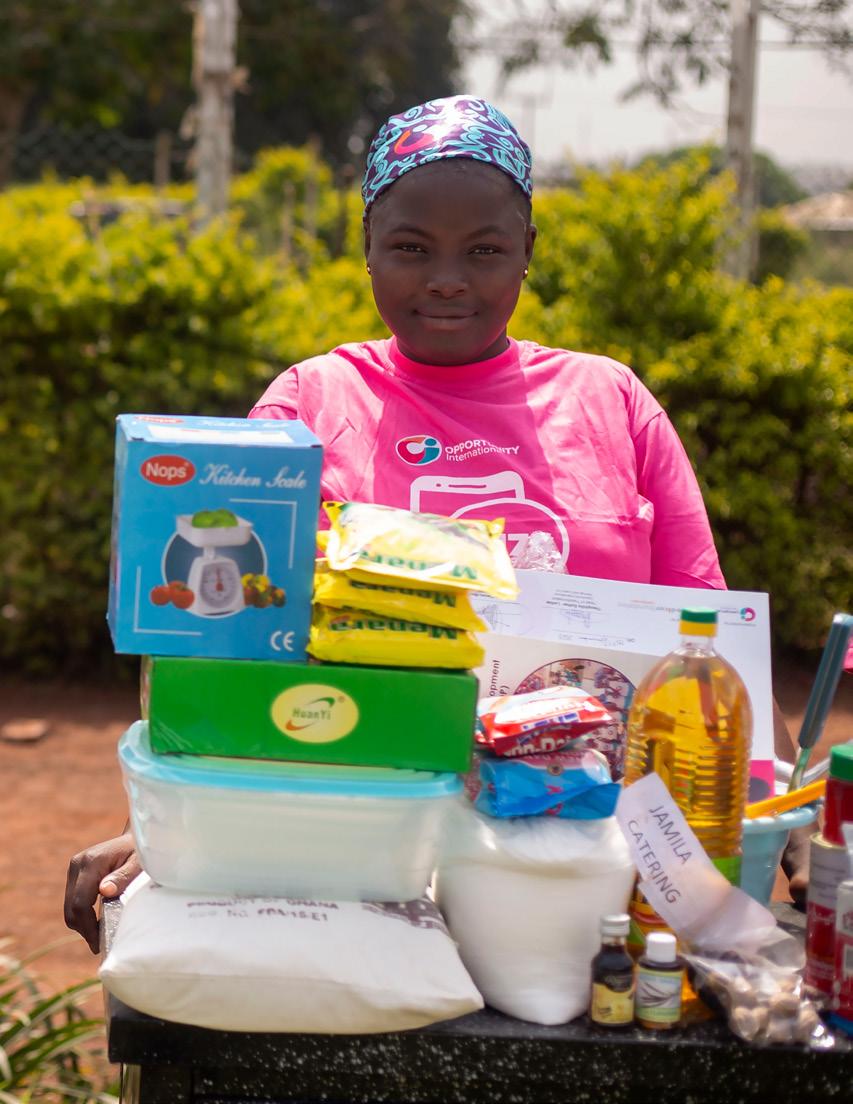
In southern Ghana, Jamila works as a kayayo carrying heavy loads for merchants, hauling food, toiletries, and other items on her head. The work is exhausting, the income often not enough for basic needs. Through Opportunity training, support, and access to financial resources, Jamila learned skills like soap making and baking as well as bookkeeping and sales. With these skills, she started a safer, more lucrative business. As a new entrepreneur with increased income, she embraces newfound stability and independence.

Theory of Change

Opportunity International’s theory of change asserts that engaging in core activities—mobilizing finance; building capacity through training, mentorship, and technical assistance to financial institutions; and strengthening networks/group support—implemented through core program areas—education, agriculture, microenterprise, graduation, and health—will bring about enabling outcomes for our clients. We nurture an ecosystem which supports the economic integration of people living in the deepest poverty. As a result, our clients will achieve ultimate outcomes of resilience and opportunity.

PATHWAYS OUT OF POVERTY TOWARDS SUSTAINABLE LIVELIHOODS

RESILIENCE

Able to manage risk and flourish

OPPORTUNITY

Agency and confidence to capture potential

Education Finance

WORKING

Two clear objectives fuel Opportunity International Education Finance:

1. Increase access to education by accelerating investments into local, affordable schools serving low-income communities.

2. Improve the quality of education by equipping school proprietors with training and resources and by providing professional training to teachers, impacting teaching practices and learning outcomes.

2025 witnessed a seismic shift in global philanthropy with the rapid dissolution of USAID and the shift of other global funding sources toward other priorities; for Opportunity, the impact changed the momentum but not the trajectory of our global education work. We closed some of the funding gap with individual and corporate donors and worked with in-country staff to continue as many programs as possible. Even with that bend in the road, we reached 5 million children and released $292.5 million in loans provided to schools and learners.

u Discovering that many rural schools are not developed enough to qualify for financing or fully participate in Education Quality, our team designed and launched School Leadership Academies to equip emerging schools with business and finance training to put them on a path to being bankable.

u Asia, along with sub-Saharan Africa, has the highest number of children out of school and the greatest demand for low-cost non-state schools. We continue to build outreach in India and Indonesia; we increased our pipeline of financial institutions in Indonesia following a national roadshow and engaged 190 schools in School Leadership Academies.

LEARNING

School Leadership Academy workshops provide training on how to run financially sustainable quality schools. At the workshops, school leaders learn about financial management and products available to support their schools. Unbanked schools connect with local financial institutions who have been trained by Opportunity EduFinance in providing financial products for education. At a series of recent workshops in Ghana, we captured helpful data:

u The average low-cost non-state school in Ghana serves 239 pupils and employs 15 teachers, with most offering basic education from kindergarten to junior high.

u 51% of schools have no income sources beyond tuition fees, making them highly vulnerable to fluctuations in fee collection and enrollment.

u 70% of schools use manual bookkeeping, limiting their ability to produce audit-ready

Ancil Dream School, Ghana

financial records, which are essential for accessing credit.

u If given access to a loan, 36% would build classrooms, 20% would buy school buses, and 9% would purchase furniture, demonstrating a need to make room for more students.

u 67% of schools have never taken a formal loan; nearly 30% of schools do not have a bank account.

INNOVATING

Our process of innovation, whether with newly available digital solutions or more traditional ideas, remains rooted in the desire to remove obstacles in our clients’ way. What solutions can we and our clients co-develop that will create meaningful impact?

Last year in lockstep with our teachers and school proprietors, we tested generative AI solutions that would remove some of their obstacles, like a virtual “school assistant” that helps leaders to build and implement school improvement plans, and a similar solution for teachers that makes it easy for them to create custom curricula for their students—both tools ultimately aimed at increasing student success and retaining engaged and informed educators. Thanks to their feedback, we continue to innovate designs that tackle specific challenges like low connectivity, lack of access to data, and modes of interaction like voice recognition and photos as well as text.

Partnering for Impact

In Colombia and Ecuador, in partnership with the Hilton Foundation, we are getting children access to quality early childhood education and providing families (even those with irregular incomes) with financing options. We also launched technical assistance for local financial partners, focusing on how to reach and support immigrants and internally displaced people.

Lifting Dreams Up

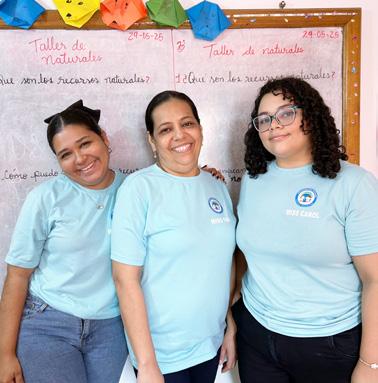
Mi Pequeño Mundo in Barranquilla, Colombia, began with limited resources but abundant love. From a tutoring center in one house to a formal school on several properties, Miss Faidy (center) and her community have created a school with open doors where everyone is welcome. Opportunity International’s Education Quality program has provided tools, ideas, and direction for the school, building a culture of continuous improvement.

“Together,

we built the pillars of our institution. Today, children love their school…and the values that once lived only on paper are now lived every day.”

EDUCATION FINANCE OUTREACH

*Revised CY24 to reflect total disbursement vs. active/outstanding loans

†New indicator in 2025

‡Variations in country coverage and sample size affect comparability

CY: Calendar year is January 1–December 31

UN Sustainable Development Goals

Targets 1.1, 1.2, 1.4, 4.1, 4.5, 4.6, 4.a, 4.c, 5.1, 8.10, 10.2, 17.3

Learn more in the Appendix on page 36.

EDUCATION FINANCE IMPACT

Financial resources

% of schools that increased annual

Income Jobs Resilience Training

% of schools that employed more teachers*

% of children who continued enrollment at the same school as previous year (retention rate)*

No. of teachers employed and hired

% of schools that improved teaching practices‡

% of school leaders with constant or improved management practices*

Note: Indicators are based on schools participating in Education Quality which can change from year to year as schools graduate from the program and new schools enter, making year-on-year changes less meaningful. In CY25, a large number of schools graduated from the program and new schools entered the program this year.

% of schools with constant or improved education quality rating†

% of schools that report constant or improved clean and safe school environment†

*Data from annual survey of school leaders †Data from annual school leader self-assessment ‡Data from annual classroom observations

Agriculture Finance

WORKING

Opportunity’s Agriculture Finance team aims to help smallholder farmers grow more, earn more, and build resilient households. When farmers thrive, communities thrive: stable livelihoods, education, community resilience, optimism. A handful of seeds planted in the earth will feed a family, fund an education, and sustain hope for a better future.

In 2025:

u We partnered with 28 financial service partners, adding seven new ones this year.

u We released $212.6 million in loan capital, more than doubling last year’s value.

u Group loans comprise 90% of the total disbursed loans; 55% of clients are women.

u We more than doubled our Farmer Support Agents, each serving 100–150 farmers.

u The annual average PAR>30 for the Agriculture Finance portfolio was 3.43%.

In August 2025, we hosted an Agriculture Finance summit in Uganda. Over three days, our AgFinance team convened 26 leading financial institutions, policymakers, and community leaders to explore how financing farmers can strengthen weather resilience, unlock opportunities for women and refugees, expand access to education, and build healthier, more sustainable communities, by:

u Scaling weather-related finance and regenerative agriculture for resilience

u Expanding inclusion for women farmers

u Embedding and expanding microinsurance to safeguard financial stability

u Sustaining digital innovation such as FarmerAI, the DreamSave savings group app, and financial identity tools

LEARNING

Thanks to support from Cisco Foundation, our Agriculture Finance team tackled three objectives in Malawi, Rwanda, and Uganda: improve the delivery of regenerative agriculture (RegenAg) finance options; strengthen Farmer Support Agents (FSAs) training; and digitize resources. The partnership resulted in:

u 462 FSAs trained and deployed

u Four new climate financing products

u 52,502 farming households trained

u 57% increase in yield

u 52,503 hectares of land shifted to RegenAg

u 454,000 agroforestry trees planted

FSAs trained farmers using a group-based peerlearning model that drives strong adoption of regenerative practices, resulting in higher yields and less dependency on chemical inputs. Farmers report improved soil structure, reduced input costs, and higher yields. Strong FSA leadership, practical community-based learning, and the integration of digital tools such as FarmerAI have accelerated knowledge transfer and adoption of RegenAg principles.

INNOVATING

Technology helps improve the lives of our current clients and helps us reach more people. Technology and partnerships can increase our access to more farmers, such as in Kenya, where SafariCom

partnered with us to connect our FarmerAI tool with their farmer clients.

FarmerAI is a WhatsApp-based virtual assistant that provides direct access to farming advice using authoritative, local sources. First piloted in Malawi, FarmerAI is being improved and rolled out in local languages with country-specific information on crops, inputs, and best agricultural practices for Ghana, Kenya, Malawi, Rwanda, and Uganda. The two most common use cases are helping farmers improve materials and techniques for planting and fertilizing to enhance productivity, and rapid identification and treatment of pest and disease outbreaks to minimize losses. Based on user feedback, we are expanding FarmerAI’s knowledge and language capabilities so farmers and Farmer Support Agents can access the most regionally relevant agricultural information and best practices in their own language and at a more appropriate literacy level. Developers are also working to merge in geolocation data for more targeted information such as weather, agro dealers, and local market prices.

At 2025 year-end, around 260,000 farmers had access to FarmerAI through 1,400 Farmer Support Agents, with 1,800 farmers using it themselves. FarmerAI is widely used by women, and both users and agricultural experts report its high accuracy and applicability: 72% of users say that FarmerAI enhances farm performance, with 67% of farmer users in Kenya reporting increased yields.

Partnering for Impact

Opportunity International Ghana and financial partner CapPlus are working with 195,000 rural young farmers, deepening their farming, business, and financial skills. More knowledge and better practices mean increased yields; more market linkages and a supportive network mean increased revenue and stability for farmers and their communities.

Stronger Every Season

Namulondo juggled food insecurity, school fee arrears, and medical bills. She practiced traditional maize farming on three acres of land but had little knowledge of agricultural practices, harvesting only five bags. She joined a savings group called Together We Can; thanks to her Opportunity Farmer Support Agent (FSA), she learned good agriculture practices and business management. She now harvests 24 bags of maize per season. Her farm has been recognized by her FSA as a model maize garden where other farmers come to learn. Her family enjoys more reliable meals and has improved their home. Namulondo says:

“I have been able to pay school fees for my children using loans from my savings group.”
NAMULONDO Farmer, Uganda

AGRICULTURE FINANCE OUTREACH

CY: Calendar year is January 1–December 31

UN Sustainable Development Goals

Learn more in the Appendix on page 36.

AGRICULTURE FINANCE IMPACT

Theory of Change: Enabling Outcomes CY25 CY24

Financial resources

% of clients with increased agricultural income* % of clients with increased yields Average % increase in income per farmer client

Jobs

No. and % of jobs created or sustained for women

No. and % of jobs created or sustained for youth

% of clients who would find it easy to meet an emergency expense

Human capital

Training Agency

% of clients who have seen an improvement in the number and/or quality of meals

Wellbeing

% of clients trained who are using improved agricultural practices

Thriving connections

Cohesion

of clients with an improved ability to manage their finances

of clients with increased confidence in themselves and their abilities % of clients with improved quality of life

Empowerment of women/girls

% of clients that are women who are more involved in making major household decisions

*Farmers surveyed may or may not be members of savings groups. The change in annual increase in income between CY24 and CY25 is due to both low results in Malawi, due to the impact of a devastating cyclone compounded by drought, and increases in Uganda and Rwanda. The increase in jobs is due to the increased number of clients served.

Savings Groups Spotlight

Around the world, savings and loan groups have proven to be one of the best tools to increase financial inclusion, especially for women and smallholder farmers. Through savings groups, members meet and save regularly, then borrow from that pool of savings, paying interest. Generally, at the end of each year, the groups share out their funds such that savers earn interest. The impact is simple and powerful: members can more easily manage household expenses including food, healthcare, and education.

One of Opportunity’s differentiators is our long-term focus on linking savings groups to formal banking. As savings groups mature, formal linkages can be made with financial institution partners like banks and microfinance institutions, giving members a credit history, a financial identity, and the possibility of accessing other financial tools. Digitization of savings groups strengthens the possibility of that linkage, as it tracks group data in an accurate, efficient way.

SAVINGS GROUPS

Opportunity savings groups are active in Colombia, Haiti, India, Ghana, Malawi, Nigeria, Rwanda, and Uganda.

In Opportunity's Agriculture Finance program, we reach farmers outside the formal financial system through existing savings groups, helping them access both good agricultural practices and financial services. Through surveys of farmers in savings groups in Malawi, Rwanda, and Uganda, the team found positive results achieved by farmers who are members of savings groups:

u 73% increased their income

u 74% can meet an emergency expense, showing financial stability

u 85% improved the number and/or quality of meals for the family

u 88% improved their quality of life

The Journey of Savings Groups

From Basic Needs to Business

Malawi Before joining Opportunity’s Rural Graduation program, Tina and her six children had a mat, two buckets, a cup, plates, and a pot. Thanks to her participation in a savings group, she roofed her home and expanded her income-generating garden and livestock.

Uganda Salama is a single mother and refugee from the DRC living in Uganda. She trained with Opportunity International in financial and business skills and joined a savings group. With her loan she invested in livestock; now she can pay for her children to go to school and for medication.

Colombia While Ingrid was selling products at her small pharmacy on the outskirts of Cartagena, she didn’t know how to grow her business and income was unpredictable. She joined a savings group, learning financial literacy and money management. During her first savings cycle she received two small loans to invest in expansion of her business. Her business stabilized, she grew her customer base, and she sent her children to school.

Rwanda Since joining an Opportunity International savings group, Felicia enjoys a newfound sense of agency, purpose, and leadership. She began her own farming business with crops and livestock, stabilizing her family’s income. She now serves as the president of her savings group which trains other women and establishes linkages to formal banking.

Microenterprise Development

WORKING

Since our inaugural loan in 1971 in Colombia, we have supported microenterprise across Africa, India, Latin America, and Eastern Europe, empowering people— mostly women—to grow businesses, improve their incomes, and enjoy a more sustainable, stable quality of life. As microfinancing movements grow, our role continues to be to seek out those left behind.

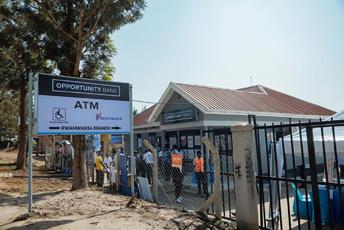
u Opportunity Bank Uganda (OBUL) now operates two full-service branches within refugee settlements in Uganda. As of September 2025, OBUL’s Nakivale branch inside the largest refugee settlement in Southwestern Uganda was the best performing branch in the country. OBUL also opened a branch in Rwamwanja refugee settlement, underscoring a commitment to ensuring that forcibly displaced people have equitable access to financial services to rebuild their lives.

u Our decades of strategic partnerships with microfinance institutions in India to serve women, young entrepreneurs, and people with disabilities have demonstrated that empowering people through financial inclusion is a sound business decision that builds sustainable livelihoods, strengthens communities, and diversifies their portfolios. Today, these institutions in India serve 5.7 million loan clients and 9.4 million savings clients. Some of our largest partner institutions are moving towards full financial sustainability, no longer needing philanthropic subsidy. Opportunity celebrates the role we have played in supporting the growth and sustainability of these organizations, while ensuring they share our social mission, and our focus on reaching and serving riskier and more excluded demographics.

LEARNING

Our microenterprise research partner, 60 Decibels, is a global impact measurement company that produces an annual microfinance report that provides insight into the experiences of microfinance clients worldwide—and specifically for clients served by Opportunity. The 2025 index reports that our financial institution partners outperform the global benchmarks in 18 out of 23 key indicators. We receive particularly high scores for accessibility, repayment affordability, client protection, and household impacts on health and education.

Rwamwanja refugee settlement branch, Uganda

INNOVATING

In Opportunity’s model, financing is delivered by socially focused banks and microfinance institutions. For these financial partners, serving people outside of the financial system presents higher cost and greater risk, whether perceived or actual. In the face of higher cost and risk, a solution is to subsidize and guarantee some of the cost and risk of serving those financially excluded.

Opportunity designs smart subsidies and guarantees that are tailored, share risk, lower costs to clients, and focus on mainstreaming previously unserved populations. Guarantee funds enable the financial institution to build capacity to serve target clients, like the youth apprenticeship program at Sinapi Aba Savings and Loans (SASL) in Ghana. Opportunity provided fees for entrepreneur trainers, stipends for marginalized apprentices, financing for interest-free loans, and a guarantee for graduates to obtain start-up business financing. Today, SASL loans to these graduates and pays for apprenticeship training, as a corporate social responsibility activity.

Partnering for Impact

We celebrate local partners like Cashpor and Pahal reaching rural and urban areas and championing women’s financial inclusion with tailored and innovative products like healthcare insurance and livestock loans, strengthening self-sufficiency. Pahal cofounder Purvi Bhavsar explains, “When a woman is more empowered, when she’s contributing not just economically but also socially, she’s respected in society…. We are playing a huge role in readying the next generation.”

A New Beginning

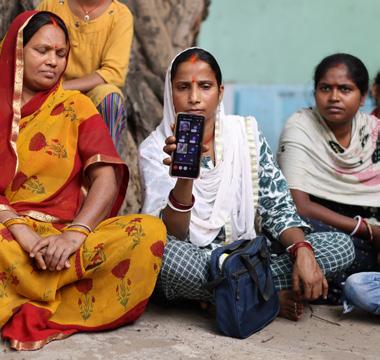
Renu meets with women in her community in India to teach about money management and basic health care. She is a key resource for women who cannot easily access traditional financial or health services either because of cultural or economic access. Because of her work, her neighbors know about good hygiene, health insurance, and basic health management, and Renu can provide for her family.

“We do our daily household chores, but I want to make impacts outside of the home. I am making a new beginning, no matter how small, and no matter what people say. If you are determined, you can achieve it.”
RENU Health Leader, Bihar, India

CY: Calendar year is January 1–December 31

UN Sustainable Development Goals

Learn more in the Appendix on page 36. MICROENTERPRISE OUTREACH

MICROENTERPRISE IMPACT

Theory of Change: Enabling Outcomes

Financial resources

Resilience

Human capital

Training Agency

% of clients with increased income % of clients increasing employment % of clients who would find it easy to meet an emergency expense % of clients

% of clients whose confidence in themselves and their abilities has improved

% of clients whose ability to achieve their financial goals has improved*

% of clients whose ability to meet an emergency expense has improved

Wellbeing

% of clients who report improved quality of life

Thriving connections

Empowerment of women/girls

% of clients improving the number/quality of meals

of clients that are women with improved ability to independently make decisions 69% 70%

% of clients who were able to achieve all or most of what they intended for their loan†

% of clients who report improved access to healthcare

*Question revised in 2025 survey †New indicator in 2025

Graduation

WORKING

The Graduation program offers a long-term solution whereby families living below even the extreme poverty mark of three dollars a day—truly living in subsistence mode—receive support that will pave a holistic, viable path out of poverty.

The Graduation program fits well with Opportunity International’s core model of financial services, training, and support; we tailor it for those who are living at the lowest levels of poverty imaginable. Think about Graduation as an approach that:

u Stabilizes the family so they can focus on the program and not just survival.

u Empowers the family to start a journey to sustainability, such as learning life skills and financial literacy.

u Equips the family with productive assets to start and run businesses of their own.

Most candidates for Graduation are women with dependents or persons with disabilities who lack reliable access to basic human needs such as food, clean water, and safe shelter.

LEARNING

We support the Graduation model in three countries; while the basic program model is replicated in each country, we contextualize interventions to best meet local needs. Consistent, encouraging, and supportive coaching by caseworkers is a critical component across all programs.

Colombia Known locally as Camino de Oportunidades, the Ultra-Poor Graduation program

in Colombia provides knowledge, support, and psychosocial encouragement. In the past year, in Graduation cohort two:

u Clients learned basic financial literacy, family wellness, and business promotion.

u Among the 500-family-cohort scheduled for graduation in the spring of 2026, the midpoint survey showed that 56% of participants had already demonstrated economic resilience, moving above the extreme poverty line.

One lesson: Bringing together diverse stakeholders who understand the needs and challenges in their local community is foundational to the success of the Graduation program in Colombia. To prepare for our third cohort, we convened partners from government, civil society, academia, and the private sector to identify possible synergies, potential coordination mechanisms, and complementary services. Community leaders also have emerged as essential allies in facilitating access and trust with participating households.

Haiti In September 2025, 650 families in two Ultra-Poor Graduation cohorts completed their programs. A central part of the Haiti Graduation training is the inclusion of workshops on men as husbands and fathers and building confidence for women and their partners. The program also has a robust health component thanks to a partnership with three local health centers. Clients receive regular health screenings, and treatment of common illnesses such as malnutrition, typhoid, malaria, and infections.

One lesson: our commitment to covering medical expenses and facilitating referrals helps bridge a

healthcare gap, also revealing the urgent need for systemic improvements in rural health services.

Malawi Our most recent cohort of 120 households in the Rural Graduation program in Lilongwe, Malawi graduated in February 2026. Participants receive livestock and funds for a secondary livelihood activity and learn to handle both. The Malawi program also offers Opportunity’s Pathways to Wellbeing holistic training and, due to weak rural infrastructures, includes a sanitation intervention; 100% of graduates now have working latrines and washing stations.

One lesson: while Graduation participants improve food security with greater quantity and variety, families need more nutrition training. We are working in partnership with local leaders to incorporate that training for future cohorts.

INNOVATING

The value of digitizing financial inclusion for Graduation participants is both immediate and lasting. Opportunity staff guide participants through the process of establishing low-deposit digital bank accounts, which first facilitates the easy and efficient initial funding to stabilize families’ basic needs like food and housing. By the end of the 18-month program, participants will have built up experience and a record of financial responsibility that ensures continued access to formal financial services; 100% of Graduation families are now connected to financial institutions.

Renewal and Resilience

When Celise joined the Ultra-Poor Graduation program in Haiti, she had nothing but knew what she wanted to do: open a grocery business selling basic food items. Celise committed to learning financial literacy and business management. After joining a local savings group, she started a grocery business and began raising goats. As her income stabilized and her savings grew, she diversified her grocery inventory and added turkeys to her livestock trade.

Partnering for Impact

Partnerships play a crucial role in Colombia Graduation: staff have developed and nurtured relationship with the City of Cartagena and Promigas, a business in Barranquilla committed to community philanthropy, to increase the program’s reach and resources.

“My business started with 15,000 gourds [$115]; now my business and livestock are worth 115,000 gourds [almost $900].”

CY25 End of program

% of participants that have increased their income

Theory of Change: Enabling Outcomes Human

Average cash and assets savings accumulated per client

% point increase and % of clients who have increased financial resilience

% of clients who have experienced an increased confidence in themselves and their ability to change their life circumstances

% of participants sending all their children (16 years old and under) to school

Water, Sanitation, Hygiene (WASH)

CY23 Start of program

% point increase and % of clients that have followed advice for clean water, better sanitation, and/or improved accommodation/dwelling hygiene

of clients who graduate

CY25 End of program CY23 Start of program

Additional Outcomes

Food security (volume)

Food security by meals per day

CY: Calendar year is January 1–December 31

Note: As no cohort graduated from the 18-month program in Colombia or Malawi in 2025, we included interim reporting on page 24.

UN Sustainable Development Goals

Learn more in the Appendix on page 36.

Health Finance

WORKING

For millions of people living in poverty, healthcare is unaffordable and inaccessible, yet health is key to building resilience. Reduced health shocks lead to lower financial stress, protecting livelihoods, and strengthening resilience, making health core to our aim to build opportunity and resilience.

Opportunity’s unique approach leverages our deep community trust and established microfinance partners and integrates health alongside financial inclusion to increase access to better quality healthcare. Microfinance partners co-fund the model, integrating health into existing branches and operations, making it sustainable beyond grant funding. In the face of foreign aid cuts, partnering with microfinance organizations to expand primary health services to underserved populations at scale can help close health equity gaps.

To date, our primary health efforts in vulnerable and rural communities in Asia—India, Bangladesh, Indonesia, and Nepal—have reached more than 8.7 million people. In 2025 Opportunity prepared to scale our health programs to Malawi, Uganda, and Ghana, drawing on proven models from Asia. Capacity building included cross learning visits for Africa partners to Asia and participation in the Global Health Partner Summit. The first Africa Health Leaders pilots are planned for 2026. Additionally:

u Health Leaders scaled and strengthened in Asia: our Health Leaders model expanded across India, Bangladesh, and Nepal. Expected to reach 5.3 million people over 5 years, the program funds women Health Leaders delivering trusted education, telehealth, and connections to essential services, improving health outcomes and women’s confidence, income, and leadership.

u Health Finance deepened protection for urban slum communities: in Mumbai and Pune, Health Finance pioneered unsecured emergency health loans, health savings, mutual insurance, and primary care. In 2025, 1,143 people accessed emergency loans, 345 opened savings accounts, and 2,149 people enrolled in community-run insurance. Strong repayment and a more than 50% out-of-pocket cost reduction in our pilot confirmed the feasibility and scalability of affordable health finance for low-income families.

LEARNING

BURO Bangladesh, one of Opportunity’s health program partners, compiled four years of evaluations for the Health Leaders program, showing the measurable increase in health knowledge for vulnerable people:

u 60% improvement in knowledge about maternal health

u 48% growth in understanding neonatal and child health

u 52% increase in understanding water, sanitation, and health habits

u 43% increase in knowledge about infectious diseases

Another innovative solution—mobile clinics that are an extension of our Health Leaders model—provided a compelling case for replication and scale: in their first full year, 11 mobile clinics in rural Bangladesh provided 58,029 people with primary care, diagnostics, maternal health services, and teleconsultations. The vans reach remote and marginalized communities with no other options for care, advancing universal health coverage. The model achieved early cost recovery and 76% of clients reached were women, demonstrating both impact and financial viability.

INNOVATING

Opportunity’s health team leads in pioneering health finance for people living in poverty. Our Health Finance pilot in India entered its third year, continuing to scale and refine outcomes with and for low-income communities. Year two results confirm our approach is working:

u 70% of loans provided to women

u 100% of loans in 2025 bundled with mutual health insurance for added protection

u 50%+ reduction in out-of-pocket costs for clients

u Maternity “wallets” driving safer deliveries and antenatal care completion

u 200+ people enrolled in tailored insurance for people with disability

u 99% repayment rate, proving health loans are viable and sustainable

The health program integrates gender-based violence education with health education through our local partner ESAF in India. In 2025, we reached 5,395 people; 70% of participants are confident to support, seek help, or report incidents of genderbased violence, a significant outcome in India where underreporting remains a challenge.

Partnering for Impact

An Opportunity delegation visited leading microfinance partners in Bangladesh in November 2025 to learn about integrating health and microfinance at scale. Key next steps include exploring integrated health pilots with microfinance partners OBUL (Uganda) and OISL (Ghana) and applying learnings from Bangladesh to shape Opportunity’s next phase of Africa-led innovation—all driving sustainability and resilience.

Hope for Joy

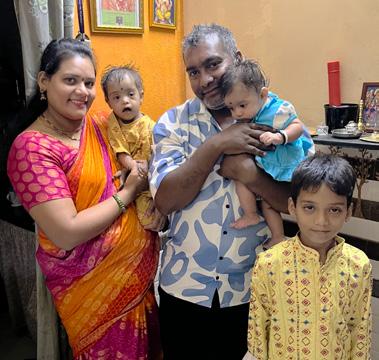
On the outskirts of Mumbai, father Vishal works in housekeeping and mother Aarti works part-time cooking for four families, while also caring for newborn daughter, Raha, two-year-old Joy, and their oldest son, Manthan. Joy was born with a hole in his heart and needs two procedures to repair it, for which the family has starting saving. However, Joy contracted pneumonia and no public hospital beds were available. Opportunity's local partners offered an affordable health loan; they also helped the family navigate medical challenges. Vishal told Aarti:

“[Joy] is a gift from God. If God has given, he will do everything. Joy will not have hope if we do not have hope.”
VISHAL Health loan client, India

HEALTH FINANCE OUTREACH

*New indicator in 2025

CY: Calendar year is January 1–December 31

Note: The change in number of beneficiaries reflects a year of strengthening and consolidation in the Health Leaders program.

HEALTH FINANCE IMPACT

Theory of Change: Enabling Outcomes CY25

Financial resources

Resilience

Average reduction in out-of-pocket medical expenditure* ≥50%

Human capital

Training Agency

99,951

No. of households who have improved knowledge, attitudes, and practices of reproductive, maternal, newborn, and child health

Thriving connections

Empowerment of women/girls

% reporting confidence to provide support/seek help/ report in gender-based violence contexts† 70%

*Health Finance only

†Health Leaders with ESAF only, midline report

UN Sustainable Development Goals

Learn more in the Appendix on page 36.

% reporting being more confident discussing health, fertility, or violence in public/ group settings† 89%

Appendix

IMPACT MEASUREMENT

Opportunity’s work is driven by a theory of change that links our activities, logically, to our intended outcomes and ultimate impact. We measure progress along this theory of change to document the outcomes clients experience as a result of participating in Opportunity programs and becoming financially included. This report presents that data, along with findings from our more focused or rigorous research and research by external experts.

Opportunity also builds the capacity of financial institutions to carry out Social Performance Management (SPM), which encompasses implementation of client protection principles and measuring and achieving poverty outreach targets. Opportunity’s outcome and impact measurement work makes Opportunity a data-supported learning organization and enables us to remain client-driven while bringing innovation to people living in poverty around the globe. We are committed to contributing towards the UN Sustainable Development Goals, mapping our initiatives against these goals to ensure alignment.

MEMBERS OF THE OPPORTUNITY NETWORK AND DISCLOSURES

Opportunity International Inc. is incorporated in the United States of America. It implements the Education Finance and Agriculture Finance programs with support from other parts of the Opportunity International Network, which includes Opportunity International Australia, Opportunity International Canada, Opportunity International Germany, Opportunity International UK, and Opportunity International US. Opportunity Australia implements the Health Finance and Women’s Safety programs. Opportunity Australia receives support from the Australian Government through the Australian NGO Cooperation Program (ANCP). Opportunity Australia is a majority shareholder of Dia Vikas. Opportunity International Inc. is a minority shareholder of Dia Vikas.

DATA AND METHODOLOGY

Global Impact Definitions

Total capital released

Total value of loans made by Opportunity’s financial institution partners across Microenterprise, AgFinance, and EduFinance programs globally.

Unique clients

Savings clients from Network financial institution partners, loan clients from Network financial institution partners, farmers served through AgFinance, loan clients with EduFinance financial institution partners.

Financial institution partners

Number of unique financial institutions and NGOs engaged with EduFinance, AgFinance, Microenterprise, Innovation, Graduation and Health Finance.

Education Finance Definitions

Value of loans provided to schools and learners

Value of tertiary, teacher, and vocational loans disbursed in CY.

Children reached by EduFinance

Active child impact in CY.

Schools financed

School improvement loans and tertiary institution loans in CY.

Student loans disbursed

School fee loans, vocational loans, tertiary tuition loans, teacher (professional development) loans in CY.

Financial institution partners

Number of financial institution partners actively partnering with EduFinance as of the end of the reporting period through technical assistance or portfolio lending.

Schools participating in EduQuality

Number of schools actively participating in Opportunity’s EduQuality program as of the end of the reporting period.

% of school loan clients that are women

Active school improvement loans outstanding as of year-end  ÷ clients that are women.

% of teachers employed and hired that are women

Among schools in EduQuality program, % of the teachers who are women.

% of schools that increased annual income

Schools with increased annual income = income in most recent year > income in prior year; % of schools with increased annual income = number of schools with increased annual income ÷ number of schools served.

% of schools that employed more teachers

Schools that employed more teachers = number teachers employed at end of most recent year > number of teachers employed at end of prior year; % of schools that employed more teachers = number of schools that employed more teachers ÷ number of schools served.

No. of teachers employed and hired

Total number of teachers employed by schools served, disaggregated.

% of children who continued enrollment at the same school as previous year (retention rate)

Average of total retention rate and the average retention rate for all supported schools.

% of school leaders with constant or improved ability to manage finances

Number of schools reporting improvement in finance and business management domain ÷ the total number of schools.

% of schools with constant or improved education quality rating

Number of schools reporting improvement in quality ÷ total number of schools.

% of schools that improved teaching practices

% of schools showing improved average teaching practice score = number of schools with improved teaching scores  ÷ number of schools.

% of school leaders with constant or improved management practices

% of school leaders showing improved management practices.

% of schools that report constant or improved clean and safe school environment

Number of schools that improve on clean and safe school environment score ÷ number of schools.

Agriculture Finance Definitions

Value of loans provided to farmers

Value of agriculture loans disbursed during the year for all AgFinance products.

Households reached

Number of households and agribusinesses who received financial services (loans and/or training) during the reporting period.

% of clients that are women

The percent of farmers receiving loans or served by Farmer Support Agents (FSAs) that are women.

Farmer loans disbursed

Number of agriculture loans disbursed to farmers during the reporting period across all AgFinance products.

Farmer Support Agents (FSAs)

Number of active agents delivering trainings to smallholder farmers within the reporting period.

Farmers supported by FSAs

Number of farmers trained, profiled, or supported by Farmer Support Agents (FSAs).

% of new farmers supported by FSAs living in extreme poverty

Percent of new farmer clients living under $3.00 per day according to Progress out of Poverty Index (PPI).

Financial institution partners

Number of financial institutions with signed partnership agreements as of the end of the reporting period.

% of clients with increased ag income

The number of clients surveyed who perceive an increase in the income of at least one of their two main crops, comparing the most recent harvest with the same period in the previous year, as a % of the total number of farmers surveyed.

% of clients with increased yields

The number of clients surveyed who perceive an increase in the yield of at least one of their two main crops, comparing the most recent harvest with the same period in the previous year, as a % of the total number of farmers surveyed.

Average % increase in income per farmer client

For each farmer client surveyed, the percent change in income between last season and this season for the two most significant crops is averaged for the two crops, then, the average percentage change in income for each client is averaged across all farmer clients surveyed.

No. of jobs created or sustained

Estimate of the number of people hired by clients last season (part-time, full-time, seasonal) plus the clients themselves, calculated by multiplying the average number of jobs created/ sustained from the survey of FSA-supported farmers, by the total number of households supported, which is the total number of FSA supported farmers, plus clients receiving loans from Agriculture Finance supported financial institutions.

No. and % of jobs created or sustained for women, for youth

% of jobs = total number of women/youth hired by surveyed clients this season ÷ total number of people hired by surveyed clients this season; number of jobs = % of jobs to women/youth X total estimated number of jobs created/sustained; youth is defined as people aged 35 and under.

% of clients who would find it easy to meet an emergency expense

Clients are asked on a scale from very difficult through very easy how challenging it would be to meet an expense amount quoted to the farmer in local currency; the amount is calculated to be equivalent to 5% of GDP in that country; the number of clients who report that it would be somewhat easy or very easy is expressed as a % of all clients surveyed; data based on a survey question in World Bank Global FINDEX survey and the 60 Decibels microfinance client surveys.

% of clients who have seen an improvement in the number and/or quality of meals

Number of clients who report as a % of all clients surveyed.

% of clients trained who are using improved agricultural practices (same as previous)

% of clients with an improved ability to manage their finances (same as previous)

% of clients with increased confidence in themselves and their abilities (same as previous)

% of clients with improved quality of life (same as previous)

% of participants with greater engagement with community bodies (same as previous)

% of clients that are women who are more involved in making major household decisions (same as previous)

Microenterprise Development Definitions

Total value of loans made by Opportunity’s partners

The value of loans made during the reporting period by financial institution partners.

Financial institution partners

Number of Opportunity’s financial institution partners that deliver loans and savings services to clients.

No. of clients with loans

Number of borrowers during the reporting period.

Average loan size

The total value of loans made by Opportunity’s partners ÷  the number of clients with loans for the reporting period.

No. of clients with savings accounts

Number of savers during the reporting period.

% of clients with increased income

From annual client surveys of multiple partners in different regions. Clients are asked, on a scale of 1-5, how much the an indicator changed as a result of Opportunity microfinance. Scores of 4 or 5 are counted as an improvement, and the % of clients with an improvement is calculated.

% of clients increasing employment

% of clients surveyed who report that their number of employees has increased and attribute that increase to their microfinance institution, as a % of those clients who report that they have paid employees.

% of clients who would find it easy to meet an emergency expense

From annual client surveys of multiple partners in different regions. Clients are asked, on a scale of 1-5, how much the an indicator changed as a result of Opportunity Microenterprise. Scores of 4 or 5 are counted as an improvement, and the % of clients with an improvement is calculated.

% of clients whose ability to meet an emergency expense has improved (same as previous)

% of clients whose ability to manage their finances has improved (same as previous)

% of clients whose confidence in themselves and their abilities has improved (same as previous)

% of clients whose ability to achieve their financial goals has improved (same as previous)

% of clients who were able to achieve all or most of what they intended for their loan (same as previous)

% of clients who report improved quality of life (same as previous)

% of clients improving the number/quality of meals (same as previous)

% of clients who report improved access to healthcare (same as previous)

% of clients that are women with improved ability to independently make decisions (same as previous)

Graduation Definitions

% of participants that have increased their income

Number of clients for whom (endline income – baseline income > 0) ÷ total number of clients.

% of participants whose incomes have gone above the poverty threshold

Number of clients for whom endline income is above the poverty line ÷ total number of clients.

Average cash and assets savings accumulated per client

(Total of local currency value of savings accumulated for all clients at the end of the program ÷ number of clients) X exchange rate at end of Graduation program.

% of clients who have achieved a stable (sustainable) livelihood

Each country’s program defines a “stable (sustainable) livelihood” in their Graduation model (e.g., Malawi focuses on having multiple income streams; Colombia focuses on stability in single business).

% of clients who have increased financial resilience

Endline number of clients who would find it easy or not difficult to meet an emergency expense of a specific value within 30 day  ÷ baseline number of clients who would find it easy or not difficult to meet an emergency expense of a specific value within 30 days.

% of clients who significantly gained from training

Each country’s program creates/choose proxy indicators from the trainings taking place within the program.

% of clients who have experienced an increased confidence in themselves and their ability to change their life circumstances

Endline number of clients who rated as 4 or 5 out of 5 ÷ baseline number of clients who rated as 4 or 5 out of 5.

% of clients who graduate

Number of clients who graduate ÷ number of clients.

% of clients who increased community participation

Number of clients for whom (endline community participation indicator – baseline community participation indicator > 0)  ÷ number of clients.

Change in % of clients who have a source of personal support (percentage point change)

(Endline number of clients with a source of personal support  ÷ number of clients) – (baseline number of clients with a source of personal support ÷ number of clients).

% of clients who are experiencing food security (eating sufficient number of recommended diet)

Endline number of clients who rated as 4 or 5 out of 5 ÷ baseline number of clients who rated as 4 or 5 out of 5.

% point increase and % of clients that have followed advice for clean water, better sanitation, and/or improved accommodation/dwelling hygiene (same as previous)

Health Finance Definitions

No. of households who have improved knowledge, attitudes and practices of reproductive, maternal, newborn, and child health

A household is counted if it shows positive change in score compared to baseline or meets a pre-defined minimum improvement threshold (e.g., 80%).

% of clients who report an increased confidence in discussing health, fertility, or violence in public/group settings

Uses a structured, validated self-efficacy/empowerment questionnaire adapted from WHO and decision-making scales with 5-point Likert responses to assess women’s confidence in making health decisions; women scoring ≥ 4 are classified as “confident”; data are collected consistently at baseline and endline (and midline if applied).

% of clients reporting confidence to provide support/seek help/ report in gender-based violence contexts

Measures perceived participation and empowerment using survey questions on: household decisions (healthcare, finances, children’s education), community decisions (meetings, leadership, collective actions); “increased involvement” means: higher involvement score than baseline or reporting “often/always involved” at follow-up.

Savings Groups Definitions

% of clients increasing income

Number of clients for whom (endline income – baseline income > 0)  ÷ total number of clients.

% of clients who report that it would be easy to meet an emergency expense

Clients are asked on a scale from very difficult through somewhat difficult, neither difficult nor easy, somewhat easy and very easy how challenging it would be to meet an expense within a month, with amount quoted in local currency; the amount is calculated to be equivalent to 5% of GNP in that country; the number of clients who report that it would be somewhat easy or very easy is expressed as a % of all clients surveyed.

% of clients who have seen an improvement in the number and/or quality of meals

Number of clients who report as a % of all clients surveyed.

% of clients with improved quality of life (same as previous)

2030 SUSTAINABLE DEVELOPMENT GOALS, TARGETS, AND INDICATORS

The 2030 Agenda for Sustainable Development, adopted by all United Nations Member States in 2015, provides a shared blueprint “for peace and prosperity for people and the planet, now and into the future.” The 17 Sustainable Development Goals seek to advance sustainable development for the world’s most vulnerable. Partners work on tackling ambitious action in food systems, digital connectivity, education, and jobs/social protection. Together with our peer organizations, Opportunity International works to end global poverty.

SDG 1: No Poverty

1.1 By 2030, eradicate extreme poverty for all people everywhere, currently measured as people living on less than $1.25 a day.

1.2 By 2030, reduce at least by half the proportion of men, women and children of all ages living in poverty in all its dimensions according to national definitions.

1.4 By 2030, ensure that all men and women, in particular the poor and the vulnerable, have equal rights to economic resources, as well as access to basic services, ownership and control over land and other forms of property, inheritance, natural resources, appropriate new technology and financial services, including microfinance.

1.5 By 2030, build the resilience of the poor and those in vulnerable situations and reduce their exposure and vulnerability to climate-related extreme events and other economic, social and environmental shocks and disasters.

SDG 2: Zero Hunger

2.1 By 2030, end hunger and ensure access by all people, in particular the poor and people in vulnerable situations, including infants, to safe, nutritious and sufficient food all year round.

2.3 By 2030, double the agricultural productivity and incomes of small-scale food producers, in particular women, indigenous peoples, family farmers, pastoralists and fishers, including through secure and equal access to land, other productive resources and inputs, knowledge, financial services, markets and opportunities for value addition and non-farm employment.

2.4 By 2030, ensure sustainable food production systems and implement resilient agricultural practices that increase productivity and production, that help maintain ecosystems, that strengthen capacity for adaptation to climate change, extreme weather, drought, flooding and other disasters and that progressively improve land and soil quality.

SDG 3: Good Health and Wellbeing

3.1 By 2030, reduce the global maternal mortality ratio to less than 70 per 100,000 live births.

3.2 By 2030, end preventable deaths of newborns and children under 5 years of age, with all countries aiming to reduce neonatal mortality to at least as low as 12 per 1,000 live births and under-5 mortality to at least as low as 25 per 1,000 live births.

3.3 By 2030, end the epidemics of AIDS, tuberculosis, malaria and neglected tropical diseases and combat hepatitis, water-borne diseases and other communicable diseases.

3.4 By 2030, reduce by one third premature mortality from non-communicable diseases through prevention and treatment and promote mental health and well-being.

3.7 By 2030, ensure universal access to sexual and reproductive health-care services, including for family planning, information and education, and the integration of reproductive health into national strategies and programs.

3.8 Achieve universal health coverage, including financial risk protection, access to quality essential health-care services and access to safe, effective, quality and affordable essential medicines and vaccines for all.

3.c Substantially increase health financing and the recruitment, development, training and retention of the health workforce in developing countries, especially in least developed countries and small island developing States.

SDG 4: Quality Education

4.1 By 2030, ensure that all girls and boys complete free, equitable and quality primary and secondary education leading to relevant and effective learning outcomes.

4.5 By 2030, eliminate gender disparities in education and ensure equal access to all levels of education and vocational training for the vulnerable, including persons with disabilities, indigenous peoples and children in vulnerable situations.

4.6 By 2030, ensure that all youth and a substantial proportion of adults, both men and women, achieve literacy and numeracy.

4.a Build and upgrade education facilities that are child, disability and gender sensitive and provide safe, non-violent, inclusive and effective learning environments for all.

4.c By 2030, substantially increase the supply of qualified teachers, including through international cooperation for teacher training in developing countries, especially least developed countries and small island developing States.

SDG 5: Gender Equality

5.1 End all forms of discrimination against all women and girls everywhere.

5.2 Eliminate all forms of violence against all women and girls in the public and private spheres, including trafficking and sexual and other types of exploitation.

5.6 Ensure universal access to sexual and reproductive health and reproductive rights as agreed in accordance with the Programme of Action of the International Conference on Population and Development and the Beijing Platform for Action and the outcome documents of their review conferences.

5.b Enhance the use of enabling technology, in particular information and communications technology, to promote the empowerment of women.

SDG 6: Clean Water and Sanitation

6.1 By 2030, achieve universal and equitable access to safe and affordable drinking water for all.

6.2 By 2030, achieve access to adequate and equitable sanitation and hygiene for all and end open defecation, paying special attention to the needs of women and girls and those in vulnerable situations.

SDG 8: Decent work and economic growth

8.2 Achieve higher levels of economic productivity through diversification, technological upgrading and innovation, including through a focus on high-value added and labor-intensive sectors.

8.4 Improve progressively, through 2030, global resource efficiency in consumption and production and endeavor to decouple economic growth from environmental degradation, in accordance with the 10Year Framework of Programmes on Sustainable Consumption and Production, with developed countries taking the lead.

8.6 By 2020, substantially reduce the proportion of youth not in employment, education or training.

8.10 Strengthen the capacity of domestic financial institutions to encourage and expand access to banking, insurance and financial services for all.

SDG 10: Reduce inequalities

10.1 By 2030, progressively achieve and sustain income growth of the bottom 40 percent of the population at a rate higher than the national average.

10.2 By 2030, empower and promote the social, economic and political inclusion of all, irrespective of age, sex, disability, race, ethnicity, origin, religion or economic or other status.

10.b Encourage official development assistance and financial flows, including foreign direct investment, to States where the need is greatest, in particular least developed countries, African countries, small island developing States and landlocked developing countries, in accordance with their national plans and programs.

SDG 12: Responsible Consumption and Production

12.2 By 2030, achieve the sustainable management and efficient use of natural resources.

12.4 By 2020, achieve the environmentally sound management of chemicals and all wastes throughout their life cycle, in accordance with agreed international frameworks, and significantly reduce their release to air, water and soil in order to minimize their adverse impacts on human health and the environment.

SDG 13: Take urgent action to combat climate change and its impacts

13.1 Strengthen resilience and adaptive capacity to climate-related hazards and natural disasters in all countries.

13.3 Improve education, awareness-raising and human and institutional capacity on climate change mitigation, adaptation, impact reduction and early warning.

SDG

17:

Partnerships for the goals

17.2 Developed countries to implement fully their official development assistance commitments, including the commitment by many developed countries to achieve the target of 0.7 percent of ODA/GNI to developing countries and 0.15 to 0.20 percent of ODA/ GNI to least developed countries; ODA providers are encouraged to consider setting a target to provide at least 0.20 percent of ODA/GNI to least developed countries.

17.3 Mobilize additional financial resources for developing countries from multiple sources.

17.8 Fully operationalize the technology bank and science, technology and innovation capacity-building mechanism for least developed countries by 2017 and enhance the use of enabling technology, in particular information and communications technology.

17.17 Encourage and promote effective public, public-private and civil society partnerships, building on the experience and resourcing strategies of partnerships.

SDGs Across Programs

Education Finance

Agriculture Finance

Microenterprise

Development

Graduation

Health Finance

No Poverty

Zero Hunger

Good Health and Wellbeing

Quality Education

Gender Equality

Clean Water and Sanitation

Decent Work and Economic Growth

Reduced Inequalities

Responsible Consumption and Production

Climate Action

Partnerships for the Goals

PARTNERS (BY PROGRAM, BY COUNTRY)

Education Finance Partners

Africa

DRC Advans, Baobab, EquityBCDC, FINCA DR Congo, Hekima IMF, Paidek SA, ProcFin, SMICO, Tujenge Pamoja

Ethiopia Aggar, Harbu, Hibret, Metemamen, PEACE MFI

Ghana Adehyeman, Akuapem Rural, Amenfiman, Opportunity International S&L, Sinapi Aba S&L, VisionFund Ghana

Kenya Balloon Ventures, EdPartners, Faulu, Fortune Credit, Jackfruit Finance, Juhudi Kilimo, NBK, Sidan Bank, Stanbic Bank, VisionFund Kenya, Yehu Microfinance

Malawi Centenary Bank Malawi, FINCA Malawi, NBS Bank

Nigeria Accion, Baobab, Bowen MFB, EdFin MFB, FCMB Limited, FCMB MFB, FINCA Nigeria, Gowans MFB, Grace and Mercy, Hasal, Infinity MFB, Lapo, Letshego, Mainstreet MFB, NPF MFB, SEAP, Seedvest Limited, SOBIC and Company, Standard Life, Sterling Bank, Wetland

Rwanda CPF INEZA, Goshen Finance PLC, RIM

Tanzania Amana Bank, Equity Bank, Mwalimu Commercial Bank, National Bank of Commerce (NBC), Stanbic Bank, Victoria Finance PLC, VisionFund Tanzania

Uganda Balloon Ventures, Encot, Opportunity Bank Uganda Limited (OBUL), Stanbic Bank, Ugafode, VisionFund Uganda

Zambia AB Bank, EFC, FINCA, Madison Finance, NATSAVE, VisionFund Zambia, Xtenda, Zanaco

Asia

India Cashpor*, GyanDhan, Pahal*, Varthana Finance

Indonesia BMT Ibaadurrahman, KOMIDA, Koperasi Sejahtera, KSPPS BMT ItQan, PT BPR Bank Daerah Gianyar, PT Nusantra Bina Artha

Pakistan Agahe, Kashf, SAFCO, Taleem Finance Company Limited

Latin America

Colombia Fundación El Alcaraván

Dominican Republic ADOPEM, Fondesa

Ecuador CACMU

El Salvador ASEI

Guatemala ADICLA Guatemala, ADISA, COOPSAMA, COSAMI, CREDIGUATE, Génesis

Paraguay Fundación Paraguaya

Peru ADRA

Agriculture Finance Partners

Africa

DRC Advans Congo S.A., EquityBCDC, VisionFund DRC

Ghana Fidelity Bank, Maroon Capital, Opportunity International S&L, Sinapi Aba S&L

Kenya Faulu, Juhudi Kilimo

Malawi Centenary Bank Malawi, CUMO, FINCA Malawi, First Capital Bank, Microloan Foundation, NBS Bank, Standard Bank Malawi

Mozambique MyBucks Banking Corporation (MBC)

Nigeria Grace and Mercy, Jaress, Standard MFB

Rwanda Clecam Ejo Heza, Equity Rwanda, Inkunga Finance, Urwego Bank

Uganda FINCA Uganda, Opportunity Bank Uganda Limited (OBUL), Stanbic Bank, Ugafode

Microenterprise Development Partners

Africa

DRC VisionFund DRC

Ghana Opportunity International S&L, Sinapi Aba S&L

Rwanda Urwego Bank

Uganda Opportunity Bank Uganda Limited (OBUL)

Asia

India Avanti*, Cashpor*, CDOT, ESAF*, Pahal*

Indonesia BAV, KOMIDA, TLM

Philippines TSPI

Latin America

Colombia Crezcamos, FINAGRO, Fondo Nacional de Garantías, Quipu

Dominican Republic IDH

Honduras COOP-ASPIRE

Nicaragua ASODENIC

Eastern Europe

Serbia 3Bank (Opportunity Bank Serbia)

Innovation Partners

Africa

DRC Opportunity International DRC

Ghana Sinapi Aba S&L, VisionFund Ghana, Opportunity International Ghana

Malawi VisionFund Malawi

Uganda Opportunity Bank Uganda Limited (OBUL), Opportunity International Uganda

Asia

India Avanti*, Cashpor*, CDOT, ESAF*, Pahal*

Indonesia PT Nusantra Bina Artha

Latin America

Colombia Fundación Opportunity International Colombia (FOIC)

Nicaragua Opportunity International Nicaragua

Graduation Partners

Africa

Malawi Opportunity International Malawi

Latin America

Colombia Fundación Opportunity International Colombia (FOIC)

Haiti Fonkoze, SOFIHDES

Health Finance Partners

Asia

Bangladesh BURO Bangladesh, SAJIDA Foundation, Shakti Foundation

India CDOT, ESAF Foundation*, Uplift Mutuals

Nepal Jeevan Bikas Samaj, Nirdhan

*Dia Vikas Capital (Dia Vikas) active partner. Dia Vikas is a subsidiary and part of the Opportunity International Network. Dia Vikas was established in early 2008, as a social impact investor in India, to fill the gap of social investment and thereby support the growth of Microfinance and encourage the development of start-up operations in underserved areas expanding outreach to vulnerable and excluded communities. In recognition of changing client needs, technological, regulatory, and market shifts, Dia Vikas Capital is diversifying its investments to address other inclusive finance domains such as affordable housing, livelihood creation, and education, thus addressing all elements of multi-dimensional poverty.

MAKE YOUR IMPACT

Moved to donate? Make your gift quickly and securely online at opportunity.org/2025IR

vision

Our

mission

motivation
Turn static files into dynamic content formats.

Create a flipbook
2025 Impact Report by Opportunity International - Issuu