The Bruce C Project: Economic Impact Analysis & Insights
About the Ontario Chamber of Commerce
The Ontario Chamber of Commerce (OCC) is the indispensable partner of business and Canada’s largest, most influential provincial chamber. It is an independent, non-profit advocacy and member services organization representing a diverse network of 60,000 members. The OCC convenes, mobilizes and empowers businesses and local chambers in pursuit of its purpose: to bring inclusive and sustainable prosperity to Ontario’s businesses, workers, and communities.
About the OCC’s Commissioned Work
The Ontario Chamber offers member organizations the opportunity to commission independent reports from its Economic Analysis team on topics aligned with the OCC’s purpose, vision and mission. These reports use data to investigate and contextualize issues or opportunities faced by organizations and industries, and provide objective, independent, third-party analysis. For more information, please contact our Vice-President of Policy, Vincent Caron, at vincentcaron@occ.ca.
About the Nuclear Innovation Institute
The Nuclear Innovation Institute (NII) is Canada’s premier research institute for the clean energy sector. A member-based not-for-profit organization, NII has a unique role driving sector transformation, skill development and an innovative nuclear voice. NII’s vision is a Canadian landscape that celebrates an innovative nuclear industry as an integral part of the clean energy future.
About Bruce Power
Bruce Power is an electricity company based in Bruce County, Saugeen Ojibway Nation Territory, Ontario. Its 4,200 employees play an important role in safely delivering clean, reliable nuclear power to families and businesses across the province and cancer-fighting medical isotopes around the world. Bruce Power has worked hard to build strong roots in Ontario and is committed to protecting the environment and supporting the communities in which it operates. Formed in 2001, Bruce Power is a Canadian-owned partnership of TC Energy, OMERS, the Power Workers’ Union and The Society of United Professionals.
Learn more at www.brucepower.com
PREFACE
Commissioned by the Nuclear Innovation Institute (NII) and Bruce Power, this report was prepared by the Ontario Chamber of Commerce (OCC) to provide an independent and impartial quantitative and qualitative analysis of Ontario’s nuclear sector and the potential impacts of Bruce Power’s proposed Bruce C Project.
This report includes an economic impact assessment of the proposed project, an overview of insights from stakeholder engagement, and profiles of key local businesses within the nuclear value chain. This report is not intended to be a comprehensive review of all impacts and contributions.
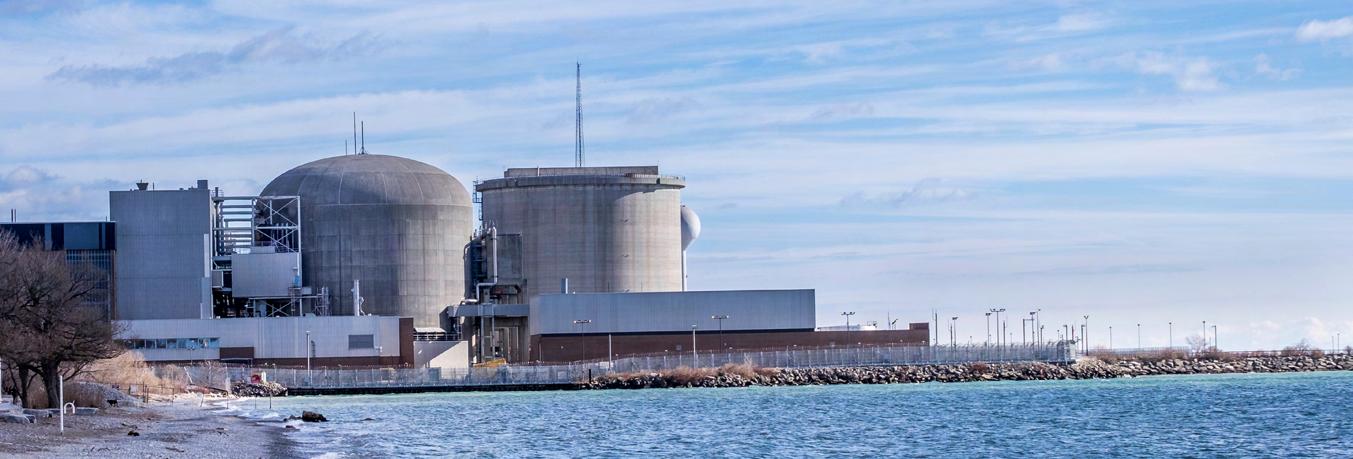
Image Source: Bruce Power
EXECUTIVE SUMMARY
Ontario is home to one of the lowest carbon-emitting large electricity grids in the world, made possible by nuclear power, which supplies approximately half of its electricity.i With nearly 40,000 megawatts of generating capacity, the province relies on a diverse supply mix that includes nuclear, hydroelectric, natural gas, and renewables, following the successful phase-out of coal.ii
Nuclear energy remains central to this system, supported by generating stations at Bruce, Darlington, and Pickering, which together provide most of Ontario’s baseload power and underpin its low-carbon grid.
Within this fleet, Bruce Power plays a critical role as the largest operating nuclear facility in Canada and a major provincial employer.
Ongoing life-extension and refurbishment projects at its site represent some of Ontario’s largest infrastructure investments, sustaining tens of thousands of jobs across its extensive supply chain and contributing billions to the economy.
Looking ahead, Ontario expects electricity demand to increase by 65 per cent over the next 25 years, driven by population growth, electrification, and an expanding digital economy.iii Nuclear power is positioned to be a vital pillar of the province’s future system, supported by large-scale refurbishments, the development of small modular reactors, and exploration of new large nuclear builds.
To support growing energy needs, Bruce Power is currently undertaking a federal integrated Impact Assessment to create the option of developing up to 4,800 megawatts of new nuclear capacity at its site in the Municipality of Kincardine, Ontario – within the territory of the Saugeen Ojibway Nation.
This report includes an independent economic impact assessment of the proposed Bruce C Project (the “Project”) to estimate economic impacts at the local, regional, provincial, and national levels during its site preparation and construction phase, as well as the operations phase.
The report also outlines key insights from stakeholder engagement on the Project, indicating broad support for expanding nuclear capacity at the existing Bruce site to meet future electricity demand and support Ontario’s clean energy and economic goals. This hinges on the expectation that environmental, social, and community impacts are proactively addressed, while ensuring government infrastructure funding aligns with projected growth patterns.
Overall findings indicate a substantial return on investments in the nuclear sector. This includes those already realized by local businesses on the ground and in communities surrounding the Bruce site, and those yet to be realized from incoming projects.
Over an approximate 80-year project lifespan, the analysis estimates the following:
NATIONAL IMPACTS
Over 10,000 jobs
created or supported annually on average
(nearly 830,000 total jobs created or supported across the Project’s lifespan)
$1 billion annually in labour income on average
(nearly $80 billion total)
$2.9 billion annually in GDP contribution on average (nearly $238 billion total)
$416 million annually in taxes across governments on average (over $34 billion total)
ONTARIO IMPACTS
REGIONAL IMPACTS
8,700 jobs created or supported annually on average (714,000 total)
$870 million annually in labour income on average ($71 billion total)
$2.7 billion annually in GDP contribution on average (over $217 billion total)
$390 million annually in taxes across governments on average ($32 billion total)
5,800 jobs
created or supported annually on average (nearly 475,000 total), peaking at 11,900 direct construction jobs
$570 million annually in labour income on average (nearly $47 billion total)
$2.3 billion annually in GDP contribution on average ($188 billion total)
$196 million annually in taxes across governments on average ($16 billion total)
Relative to peer jurisdictions, Ontario’s electricity system is one of the lowest carbon-emitting large grids due to the province’s long-standing use of nuclear energy in its supply mix, which currently accounts for approximately half of the province’s electricity generation (Figure 1).iv
Ontario is Canada’s second-largest producer of electricity after Quebec, with an estimated generating capacity of nearly 40,000 megawatts. Capacity is the measure of how much electricity the system can produce at its peak. Total available capacity changes over time as new generators are built, outdated ones are retired, and technological advances update the mix of available supply.vi
Ontario’s electricity system currently draws on a combination of nuclear, hydroelectric, natural gas, and renewable sources (Figure 2). Ontario became the first jurisdiction in North America to phase out coal-fired electricity in 2014 – a transition made possible in large part by the reliability and scale of nuclear generation.
Figure 1: Global Electricity Grids and Carbon Footprint (gCO2/KWh)v
Note: The above values exclude generators operating within local distribution networks, except those participating in the IESO-administered market. Currently, most solar facilities in Ontario are connected to the distribution system.
Note: The referenced values include facilities from real-time supply output and transmission-connected units with an installed capacity of under 20-megawatt capacity. Embedded generation is not included.
While nuclear power accounts for more than 30 per cent (over 12,000 megawatts) of the province’s installed electricity generation capacity, the sector’s actual output provides approximately half of Ontario’s current baseload generation. This output is produced from three nuclear generating stationsviii:
• Bruce A and Bruce B, operated by Bruce Power
• Darlington, operated by Ontario Power Generation
• Pickering, operated by Ontario Power Generation
Figure 2: Ontario’s Electricity Capacity and Generation Mixvii
Bruce Power within Ontario’s Nuclear Fleet
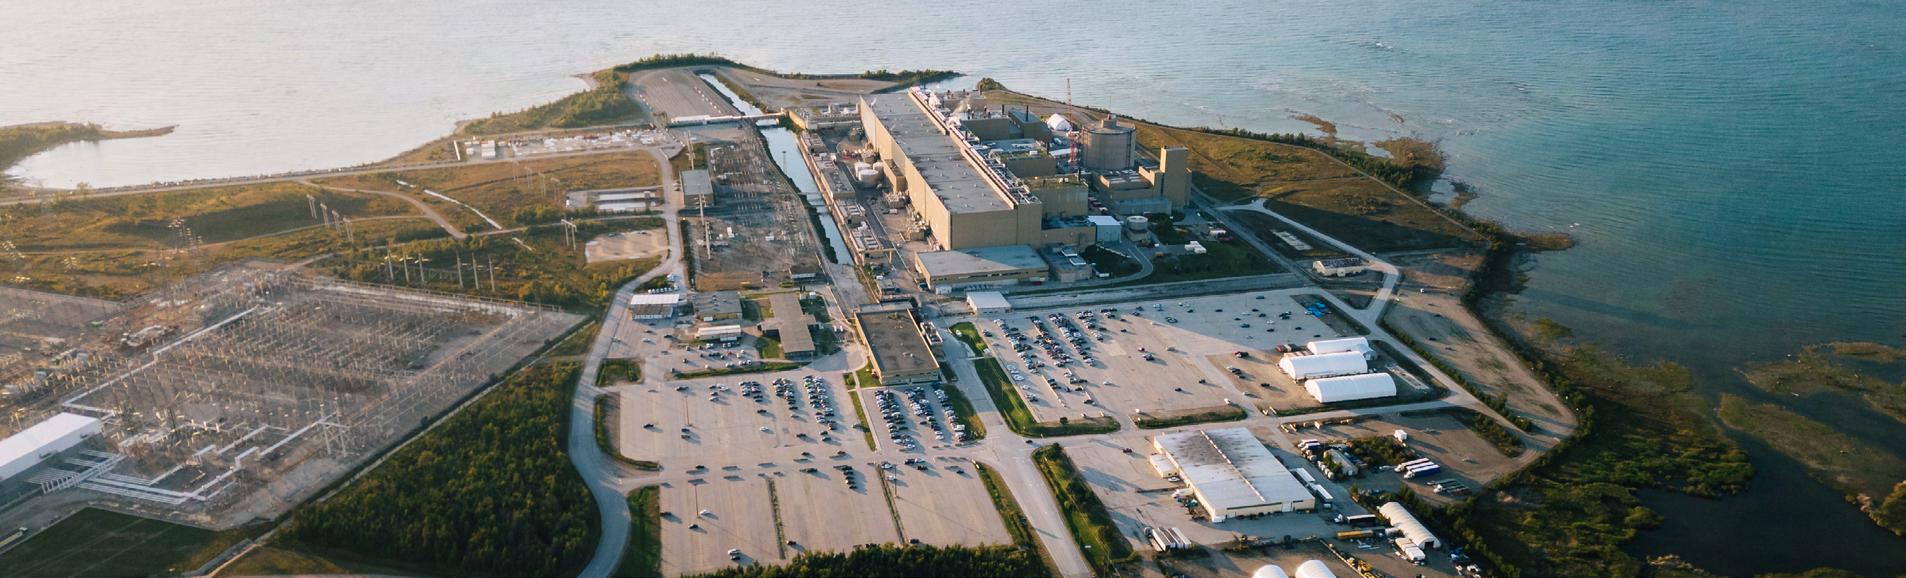
Bruce Power is Canada’s only private sector nuclear generator and has a long track record of providing clean, affordable and reliable energy. Its facility generates nearly 30 per cent of Ontario’s current electricity needs each year through the Bruce A and Bruce B generating stations, making it a significant energy asset within the provincial grid.
Bruce Power’s site is located on the eastern shore of Lake Huron in the Municipality of Kincardine, Ontario, within the territory of the Saugeen Ojibway Nation (SON). The facility consists of eight CANDU1 reactors with a total generating capacity of approximately 6,500 megawatts, making it one of the largest operating nuclear power facilities in the world.
Bruce Power currently employs over 4,000 workers and supports thousands more jobs through a large network of contractors, suppliers, and maintenance programs across Ontario’s nuclear supply chain. Bruce Power is actively engaged with around 60 nuclear suppliers in the tri-county Clean Energy Frontier region (Bruce, Grey and Huron counties) alone.ix
The Bruce site is now undergoing a multi-year Life-Extension Program, a large infrastructure initiative designed to extend the operational life of its reactors by several decades. One key part of this program is the Major Component Replacement (MCR) Project, which looks to replace and refurbish six of the eight reactors and represents one of the most substantial infrastructure projects in Ontario’s energy sector, involving extensive participation from Canadian manufacturing and engineering firms.
1 A Canada Deuterium Uranium (CANDU) reactor is a Canadian-developed pressurized heavy-water system used around the world for power generation. It runs on natural uranium and uses heavy water as a moderator to provide continuous, carbon-free electricity.
The MCR program’s operations alone are estimated to secure over 22,000 jobs directly and indirectly, with an additional 5,000 jobs annually throughout the investment program. These operations also contribute billions to both Ontario and Canada’s economies, with over 90 per cent of the company’s supply chain spending occurring directly within the province.x
Bruce Power is a global leader in the production of medical isotopes, using nuclear innovation to support cancer-fighting treatments and medical sterilization for patients around the world. This leadership is strengthened through its Gamzook’aamin aakoziwin (Anishnaabemowwin for “We are Fighting the Sickness Together”) partnership with the Saugeen Ojibway Nation, underpinned by a historic $250-million investment that expands isotope production while advancing economic reconciliation and long-term shared prosperity.
From an environmental perspective, the Bruce site is an existing operational site that continuously monitors data collection, analyses, and risk assessments. This information is iteratively reviewed, approved, and regulated by multiple authorities, including the Ontario Ministry of the Environment, Conservation and Parks; Fisheries and Oceans Canada; Environment and Climate Change Canada; and the Canadian Nuclear Safety Commission (CNSC).
THE CASE FOR NUCLEAR ENERGY
In Ontario’s integrated energy plan, Energy for Generations, nuclear power is central to the province’s energy strategy and ambition to reduce electricity sector emissions. Nuclear generation underpins a stable, self-reliant electricity system that can meet the needs of households, industry and emerging sectors of the economy.
Environmental Contributions
Ontario’s current energy supply mix demonstrates an electricity system that is largely powered by non-carbon emitting sources such as nuclear, hydroelectric, and renewables. Despite higher upfront costs relative to other low-carbon options, the high reliability, continuous dispatchability, and long-term return on investment of nuclear power make it critical to low-carbon energy markets. In addition to reducing emissionsxi, nuclear plants operate at high-capacity factors, meaning they can generate large quantities of electricity continuously regardless of weather conditions.
Ontario’s use of nuclear energy also played a central role in the province’s ability to phase out coal-fired electricity generation. This transition helped eliminate over 30 megatonnes of greenhouse gas emissions annually, making it one of the largest emissions-reduction initiatives in North America.
Economic and Socioeconomic Contributions
The nuclear sector is also key to Ontario’s advanced energy economy. Beyond electricity generation, the industry supports a broad network of skilled workers, research institutions, manufacturers, specialized service providers, and localized economies of scale, contributing to economic activity across Ontario. It also significantly contributes to economic development through related industries such as nuclear medicine and isotope production, and economic participation partnerships with local Indigenous communities.
The sector supports tens of thousands of direct and indirect jobs in research and development, reactor operations, engineering, construction, nuclear medicine, and advanced manufacturing. Its workforce includes professional, technical and skilled tradespeople employed through long-term infrastructure initiatives, including reactor refurbishment and replacement, and ongoing maintenance programs. These projects often span multiple decades, creating sustained employment and investment opportunities.
As a result, Ontario has one of the world’s most established nuclear supply chains, with hundreds of companies providing components, specialized equipment, and technical services for nuclear facilities. Many of these firms are in manufacturing regions throughout Ontario and supply both domestic nuclear projects and international markets. This industrial ecosystem includes companies involved in reactor component fabrication, fuel systems, instrumentation and control technologies, engineering consulting, and project management.
The industry further contributes to regional economic development in communities that host generating stations, particularly in Bruce County and Durham Region. Nuclear facilities, and the people they employ directly and indirectly, support local businesses, municipal revenue and infrastructure investment. Partnerships with universities and research organizations contribute to innovation in areas such as medical isotope production and advanced reactor technologies.
Ontario’s nuclear sector has prioritized reconciliation and relationships with several Indigenous and Métis communities. These include targeted efforts to support Indigenous economic participation through procurement opportunities, training programs, and workforce development initiatives.xii
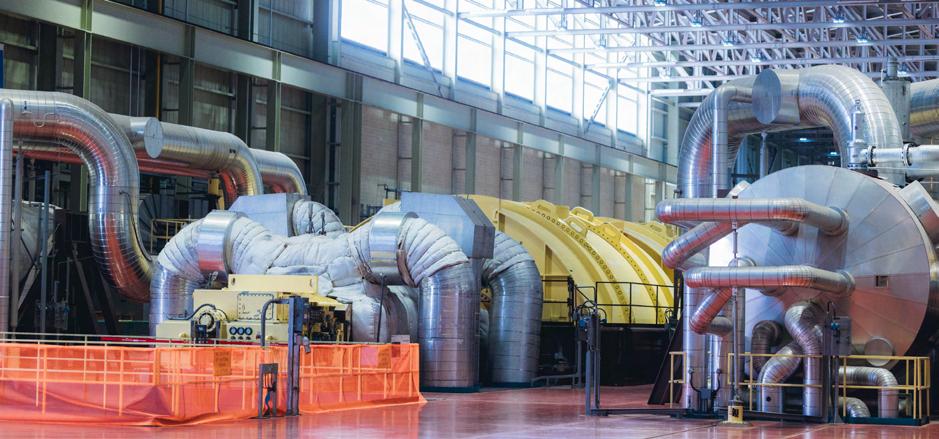
Image Source: Bruce Power
Image Source: Bruce Power
Image Source: Bruce Power
A Plan for the Future
Recent estimates suggest electricity demand in Ontario is projected to increase by 65 per cent by 2050 due to economic and population growth, the expansion of digital and advanced manufacturing economies and the electrification of transportation, industry, and heating.xiii Electricity demand from the data-centre industry is growing rapidly, fueled by data-heavy technologies such as artificial intelligence, cloud computing, and data processing tools, with data centres projected to make up 13 per cent of Ontario’s new electricity demand by 2035. xiv
To help address this rapidly growing demand, the provincial government unveiled the Energy for Generations plan, a long-term framework for ensuring Ontario has reliable, affordable, and clean energy through 2050. The strategy coordinates planning across natural gas, electricity, storage, hydrogen, and other resources. Ontario’s long-term energy plan envisions an even greater role for nuclear power in the province’s future electricity system, given its ability to provide continuous, large-scale baseload power.xv
Ontario’s Global Nuclear Advantage
Thanks to its extensive experience in nuclear refurbishment and operations, along with its commitment to small modular reactors, Ontario has a myriad of competitive advantages, including:
• A highly skilled workforce;
• Proven project expertise;
• Strong commitments to and relationships with Indigenous rights-holders and local communities;
• A robust local nuclear supply chain; and
• A regulatory and project-delivery environment necessary for ensuring the safety, sustainability, and effectiveness of emerging technologies.
Ontario’s robust nuclear supply chain and specialized technical expertise in nuclear power across several technologies help strengthen its global competitiveness. As international interest in nuclear energy grows as a tool for energy security and decarbonization, Ontario is well positioned. Its experience in nuclear operations, refurbishment, and next-generation reactor technologies creates opportunities to contribute to global projects while unlocking new economic value: Ontario-based firms and institutions can support the design, construction, and supply chains of projects in other jurisdictions pursuing nuclear energy as part of their clean energy strategies.
THE BRUCE C PROJECT
As Ontario prepares for growing energy needs, Bruce Power is undertaking a federal integrated Impact Assessment process led by the Impact Assessment Agency of Canada (IAAC) alongside the Canadian Nuclear Safety Commission (CNSC) to build up to 4,800 megawatts of new nuclear capacity.
The proposed Bruce C Project (the “Project”), would complement the site’s existing Bruce A and Bruce B generating stations, and would make Bruce Power the largest nuclear generator in the world with a capacity of 12,000 MW. The Project remains subject to regulatory approvals through the federal integrated Impact Assessment process, which requires engagement with Indigenous nations and communities, municipalities and the public.
The Project would be designed to operate for decades, reflecting the long operational lifespans typical of large nuclear generating stations. At this stage of planning, a specific reactor technology has not yet been selected. Instead, the Impact Assessment is being conducted using a technology-neutral approach, evaluating a range of potential reactor technologies and design parameters to assess the Project’s potential environmental, health, social, and economic effects. This allows the assessment to establish an upper range of potential impacts while maintaining flexibility in future technology selection.
The overall process includes multiple phases and involves extensive environmental and socioeconomic studies, as well as engagement with Indigenous Nations and communities, municipalities, and the public. These assessments are intended to evaluate existing environmental and social conditions, identify potential project effects, and consider measures to mitigate any such impacts while enhancing the Project’s potential benefits.
The assessment process is intended to ensure that any future development is evaluated against environmental protection requirements, regulatory standards, and Indigenous, municipal and stakeholder considerations before a final investment or construction decision is made.xvi,xvii
Image Source: Bruce Power
ECONOMIC IMPACT ASSESSMENT
The following economic impact assessment was prepared to estimate the potential economic impact and contributions of the proposed Bruce C Project at the local1, regional2 (Figure 3), provincial, and national levels during its site preparation and construction phase, as well as the operations phase. It was conducted using proprietary modelling and methodology informed by Statistics Canada input-output multipliers.
The potential economic contributions were studied through direct, indirect, and induced effects from building and operating the Project over its lifespan across four economic indicators: gross domestic product (GDP), employment, labour income, and tax revenue for municipal, provincial, and federal governments.3 They do not include other downstream socio-economic impacts such as the benefits associated with greater energy security and reliability, innovation and industrial knock-on effects, promoting a low-carbon source of energy, and the production of medical isotopes. All financials are expressed in 2021 Canadian dollars unless otherwise noted.
1 The local study area includes the Municipality of Kincardine and Town of Saugeen Shores.
2 The regional study area includes the Bruce, Grey, and Huron counties, known locally as the Clean Energy Frontier.
Image Source: Nuclear Innovation Institute
3 Definitions for terms can be found in Appendix C: Glossary of Terms.
Figure 3: Map of the Clean Energy Frontier Region, Ontario
LAKE HURON
GEORGIAN BAY
LAKE ONTARIO TORONTO
CHIPPEWAS OF NAWASH
GREY
BRUCE
HURON
SAUGEEN FIRST NATION
KINCARDINE
Estimates are based on a technology-neutral4 4,800-megawatt large nuclear deployment, with a total project value calculated by benchmarking against other large nuclear projects in comparable jurisdictions. The assessment aims to provide a reasonable understanding of the potential economic impacts in advance of any decisions about the specific reactor technology or design.
Individual impacts are calculated separately for both phases of the proposed Project. The site preparation and construction phase is estimated to take 18 years from the start of site preparation to final unit commissioning, and the operations phase is estimated to be 73 years long. For the purposes of this assessment, the Project’s total lifespan is assumed to be approximately 80 years with overlap between the two phases5 (Figure 4). A summary of total impacts over the Project’s lifetime and by phase can be found in Appendix A.
Figure 4: Onsite Workforce, All Phases
+ indicates annual average for remaining length of phase 14,000
Operations
These anticipated impacts would bolster the already significant national, provincial, and regional economic contributions of Bruce Power’s existing site, as illustrated in the OCC’s 2019 study examining the impacts of Bruce Power’s ongoing Major Component Replacement Project. The 2019 study demonstrated a $4.8-$7.1 billion increase in provincial GDP, a $3.8-$4.6 billion contribution to labour income for workers in Ontario, and provincial tax revenue of upwards of $700 million.
The proposed Project has the potential to deliver significant near- and long-term economic benefits for local communities, the surrounding region, and across Ontario and Canada.6 These impacts would arise from capital and operating expenditures during site preparation and construction, and throughout operations. While the direct benefits would be primarily focused within Ontario, the Clean Energy Frontier (CEF) region, and the local study area, other indirect and induced benefits would extend nationwide through procurement and supply chain activity. Importantly, many of the jobs created could be filled by those living both locally and regionally, and thereby support economic activity throughout the region and not just the immediate local communities.
4 A reactor technology has not yet been selected for the Bruce C Project. A technology-neutral approach involves the consideration of multiple technologies to provide optionality to the province in long-term electricity system planning, and is an approach previously used in regulatory decision-making processes for new nuclear power projects in both Canada and the U.S. Bruce Power’s evaluation of prospective nuclear technologies will focus on the value for ratepayers, opportunities for Indigenous Nations and Communities, socioeconomic benefits for local communities, and factors including safety, environmental impact, reliability and cost.
5 The site preparation and construction phase is estimated to overlap the operations phase in the years 2037 to 2045.
6 A summary of the economic impact assessment’s findings can be found at: https://occ.ca/wp-content/uploads/Final_Bruce-C-Project-Economic-Impact-AssessmentSummary-Jan-16.pdf
Employment and Income Impacts
A substantial number of jobs would be created or supported in the CEF, Ontario, and across Canada over an extended period for both phases. Job impacts are significantly larger during the construction phase and peak in 2040 when the two phases overlap (Figure 5). Most of these jobs are concentrated in the CEF relative to other parts of Ontario and Canada. At its peak, the region is estimated to see over 22,300 total jobs supported, and:
• Over 12,700 direct and onsite workers (11,630 in direct construction employment and 1,070 in direct full operational employment)
• 2,850 indirect jobs from upstream suppliers
• 6,750 induced jobs supported by worker spending activity
Over the Project’s entire approximate lifespan of 80 years, an average of over 10,100 jobs would be created or supported in Canada each year, of which approximately 8,700 would be in Ontario, nearly 5,800 in the CEF, and nearly 3,400 in the outlined local study area of Kincardine and Saugeen Shores.
Together, these jobs would provide an average annual labour income (including wages and benefits) of approximately $1 billion at the national level, of which nearly $900 million would be earned annually by those employed in Ontario, nearly $600 million annually for those employed regionally in the CEF, and over $400 million annually for those employed locally in Kincardine and Saugeen Shores (Appendix A).
+ indicates annual average for remaining length of phase
Figure 5: Clean Energy Frontier Job Impacts, All Phases
During Site Preparation and Construction
Site preparation and construction work is proposed to take place over 18 years, beginning in 2028. Within this timeframe, the Project’s labour demands vary from year to year, with the directly employed labour force peaking in years 7 to 13, reaching an estimated high of 11,900 jobs in year 11. The composition of the construction workforce would be expected to change significantly within overall demand based on the shifting requirements of the work plan.
Roughly 30 per cent of the construction workforce would not be construction workers but administrative workers overseeing the work and developing the future workforce for when the facility moves to production. Upstream occupations would also be expected to shift significantly over this timeframe, particularly given the large share of complex machinery and equipment purchases intrinsic to nuclear power electricity generators.
Ontario
At the peak of construction (projected for 2037), 18,720 jobs are expected to be supported in Ontario annually both directly at the site and in upstream industries. In addition, 6,770 induced jobs would be supported to meet consumption activities from income earned by site and supporting workers (Figure 6). On average, 15,900 total full-time equivalent (FTE) jobs would be created or supported annually in Ontario during the construction phase.
Direct and indirect jobs during the construction phase are well paid, supporting labour incomes (including wages and benefits) averaging $125,000 annually for jobs directly working on site and $75,000 annually for jobs in upstream industries. Induced jobs are estimated to pay $58,000 annually, although the pay varies between supporting industries.
Total labour income generated from construction is estimated to peak in 2037 at $2.4 billion annually, of which $1.5 billion would come from those directly employed and those working in upstream industries.
+ indicates annual average for remaining length of phase
Figure 6: Ontario Job Impacts, Construction Phase
Clean Energy Frontier
At a regional level, a substantial number of jobs in the CEF would be created or supported by the Project over the site preparation and construction phase, with the total number of jobs estimated to rise to more than 19,100 by 2037 and averaging nearly 14,800 thereafter (Figure 7). The majority of these jobs would be in direct, on site jobs.
At the local level for Kincardine and Saugeen Shores, a total annual average of nearly 8,500 FTE jobs would be created or supported during this phase of the Project.
Regional jobs supported by the Project have a lower share of indirect upstream employment and more from induced employment. While induced employment earn less than direct jobs in the construction sector, the total labour income per job in the CEF is still estimated to be over $95,000.
Figure 7: Clean Energy Frontier Region Job Impacts, Construction Phase
Image Source: Bruce Power
During Operations
The employment effects of project operations are substantive and sustained over a longer timeframe, allowing for the potential for longterm employment opportunities and stable planning for supporting industries. Unlike in construction, production processes and the associated occupational mix of direct, indirect, and induced jobs in this phase are steadier.
Ontario
The number of operations jobs at the site would gradually increase as more parts of the facility came online. The initial 270 estimated direct FTEs at the beginning of the operations phase in 2037 would be expected to grow to 1,070 by 2040, sustaining that level annually until 2046. Beyond this, over 1,200 direct jobs would be supported, on average, over the remaining years of the Project’s operating life, with the exact workforce varying depending on maintenance requirements.
Across Ontario, the Project is expected to support a sustained annual average of 5,900 total jobs over the duration of the operations phase, with direct jobs averaging a salary of over $250,000 and an average $66,000 salary for jobs in supporting and serving consumption industries.
Clean Energy Frontier
Within the region, the total job impact is expected to exceed 3,200 by 2040, with approximately 560 jobs in supporting industries and 1,600 jobs from induced impacts. Throughout the region, the Project is anticipated to support an annual average of nearly 3,600 total jobs over the course of the facility’s operations phase. The average labour income from operations and maintenance jobs within the CEF is expected to be $95,000. More than 60 per cent of the labour income impacts would come from direct jobs.
Figure 8: Ontario Job Impacts, Operations Phase
Figure 9: Clean Energy Frontier Region Job Impacts, Operations Phase
Gross Domestic Product and Industry Impacts
The proposed Bruce C Project would make a sizable long-term contribution to Canada and Ontario’s GDP. Over its approximate 80-year lifespan, the Project is estimated to contribute a total of nearly $238 billion to Canada’s GDP, including over $217 billion to Ontario’s and $188 billion to the CEF’s regional GDP.
On an average annual basis, the Project would contribute $2.9 billion to Canada’s GDP, including nearly $2.7 billion to Ontario, $2.3 billion to the CEF, and $2 billion to local GDP over its lifespan across both phases (Appendix A).
In the combined peak year of 2040, when the facility has moved into full production while construction is ongoing, it would add $6.6 billion of value to Ontario’s economy (Figure 10). Beyond expenditure-based impacts, the added value from the electricity generated at the Bruce Power site would provide an extra $1.1 billion annually to Ontario’s GDP from direct impacts during operations, and $1 billion in indirect and induced impacts, for a combined total of $2.1 billion annually.7
Together, these projected contributions illustrate the potential size and scale of economic benefits resulting from value-added activities at the Bruce Power site, beyond those contributions generated from the Project’s expenditures alone.
7 Applying the average operating surplus for utilities to expenditures.
+ indicates annual average for remaining length of phase
Figure 10: Ontario GDP Impact, All Phases
During Site Preparation and Construction
The GDP generated by the Project during site preparation and construction would grow over time, reaching its peak in 2037 at $5.5 billion for Canada, of which $4.6 billion would be in Ontario. For the remaining eight years of the construction phase, the GDP contribution for Canada would average $3.4 billion ($2.9 billion in Ontario).
The distribution of supporting and induced industries in Ontario with the most participation during this phase are shown in Figure 11 below, measured using job-years or total full-time work over time. The greatest concentration of job impacts stems from manufacturing (nearly 35,000 total job-years supported) due to the high equipment and material requirements of the Project’s construction. This is followed by technical services (nearly 23,000 job-years) and construction services (over 21,000) primarily driven by upstream demand. Given its outsized relationship to induced effects, the retail industry also drives a large portion of job impacts (nearly 23,000).
The distribution of jobs in the CEF, including Kincardine and Saugeen Shores, is influenced by the distribution of existing industries as well as the economic opportunities that would be provided by the Project. Based on current conditions, the local industry with the largest number of jobs supported during the construction phase would be professional services (over 6,000 job-years) and retail (nearly 4,000 jobyears) within the local area. Figure 12 combines local study area and CEF effects, demonstrating much greater participation due to existing capacity by manufacturing industries (nearly 20,000 job-years within the CEF).
Figure 11: Industry Distribution of Jobs, Ontario, Construction Phase
Figure
Agriculture, forestry, fishing and hunting
Utilities
Manufacturing
Wholesale trade
Retail trade
Transportation and warehousing
Information and cultural industries
Finance and insurance
Real estate and rental and leasing
Professional, scientific and technical services
Administrative and support, waste management and remediation services
Health care and social assistance
Arts, entertainment and recreation
Accommodation and food services
Other services (except public administration)
During Operations
The Project is expected to generate significant and steady GDP contributions during the longer operations phase. By the time the facility goes into full operations in 2040, $2.2 billion in GDP would be generated annually in Canada, of which $2.1 billion would be in Ontario. Over the longer term beginning 2047 onwards, the average contribution to Canada’s GDP would be $2.4 billion annually, of which $2.3 billion would be generated in Ontario.
The supporting and induced industries in Ontario with the most participation during operations are shown in Figure 13. Nearly 65,000 total job-years are estimated to be supported in the retail industry, with an outsized relationship to induced effects (driven by employee spending activity). Close to 61,000 job-years are estimated to be supported in construction industries due to the Project’s large upkeep and ongoing maintenance requirements.
Based on existing industries in the CEF and the local study area, as well as the economic opportunities that would be created by the Project, the local industry with the highest number of jobs supported during this phase would be retail trade (nearly 8,000 job-years), utilities (over 6,000), and accommodation and food services (nearly 6,000) within the local area. Figure 14 combines the CEF and local study area effects, demonstrating even larger participation in the CEF region by retail industries (over 37,000 job-years) and capacity for additional participation by accommodation and food services and manufacturing (each nearly 20,000).
Figure 13: Industry Distribution of Jobs, Ontario, Operations Phase
Figure
Utilities
Manufacturing
Wholesale trade
Retail trade
Transportation and warehousing
Information and cultural industries
Finance and insurance
Real estate and rental and leasing
Professional, scientific and technical services
Administrative and support, waste management and remediation services
Health care and social assistance
Arts, entertainment and recreation
Accommodation and food services
Other services (except public administration)
Public administration
Fiscal Impacts
Over its 80-year lifetime, the proposed Project would result in significant tax revenue across all levels of government, averaging nearly $164 million in direct and indirect taxes8 annually for the federal government and $153 million annually for Ontario’s government.
From inception through operations, average annual income taxes would amount to an estimated $100 million federally and $55 million provincially for Ontario. Indirect tax revenue generated from those on products and production are estimated to amount to:
• $35 million annually for the federal government
• $70 million annually for the Government of Ontario
• $55 million annually for municipal governments within the CEF
• $37 million annually for the Municipality of Kincardine and Town of Saugeen Shores9
As outlined before, the highest level of combined economic impact with respect to GDP and jobs generated from the Project is in the year 2040, when both phases overlap. That said, municipal property tax revenue is considerably lower in the construction phase and does not reach its peak until 2045 at $335 million (Figure 15).
8 Definitions for terms can be found in Appendix C: Glossary of Terms.
9 Municipal-level indirect taxes are based on existing average municipal tax rates in Ontario.
+ indicates annual average for remaining length of phase
Figure 15: CEF Total Municipal Fiscal Impact ($ Millions)
During Site Preparation and Construction
Construction activities require a significant volume of materials and equipment, which are typically associated with taxes on products: fuel, sales, and sometimes tariffs. During this phase, taxes on products would raise $46 million annually in revenue for the federal government and $63 million annually for the Ontario government. Construction also has a high labour component, and income taxes on that labour are estimated to generate $168 million annually for the federal government and $88 million annually for the Ontario government (Table 1).
For municipalities in the CEF, property taxes would contribute an estimated $44 million annually, with over 60 per cent of this being generated from induced economic activity associated with higher regional incomes (Table 1). Combining all forms of taxes, the construction phase of the Project would produce an estimated average total of:
• $276 million annually for the federal government
• $228 million annually for the Government of Ontario
• $45 million annually for municipal governments within the CEF
• $29 million annually for the Municipality of Kincardine and Town of Saugeen Shores Table 1: Average Annual Fiscal Impacts ($
During Operations
The operations phase is associated with high levels of income, particularly for direct jobs. As such, income taxes would raise an estimated $72 million annually for the federal government, of which $47 million would come from direct jobs, and $41 million annually for the Government of Ontario, of which $30 million would come from direct jobs. Operations are also associated with higher property taxes (as part of taxes on production). For municipalities in the CEF, property taxes would generate $50 million annually (Table 2).10
Combining all forms of taxes, the operations phase of the Project would produce an estimated average total of:
• $116 million annually for the federal government
• $116 million annually for the Government of Ontario
• $51 million annually for municipal governments within the CEF
• $35 million annually for the Municipality of Kincardine and Town of Saugeen Shores
Table 2: Average Annual Fiscal Impacts ($
10
STAKEHOLDER INSIGHTS
The Bruce C Project has the potential to contribute significantly to the economy, the nuclear value chain, and surrounding businesses. At the same time, thoughtful consideration of stakeholder perspectives, including identified concerns and potential challenges, will be important in assessing the Project’s overall value and longterm success.
The OCC collected feedback from local, regional, and provincial stakeholders. These included representatives from local municipal governments, townships, and counties, Indigenous organizations, industry associations, chambers of commerce, economic development bodies, labour unions, educational institutions, health and environmental organizations, and the nuclear sector and related supply chain.
The goal of this consultative work was to:
• Socialize findings from the OCC’s preliminary economic impact assessment of the Bruce C Project and their relevance to the local/regional/provincial landscape;
• Encourage knowledge-sharing and dialogue among relevant municipalities and regional business community members to help align project planning and delivery with managing economic impacts of the proposed Project; and,
• Provide an avenue for stakeholders and communities near the Bruce site to discuss and address local impacts and opportunities.
Workforce Development and Labour Market Capacity
Stakeholders emphasized the scale of workforce requirements associated with the Project and the need for proactive labour force planning. Municipal, industry, and community participants noted that the existing regional labour pool is insufficient to meet anticipated demand without substantial training and upskilling. They also raised concerns about competition for skilled workers, the impact on existing employers, and the importance of understanding the balance between permanent and transient workers to support long-term planning.
Labour organizations see the Project as a significant opportunity to create high-quality, wellpaying jobs and expand apprenticeship pathways, while municipal leaders stressed the need for coordinated government support to ensure local residents can benefit from emerging opportunities.
Housing Availability and Affordability
Stakeholders noted housing as an urgent challenge linked to the Project. Like other regions of Ontario, the region is facing housing shortages and affordability pressures, particularly in communities experiencing growth from other major infrastructure projects. The anticipated influx of workers – especially those who may be transient – could further strain the local housing market, leading to displacement risks for vulnerable populations and heightening pressures on rental and ownership markets. Stakeholders urged local governments to develop dedicated workforce housing strategies, ensure greater diversity in housing options, and leverage both host and rural communities to distribute housing demand.
Infrastructure, Transportation and Municipal Service Capacity
Municipal leaders highlighted the need for proactive planning and investments to address infrastructure and servicing requirements associated with Project-induced population and workforce growth. Priority areas include transportation networks, including winter road access, collision-prone corridors, and connectivity between communities; water and wastewater; and recreation and community amenities. Existing infrastructure and transportation networks already operate at or near capacity, and rapid population increases may overwhelm systems without supplemental investment. While supportive of the Project’s economic contributions, municipalities seek additional planning, fiscal, and technical capacity to respond effectively, and expect provincial ministries to align infrastructure funding with projected growth patterns.
Indigenous Engagement and Reconciliation
Feedback underscored the importance of ongoing, meaningful engagement with Indigenous Nations and communities throughout the development process. Priorities include transparent communication, the incorporation of Indigenous knowledge into assessments, and approaches that enable continued economic participation and partnership opportunities. While past collaborations between Bruce Power and Indigenous Nations and communities have been constructive, reconciliation must remain central in project planning, particularly related to environmental stewardship, cultural understanding, and long-term community benefits. This also includes addressing legacy issues to ensure existing site operations maximize benefits and reduce regional impacts to Indigenous communities.
Environmental, Social, and Community Well-Being
Stakeholders acknowledge the extensive environmental monitoring already in place at the existing Bruce site but stressed the importance of continuing to safeguard human health, local ecosystems, and the Great Lakes.
Social considerations also featured prominently, raising concerns about the potential displacement of vulnerable residents, increased demand for social services, and risks associated with transient workforce populations. At the same time, many see opportunities to strengthen community well-being by continuing to invest in inclusion, cultural awareness and amenities that contribute to quality of life. Stakeholders highlighted the importance of ensuring growth does not outpace the region’s ability to deliver on healthcare, childcare, and recreational services to support both residents and incoming workers.
Education partners identified significant implications for school capacity, enrolment, and transportation infrastructure resulting from projected growth associated with the Project. With some schools already experiencing pressures, school boards emphasized the need for early and sustained engagement to ensure adequate planning for expansions, new facilities, and safe transportation routes.
Economic Impact Assessment Approach and Data Gaps
Various feedback pointed to the limitations in relying primarily on inputoutput based economic impact assessments, particularly their ability to capture community-level conditions and lived realities. While stakeholders acknowledge the value of regional and provincial impact estimates, they emphasized the need for more granular baseline data to better reflect local circumstances in both the host municipality and neighbouring communities. This includes detailed information on population dynamics, housing availability, household composition, and workforce characteristics. They note that without such localized data, it can be challenging to fully understand the extent of how project economic impacts might translate into on-the-ground effects or to support coordinated planning across and between governments, service providers, and social infrastructure.
There is a broad consensus that expanding nuclear capacity at Bruce Power’s existing site is necessary to meet projected electricity demand and support Ontario’s clean energy transition. Many stakeholders emphasized the essential role of nuclear power in achieving net-zero emissions, providing reliable, non-emitting baseload power, and enhancing Ontario’s economic growth potential and competitive advantage.
The existing Bruce location is viewed as ideal given already-available space, established transmission corridors, a skilled workforce, and decades of operational experience. This support is paired with the expectation that planning processes will adequately address environmental, social, and community impacts to ensure the Project’s long-term success, with a commitment from government to align infrastructure funding with projected growth patterns.
Image Source: Bruce Power
ONTARIO’S NUCLEAR VALUE CHAIN: LOCAL BUSINESS SPOTLIGHTS
Bruce Power’s long-term operations, refurbishment, and life-extension activities support a dense network of suppliers and service providers that have chosen to invest, hire, and innovate in the Clean Energy Frontier region because of the organization’s long history, stability, and growth. These businesses range from specialized engineering and nuclear services firms to construction, manufacturing, hospitality, and professional services companies that anchor jobs, skills development, and community investment close to the Bruce site.
The following business profiles help illustrate Bruce Power’s wide reach and extensive network, demonstrating how the company’s presence translates into real economic value and community development on the ground.
Image Source: Nuclear Promise X
Image Source: Nuclear Promise X
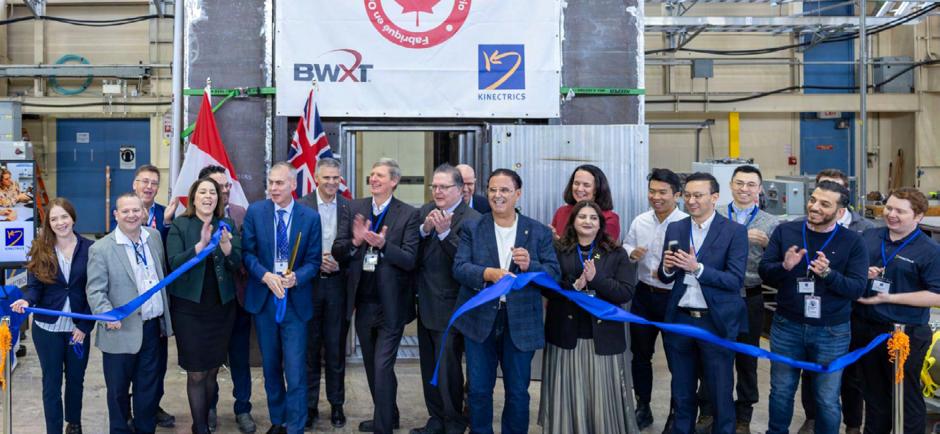
Image Source: Kinectrics
Nuclear Promise X
Nuclear Promise X (NPX) is a Canadian nuclear innovation and consulting firm that supports utilities in engineering, project delivery, digital transformation, and artificial intelligence (AI). Founded in 2018 in Bruce County, NPX is headquartered in the region with offices in Kincardine and Port Elgin.
While deeply rooted in the local community, NPX now supports nuclear projects across Canada, the United States, and other overseas regions, exporting expertise developed within Ontario’s strong nuclear ecosystem. Today, the company employs approximately 160 people, including engineers, project managers, digital specialists, and AI practitioners, many of whom live in surrounding communities and are building long-term careers in nuclear.
Bruce Power’s long-term presence has been foundational to NPX’s creation and growth. When it launched, Bruce Power’s willingness to work with a new local supplier gave the company the confidence to invest early, build nuclear-grade quality systems, and pursue a long-term growth strategy rather than focusing on shortterm contracts.
Bruce Power’s clear planning horizon, lifecycle extension program, and commitment to innovation and new nuclear have created an environment where NPX can plan decades ahead. This stability has helped the company navigate broader economic uncertainty, including the COVID-19 pandemic and recent geopolitical challenges, by focusing on retaining talent, hiring, and expanding its capabilities, even as other sectors contracted. NPX’s work has created employment opportunities in software engineering, AI, and digital transformation, roles that historically were not available in many rural parts of Ontario.
Work related to the proposed Bruce C Project is further driving demand for NPX’s strategy, engineering, and project management services, while collaborations with Bruce Power have included digital engineering initiatives, AI applications, robotics deployments, and advanced monitoring solutions that support predictive maintenance and operational efficiency.
Most recently, NPX, in partnership with Makwa Development, has been retained by Bruce Power as its Project Management Partner for the next phase of the Project, to support ongoing planning, feasibility assessments, and engagement related to potential nuclear expansion at the Bruce site.
NPX is deeply engaged in the community with a commitment to extending the benefits of the nuclear sector across local communities and the value chain. They often support local initiatives such as STEM education programs, robotics teams, Girls Who Code, Big Brothers Big Sisters, school and community fundraising efforts, and Habitat for Humanity builds in partnership with the Chippewas of Nawash Unceded First Nation.
Image Source: Nuclear Promise X
Teeswater Concrete
Teeswater Concrete is a family-owned ready-mix concrete and aggregates company that has served the region since 1977. The company’s head office is located in Teeswater, with a ready-mix concrete plant near Tiverton that supplies Bruce Power as well as commercial and residential construction projects, supporting infrastructure development across the region.
Bruce Power’s long-term presence is a critical factor in Teeswater Concrete’s business stability and planning horizon. The continued operation of the Tiverton plant is largely tied to its proximity to Bruce Power and the demand generated by station refurbishment, upgrades, and long-term projects.
Without this anchor customer and its commitment to regional suppliers, the company’s Tiverton facility would face greater uncertainty. Bruce Power’s consistent investment provides the confidence needed for the company to reinvest in its equipment, operations, and workforce well into the future.
The local nuclear economy has also influenced capital investment and hiring decisions. To meet the technical and logistical requirements of servicing a nuclear facility, the company has expanded its truck fleet and quality control capacity, including hiring additional personnel and dedicating its most experienced concrete expert to manage Bruce Power specifications and coordinate with nuclear contractors. Recent upgrades to the Tiverton facility – representing multi-million-dollar investments –have ensured the plant can continue to meet the high standards and reliability requirements for nuclear projects.
Looking ahead, the potential Bruce C Project is a key factor in Teeswater Concrete’s future expansion plans. The company is currently zoning land for a possible new head office and stateof-the-art ready-mix concrete plant, which could represent an estimated $10 to $15 million investment if the project proceeds.
Bruce Power’s influence extends beyond direct project work to the wider regional economy that underpins demand for products supplied by organizations like Teeswater Concrete. Secure, wellpaying jobs at the nuclear site support local housing construction, infrastructure development, and commercial growth, all of which rely on concrete and aggregates and drive demand for Teeswater Concrete’s services. This broader economic activity also benefits the company’s other operations in Arthur, Brunner, Brussels, Clinton, Hanover and Teeswater, where increased regional demand creates additional work opportunities for staff and supports continued business activity across multiple locations.
Image Source: Teeswater Concrete
West Coast Catering
West Coast Catering is a locally owned catering and food production company that has operated in the region since 2019, providing corporate and institutional catering, grab-and-go meals, and frozen prepared meals distributed directly and through regional retail partners. The company employs 36 staff, with additional seasonal employees, and is located near the Bruce site, allowing it to deliver consistent, high-frequency service to Bruce Power and affiliated organizations.
Bruce Power’s long-term presence has been central to West Coast Catering’s ability to plan and invest with confidence. The stable employment base, rotating shift schedules, and multi-decade outlook of the nuclear sector align with the company’s strategy of building a scalable, year-round operation, supporting investments in infrastructure, food safety and production systems, and staffing models designed for continuous service.
The predictable demand generated by the local nuclear economy has also shaped West Coast Catering’s production capacity, equipment, and workforce development. The company has expanded kitchen capabilities, strengthened logistics and delivery systems, and developed standardized meal programs tailored to shift workers, emphasizing convenience, nutrition, and reliability.
Bruce Power’s presence also contributes to West Coast Catering’s talent attraction and retention, with many of its employees coming from local households connected to the nuclear sector. The company and its sister business, George’s on Harbour, a fine dining establishment for the last 3 years, offer additional employment and leadership opportunities that complement employment in the energy sector and help attract and retain families in the region.
Today, Bruce Power represents a significant and steady source of demand for West Coast Catering, particularly in supporting a large, shift-based workforce. Looking ahead, the company is planning
for continued growth tied to future nuclear development, including potentially the proposed Bruce C Project, reinforcing the link between a stable nuclear employer and a vibrant local hospitality sector.
Image Source: West Coast Catering
Kinectrics
Kinectrics, a division of BWX Technologies Inc., provides engineering, testing, inspection, and certification services to the electricity sector, supported by a global workforce of more than 1,300 technical experts. The company supports utilities across the full asset lifecycle, from design and testing to operation and maintenance, with a broad portfolio of specialized nuclear services. This portfolio spans over 70 specialized services, including research and development, feasibility and optioneering, design and engineering, nuclear safety and licensing, lifecycle management, field services, medical isotopes, radioactive laundry services, and waste management.
Kinectrics has steadily expanded its footprint in Bruce County over the past decade, growing from approximately 140 employees in 2017 to approximately 270 staff by 2025. This growth has been supported by investments in multiple local facilities, including the Ontario Nuclear Services Facility in Tiverton and a nuclear personal protective equipment (PPE) laundry and manufacturing operation in Teeswater, creating a fully integrated Canadian cluster of nuclear service capabilities in close proximity to the Bruce Power site.
In total, Kinectrics has invested more than $50 million in Bruce County, with facilities in Kincardine, Tiverton, and Teeswater supporting operations at Bruce Power and upwards of 300 staff now based in the county. The company’s proximity to the site reinforces its close operational alignment with Bruce Power’s ongoing and long-term needs.
Bruce Power has been a critical client for decades, providing a steady flow of work that has enabled Kinectrics to expand capabilities, invest in specialized facilities, and maintain high levels of employment in the region. Many of the company’s local facilities have been developed specifically to support Bruce Power’s longterm operations, refurbishment programs, and innovation initiatives.
A long-term Master Service Agreement signed in 2024, valued at approximately $2.5 billion over ten years, further strengthens this relationship by providing revenue stability and supporting continued investment in research, innovation, and regional infrastructure.
Kinectrics has also made high-impact, targeted investments in areas such as medical isotope production and nuclear services infrastructure, including over $100 million with partners in the Isotope Production Delivery System to enable the production of Lutetuim-177, a cancer-fighting medical isotope.
Beyond commercial activity, Kinectrics has contributed to local communities and Indigenous partnerships, with financial support for the Saugeen Ojibway Nation and regional healthcare initiatives.
This long-standing partnership with Bruce Power is at the core of Kinectrics’ presence in Ontario’s Clean Energy Frontier region, supporting a wide range of services and hundreds of skilled jobs. Together, they strengthen Canada’s leadership and expertise in nuclear technology and medical isotope supply chains that are increasingly being applied to other utilities and international nuclear markets.
Image Source: Kinectrics
CONCLUSION
Ontario’s nuclear sector is foundational to the province’s electricity system today, and even more important to meeting our future energy demands.
Nuclear generation currently provides more than half of Ontario’s electricity supply and plays a critical role in the province’s ability to deliver reliable, low-carbon baseload power that supports economic activity across regions and sectors.
Looking ahead, provincial planning frameworks emphasize the importance of nuclear refurbishment, new generation capacity, and emerging nuclear technologies to meet projected increases in electricity demand.
With decades of history, combined with a mature, vast, and deeply integrated supply chain network, a growing nuclear sector positions the province well as it prepares for population growth, growing electrification, and the need and opportunity to build Ontario’s competitive advantages in a shifting global landscape.
Image Source: Bruce Power
APPENDIX A:
Summary of Total Impacts – All Phases
Summary of Total Impacts – Operations Phase
APPENDIX B:
DATA
AND METHODOLOGY
The economic impact assessment estimates the direct, indirect, and induced (as defined in Appendix C) economic and fiscal impacts resulting from capital and operation expenditures during the site preparation and construction phase, as well as the operations phase of the proposed Bruce C Project in the Municipality of Kincardine, Ontario, located within the Territory of the Saugeen Ojibway Nation. Results are disaggregated across industries and multiple geographic levels, including national (Canada), provincial (Ontario), regional (the Clean Energy Frontier comprised of Bruce, Grey, and Huron counties), and local (Kincardine and Saugeen Shores).
The overall modelling approach involved:
• Using direct impact estimates for jobs, salaries, and costs provided by Bruce Power and based on the Project’s development plan;
• Calculating all multipliers based on project expenses. Unless noted otherwise, any output generated from the proposed Project was not included in these calculations;
• Estimating the total project value based on an average value-per-megawatt figure from other large nuclear projects in comparable jurisdictions as benchmarks, while remaining independent of a particular technology. Selected projects used for benchmarking were those that have either been constructed or proposed in recent years and included the following considerations for comparability:
o A similar policy and regulatory environment to the province of Ontario;
o An expansion of an existing nuclear site – to avoid costs associated with establishing a new site;
o Similar in scale to the Bruce C Project capacity (4,800MW); and,
o Completed or undertaken cost analysis (for proposed projects) within the past 5 years.
• Estimating indirect impacts by generating a baseline product and service use matrix for nuclear electricity generation by matching historic electricity capacity and construction with data in Statistics Canada’s supply-use tables for construction and operations. This helped develop input values for engineering and procurement services, various potential operational and technological profiles, machinery and equipment, and other capital expenditures related to construction, commissioning, operations, maintenance, and safe storage;
• Generating an expenditure matrix to align with the proposed Project’s expenditure categories in available models from Bruce Power’s project development plan. This was used to create a detailed distribution matrix of industry impacts at the national and provincial levels;
• Estimating induced impacts by identifying the supplier industry mix derived from the distribution of Canada’s and Ontario’s average consumer consumption as defined in Statistics Canada’s symmetric input-output tables;
• Estimating economic impacts for the Project’s site preparation and construction phase and for each modelled operational approach. Results for the operations phase in the economic impact assessment are calculated as the average of impacts to ensure projected impacts are technology-agnostic;
• Using 2021 Canadian dollars to measure all dollar values. All multiplier, input-output, and other statistical tables are drawn from 2021 Statistics Canada data. This data was influenced by the COVID-19 pandemic recession and may impact some results;
• Estimating income taxes based on the mean effective tax rate for the average labour income for each direct, indirect, and induced industry supplying modelled input products and services;
• Estimating corporate taxes based on the average national corporate tax rate for each direct, indirect, and induced industry, and the distribution of corporate income in industries supplying input products and services; and,
• Accounting for the various types of tax flows that are disproportionate across jurisdictions, with the federal government earning a greater share of income taxes, Ontario’s provincial government taking a larger share of fuel and sales taxes, and municipal governments largely depending on property taxes.
Localizing the modelling approach involved:
• Defining the regional study area to include Bruce, Grey, and Huron counties and the local study area to include the Municipality of Kincardine and the Town of Saugeen Shores. Regional and local impacts were disaggregated from Statistics Canada’s Economic Region of Stratford-Bruce Peninsula using local census subdivisions;
• Estimating detailed (4-digit) industry workforces for each census subdivision in the Clean Energy Frontier region based on the 2021 Census and filings in the 2021 Canada Business Registry;
• Estimating regional shares using a base analysis, which compares the industries in the region to the province as a whole and matches local specialization to the goods and services demands of the Project. This allows for determining the benefits accrued to the local municipalities of the Bruce Power site and surrounding region, estimating the share of economic activity that utilizes local businesses and residents, and ensuring these shares are based on local supply chain and labour supply needs/capacity;
• Matching overall regional multipliers to existing supplier industries in each community to create a reasonable distribution of regional economic participation;
• Estimating the local share of indirect and induced economic activity using a simple gravity model to account for proximity to the Project’s site increasing the likelihood of local economic participation and activity. The model was used to develop a distance discount for each county within the Clean Energy Frontier region; and,
• Leveraging municipal-level multipliers, including from Statistics Canada, and provincial averages to estimate municipal taxes on production, thereby connecting employment and economic activity to secondary effects of higher property taxes.11 Property taxes were calculated based on those typical of Ontario electricity distribution and generation utilities.
11 Individual municipalities can set tax rates outside of this average.
APPENDIX C:
GLOSSARY OF TERMS
Direct Effects: Economic impacts or contributions that arise immediately from project-related spending. For instance, during the site preparation and construction phase, most direct effects would occur within the construction industry, while in the operation and maintenance phase, they would be concentrated in the electric utilities sector.
Indirect Effects: Economic impacts or contributions generated through the Project’s supply chain. These reflect the demand for intermediate goods and services needed to support direct spending. For example, engineering services, construction materials, and other inputs that are needed to support construction activity.
Induced Effects: Economic impacts or contributions resulting from the household spending of wages earned through both direct and indirect employment. In this way, income generated by the Project circulates back into the broader economy through everyday purchases, generally occurring in consumer-oriented industries like retail.
Input-Output Multipliers: Numerical factors derived from input-output models that estimate how changes in one part of the economy ripple through to others. They measure the total economic impact (direct, indirect, and induced) that results from an initial change in spending, output, or employment in a given industry. For example, a multiplier can show how $1 million of new spending in construction leads not only to direct activity in construction, but also to additional demand in supplier industries (indirect effects) and further household spending from wages earned (induced effects).
Taxes on Products: Compulsory levies that are payable on goods and services as indirect taxes at the point of production, sale, or import, irrespective of the producer’s profitability. In Ontario, this predominantly includes the Harmonized Sales Tax (HST), which combines the federal Goods and Services Tax (GST) with the Provincial Sales Tax (PST) and fuel taxes. Taxes on products differ from those on production in that they are tied to market transactions rather than earnings or ownership of assets.
Taxes on Production: Compulsory payments that businesses must make as a condition of engaging in production, regardless of how much they produce or sell. Unlike taxes on products, they are not tied to specific transactions or units of output. Instead, they are levied on the ongoing use of labour, land, capital, or business operations. Direct taxes on production typically refer to taxes on income. Indirect taxes on production include municipal property taxes (commercial and residential), licence fees, and payroll taxes that are levied as a cost of general operations.
Upstream Effects: Economic effects in sectors that supply the intermediate goods and services required by the subject sector where initial (direct) spending took place. These are observed as indirect impacts.
DISCLAIMER
This independent, commissioned report (“Report”) was prepared solely for the purposes specified herein and is not to be used by any other party or for any other purposes without the prior consent of the OCC.
All forward-looking figures and statements apply only as of the date of this document. They are subject to change and update as the Project’s assessment, measured impacts, and development progress. The outlined findings are based on independent modelling conducted by Prism Economics and Analysis Inc.
This Report reflects only the findings of the Ontario Chamber of Commerce, Nuclear Innovation Institute, and Prism Economics and Analysis Inc., and does not reflect the views of Bruce Power. Neither Bruce Power nor its employees make any warranty, express or implied, or assumes any legal liability or responsibility for the accuracy or completeness of any information contained in this document or process described herein and assumes no responsibility for anyone’s use of the information. Bruce Power is not responsible for errors or omissions in this Report and makes no representations as to the accuracy or completeness of the information.
Assumptions and Limitations:
The Report relies on data and information obtained from primary and secondary sources. Though every effort is made to validate the accuracy of modelling and qualitative analyses, results may be limited by the accuracy of inputs.
The data, information, and conclusions contained in the Report:
• May be based on information provided to the OCC and not independently verified;
• Assume site preparations for the Bruce C Project would begin in 2028, if approved, and an estimated 82-year lifespan;
• Do not account for any potential delays in the Project timeline;
• Inform an economic impact assessment that does not estimate other potential downstream effects, including socio-economic impacts, and impacts associated with environmental stewardship and/or ecosystem services;
• Have not been updated since the Report’s date of publication, and their accuracy is limited to the circumstances and period in which they were processed, collected, and made;
• Should not be used or read out of context and must be read as a whole; and,
• Were prepared solely for the purpose expressed in the Preface.
The OCC is not responsible for any inaccuracies contained in the data and information provided to the OCC or any circumstances or events that may have taken place since the date on which the Report was prepared.
Any use of this Report is subject to this Disclaimer. Any damages arising from its improper use or parts thereof shall be borne by the party making such use. This Disclaimer is attached to and forms part of the Report.
ENDNOTES
i Supply Mix and Generation
ii https://www.cer-rec.gc.ca/en/data-analysis/energy-markets/province-territory-energy-profiles/ontario.html
iii https://www.ieso.ca/Sector-Participants/Planning-and-Forecasting/Annual-Planning-Outlook
iv https://www.ontario.ca/files/2025-07/mem-energy-for-generations-en-2025-07-18.pdf
v https://www.ontario.ca/files/2025-07/mem-energy-for-generations-en-2025-07-18.pdf
vi https://www.cer-rec.gc.ca/en/data-analysis/energy-markets/province-territory-energy-profiles/ontario.html
vii https://www.ieso.ca/Learn/Ontario-Electricity-Grid/Supply-Mix-and-Generation
viii https://www.ieso.ca/en/power-data/supply-overview/transmission-connected-generation
ix https://www.brucepower.com/become-a-supplier/clean-energy-frontier/
x https://occ.ca/wp-content/uploads/2019.03-OCC-Bruce-Power-Report-Final_Digital.pdf
xi https://occ.ca/wp-content/uploads/2019.03-OCC-Bruce-Power-Report-Final_Digital.pdf
xii https://www.brucecounty.on.ca/sites/default/files/file-upload/business/5-nuclear_economic_development_and_innovation_initiative.pdf
xiii https://www.ieso.ca/Sector-Participants/Planning-and-Forecasting/Annual-Planning-Outlook
xiv https://www.ontario.ca/files/2025-07/mem-energy-for-generations-en-2025-07-18.pdf
xv https://cna.ca/2025/06/18/nuclear-power-central-to-ontarios-2025-energy-plan/
xvi https://iaac-aeic.gc.ca/050/evaluations/proj/88771?culture=en-CA
xvii https://iaac-aeic.gc.ca/050/documents/p88771/165368E.pdf